Embed Size (px)
Citation preview

ICICI Prudential
Midcap 150 ETF
(An open-ended Index Exchange Traded Fund tracking
Nifty Midcap 150 Index)

What is an ETF?
Equity ETFs Debt ETFs Commodity ETFs
Like an index fund
• Tracks an index
• Open ended mutual fund scheme
• Lower expense ratio compared to actively managed schemes
• Lower turnover and higher transparency as compared to
actively managed schemes
Like a stock
• Intraday trading on the exchange
• Real time prices
• Put limit orders
• Minimum trading lot - 1 unit on the exchange
• Mandatory delivery into your Demat account
ETFs are generally passively managed mutual fund schemes tracking a benchmark index and reflect the performance of
that index.
The common types of ETFs are as under:
2

What are the benefits offered by ETFs?
Low cost as
compared to
actively managed
mutual fund
schemes
Trading at real
time NAV
Transparency
in holdings
and price
Adequate liquidity
with AMC and on
stock exchange
Provides
diversification
benefits
Index is based on
research and back
tested data
Periodic
portfolio
rebalancing
3

Growth of Global ETFs
Assets under Management (AUM)
of ETFs across the globe has
grown exponentially from $453 bn
in 2005 to $5,955 bn in November
2019 – a CAGR of ~20%
In the above chart, bars represent AUM and the line represents number of ETFs.
Data Source: www.etfgi.com. Data as on November 2019.
4

Growth of ETFs in India
Data Source: MFI Explorer, Data as November 30, 2019. EPFO: Employee Provident Fund Organisation.
MFI Explorer is a tool provided by ICRA Online Ltd. For their standard disclaimer please visit http://www.icraonline.com/legal/standard-disclaimer.html
• Indian ETF industry has seen rapid growth in last 3 years.
• Recent investments in ETFs:
EPFO’s apex decision making body is considering to increase investments in equity ETFs to 15% of the investible deposits. The major contribution
towards AUM of ETFs is by EPFO.
5
0
20000
40000
60000
80000
100000
120000
140000
160000
180000
Nov-0
9
Feb-10
May-10
Aug-10
Nov-1
0
Feb-11
May-11
Aug-11
Nov-1
1
Feb-12
May-12
Aug-12
Nov-1
2
Feb-13
May-13
Aug-13
Nov-1
3
Feb-14
May-14
Aug-14
Nov-1
4
Feb-15
May-15
Aug-15
Nov-15
Feb-16
May-16
Aug-16
Nov-1
6
Feb-17
May-17
Aug-17
Nov-1
7
Feb-18
May-18
Aug-18
Nov-1
8
Feb-19
May-19
Aug-19
Nov-1
9
Rs.in
cro
res

Nifty Midcap 150 Index
Top 10 Index Constituents:
Securities Weightage
Info Edge (India) Ltd. 1.95%
Federal Bank Ltd. 1.94%
City Union Bank Ltd. 1.90%
RBL Bank Ltd. 1.80%
Voltas Ltd. 1.69%
Indraprastha Gas Ltd. 1.65%
AU Small Finance Bank Ltd. 1.61%
Apollo Hospitals Enterprise Ltd. 1.53%
MRF Ltd. 1.52%
Tata Global Beverages Ltd. 1.48%
Above index constituents and statistics are as on Dec 31, 2019. Data source: www.nseindia.com.
The sector(s)/stock(s) mentioned in this document do not constitute any recommendation of the same and ICICI Prudential Mutual Fund may or may not have any future positions in the sector(s)/stock(s).
• Represents the next 150 companies (ranked 101-250) based on full market capitalisation from Nifty 500 Index
• Index is computed using free float market capitalisation method
• Index is re-balanced on semi-annual basis i.e. January and July
6
Diverse Sectoral Allocation:
0 5 10 15 20 25 30
Telecom
Media & Entertainment
Textiles
Metals
Cement
Fertilisers & Pesticides
Chemicals
Services
Healthcare Services
Construction
IT
Automobile
Pharma
Energy
Industrial Manufacturing
Consumer Goods
Financial Services

Nifty Midcap 150 Index Past Performance
Nifty Midcap 150 Index has outperformed the broad market indices over the long run
Data as on Dec 31, 2019. Data source: MFI Explorer. Figures in the chart are rebased to 100. Past performance may or may not be sustained in the future. The Total Return Variant of the Index has been used. The performance
figures pertain to the Index and do not in any manner indicate the returns/performance of the Scheme.
MFI Explorer is a tool provided by ICRA Online Ltd. For their standard disclaimer please visit http://www.icraonline.com/legal/standard-disclaimer.html
Rebased t
o R
s.1
00
7
0.00
50.00
100.00
150.00
200.00
250.00
300.00
350.00
400.00
Dec-09
Apr-10
Aug-10
Dec-10
Apr-11
Aug-11
Dec-11
Apr-12
Aug-12
Dec-12
Apr-13
Aug-13
Dec-13
Apr-14
Aug-14
Dec-14
Apr-15
Aug-15
Dec-15
Apr-16
Aug-16
Dec-16
Apr-17
Aug-17
Dec-17
Apr-18
Aug-18
Dec-18
Apr-19
Aug-19
Dec-19
Nifty 50 TRI Nifty 500 TRI Nifty Midcap 150 TRI
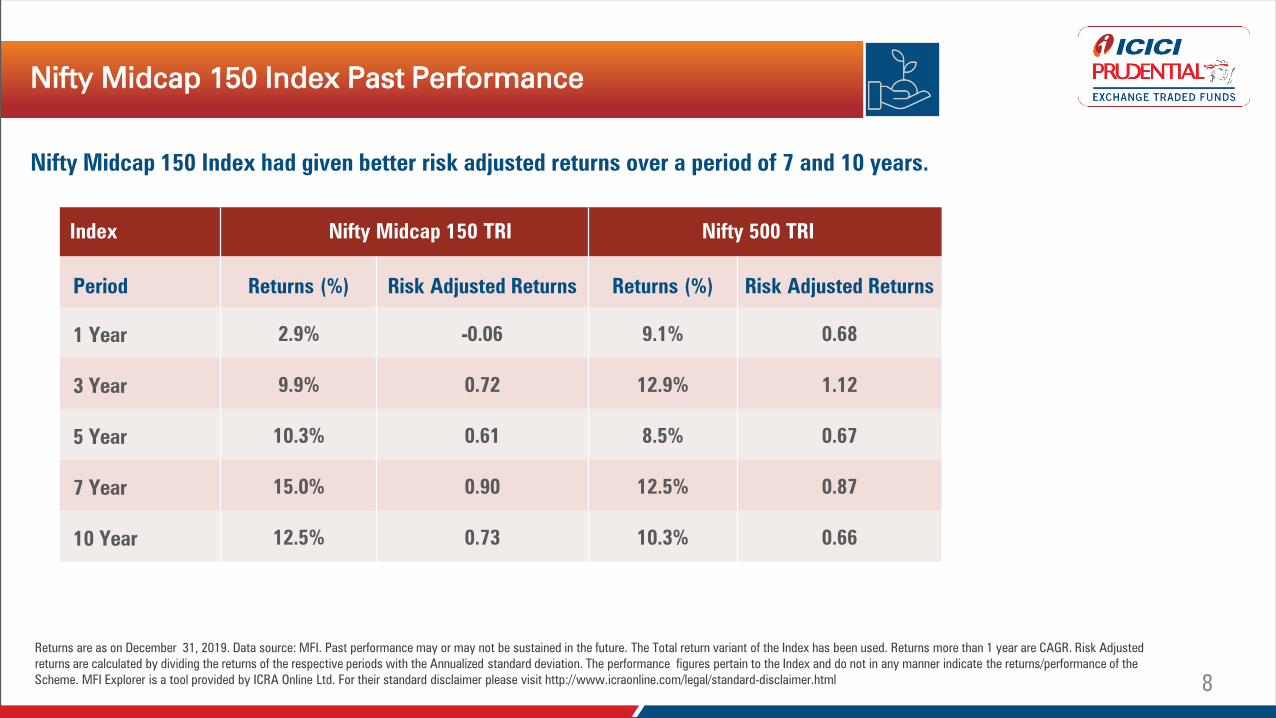
Nifty Midcap 150 Index Past Performance
Nifty Midcap 150 Index had given better risk adjusted returns over a period of 7 and 10 years.
Index Nifty Midcap 150 TRI Nifty 500 TRI
Period Returns (%) Risk Adjusted Returns Returns (%) Risk Adjusted Returns
1 Year 2.9% -0.06 9.1% 0.68
3 Year 9.9% 0.72 12.9% 1.12
5 Year 10.3% 0.61 8.5% 0.67
7 Year 15.0% 0.90 12.5% 0.87
10 Year 12.5% 0.73 10.3% 0.66
Returns are as on December 31, 2019. Data source: MFI. Past performance may or may not be sustained in the future. The Total return variant of the Index has been used. Returns more than 1 year are CAGR. Risk Adjusted
returns are calculated by dividing the returns of the respective periods with the Annualized standard deviation. The performance figures pertain to the Index and do not in any manner indicate the returns/performance of the
Scheme. MFI Explorer is a tool provided by ICRA Online Ltd. For their standard disclaimer please visit http://www.icraonline.com/legal/standard-disclaimer.html 8

Valuation: Large caps and Midcaps
Data as on December 31, 2019. Source : Nseindia.com
9
Pric
e t
o E
arnin
gs R
atio
of
the indic
es
Since the historic divergence in 2017, the valuation gap has narrowed and converged, providing an attractive entry point for
allocation to midcaps
0
10
20
30
40
50
60
Dec-09
Jun-10
Dec-10
Jun-11
Dec-11
Jun-12
Dec-12
Jun-13
Dec-13
Jun-14
Dec-14
Jun-15
Dec-15
Jun-16
Dec-16
Jun-17
Dec-17
Jun-18
Dec-18
Jun-19
Dec-19
Nifty 100 P/E Nifty Midcap 150 P/E
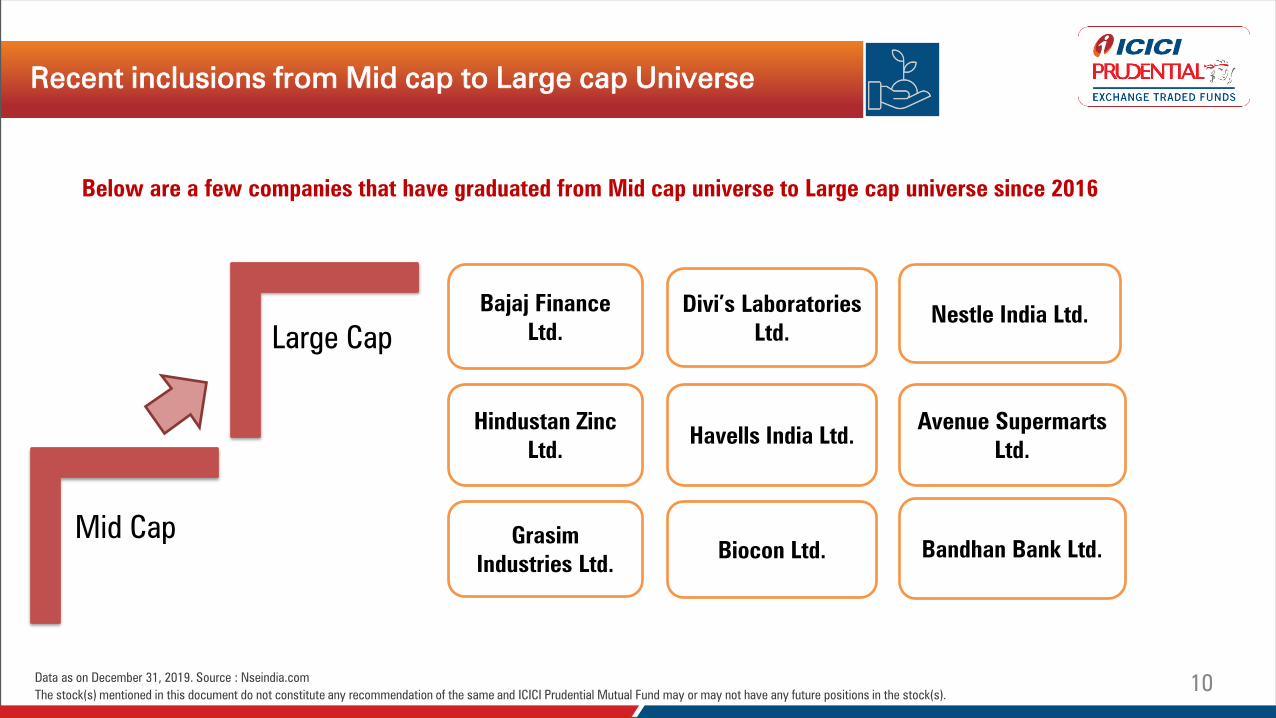
Recent inclusions from Mid cap to Large cap Universe
Data as on December 31, 2019. Source : Nseindia.com
The stock(s) mentioned in this document do not constitute any recommendation of the same and ICICI Prudential Mutual Fund may or may not have any future positions in the stock(s). 10
Below are a few companies that have graduated from Mid cap universe to Large cap universe since 2016
Mid Cap
Large Cap
Havells India Ltd.
Grasim
Industries Ltd. Biocon Ltd.
Avenue Supermarts
Ltd.
Bajaj Finance
Ltd.
Hindustan Zinc
Ltd.
Nestle India Ltd. Divi’s Laboratories
Ltd.
Bandhan Bank Ltd.
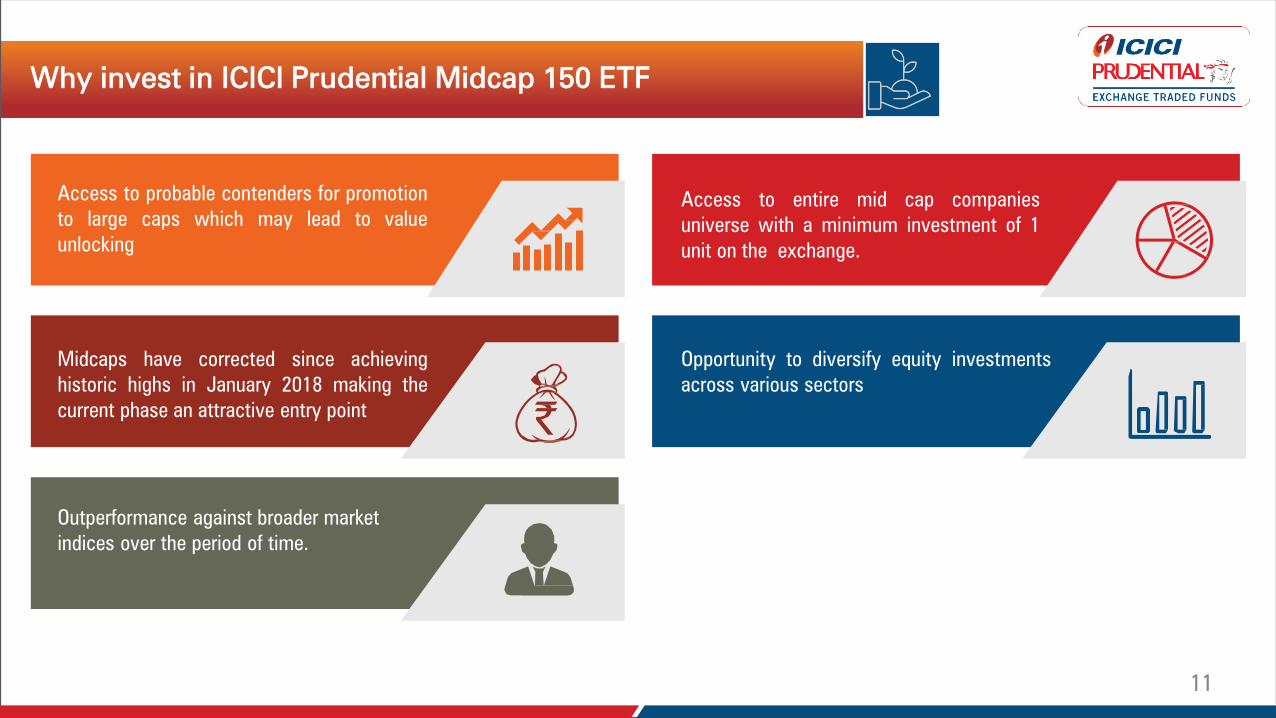
Why invest in ICICI Prudential Midcap 150 ETF
Access to probable contenders for promotion
to large caps which may lead to value
unlocking
Midcaps have corrected since achieving
historic highs in January 2018 making the
current phase an attractive entry point
Outperformance against broader market
indices over the period of time.
Access to entire mid cap companies
universe with a minimum investment of 1
unit on the exchange.
Opportunity to diversify equity investments
across various sectors
11

ICICI Prudential Midcap 150 ETF
NFO Period January 15, 2020 – January 20, 2020
RTGS and transfer cheques Till end of business hours on January 20, 2020
Switches Switches are not allowed
Minimum Application Amount during the NFO Rs.5,000/- (plus in multiple of Re.1 thereafter)
Benchmark Nifty Midcap 150 TRI
Fund Manager Kayzad Eghlim
Basket size^ 35,000 units
Listing Units will be listed on NSE & BSE.
12
^It is applicable post NFO and on investing with AMC directly. It is to be distinctly understood that the permission given by NSE/BSE should not in any way be deemed or construed that the Scheme Information Document (SID) has
been cleared or approved by NSE/BSE nor does it certify the correctness or completeness of any of the contents of the SID. The investors are advised to refer to the SID for the full text of the Disclaimer clause of the NSE/BSE.

Riskometer and Disclaimers
Mutual Fund investments are subject to market risks, read all scheme related documents carefully.
Disclaimer: All figures and data given in the document are dated unless stated otherwise. In the preparation of the material contained in this document, the AMC has used information that is publicly
available, including information developed in-house. Some of the material used in the document may have been obtained from members/persons other than the AMC and/or its affiliates and which may
have been made available to the AMC and/or to its affiliates. Information gathered and material used in this document is believed to be from reliable sources. The AMC however does not warrant the
accuracy, reasonableness and / or completeness of any information. We have included statements / opinions / recommendations in this document, which contain words, or phrases such as “will”,
“expect”, “should”, “believe” and similar expressions or variations of such expressions, that are “forward looking statements”. Actual results may differ materially from those suggested by the forward
looking statements due to risk or uncertainties associated with our expectations with respect to, but not limited to, exposure to market risks, general economic and political conditions in India and
other countries globally, which have an impact on our services and / or investments, the monetary and interest policies of India, inflation, deflation, unanticipated turbulence in interest rates, foreign
exchange rates, equity prices or other rates or prices etc.
The AMC (including its affiliates), the Mutual Fund, the trust and any of its officers, directors, personnel and employees, shall not liable for any loss, damage of any nature, including but not limited to
direct, indirect, punitive, special, exemplary, consequential, as also any loss of profit in any way arising from the use of this material in any manner. The recipient alone shall be fully responsible/are liable
for any decision taken on this material.
Investors are advised to consult their own legal, tax and financial advisors to determine possible tax, legal and other financial implication or consequence of subscribing to the units of ICICI Prudential
Mutual Fund.
• Long Term wealth creation
• An Exchange Traded Fund that aims to provide returns that closely correspond to the returns provided by Nifty Midcap 150 Index,
subject to tracking error.
*Investors should consult their financial advisors if in doubt about whether the product is suitable for them.
ICICI Prudential Midcap 150 ETF is suitable for investors who are seeking:*
Moderate
LOW HIGH
Investors understand
that their principal will
be at moderately high
risk
13