Embed Size (px)
Citation preview

ICNS 2020
The Sixteenth International Conference on Networking and Services
ISBN: 978-1-61208-786-3
September 27th – October 1st, 2020
ICNS 2020 Editors
Eugen Borcoci, University POLITEHNICA Bucharest, Romania
Mary Luz Mouronte López, Universidad Francisco de Vitoria - Madrid, Spain
1 / 81
ICNS 2020
Forward
The Sixteenth International Conference on Networking and Services (ICNS 2020) continueda series of events targeting general networking and services aspects in multi-technologiesenvironments. Ubiquitous services, next generation networks, inter-provider quality of service,GRID networks and services, and emergency services and disaster recovery were alsoconsidered.
IPv6, the Next Generation of the Internet Protocol, has seen over the past yearstremendous activity related to its development, implementation and deployment. Itsimportance is unequivocally recognized by research organizations, businesses and governmentsworldwide. To maintain global competitiveness, governments are mandating, encouraging oractively supporting the adoption of IPv6 to prepare their respective economies for the futurecommunication infrastructures. In the United States, government’s plans to migrate to IPv6 hasstimulated significant interest in the technology and accelerated the adoption process. Businessorganizations are also increasingly mindful of the IPv4 address space depletion and see withinIPv6 a way to solve pressing technical problems. At the same time, the IPv6 technologycontinues to evolve beyond IPv4 capabilities. Communications equipment manufacturers andapplications developers are actively integrating IPv6 in their products based on marketdemands.
IPv6 creates opportunities for new and more scalable IP based services while representinga fertile and growing area of research and technology innovation. The efforts of successfulresearch projects, progressive service providers deploying IPv6 services and enterprises led to asignificant body of knowledge and expertise. It is the goal of this workshop to facilitate thedissemination and exchange of technology and deployment related information, to provide aforum where academia and industry can share ideas and experiences in this field that couldaccelerate the adoption of IPv6. The workshop brings together IPv6 research and deploymentexperts that will share their work. The audience will hear the latest technological updates andwill be provided with examples of successful IPv6 deployments; it will be offered an opportunityto learn what to expect from IPv6 and how to prepare for it.
Packet Dynamics refers broadly to measurements, theory and/or models that describe thetime evolution and the associated attributes of packets, flows or streams of packets in anetwork. Factors impacting packet dynamics include cross traffic, architectures of intermediatenodes (e.g., routers, gateways, and firewalls), complex interaction of hardware resources andprotocols at various levels, as well as implementations that often involve competing andconflicting requirements.
Parameters such as packet reordering, delay, jitter and loss that characterize the delivery ofpacket streams are at times highly correlated. Load-balancing at an intermediate node may, forexample, result in out-of-order arrivals and excessive jitter, and network congestion maymanifest as packet losses or large jitter. Out-of-order arrivals, losses, and jitter in turn may leadto unnecessary retransmissions in TCP or loss of voice quality in VoIP.
2 / 81

With the growth of the Internet in size, speed and traffic volume, understanding the impactof underlying network resources and protocols on packet delivery and application performancehas assumed a critical importance. Measurements and models explaining the variation andinterdependence of delivery characteristics are crucial not only for efficient operation ofnetworks and network diagnosis, but also for developing solutions for future networks.
Local and global scheduling and heavy resource sharing are main features carried by Gridnetworks. Grids offer a uniform interface to a distributed collection of heterogeneouscomputational, storage and network resources. Most current operational Grids are dedicatedto a limited set of computationally and/or data intensive scientific problems.
Optical burst switching enables these features while offering the necessary networkflexibility demanded by future Grid applications. Currently ongoing research and achievementsrefers to high performance and computability in Grid networks. However, the communicationand computation mechanisms for Grid applications require further development, deploymentand validation.
We take here the opportunity to warmly thank all the members of the ICNS 2020 technicalprogram committee, as well as all the reviewers. The creation of such a high quality conferenceprogram would not have been possible without their involvement. We also kindly thank all theauthors who dedicated much of their time and effort to contribute to ICNS 2020. We trulybelieve that, thanks to all these efforts, the final conference program consisted of top qualitycontributions. We also thank the members of the ICNS 2020 organizing committee for theirhelp in handling the logistics of this event.
ICNS 2020 Chairs
ICNS 2020 Steering CommitteeEugen Borcoci, University "Politehnica" of Bucharest (UPB), RomaniaMary Luz Mouronte López, Universidad Francisco de Vitoria – Madrid, SpainCarlos Becker Westphall, Federal University of Santa Catarina, BrazilJeff Sedayao, Intel Corporation, USAAlex Sim, Lawrence Berkeley National Laboratory, USAJuraj Giertl, T-Systems, SlovakiaIvan Ganchev, University of Limerick, Ireland, Plovdiv University "Paisii Hilendarski", Bulgaria
ICNS 2020 Publicity ChairJoseyda Jaqueline More, Universitat Politecnica de Valencia, SpainMarta Botella-Campos, Universitat Politecnica de Valencia, Spain
ICNS 2020 Industry/Research Advisory CommitteeSteffen Fries, Siemens, GermanySathiamoorthy Manoharan, University of Auckland, New ZealandMassimo Villari, Universita' di Messina, ItalyÉric Renault, Institut Mines-Télécom - Télécom SudParis, FranceYoung-Joo Suh, POSTECH (Pohang University of Science and Technology), Korea
3 / 81

Rui L.A. Aguiar, University of Aveiro, Portugal
4 / 81

ICNS 2020Committee
ICNS 2020 Steering CommitteeEugen Borcoci, University "Politehnica" of Bucharest (UPB), RomaniaMary Luz Mouronte López, Universidad Francisco de Vitoria – Madrid, SpainCarlos Becker Westphall, Federal University of Santa Catarina, BrazilJeff Sedayao, Intel Corporation, USAAlex Sim, Lawrence Berkeley National Laboratory, USAJuraj Giertl, T-Systems, SlovakiaIvan Ganchev, University of Limerick, Ireland, Plovdiv University "Paisii Hilendarski", Bulgaria
ICNS 2020 Publicity ChairJoseyda Jaqueline More, Universitat Politecnica de Valencia, SpainMarta Botella-Campos, Universitat Politecnica de Valencia, Spain
ICNS 2020 Industry/Research Advisory CommitteeSteffen Fries, Siemens, GermanySathiamoorthy Manoharan, University of Auckland, New ZealandMassimo Villari, Universita' di Messina, ItalyÉric Renault, Institut Mines-Télécom - Télécom SudParis, FranceYoung-Joo Suh, POSTECH (Pohang University of Science and Technology), KoreaRui L.A. Aguiar, University of Aveiro, Portugal
ICNS 2020 Technical Program CommitteeAbdelhafid Abouaissa, University of Haute-Alsace, FranceFatemah Alharbi, University of California, Riverside, USA / Taibah University, Yanbu, Saudi ArabiaAdel Alshamrani, University of Jeddah, Saudi ArabiaDelaram Amiri, University of California Irvine, USAPatrick Appiah-Kubi, University of Maryland University College, USAMichael Atighetchi, Raytheon BBN Technologies, USAMuhammed Ali Aydin, Istanbul University - Cerrahpaşa, TurkeyBharath Balasubramanian, ATT Labs Research, USAMohammad M. Banat, Jordan University of Science and Technology, JordanIlija Basicevic, University of Novi Sad, SerbiaRobert Bestak, Czech Technical University in Prague, Czech RepublicHasan Burhan Beytur, Middle East Technical University, TurkeyEugen Borcoci, University "Politehnica" of Bucharest (UPB), RomaniaFernando Boronat Seguí, Universidad Politécnica De Valencia-Campus De Gandia, SpainAbdelmadjid Bouabdallah, Université de Technologie de Compiègne (UTC), FranceChristos Bouras, University of Patras / Computer Technology Institute and Press - Diophantus, GreeceAn Braeken, Vrije Universiteit Brussels (VUB), BelgiumMaria-Dolores Cano, Universidad Politécnica de Cartagena, SpainJosé Cecílio, University of Coimbra, PortugalSubhrendu Chattopadhyay, Indian Institute of Technology Guwahati, Assam, IndiaHao Che, University of Texas at Arlington, USA
5 / 81

Jorge A. Cobb, The University of Texas at Dallas, USAKevin Daimi, University of Detroit Mercy, USAPhilip Davies, Bournemouth University, UKBabu R. Dawadi, Tribhuvan University, NepalEric Diehl, Sony Pictures Entertainment, USAIvanna Dronyuk, Lviv Polytechnic National University, UkrainePengyuan Du, Facebook Inc., USAPeter Edge, Cisco Network Academy Global Advisory Board / Computing and Information TechnologyResearch and Education New Zealand (CITRENZ) / Ara Institute of Canterbury / University of SouthernQueensland (USQ) / Telecommunications Users Association of NZ (TUANZ), New ZealandGledson Elias, Federal University of Paraíba (UFPB), BrazilSai Mounika Errapotu, University of Texas at El Paso, USAReza Fathi, University of Houston, USAOlga Fedevych, Lviv Polytechnic National University, UkraineSteffen Fries, Siemens, GermanyMarco Furini, University of Modena and Reggio Emilia, ItalyIvan Ganchev, University of Limerick, Ireland / Plovdiv University "Paisii Hilendarski", BulgariaJuraj Giertl, T-Systems, SlovakiaZaher Haddad, Al-Aqsa University, Gaza, PalestineEnrique Hernández Orallo, Universidad Politécnica de Valencia, SpainBilal Hussain, Scuola Superiore Sant'Anna, Pisa, ItalyKhondkar R. Islam, George Mason University, USAJacek Izydorczyk, Silesian University of Technology, Gliwice, PolandYiming Ji, Georgia Southern University, USAWenchao Jiang, Singapore University of Technology and Design (SUTD), SingaporeSashidhar Ram Joshi, Tribhuvan University, NepalSokratis K. Katsikas, Center for Cyber & Information Security | Norwegian University of Science &Technology (NTNU), NorwayMaxim Kalinin, Peter the Great St. Petersburg Polytechnic University, RussiaKyungtae Kang, Hanyang University, KoreaPinar Kirci, Istanbul University-Cerrahpasa, TurkeyMasoomeh Javidi Kishi, Lehigh University, USAJerzy Konorski, Gdansk University of Technology, PolandLoïc Lagadec, Ensta Bretagne, FranceMikel Larrea, University of the Basque Country UPV/EHU, SpainYiu-Wing Leung, Hong Kong Baptist University, Kowloon Tong, Hong KongBeibei Li, College of Cybersecurity | Sichuan University, Chengdu, ChinaXin Li, Google, USAQiang Liu, The University of North Carolina at Charlotte, USAZoubir Mammeri, Toulouse University, FranceSathiamoorthy Manoharan, University of Auckland, New ZealandDaniel Marfil, Universidad Politécnica de Valencia, SpainSami Marzook Alesawi, King Abdulaziz University, Rabigh, Saudi ArabiaIvan Mezei, University of Novi Sad, SerbiaMario Montagud, i2CAT Foundation & University of Valencia, SpainHabib Mostafaei, Technical University Berlin, GermanyMary Luz Mouronte López, Higher Polytechnic School | Universidad Francisco de Vitoria - Madrid, SpainGianfranco Nencioni, University of Stavanger, Norway
6 / 81

Boubakr Nour, Beijing Institute of Technology, ChinaSerban Georgica Obreja, University Politehnica Bucharest, RomaniaRuxandra-Florentina Olimid, University of Bucharest, RomaniaP. K. Paul, Raiganj University, IndiaPaulo Pinto, Universidade Nova de Lisboa, PortugalMatin Pirouz, California State University, USAZsolt Alfred Polgar, Technical University of Cluj Napoca, RomaniaCong Pu, Marshall University, Huntington, USATomasz Rak, Rzeszow University of Technology, PolandJiankang Ren, Dalian University of Technology, ChinaÉric Renault, Télécom SudParis | Institut Polytechnique de Paris, FranceSebastian Robitzsch, InterDigital Europe, UKWill Rosenbaum, Max Planck Institute for Informatics, Saarbrücken, GermanyVladimir Rykov,Piples' Friendship University of Russia (RUDN University), RussiaIgnacio Sanchez-Navarro, University of the West of Scotland, UKMeghana N. Satpute, University of Texas at Dallas, USAJeff Sedayao, Intel Corporation, USAPurav Shah, Middlesex University, UKHamid Sharif, University of Nebraska-Lincoln, USAAlex Sim, Lawrence Berkeley National Laboratory, USAMukesh Singhal, University of California, Merced, USAVasco N. G. J. Soares, Instituto de Telecomunicações / Instituto Politécnico de Castelo Branco, PortugalSamy S. Soliman, University of Science and technology - Zewail City of Science and Technology, EgyptJunggab Son, Kennesaw State University (Marietta Campus), USAMhd Tahssin Altabbaa, Istanbul Gelisim University, TurkeyYoshiaki Taniguchi, Kindai University, JapanLuis Tello-Oquendo, Universidad Nacional de Chimborazo, EcuadorGiorgio Terracina, Università della Calabria, ItalySerpil Üstebay, İstanbul Medeniyet University, TurkeyK. Vasudevan, IIT Kanpur, IndiaFerdinand von Tüllenburg, Salzburg Research Forschungsgesellschaft, AustriaCong-Cong Xing, Nicholls State University, USAAnjulata Yadav, Shri G.S. Institution of Technology and Science, Indore, IndiaAnna Zatwarnicka, Opole University of Technology, PolandJustin Zhan, University of Arkansas | College of Medicine - University of Arkansas for Medical Sciences,USAQi Zhao, UCLA, USATao Zheng, Orange Labs China, ChinaYe Zhu, Cleveland State University, USA
7 / 81

Copyright Information
For your reference, this is the text governing the copyright release for material published by IARIA.
The copyright release is a transfer of publication rights, which allows IARIA and its partners to drive the
dissemination of the published material. This allows IARIA to give articles increased visibility via
distribution, inclusion in libraries, and arrangements for submission to indexes.
I, the undersigned, declare that the article is original, and that I represent the authors of this article in
the copyright release matters. If this work has been done as work-for-hire, I have obtained all necessary
clearances to execute a copyright release. I hereby irrevocably transfer exclusive copyright for this
material to IARIA. I give IARIA permission or reproduce the work in any media format such as, but not
limited to, print, digital, or electronic. I give IARIA permission to distribute the materials without
restriction to any institutions or individuals. I give IARIA permission to submit the work for inclusion in
article repositories as IARIA sees fit.
I, the undersigned, declare that to the best of my knowledge, the article is does not contain libelous or
otherwise unlawful contents or invading the right of privacy or infringing on a proprietary right.
Following the copyright release, any circulated version of the article must bear the copyright notice and
any header and footer information that IARIA applies to the published article.
IARIA grants royalty-free permission to the authors to disseminate the work, under the above
provisions, for any academic, commercial, or industrial use. IARIA grants royalty-free permission to any
individuals or institutions to make the article available electronically, online, or in print.
IARIA acknowledges that rights to any algorithm, process, procedure, apparatus, or articles of
manufacture remain with the authors and their employers.
I, the undersigned, understand that IARIA will not be liable, in contract, tort (including, without
limitation, negligence), pre-contract or other representations (other than fraudulent
misrepresentations) or otherwise in connection with the publication of my work.
Exception to the above is made for work-for-hire performed while employed by the government. In that
case, copyright to the material remains with the said government. The rightful owners (authors and
government entity) grant unlimited and unrestricted permission to IARIA, IARIA's contractors, and
IARIA's partners to further distribute the work.
8 / 81
Table of Contents
GuideMe: A Networked Application for Indoor Orientation and GuidanceEirini Barri, Christos Bouras, Apostolos Gkamas, Christina Koulouri, Evangelos Michos, and Spyridon AnicetoKatsampiris Salgado
1
Resource Allocation Mechanism for Massive MIMOChristos Bouras, Vasileios Kokkinos, and Christina Koulouri
7
Text to Speech through Bluetooth for People with Special Needs NavigationEirini Barri, Christos Bouras, Apostolos Gkamas, Christina Koulouri, Evangelos Michos, and Spyridon AnicetoKatsampiris Salgado
13
Calculation of Location Probabilities for Agent-based Target Tracking SystemMasaru Shiozuka, Tappei Yotsumoto, Kenichi Takahashi, Takao Kawamura, and Kazunori Sugahara
19
Dynamic Intrusion Deception in a Cloud EnvironmentChia-Chi Teng, Aaron Cowley, and Russel Havens
26
On Business Models for Vehicle-to-Everything Systems Based on 5G SlicingEugen Borcoci, Marius Vochin, and Serban Obreja
31
Meshed Trees for Resilient Switched NetworksPeter Willis and Nirmala Shenoy
39
An Authentication Technique to Handle DDoS Attacks in Proxy-Based ArchitecturePoonam Dharam and Jarin Musarrat
49
Towards Stable and Hybrid UDP-TCP Relay Routing for Streaming and VoIP ServicesSalim Mohamed and Osama Mohammed
55
Towards Securing Big Data on Software Defined Network: Performance Aware Architecture DesignAhmed Alghamdi
66
Powered by TCPDF (www.tcpdf.org)
1 / 1 9 / 81
GuideMe: A Networked Application for Indoor Orientation and Guidance
Eirini Barri
Department of Computer Engineering and Informatics
University of Patras
Patras, Greece
e-mail: [email protected]
Apostolos Gkamas
University Ecclesiastical Academy of Vella
Ioannina, Greece
e-mail: [email protected]
Evangelos Michos
Department of Computer Engineering and Informatics
University of Patras
Patras, Greece
e-mail: [email protected]
Christos Bouras
Department of Computer Engineering and Informatics
University of Patras
Patras, Greece
e-mail: [email protected]
Christina Koulouri
Department of Computer Engineering and Informatics
University of Patras
Patras, Greece
e-mail: [email protected]
Spyridon Aniceto Katsampiris Salgado
Department of Computer Engineering and Informatics
University of Patras
Patras, Greece
e-mail: [email protected]
Abstract—Today’s indoor navigational systems are more and
more in demand, commonly used for applications such as
smart cities, robots and visually impaired people. As far as
outdoor navigation is concerned, the Global Positioning
System (GPS) technology is still one of the most (if not the
most) commonly used approaches. Even though it is still
considered an ideal solution for navigating in outdoor areas,
challenges and problems arise when GPS is considered for
navigation inside buildings due to obstacles (e.g., shopping
malls, hospitals, etc.) and because signals cannot be absorbed
by the building walls. To tackle the aforementioned issue, other
technologies have emerged aimed at indoor navigation, such as
Wireless-Fidelity (Wi-Fi), Bluetooth and sensors. This paper’s
contribution is towards indoor navigation and, more
specifically, it targets designing and developing a tracking and
navigation system aimed at people that experience difficulties
in indoor orientation using a wearable device. The user takes
direction from the wearable device for the indoor orientation
through voice commands helping him to avoid obstacles. The
central part of the system is a device that provides the ability to
navigate and find a route by voice commands, based on the
device's location and orientation capabilities.
Keywords-GuideMe; indoor navigation; trilateration;
pathfinding; UWB; BLE: people with special needs.
I. INTRODUCTION
Undoubtedly, there is an increasing demand for efficient indoor navigation systems, demand that mainly derives from smart cities, robots and visually impaired people, only to name a few. As far as outdoor navigation and pathfinding are concerned, the Global Positioning System (GPS) is still considered among the most commonly used technologies. Yet, this is only efficiently applicable in outdoor locations, because when indoor navigation comes into play, issues do
rise. Of course, indoor navigation is very important to us and has many applications for humans and robots. Two of the most common issues that arise are a) the fact that physical obstacles inside building cannot be labeled as obstacles from the GPS and b) the fact that signals cannot be absorbed by walls inside buildings. Multiple floors, rooms and obstacles inside each and every indoor area pose a major problem. Additionally, the inability to use the GPS technology inside buildings makes indoor navigation more complicated, for reasons already explained above [1].
On the good side, many recent studies have been and are still conducted in order to make indoor navigation more effective and efficient. The direct need for new applications and technologies that can efficiently tackle such issues can luckily be covered by other available indoor navigation technologies that do exist nowadays, such as Wireless-Fidelity (Wi-Fi), Bluetooth and sensors.
This paper provides the design and development of a tracking and navigation system for people with special needs for indoor locations. In its core, the system consists of a device that provides the ability to navigate and route by voice commands, based on the device's location and orientation capabilities. This device shall be connected to the server via the user's mobile phone (android). The overall system (when completed) will consist of the following components:
• Equipment permanently installed in selected areas. • A cloud server that will synchronize and coordinate
the various parts, store information about the facilities and users, and will be responsible for the accounting and invoicing parts.
• Portable devices. • Software that will run on smartphones.
1Copyright (c) IARIA, 2020. ISBN: 978-1-61208-786-3
ICNS 2020 : The Sixteenth International Conference on Networking and Services
10 / 81
The rest of this paper is organized as follows. Section II describes the motivation behind our work. Section III provides a literature review of other current works on this subject. Section IV addresses the system’s architecture whereas Section V goes into finer details in regard to the proposed algorithms for positioning and navigating in indoor spaces. Finally, Section VI summarizes our main findings and conclusions and suggests probable future work. The acknowledgement and conclusions close the article.
II. MOTIVATION
Blindness is the condition of lacking visual perception due to physiological or neurological factors. Blind people face many problems in everyday life. They always depend on others. They cannot move easily from one place to another without help from others.
According to the World Health Organization, the following are the key facts regarding blindness and vision impairment [2]:
• Globally, at least 2.2 billion people have a vision impairment or blindness, of whom at least 1 billion have a vision impairment that could have been prevented or has yet to be addressed.
• This 1 billion people include those with moderate or severe distance vision impairment or blindness due to unaddressed refractive error, as well as near vision impairment caused by unaddressed presbyopia.
• Globally, the leading causes of vision impairment are uncorrected refractive errors and cataracts.
• The majority of people with vision impairment are over the age of 50 years.
The motivation of the GuideMe project [3] is to provide guidance and security for out-of-home travel. The central part of the system is a portable device that provides the ability to route and navigate by voice commands. The instructions will be based on the device's location and orientation capabilities. The device will be connected to the server via the user's mobile phone. The solution is built around a discreet portable device capable of indoor localization with an accuracy of 10 cm using Ultra-wideband (UWB) technology. The device can also determine the orientation, receive voice commands, and transmit voice instructions.
The motivation of the paper is to improve two areas of social life of the blind people and people with special needs in general: convenience and security. Specifically, with the use of the proposed system, users will feel more comfortable visiting public places, such as airports, shopping malls, stations, etc. as they will be guided by the system to reach their destination. At the same time, in case of emergencies involving both the user (accidents) and the building (fire, earthquake, etc.), the system will inform the users of the exact location of the users, whilst also guiding them to the nearest exit. The ultimate goal is to increase the presence of the population with mobility or other problems in buildings by 20%.
III. RELATED WORK
There are several studies concerning indoor positioning techniques and systems. Previous works focus on the need to study the general way of positioning and then they propose algorithms and methods for indoor positioning. Daramouskas et al. [4] study methods for location estimation on Low Power Wide Area Networks (LPWAN). They also present Multilateration, Trilateration and Particle Swarm Optimization (PSO) algorithm, according to previous research, which constitute the three most commonly used methods to calculate the location of a moving object, based on distance measurements. Choliz et al. [5], gather all existing algorithms for UWB positioning and tracking systems and evaluate the performance in a realistic interior scenario. Next, Krishnaveni et al. [6] present an overview of indoor positioning based on UWB technology.
In the literature on positioning, machine learning algorithms are widely used to estimate position. Some of the machine learning algorithms used in indoor positioning are presented in [7]. Liu et al. [8], present a summary table with a comparison of recent systems and provide solutions about current wireless indoor positioning systems. Α survey of the latest indoor positioning technologies is provided by Alarifi et al. [9], who analyze UWB technologies with an analysis of Strengths, Weaknesses, Opportunities, and Threats (SWOT). Unlike previous studies, Al-Ammar et al. [10] present new taxonomies and review some major recent advances on indoor positioning techniques. Finally, in [11], Mahida et al. deal with various positioning enabled wireless technologies and algorithms used in realistic scenarios to provide indoor navigation.
As far as indoor navigation is concerned, there exists a variety of significant work for people with special needs. More specifically, giving emphasis in works of the last years, we have found several similar approaches. Kishore et al. [12] provided a comprehensive solution for indoor public transport for people with disabilities. Beacons (small low-power devices, which are increasingly gaining recognition and application in malls and airports) were placed indoors and transmitted signals to the cell phone sensors via Bluetooth Low Energy (BLE) technology. Cheraghi et al. [13], BLE beacons-based indoor navigation was developed under the name GuideBeacon, where simulations showed that the GuideBeacon application reduces the time it takes for a disabled person to cross an unknown indoor area by 30%-50% and reduced the required distance they have to walk by at least 50%. Link et al. [14] suggested a system called FootPath, which obtains a geographic map from OpenStreetMap. After downloading the geographic map, the system uses the accelerometer and compass on the user's phone to calculate and detect the user's steps. The results showed that the FootPath system is very accurate to assist users with disabilities and indoors.
Megalingam et al. [15], proposed a system to find the best route for wheelchair users based on minimal changes in direction. The algorithm suggested is called Location-Aware and Remembering Navigation (LARN) and it depends on Dijkstra's algorithm to find the optimal path. The study
2Copyright (c) IARIA, 2020. ISBN: 978-1-61208-786-3
ICNS 2020 : The Sixteenth International Conference on Networking and Services
11 / 81
carried out in [16] introduced a new method for dynamically changing the navigation path indoors. The proposed algorithm was named FPP and combined its internal path information and interior information. The FPP algorithm was compared with those of Dijkstra and Elastic and the results showed that FPP can provide the shortest route for in-house navigation faster than the other two algorithms. Goel, et al. [17], studied indoor navigation in order to reduce the time required for a user to get to its destination, using algorithm A*. The first section of the paper was devoted to a detailed presentation of A* algorithm, while in the second one, the authors successfully demonstrated why the A* algorithm is better than Dijkstra algorithm for indoor navigation with barriers. Comparing A* and Dijkstra for indoor navigation, A* achieves better results through heuristic searches and delivers better results faster.
Following the previous studies, in this section we will present similar projects to GuideMe. Indoo.rs and San Francisco International Airport worked together to create an app for visually impaired passengers. The Entrepreneurship-in-Residence (EIR) project is an Edwin M. Lee collaboration with the White House and other San Francisco business partners. At the beginning of 2014, they chose to help the San Francisco Airport (SFO) create a tool to assist blind and visually impaired travelers [18]. Recommendation ITU-T F.921 [19] sets out how audio-based network navigation systems can be designed to ensure that they are dedicated and responsive to the needs of people with visual impairments. The aim is to provide network visual system designers with the audio data they need in the early stages of development to anticipate and overcome any constraints and obstacles that prevent vision impaired users from making full use of the built environment. The purpose of [20] was to implement a module-based application developed in the context of preliminary projects for the mobile mass market. Through an appropriate user interface that responds to the needs of the visually impaired, the blind user should be able to use public transport independently in a secure manner and navigate complex public transport terminals. The system combines real-time communication to and from public transport vehicles with precise positioning and guidance while it also provides additional navigation assistance.
INK 2016: Indoor Navigation and Communication in ÖPNV for blind and visually impaired people [21] combines real-time communication to and from public transport vehicles with precise positioning and guidance and has additional video call navigation assistance where the person can communicate with a professional operator. Arikovani UK’s WeWalk, Imperial College London, Astra Terra and the Royal National Institute of Blind People (RNIB) will cooperate to mitigate indoor wayfinding challenges by developing an indoor navigation system that is both reliable and fully accessible for visually impaired people and anyone that may struggle to navigate the built environment [22]. Project Ways4all [23] is a new personalized indoor navigation system that can increase public transport accessibility for all passengers and especially the visually impaired, who will be able to access public transport and the necessary up-to-date traffic information in a very simplified
way. Finally, Project “Using An Integrated Techniques for Developing Indoor Navigation Systems to Allow the Blind and Visually Impaired People to Reach Precise Objects” [24] uses a set of different technologies (WIFI, Bluetooth, and RFID) to help the user reach a micro element in the navigated environment. It constitutes an intelligent interface for precise indoor navigation for blind and visually impaired people using a smart phone.
IV. SYSTEM ARCHITECTURE
In this project, the main component is a small wearable that helps in the user’s positioning through UWB technology. This technology provides very accurate positioning, up to 10 cm divergence. This device, apart from the ability to locate the user, can also determine the orientation of the user, receive voice commands, and transmit voice instructions to guide the visually impaired people.
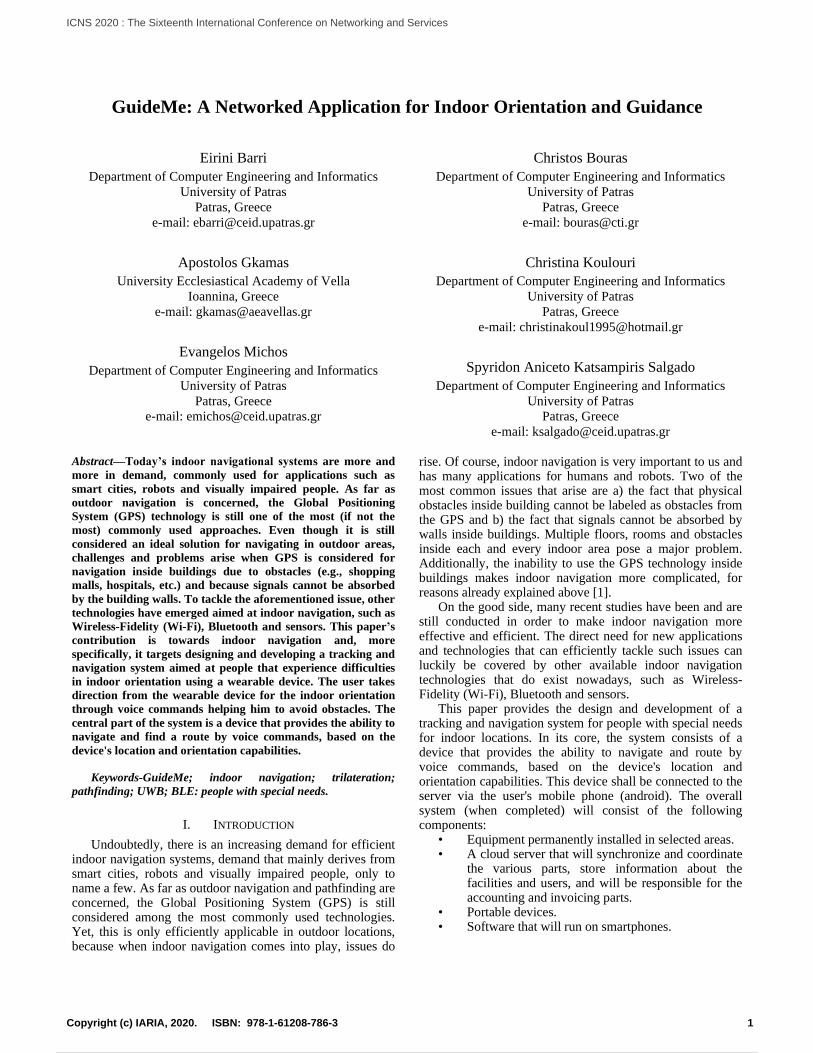
Specifically, as it is shown in Figure 1, in our proposed system, our smart device can communicate to anchors via UWB technology, in order to locate the user. This device has the ability to provide route and navigation information to the user via voice commands. The anchors are calculating and measuring the distance between the user and the anchor. The distance data (between the user and the anchors), is transferred to a local server in order to measure the exact position and run positioning algorithms, that in our case will be trilateration. The positioning algorithms are described in the Section V. Furthermore, there is a remote server that has a map of the building. This remote server, having the details of the building and the position of the user and the destination of the user, can provide guidance to the user by giving directions. The directions are given by the smartphone to the user through wireless headphones, using voice commands.
Figure 1. Overview of the proposed architecture.
As far as the wearable device is concerned, the processor that is chosen is the module made by Econais, the EC32L13 [25]. The EC32L13 is a 32-bit processor of the product family STM32 processors. This processors in this family of processors are energy efficient, in order to expand the battery life. A WiFi module is also integrated into the wearable
3Copyright (c) IARIA, 2020. ISBN: 978-1-61208-786-3
ICNS 2020 : The Sixteenth International Conference on Networking and Services
12 / 81
device. For the connectivity through UWB, we have chosen the module DWM1000 of Decawave.
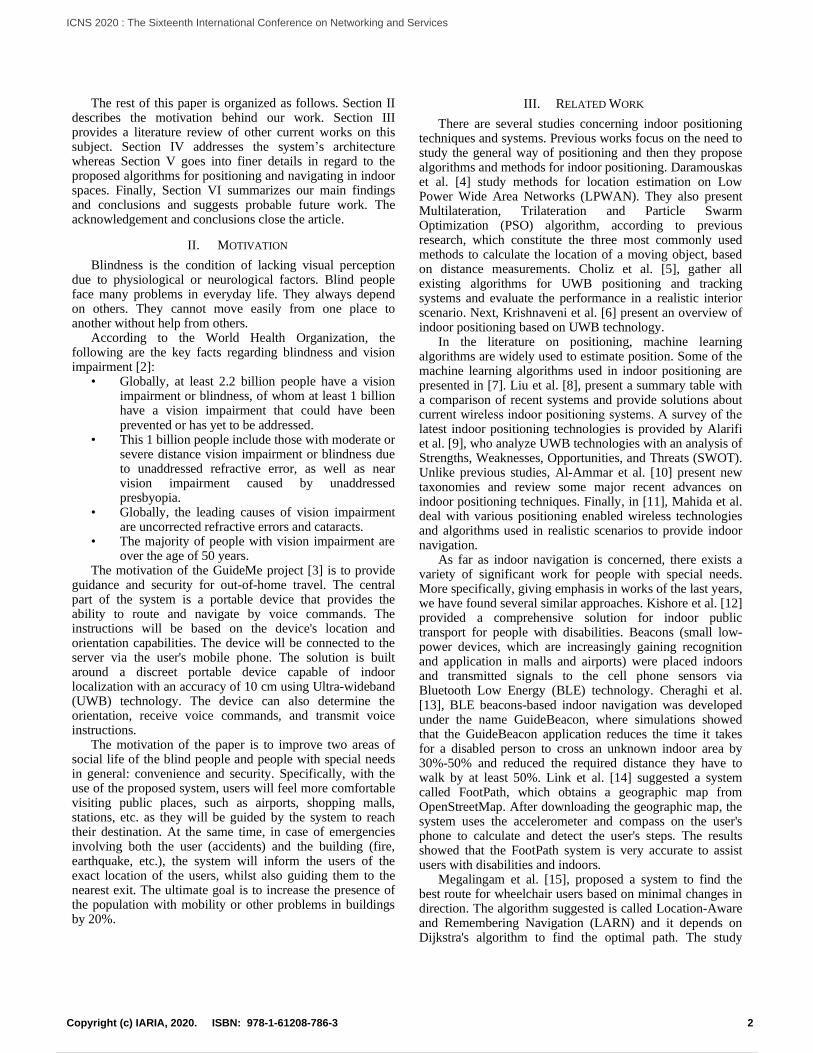
In Figure 2, we present the general architecture of the wearable device. The device consists of some sensors such as, the magnetometer and accelerometer sensors, the UWB module, the WiFi module, the Main Computing Unit, which in our case is the EC32L13 and module for the battery management as well, in order to expand the battery life as long as possible.
Figure 2. Overview of the device's architecture.
V. PROPOSED ALGORITHMS
In this section, we will present our indoor positioning algorithms and the indoor navigation algorithm we used and integrated in our system.
A. Indoor Positioning
As far as indoor positioning is concerned, as part of the GuideMe project, it was decided to implement the trilateration algorithm that combines simple implementation and sufficiently precise positioning beyond the project requirements.
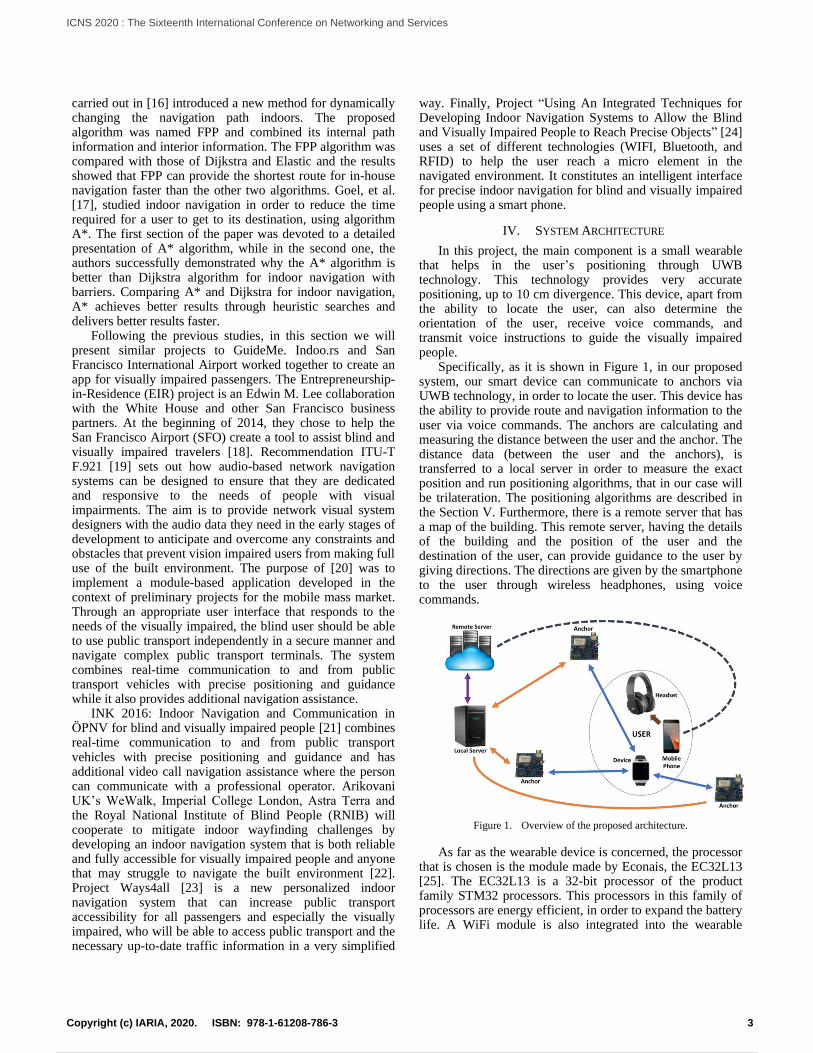
Figure 3. Represenation of trilateration.
The trilateration algorithm is a fairly common and easy to understand algorithm and is used extensively in various applications. Also, the DW 1000 module used in the project supports Time Difference of Arrival (TDoA), a method that gives a very good distance estimation. The high data rate and speed of the UWB can reach 100 Megabits per second (Mbps), which makes it a good solution for indoor
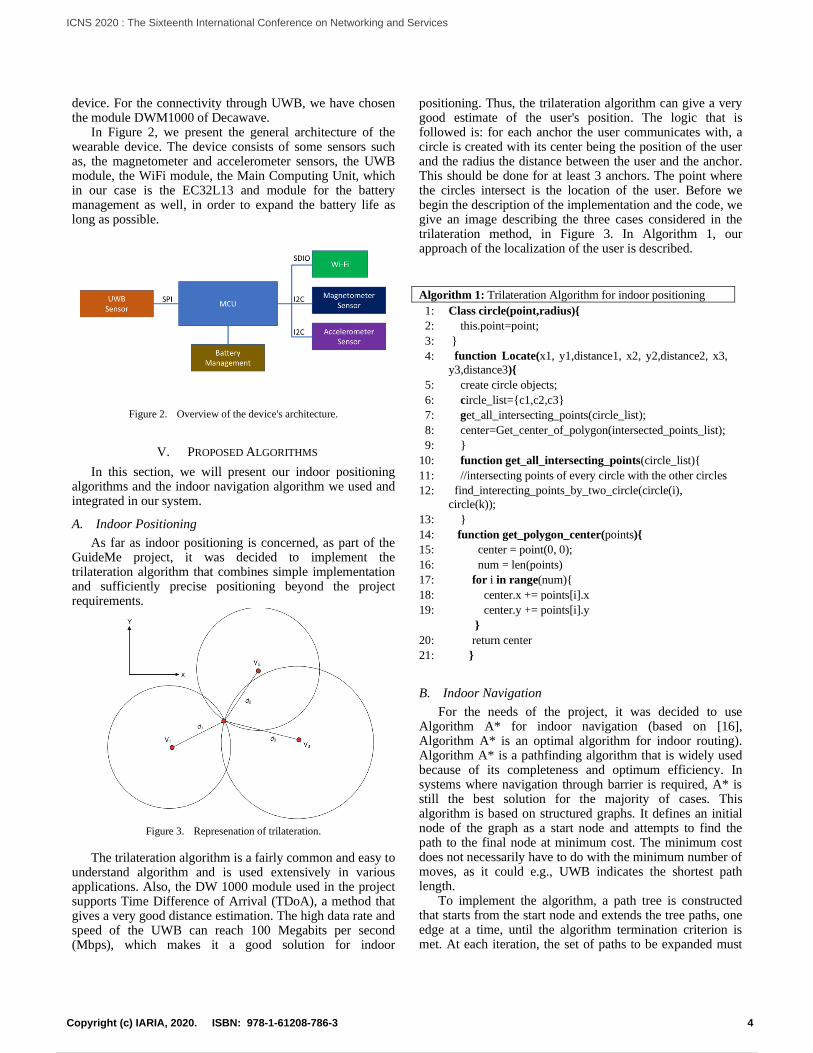
positioning. Thus, the trilateration algorithm can give a very good estimate of the user's position. The logic that is followed is: for each anchor the user communicates with, a circle is created with its center being the position of the user and the radius the distance between the user and the anchor. This should be done for at least 3 anchors. The point where the circles intersect is the location of the user. Before we begin the description of the implementation and the code, we give an image describing the three cases considered in the trilateration method, in Figure 3. In Algorithm 1, our approach of the localization of the user is described.
Algorithm 1: Trilateration Algorithm for indoor positioning
1: Class circle(point,radius){
2: this.point=point;
3: }
4: function Locate(x1, y1,distance1, x2, y2,distance2, x3,
y3,distance3){
5: create circle objects;
6: circle_list={c1,c2,c3}
7: get_all_intersecting_points(circle_list);
8: center=Get_center_of_polygon(intersected_points_list);
9: }
10: function get_all_intersecting_points(circle_list){
11: //intersecting points of every circle with the other circles
12: find_interecting_points_by_two_circle(circle(i),
circle(k));
13: }
14: function get_polygon_center(points){
15: center = point(0, 0);
16: num = len(points)
17: for i in range(num){
18: center.x += points[i].x
19: center.y += points[i].y
}
20: return center
21: }
B. Indoor Navigation
For the needs of the project, it was decided to use Algorithm A* for indoor navigation (based on [16], Algorithm A* is an optimal algorithm for indoor routing). Algorithm A* is a pathfinding algorithm that is widely used because of its completeness and optimum efficiency. In systems where navigation through barrier is required, A* is still the best solution for the majority of cases. This algorithm is based on structured graphs. It defines an initial node of the graph as a start node and attempts to find the path to the final node at minimum cost. The minimum cost does not necessarily have to do with the minimum number of moves, as it could e.g., UWB indicates the shortest path length.
To implement the algorithm, a path tree is constructed that starts from the start node and extends the tree paths, one edge at a time, until the algorithm termination criterion is met. At each iteration, the set of paths to be expanded must
4Copyright (c) IARIA, 2020. ISBN: 978-1-61208-786-3
ICNS 2020 : The Sixteenth International Conference on Networking and Services
13 / 81
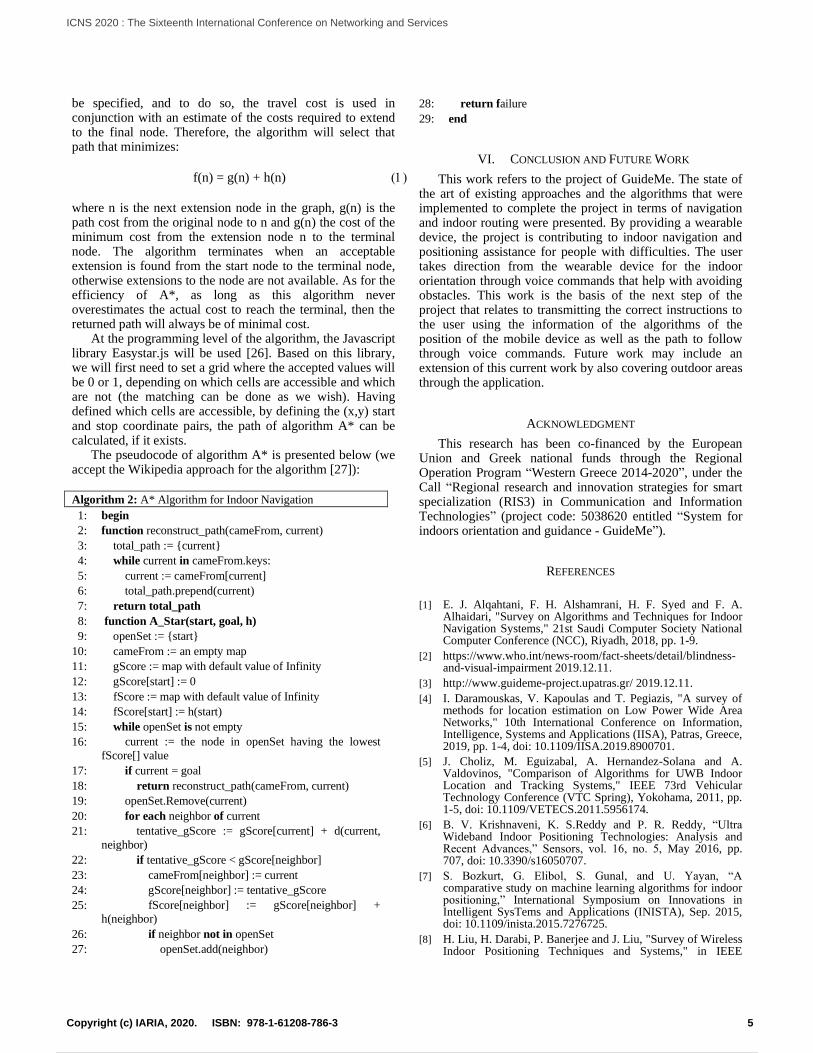
be specified, and to do so, the travel cost is used in conjunction with an estimate of the costs required to extend to the final node. Therefore, the algorithm will select that path that minimizes:
f(n) = g(n) + h(n) ()
where n is the next extension node in the graph, g(n) is the path cost from the original node to n and g(n) the cost of the minimum cost from the extension node n to the terminal node. The algorithm terminates when an acceptable extension is found from the start node to the terminal node, otherwise extensions to the node are not available. As for the efficiency of A*, as long as this algorithm never overestimates the actual cost to reach the terminal, then the returned path will always be of minimal cost.
At the programming level of the algorithm, the Javascript library Easystar.js will be used [26]. Based on this library, we will first need to set a grid where the accepted values will be 0 or 1, depending on which cells are accessible and which are not (the matching can be done as we wish). Having defined which cells are accessible, by defining the (x,y) start and stop coordinate pairs, the path of algorithm A* can be calculated, if it exists.
The pseudocode of algorithm A* is presented below (we accept the Wikipedia approach for the algorithm [27]):
Algorithm 2: A* Algorithm for Indoor Navigation
1: begin
2: function reconstruct_path(cameFrom, current)
3: total_path := {current}
4: while current in cameFrom.keys:
5: current := cameFrom[current]
6: total_path.prepend(current)
7: return total_path
8: function A_Star(start, goal, h)
9: openSet := {start}
10: cameFrom := an empty map
11: gScore := map with default value of Infinity
12: gScore[start] := 0
13: fScore := map with default value of Infinity
14: fScore[start] := h(start)
15: while openSet is not empty
16: current := the node in openSet having the lowest
fScore[] value
17: if current = goal
18: return reconstruct_path(cameFrom, current)
19: openSet.Remove(current)
20: for each neighbor of current
21: tentative_gScore := gScore[current] + d(current,
neighbor)
22: if tentative_gScore < gScore[neighbor]
23: cameFrom[neighbor] := current
24: gScore[neighbor] := tentative_gScore
25: fScore[neighbor] := gScore[neighbor] +
h(neighbor)
26: if neighbor not in openSet
27: openSet.add(neighbor)
28: return failure
29: end
VI. CONCLUSION AND FUTURE WORK
This work refers to the project of GuideMe. The state of the art of existing approaches and the algorithms that were implemented to complete the project in terms of navigation and indoor routing were presented. By providing a wearable device, the project is contributing to indoor navigation and positioning assistance for people with difficulties. The user takes direction from the wearable device for the indoor orientation through voice commands that help with avoiding obstacles. This work is the basis of the next step of the project that relates to transmitting the correct instructions to the user using the information of the algorithms of the position of the mobile device as well as the path to follow through voice commands. Future work may include an extension of this current work by also covering outdoor areas through the application.
ACKNOWLEDGMENT
This research has been co-financed by the European Union and Greek national funds through the Regional Operation Program “Western Greece 2014-2020”, under the Call “Regional research and innovation strategies for smart specialization (RIS3) in Communication and Information Technologies” (project code: 5038620 entitled “System for indoors orientation and guidance - GuideMe”).
REFERENCES
[1] E. J. Alqahtani, F. H. Alshamrani, H. F. Syed and F. A.
Alhaidari, "Survey on Algorithms and Techniques for Indoor Navigation Systems," 21st Saudi Computer Society National Computer Conference (NCC), Riyadh, 2018, pp. 1-9.
[2] https://www.who.int/news-room/fact-sheets/detail/blindness-and-visual-impairment 2019.12.11.
[3] http://www.guideme-project.upatras.gr/ 2019.12.11.
[4] I. Daramouskas, V. Kapoulas and T. Pegiazis, "A survey of methods for location estimation on Low Power Wide Area Networks," 10th International Conference on Information, Intelligence, Systems and Applications (IISA), Patras, Greece, 2019, pp. 1-4, doi: 10.1109/IISA.2019.8900701.
[5] J. Choliz, M. Eguizabal, A. Hernandez-Solana and A. Valdovinos, "Comparison of Algorithms for UWB Indoor Location and Tracking Systems," IEEE 73rd Vehicular Technology Conference (VTC Spring), Yokohama, 2011, pp. 1-5, doi: 10.1109/VETECS.2011.5956174.
[6] B. V. Krishnaveni, K. S.Reddy and P. R. Reddy, “Ultra Wideband Indoor Positioning Technologies: Analysis and Recent Advances,” Sensors, vol. 16, no. 5, May 2016, pp. 707, doi: 10.3390/s16050707.
[7] S. Bozkurt, G. Elibol, S. Gunal, and U. Yayan, “A comparative study on machine learning algorithms for indoor positioning,” International Symposium on Innovations in Intelligent SysTems and Applications (INISTA), Sep. 2015, doi: 10.1109/inista.2015.7276725.
[8] H. Liu, H. Darabi, P. Banerjee and J. Liu, "Survey of Wireless Indoor Positioning Techniques and Systems," in IEEE
5Copyright (c) IARIA, 2020. ISBN: 978-1-61208-786-3
ICNS 2020 : The Sixteenth International Conference on Networking and Services
14 / 81
Transactions on Systems, Man, and Cybernetics, Part C (Applications and Reviews), vol. 37, no. 6, pp. 1067-1080, Nov. 2007, doi: 10.1109/TSMCC.2007.905750.
[9] A. Alarifi et al., “Ultra Wideband Indoor Positioning Technologies: Analysis and Recent Advances,” Sensors, vol. 16, no. 5, p. 707, May 2016, doi: 10.3390/s16050707.
[10] M. A. Al-Ammar et al., "Comparative Survey of Indoor Positioning Technologies, Techniques, and Algorithms," International Conference on Cyberworlds, Santander, 2014, pp. 245-252, doi: 10.1109/CW.2014.41.
[11] P. T. Mahida, S. Shahrestani and H. Cheung, "Localization techniques in indoor navigation system for visually impaired people," 17th International Symposium on Communications and Information Technologies (ISCIT), Cairns, QLD, 2017, pp. 1-6, doi: 10.1109/ISCIT.2017.8261229.
[12] A. Kishore et al., "CENSE: A Cognitive Navigation System for People with Special Needs," IEEE Third International Conference on Big Data Computing Service and Applications (BigDataService), San Francisco, CA, 2017, pp. 198-203, doi: 10.1109/BigDataService.2017.32.
[13] S. A. Cheraghi, V. Namboodiri and L. Walker, "GuideBeacon: Beacon-based indoor wayfinding for the blind, visually impaired, and disoriented," 2017 IEEE International Conference on Pervasive Computing and Communications (PerCom), Kona, HI, 2017, pp. 121-130, doi: 10.1109/PERCOM.2017.7917858.
[14] J. Á. B. Link, P. Smith, N. Viol and K. Wehrle, "FootPath: Accurate map-based indoor navigation using smartphones," International Conference on Indoor Positioning and Indoor Navigation, Guimaraes, 2011, pp. 1-8, doi: 10.1109/IPIN.2011.6071934.
[15] R. K. Megalingam, A. P. Rajendran, D. Dileepkumar and A. T. Soloman, "LARN: Indoor navigation for elderly and physically challenged," IEEE Global Humanitarian
Technology Conference (GHTC), San Jose, CA, 2013, pp. 326-330, doi: 10.1109/GHTC.2013.6713705.
[16] Y. Li and B.-S. Shin, “Internal Topology Based Flexible Shortest Path Planning Method for Indoor Navigation,” in Lecture Notes in Electrical Engineering, Springer Berlin Heidelberg, 2015, pp. 171–176, doi: https://doi.org/10.1007/978-3-662-47487-7_26.
[17] S. K. Goel, S. Ansari, and T. Kuwalekar, “Using A * algorithm to find shortest path in Indoor positioning system.” 2017.
[18] https://indoo.rs/indoo-rs-and-san-francisco-international-airport-unveil-app-for-visually-impaired-passengers/ 2019.12.11.
[19] https://www.itu.int/rec/T-REC-F.921-201808-I/en
[20] https://trimis.ec.europa.eu/project/indoor-navigation-and-communication-public-transport-blind-and-visually-impaired 2019.12.11.
[21] https://www.tugraz.at/institute/ifg/projects/navigation/ink/ 2019.12.11.
[22] https://www.tdebproject.com/partnerships/mitigating-indoor-wayfinding-challenges 2019.12.11.
[23] http://www.ways4all.at/index.php/en/ways4all 2019.12.11.
[24] http://it.yu.edu.jo/index.php/it-faculty/facutly-projects/123-english-articles/242-using-an-integrated-techniques-for-developing-indoor-navigation-systems-to-allow-the-blind-and-visually-impaired-people-to-reach-precise-objects 2019.12.11.
[25] https://www.electronicsdatasheets.com/manufacturers/econais/parts/ec32l13 2019.12.11
[26] https://github.com/prettymuchbryce/easystarjs 2019.12.11.
[27] https://en.wikipedia.org/wiki/A*_search_algorithm 2019.12.11.
6Copyright (c) IARIA, 2020. ISBN: 978-1-61208-786-3
ICNS 2020 : The Sixteenth International Conference on Networking and Services
15 / 81
Resource Allocation Mechanism for Massive MIMO
Christos Bouras, Vasileios Kokkinos, Christina Koulouri
Computer Engineering and Informatics Department
University of Patras, Greece
Patras, Greece
e-mail: [email protected], [email protected], [email protected]
Abstract—Nowadays, mobile users need faster data speeds and
more reliable service. The next generation of wireless networks
5G pledges to commit that, and much more. Multiple-Input,
Multiple-Output (ΜΙΜΟ) technology in 5G networks is studied
in this paper, with emphasis on the achieved performance in
terms of achieved Bandwidth. Multi-antenna technologies, such
as MIMO, are anticipated to play a key role in 5G systems, as
they will have to handle much higher speeds than today's
cellular networks and greater network traffic. Specifically, we
will refer to Massive MIMO (Ma-MIMO) technology. In this
paper, a resource allocation mechanism is proposed from the
Base Station (BS) to the available antennas, using the Knapsack
Problem (KP) algorithm. Our goal is to evaluate user access
throughput to the antennas and to study the case where the BS
allocates resources, according to the channel rate it receives
from each User Equipment (UE). The scenario executed is about
serving the maximum number of UE connected to the BS, in
high quality services. Finally, we simulate the results in
MATLAB, in order to be able to evaluate the Quality of Service
(QoS) that is provided to the UE by the BS, with the resource
allocation technique that is proposed.
Keywords-Massive MIMO; 5G; Knapsack Problem; wireless
users; resource block.
I. INTRODUCTION
Some of the main reasons that lead us to the direction of 5G networks is the necessity for greater capacity, improved Data Rate (DR), decreased latency, massive device connectivity, lower cost and better Quality of Service (QoS) It is expected these days that around 2020, a new fifth generation of mobile networks (5G) is going to be developed. The 5G network is the next major generation of cellular mobile communications beyond the current 4G/IMT-Advanced standards. It is anticipated to maintain a significant quantity of mobile data traffic and a really big number of wireless connections to deliver better cost and energy efficiency, as well as QoS in respect of communication delay, reliability, and security. In order to achieve that, five brand-new technologies are designed, including millimeter waves, small cells, Massive MIMO (Ma-MIMO), full duplex, and beamforming.
With a primary adjust of the proper systems that refer to both communication and localization, location-aware communication can be perceived and a huge number of Location Based Services can be supported. 5G networks have a superior transmission scheme named Beam Division Multiple Access (BDMA). This technology serves simultaneously multiple User Equipment (UE) via different
beams. Considering the communication between the Base Station (BS) and the UE, an orthogonal beam is dispensed to each mobile user. In this way, the capacity of the system is increased, owing to the BDMA technique that divides the antenna beam conforming to the UE position [1].
Ma-MIMO technology is a key enabler and foundational
component when it comes to creating the next generation of
network standards. MIMO stands for Multiple-input
multiple-output. It is characterized by wireless systems, that
allow to transmit and receive simultaneously more than one
data signal over the same radio channel. This is accomplished
by using separate antennas in the transmit and receive end for
each data signal. In our days, 4G BSs have a dozen ports for
antennas that handle all cellular traffic. From those twelve,
eight of them are for transmitters and four for receivers. On
the contrary, 5G BSs can support about a hundred ports,
which signifies that on a single array many more antennas can
fit.
In previous research work, a greedy–knapsack algorithm
is proposed to analyze system performance. The authors of
[2] evaluate UE that wait to be served. Then, they choose
from a set of UE to maximize system performance in an
optimal way, without exceeding the available bandwidth
capacity in LTE networks. Other work like [3], remodel the
number of transmit antennas as a Knapsack Problem (KP).
Furthermore, the authors of [4] investigate the Signal-to-
Interference-plus-Noise Ratio (SINR) precoding for Ma-
MIMO systems, since they need to bring quality to a
satisfactory level. Related work like [2][3][4], have explored
the resource allocation technique using the KP formulation.
In this paper, a resource allocation mechanism from the BS
to the available antennas is proposed, using the KP algorithm.
This algorithm is a different approach of MIMO technology,
as it seeks to serve as many UE as possible, with the support
of a great service level. Our goal is to evaluate user access
throughput to the antennas and to study the case where the
BS allocates resources, according to the channel rate it
receives from each antenna. The scenario described is about
serving the maximum number of UE connected to the BS
whereas some UE are on limits of a cell. It is very important
for the proposed mechanism to manage to serve these UE,
achieving a satisfying level of QoS, in terms of achieved
Bandwidth. The resource allocation mechanism is proposed
in a Ma-MIMO system. However, the results presented, are
based on calculations, using a smaller number of users at
7Copyright (c) IARIA, 2020. ISBN: 978-1-61208-786-3
ICNS 2020 : The Sixteenth International Conference on Networking and Services
16 / 81
every base station, in order to present the experiments
effectively. Finally, we will simulate the proposed algorithm
in MATLAB, in order to be able to evaluate if the UE’s
requests are served in an optimal way. To achieve this, we
apply the 0-1 Knapsack Algorithm in our implementation.
The variations in the number of UE connected to the BS,
interference and other simulation parameters, will also be
analyzed.
The rest of this paper is organized as follows. Section II
provides a thorough analysis of the System Model in Ma-
MIMO. Section III provides the proposed mechanism for the
resource allocation. Section IV provides the simulation setup
for our scenario. In Section V, we display and discuss the
results from the simulation that evaluate our system model.
Finally, in Section VI, we state our summarized conclusion
for this paper and provide insights for future work.
II. SYSTEM MODEL
MIMO is an antenna technology for wireless
communication that uses multiple transmission and receiving
antennas. The antennas at the source and the destination are
unified to reduce errors and optimize data speed [5]. This
technology offers enormous advantages with respect to
energy efficiency, spectral efficiency, robustness and
reliability [6]. MIMO specifically attributes to a practical
technique for sending and receiving more than one data signal
simultaneously over the same radio channel taking advantage
of multipath propagation. In practice, the channel between
the transmitter and receiver is estimated from orthogonal
pilot sequences, which are limited by the coherence time of
the channel [7].
Concerning Ma-MIMO technology, the term has been
produced for using a much larger number of antennas per
location. As reported by the authors of [6], the main idea is to
use large antenna arrays at the BS to simultaneously serve
many autonomous terminals. Ma-MIMO technology relies
on a plain processing of signals from all the antennas at BS.
Therefore, with more ports for antennas the BS can serve
more UE at the same time and obtain better beamforming.
This greatly improves the BS’s capacity and range. Still,
using antenna panels covering 360 °, the classic antenna
boundary problems can be avoided, since the BS (Ma-
MIMO) can thus be adapted in the optimal way to the UE’s
movement in different directions. Moreover, the antenna
arrays can be located in different positions at each BS, which
then allows for optimal transmission of signals from different
antenna locations.
As pointed out by the authors of [8][9] and the authors of
[10] consider a Ma-MIMO network with K links using the
same time–frequency resource, ending up in co-channel
interference. Therefore, the target link k receives data that
constitute an additive combination of required signal,
interference, and noise. They use scalars xk to declare the
transmitted signals by the k-th link’s transmitter and they
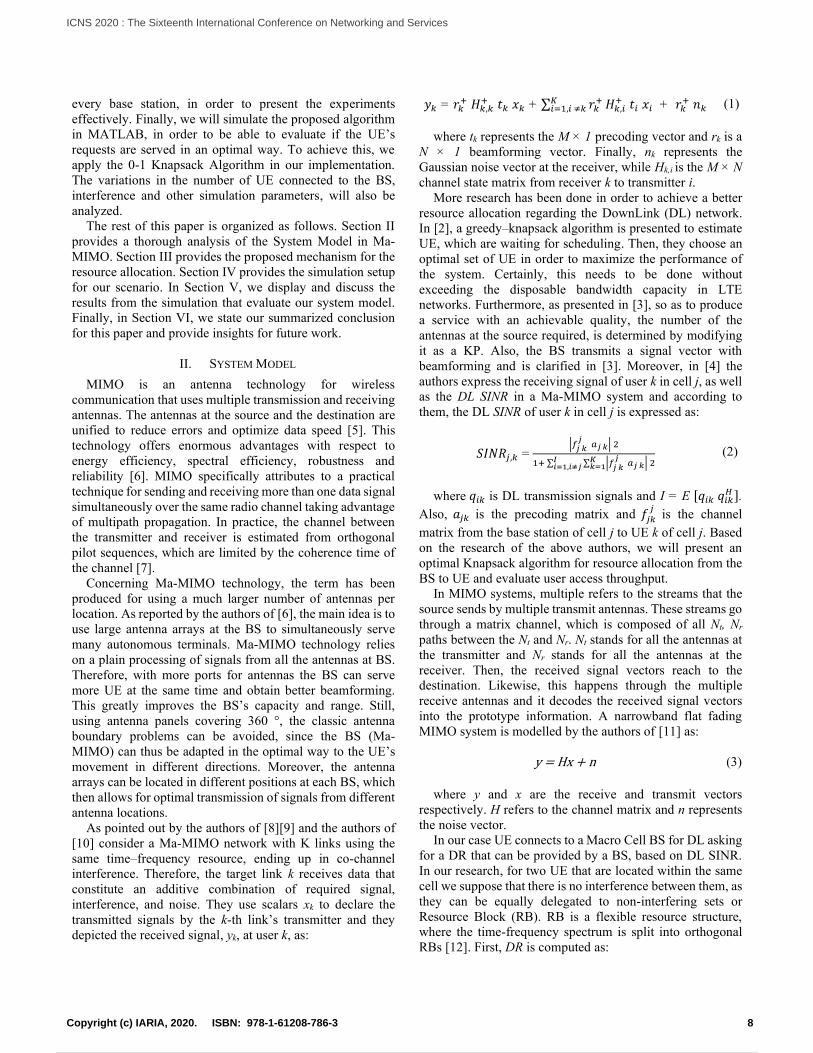
depicted the received signal, yk, at user k, as:
𝑦𝑘 = 𝑟𝑘+ 𝐻𝑘,𝑘
+ 𝑡𝑘 𝑥𝑘 + ∑ 𝑟𝑘+𝐾
𝑖=1,𝑖 ≠𝑘 𝐻𝑘,𝑖+ 𝑡𝑖 𝑥𝑖 + 𝑟𝑘
+ 𝑛𝑘
(1)
where tk represents the M × 1 precoding vector and rk is a
N × 1 beamforming vector. Finally, nk represents the
Gaussian noise vector at the receiver, while Hk,i is the M × N
channel state matrix from receiver k to transmitter i.
More research has been done in order to achieve a better
resource allocation regarding the DownLink (DL) network.
In [2], a greedy–knapsack algorithm is presented to estimate
UE, which are waiting for scheduling. Then, they choose an
optimal set of UE in order to maximize the performance of
the system. Certainly, this needs to be done without
exceeding the disposable bandwidth capacity in LTE
networks. Furthermore, as presented in [3], so as to produce
a service with an achievable quality, the number of the
antennas at the source required, is determined by modifying
it as a KP. Also, the BS transmits a signal vector with
beamforming and is clarified in [3]. Moreover, in [4] the
authors express the receiving signal of user k in cell j, as well
as the DL SINR in a Ma-MIMO system and according to
them, the DL SINR of user k in cell j is expressed as:
𝑆𝐼𝑁𝑅𝑗,𝑘 = |𝑓𝑗 𝑘
𝑗 𝑎𝑗 𝑘| 2
1+ ∑ ∑ |𝑓𝑗 𝑘 𝑗
𝑎𝑗 𝑘| 2𝐾𝑘=1
𝐼𝑖=1,𝑖≠𝑗
(2)
where 𝑞𝑖𝑘 is DL transmission signals and I = E [𝑞𝑖𝑘 𝑞𝑖𝑘𝐻 ].
Also, 𝑎𝑗𝑘 is the precoding matrix and 𝑓𝑗𝑘𝑗
is the channel
matrix from the base station of cell j to UE k of cell j. Based
on the research of the above authors, we will present an
optimal Knapsack algorithm for resource allocation from the
BS to UE and evaluate user access throughput.
In MIMO systems, multiple refers to the streams that the
source sends by multiple transmit antennas. These streams go
through a matrix channel, which is composed of all Nt, Nr
paths between the Nt and Nr. Nt stands for all the antennas at
the transmitter and Nr stands for all the antennas at the
receiver. Then, the received signal vectors reach to the
destination. Likewise, this happens through the multiple
receive antennas and it decodes the received signal vectors
into the prototype information. A narrowband flat fading
MIMO system is modelled by the authors of [11] as:
y = Hx + n (3)
where y and x are the receive and transmit vectors
respectively. H refers to the channel matrix and n represents
the noise vector.
In our case UE connects to a Macro Cell BS for DL asking
for a DR that can be provided by a BS, based on DL SINR.
In our research, for two UE that are located within the same
cell we suppose that there is no interference between them, as
they can be equally delegated to non-interfering sets or
Resource Block (RB). RB is a flexible resource structure,
where the time-frequency spectrum is split into orthogonal
RBs [12]. First, DR is computed as:
8Copyright (c) IARIA, 2020. ISBN: 978-1-61208-786-3
ICNS 2020 : The Sixteenth International Conference on Networking and Services
17 / 81
DR = 𝐵𝑅𝐵 ∗ 𝑙𝑜𝑔2(1 + 𝑆𝐼𝑁𝑅𝑗,𝑖)
(4)
where BRB corresponds to the bandwidth of a specific RB
and SINRj,i is the signal-to-interference-plus-noise ratio
between UE j and BS i. DR is the data rate for the whole
system and is equal to the Macro Cell data rate. This helps to
achieve higher spectral efficiency. The number of RBs that a
UE (suppose UEj) demands from a particular BS aiming at a
desired rate, is computed below:
𝑅𝑗,𝑖 = [𝑔𝑖
𝐵𝑅𝐵∗ 𝑙𝑜𝑔2(1+ 𝑆𝐼𝑁𝑅𝑗,𝑖)]
(5)
where gj corresponds to the UE throughput demands and
DRj refers to the desired Data Rate for the UEj.
III. PROPOSED MECHANISM
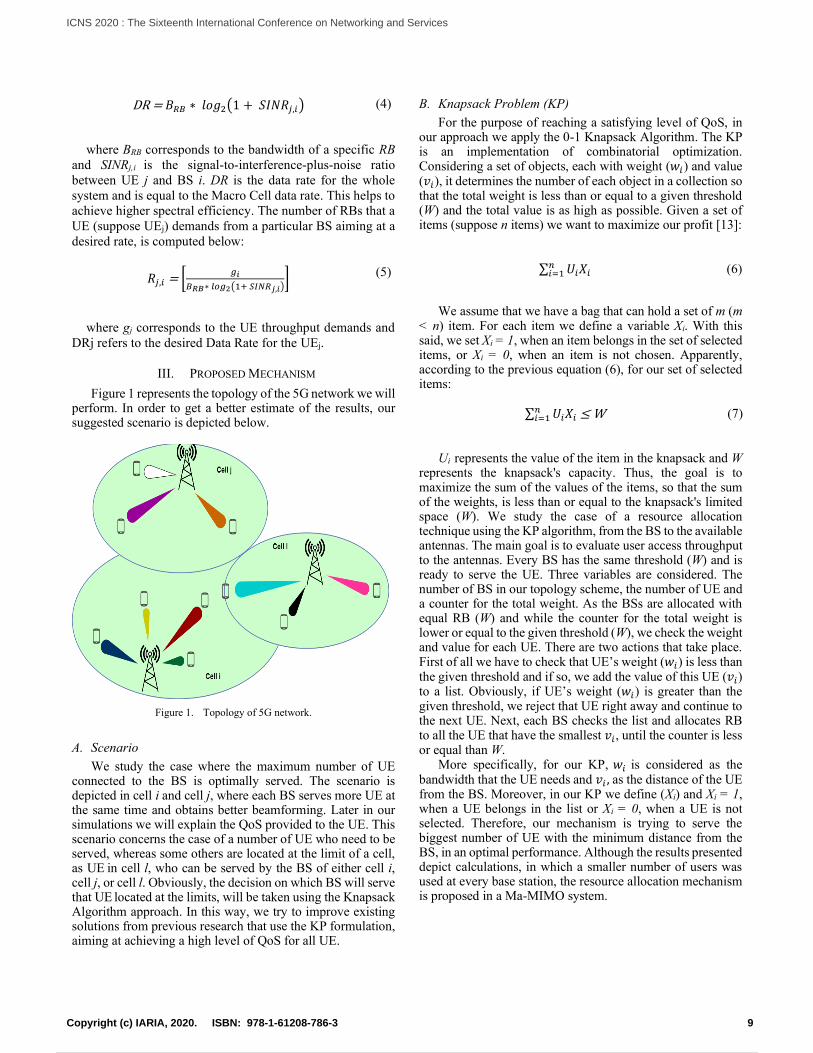
Figure 1 represents the topology of the 5G network we will perform. In order to get a better estimate of the results, our suggested scenario is depicted below.
Figure 1. Topology of 5G network.
A. Scenario
We study the case where the maximum number of UE
connected to the BS is optimally served. The scenario is depicted in cell i and cell j, where each BS serves more UE at the same time and obtains better beamforming. Later in our simulations we will explain the QoS provided to the UE. This scenario concerns the case of a number of UE who need to be served, whereas some others are located at the limit of a cell, as UE in cell l, who can be served by the BS of either cell i, cell j, or cell l. Obviously, the decision on which BS will serve that UE located at the limits, will be taken using the Knapsack Algorithm approach. In this way, we try to improve existing solutions from previous research that use the KP formulation, aiming at achieving a high level of QoS for all UE.
B. Knapsack Problem (KP)
For the purpose of reaching a satisfying level of QoS, in our approach we apply the 0-1 Knapsack Algorithm. The KP is an implementation of combinatorial optimization. Considering a set of objects, each with weight (𝑤𝑖) and value (𝑣𝑖), it determines the number of each object in a collection so that the total weight is less than or equal to a given threshold (W) and the total value is as high as possible. Given a set of items (suppose n items) we want to maximize our profit [13]:
∑ 𝑈𝑖𝑋𝑖𝑛𝑖=1
(6)
We assume that we have a bag that can hold a set of m (m < n) item. For each item we define a variable Xi. With this said, we set Xi = 1, when an item belongs in the set of selected items, or Xi = 0, when an item is not chosen. Apparently, according to the previous equation (6), for our set of selected items:
∑ 𝑈𝑖𝑋𝑖
𝑛𝑖=1 ≤ W
(7)
Ui represents the value of the item in the knapsack and W represents the knapsack's capacity. Thus, the goal is to maximize the sum of the values of the items, so that the sum of the weights, is less than or equal to the knapsack's limited space (W). We study the case of a resource allocation technique using the KP algorithm, from the BS to the available antennas. The main goal is to evaluate user access throughput to the antennas. Every BS has the same threshold (W) and is ready to serve the UE. Three variables are considered. The number of BS in our topology scheme, the number of UE and a counter for the total weight. As the BSs are allocated with equal RB (W) and while the counter for the total weight is lower or equal to the given threshold (W), we check the weight and value for each UE. There are two actions that take place. First of all we have to check that UE’s weight (𝑤𝑖) is less than the given threshold and if so, we add the value of this UE (𝑣𝑖) to a list. Obviously, if UE’s weight (𝑤𝑖) is greater than the given threshold, we reject that UE right away and continue to the next UE. Next, each BS checks the list and allocates RB to all the UE that have the smallest 𝑣𝑖, until the counter is less or equal than W.
More specifically, for our KP, 𝑤𝑖 is considered as the bandwidth that the UE needs and 𝑣𝑖 , as the distance of the UE from the BS. Moreover, in our KP we define (Xi) and Xi = 1, when a UE belongs in the list or Xi = 0, when a UE is not selected. Therefore, our mechanism is trying to serve the biggest number of UE with the minimum distance from the BS, in an optimal performance. Although the results presented depict calculations, in which a smaller number of users was used at every base station, the resource allocation mechanism is proposed in a Ma-MIMO system.
9Copyright (c) IARIA, 2020. ISBN: 978-1-61208-786-3
ICNS 2020 : The Sixteenth International Conference on Networking and Services
18 / 81
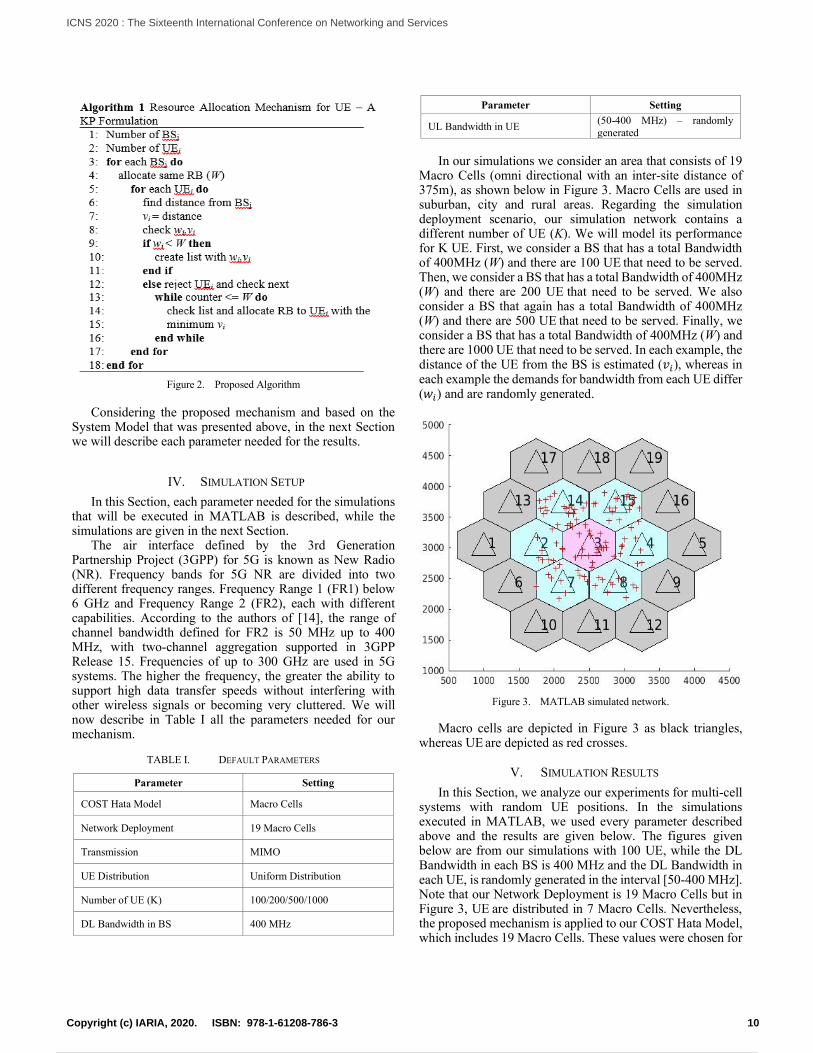
Figure 2. Proposed Algorithm
Considering the proposed mechanism and based on the
System Model that was presented above, in the next Section we will describe each parameter needed for the results.
IV. SIMULATION SETUP
In this Section, each parameter needed for the simulations that will be executed in MATLAB is described, while the simulations are given in the next Section.
The air interface defined by the 3rd Generation Partnership Project (3GPP) for 5G is known as New Radio (NR). Frequency bands for 5G NR are divided into two different frequency ranges. Frequency Range 1 (FR1) below 6 GHz and Frequency Range 2 (FR2), each with different capabilities. According to the authors of [14], the range of channel bandwidth defined for FR2 is 50 MHz up to 400 MHz, with two-channel aggregation supported in 3GPP Release 15. Frequencies of up to 300 GHz are used in 5G systems. The higher the frequency, the greater the ability to support high data transfer speeds without interfering with other wireless signals or becoming very cluttered. We will now describe in Table I all the parameters needed for our mechanism.
TABLE I. DEFAULT PARAMETERS
Parameter Setting
COST Hata Model Macro Cells
Network Deployment 19 Macro Cells
Transmission MIMO
UE Distribution Uniform Distribution
Number of UE (K) 100/200/500/1000
DL Bandwidth in BS 400 MHz
Parameter Setting
UL Bandwidth in UE (50-400 MHz) – randomly
generated
In our simulations we consider an area that consists of 19
Macro Cells (omni directional with an inter-site distance of 375m), as shown below in Figure 3. Macro Cells are used in suburban, city and rural areas. Regarding the simulation deployment scenario, our simulation network contains a different number of UE (K). We will model its performance for K UE. First, we consider a BS that has a total Bandwidth of 400MHz (W) and there are 100 UE that need to be served. Then, we consider a BS that has a total Bandwidth of 400MHz (W) and there are 200 UE that need to be served. We also consider a BS that again has a total Bandwidth of 400MHz (W) and there are 500 UE that need to be served. Finally, we consider a BS that has a total Bandwidth of 400MHz (W) and there are 1000 UE that need to be served. In each example, the distance of the UE from the BS is estimated (𝑣𝑖), whereas in each example the demands for bandwidth from each UE differ (𝑤𝑖) and are randomly generated.
Figure 3. MATLAB simulated network.
Macro cells are depicted in Figure 3 as black triangles, whereas UE are depicted as red crosses.
V. SIMULATION RESULTS
In this Section, we analyze our experiments for multi-cell systems with random UE positions. In the simulations executed in MATLAB, we used every parameter described above and the results are given below. The figures given below are from our simulations with 100 UE, while the DL Bandwidth in each BS is 400 MHz and the DL Bandwidth in each UE, is randomly generated in the interval [50-400 MHz]. Note that our Network Deployment is 19 Macro Cells but in Figure 3, UE are distributed in 7 Macro Cells. Nevertheless, the proposed mechanism is applied to our COST Hata Model, which includes 19 Macro Cells. These values were chosen for
10Copyright (c) IARIA, 2020. ISBN: 978-1-61208-786-3
ICNS 2020 : The Sixteenth International Conference on Networking and Services
19 / 81
our parameters, in order to present the experiments in a better way.
To start with, the simulated network is described. We consider 100 UE that demand resources of our network. All UE are randomly generated with a personalized chance of appearing inside our area of interest that is served from a Macro Cell. Moreover, in the UpLink (UL) network, all UE
have their personalized demands for Bandwidth that ranges from 50 – 400 MHz. As for the DL network, the Bandwidth is equal at all BS at 400MHz.
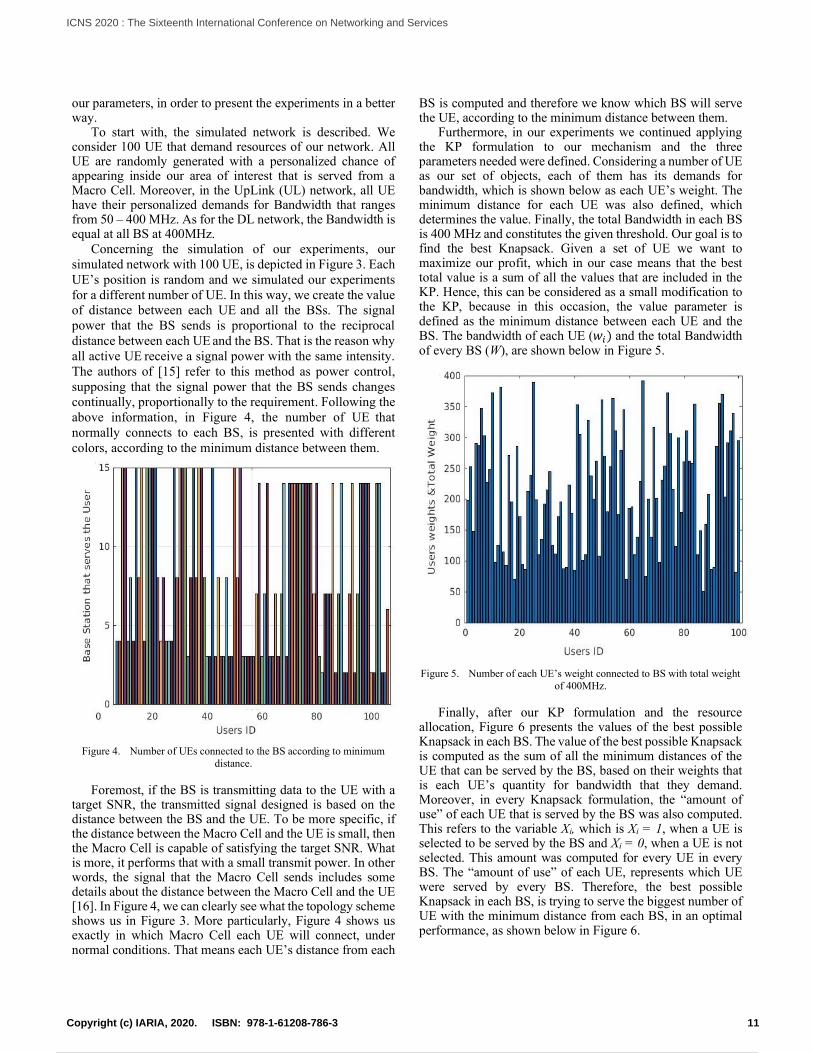
Concerning the simulation of our experiments, our
simulated network with 100 UE, is depicted in Figure 3. Each
UE’s position is random and we simulated our experiments
for a different number of UE. In this way, we create the value
of distance between each UE and all the BSs. The signal
power that the BS sends is proportional to the reciprocal
distance between each UE and the BS. That is the reason why
all active UE receive a signal power with the same intensity.
The authors of [15] refer to this method as power control,
supposing that the signal power that the BS sends changes
continually, proportionally to the requirement. Following the
above information, in Figure 4, the number of UE that
normally connects to each BS, is presented with different
colors, according to the minimum distance between them.
Figure 4. Number of UEs connected to the BS according to minimum
distance.
Foremost, if the BS is transmitting data to the UE with a target SNR, the transmitted signal designed is based on the distance between the BS and the UE. To be more specific, if the distance between the Macro Cell and the UE is small, then the Macro Cell is capable of satisfying the target SNR. What is more, it performs that with a small transmit power. In other words, the signal that the Macro Cell sends includes some details about the distance between the Macro Cell and the UE [16]. In Figure 4, we can clearly see what the topology scheme shows us in Figure 3. More particularly, Figure 4 shows us exactly in which Macro Cell each UE will connect, under normal conditions. That means each UE’s distance from each
BS is computed and therefore we know which BS will serve the UE, according to the minimum distance between them.
Furthermore, in our experiments we continued applying the KP formulation to our mechanism and the three parameters needed were defined. Considering a number of UE as our set of objects, each of them has its demands for bandwidth, which is shown below as each UE’s weight. The minimum distance for each UE was also defined, which determines the value. Finally, the total Bandwidth in each BS is 400 MHz and constitutes the given threshold. Our goal is to find the best Knapsack. Given a set of UE we want to maximize our profit, which in our case means that the best total value is a sum of all the values that are included in the KP. Hence, this can be considered as a small modification to the KP, because in this occasion, the value parameter is defined as the minimum distance between each UE and the BS. The bandwidth of each UE (𝑤𝑖) and the total Bandwidth of every BS (W), are shown below in Figure 5.
Figure 5. Number of each UE’s weight connected to BS with total weight
of 400MHz.
Finally, after our KP formulation and the resource allocation, Figure 6 presents the values of the best possible Knapsack in each BS. The value of the best possible Knapsack is computed as the sum of all the minimum distances of the UE that can be served by the BS, based on their weights that is each UE’s quantity for bandwidth that they demand. Moreover, in every Knapsack formulation, the “amount of use” of each UE that is served by the BS was also computed. This refers to the variable Xi, which is Xi = 1, when a UE is selected to be served by the BS and Xi = 0, when a UE is not selected. This amount was computed for every UE in every BS. The “amount of use” of each UE, represents which UE were served by every BS. Therefore, the best possible Knapsack in each BS, is trying to serve the biggest number of UE with the minimum distance from each BS, in an optimal performance, as shown below in Figure 6.
11Copyright (c) IARIA, 2020. ISBN: 978-1-61208-786-3
ICNS 2020 : The Sixteenth International Conference on Networking and Services
20 / 81
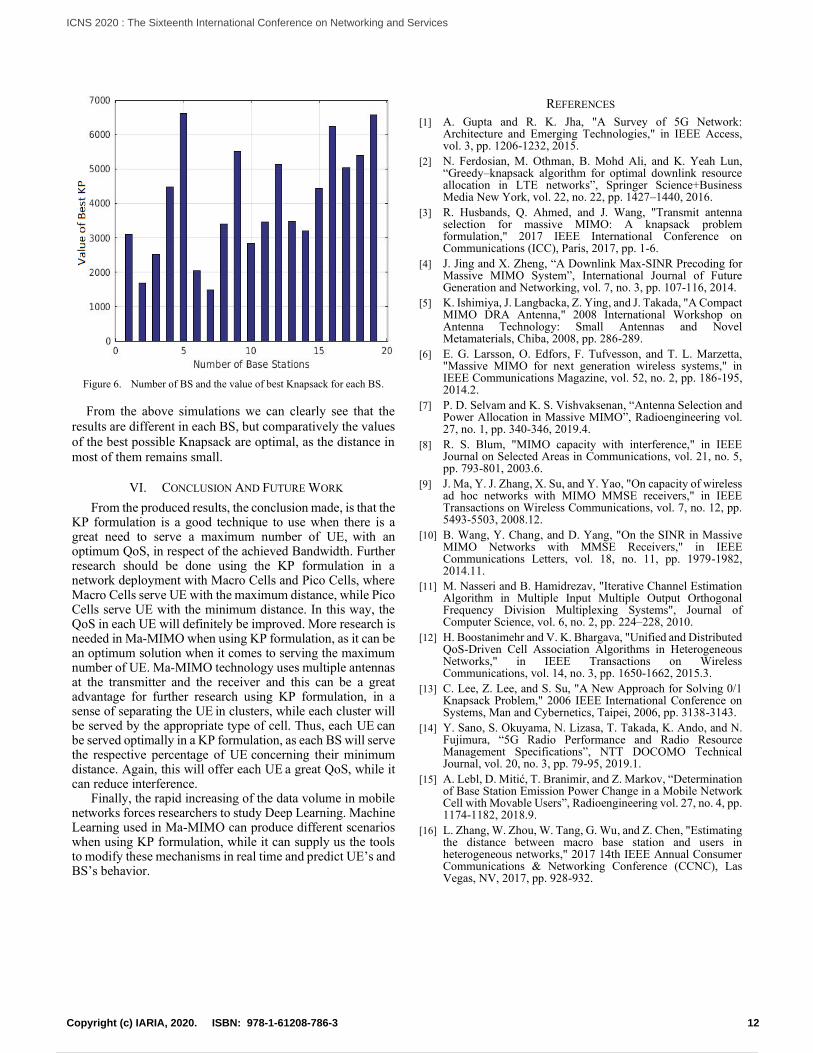
Figure 6. Number of BS and the value of best Knapsack for each BS.
From the above simulations we can clearly see that the
results are different in each BS, but comparatively the values
of the best possible Knapsack are optimal, as the distance in
most of them remains small.
VI. CONCLUSION AND FUTURE WORK
From the produced results, the conclusion made, is that the KP formulation is a good technique to use when there is a great need to serve a maximum number of UE, with an optimum QoS, in respect of the achieved Bandwidth. Further research should be done using the KP formulation in a network deployment with Macro Cells and Pico Cells, where Macro Cells serve UE with the maximum distance, while Pico Cells serve UE with the minimum distance. In this way, the QoS in each UE will definitely be improved. More research is needed in Ma-MIMO when using KP formulation, as it can be an optimum solution when it comes to serving the maximum number of UE. Ma-MIMO technology uses multiple antennas at the transmitter and the receiver and this can be a great advantage for further research using KP formulation, in a sense of separating the UE in clusters, while each cluster will be served by the appropriate type of cell. Thus, each UE can be served optimally in a KP formulation, as each BS will serve the respective percentage of UE concerning their minimum distance. Again, this will offer each UE a great QoS, while it can reduce interference.
Finally, the rapid increasing of the data volume in mobile networks forces researchers to study Deep Learning. Machine Learning used in Ma-MIMO can produce different scenarios when using KP formulation, while it can supply us the tools to modify these mechanisms in real time and predict UE’s and BS’s behavior.
REFERENCES
[1] A. Gupta and R. K. Jha, "A Survey of 5G Network: Architecture and Emerging Technologies," in IEEE Access, vol. 3, pp. 1206-1232, 2015.
[2] N. Ferdosian, M. Othman, B. Mohd Ali, and K. Yeah Lun, “Greedy–knapsack algorithm for optimal downlink resource allocation in LTE networks”, Springer Science+Business Media New York, vol. 22, no. 22, pp. 1427–1440, 2016.
[3] R. Husbands, Q. Ahmed, and J. Wang, "Transmit antenna selection for massive MIMO: A knapsack problem formulation," 2017 IEEE International Conference on Communications (ICC), Paris, 2017, pp. 1-6.
[4] J. Jing and X. Zheng, “A Downlink Max-SINR Precoding for Massive MIMO System”, International Journal of Future Generation and Networking, vol. 7, no. 3, pp. 107-116, 2014.
[5] K. Ishimiya, J. Langbacka, Z. Ying, and J. Takada, "A Compact MIMO DRA Antenna," 2008 International Workshop on Antenna Technology: Small Antennas and Novel Metamaterials, Chiba, 2008, pp. 286-289.
[6] E. G. Larsson, O. Edfors, F. Tufvesson, and T. L. Marzetta, "Massive MIMO for next generation wireless systems," in IEEE Communications Magazine, vol. 52, no. 2, pp. 186-195, 2014.2.
[7] P. D. Selvam and K. S. Vishvaksenan, “Antenna Selection and Power Allocation in Massive MIMO”, Radioengineering vol. 27, no. 1, pp. 340-346, 2019.4.
[8] R. S. Blum, "MIMO capacity with interference," in IEEE Journal on Selected Areas in Communications, vol. 21, no. 5, pp. 793-801, 2003.6.
[9] J. Ma, Y. J. Zhang, X. Su, and Y. Yao, "On capacity of wireless ad hoc networks with MIMO MMSE receivers," in IEEE Transactions on Wireless Communications, vol. 7, no. 12, pp. 5493-5503, 2008.12.
[10] B. Wang, Y. Chang, and D. Yang, "On the SINR in Massive MIMO Networks with MMSE Receivers," in IEEE Communications Letters, vol. 18, no. 11, pp. 1979-1982, 2014.11.
[11] M. Nasseri and B. Hamidrezav, "Iterative Channel Estimation Algorithm in Multiple Input Multiple Output Orthogonal Frequency Division Multiplexing Systems", Journal of Computer Science, vol. 6, no. 2, pp. 224–228, 2010.
[12] H. Boostanimehr and V. K. Bhargava, "Unified and Distributed QoS-Driven Cell Association Algorithms in Heterogeneous Networks," in IEEE Transactions on Wireless Communications, vol. 14, no. 3, pp. 1650-1662, 2015.3.
[13] C. Lee, Z. Lee, and S. Su, "A New Approach for Solving 0/1 Knapsack Problem," 2006 IEEE International Conference on Systems, Man and Cybernetics, Taipei, 2006, pp. 3138-3143.
[14] Y. Sano, S. Okuyama, N. Lizasa, T. Takada, K. Ando, and N. Fujimura, “5G Radio Performance and Radio Resource Management Specifications”, NTT DOCOMO Technical Journal, vol. 20, no. 3, pp. 79-95, 2019.1.
[15] A. Lebl, D. Mitić, T. Branimir, and Z. Markov, “Determination of Base Station Emission Power Change in a Mobile Network Cell with Movable Users”, Radioengineering vol. 27, no. 4, pp. 1174-1182, 2018.9.
[16] L. Zhang, W. Zhou, W. Tang, G. Wu, and Z. Chen, "Estimating the distance between macro base station and users in heterogeneous networks," 2017 14th IEEE Annual Consumer Communications & Networking Conference (CCNC), Las Vegas, NV, 2017, pp. 928-932.
12Copyright (c) IARIA, 2020. ISBN: 978-1-61208-786-3
ICNS 2020 : The Sixteenth International Conference on Networking and Services
21 / 81
Text to Speech through Bluetooth for People with Special Needs Navigation
Eirini BarriDepartment of Computer Engineering and Informatics
University of PatrasPatras, Greece
e-mail: [email protected]
Apostolos GkamasUniversity Ecclesiastical Academy of Vella
Ioannina, Greecee-mail: [email protected]
Evangelos MichosDepartment of Computer Engineering and Informatics
University of PatrasPatras, Greece
e-mail: [email protected]
Christos BourasDepartment of Computer Engineering and Informatics
University of PatrasPatras, Greece
e-mail: [email protected]
Christina KoulouriDepartment of Computer Engineering and Informatics
University of PatrasPatras, Greece
e-mail: [email protected]
Spyridon Aniceto Katsampiris SalgadoDepartment of Computer Engineering and Informatics
University of PatrasPatras, Greece
e-mail: [email protected]
Abstract—As far as outdoor navigation is considered, theGlobal Positioning System (GPS) technology is still one of themost (if not the most) commonly used approaches. Eventhough it is still considered an ideal solution for navigating inoutdoor areas, challenges and problems arise when GPS isconsidered for navigation inside buildings due to the fact thatGPS signals cannot penetrate walls/ceilings (e.g., shoppingmalls, hospitals, etc.) and because signals can be absorbed bythe building walls. This paper’s contribution is navigationsystem that assists people with special needs with an audioguidance system that incorporates input from a voicerecognition system. The central part of the system is a devicethat is able to identify the position and orientation of theperson that carries it and provides the ability to navigate androute by voice commands. The suggested voice synthesissystem is used, so as to guide the user through obstacles inindoor locations. The information of the precise location andorientation of the device is made available to the whole system,through the building’s network infrastructure, so that theuser’s mobile phone, being connected to the same network andalso to the user’s headset through BLE, is able to send audiocommands. For the voice commands, Google Cloud Text-To-Speech (TTS) will be used, assuming that an online connectionis active on the user’s device.
Keywords-GuideMe; GPS; BLE; TTS; indoor; navigation;trilateration; pathfinding; audio; voice.
I. INTRODUCTION
Undoubtedly, there is an increasing demand for efficientindoor navigation systems, demand that mainly derives fromsmart cities, robots and visually impaired people, only toname a few. As far as outdoor navigation and pathfinding areconcerned, the Global Positioning System (GPS) is still
considered among the most commonly used technologies.Yet, this is only efficiently applicable in outdoor locations,because when indoor navigation comes into play, issues dorise. Of course, indoor navigation is very important to us andhas many applications for humans and robots. Two of themost common issues that arise are a) when facing physicalobstacles inside buildings that cannot be labeled as obstaclesby the GPS and b) the fact that signals cannot be absorbed bywalls inside buildings. Multiple floors, rooms and obstaclesinside each and every indoor area we can think of pose amajor problem. Additionally, the inability to use the GPStechnology inside buildings makes indoor navigation morecomplicated, for reasons already explained above [1].
Many recent studies have been and are still conducted inorder to make indoor navigation more effective and efficient.The direct need for new applications and technologies thatcan efficiently tackle such issues can luckily be covered byother available indoor navigation technologies that do existnowadays, such as Wireless-Fidelity (Wi-Fi), Bluetooth andsensors.
Some of the most promising technologies for indoorpositioning are Bluetooth Low-Energy (BLE) beacons [2]and Ultra-Wide Band (UWB) beacons [3]. More specifically,such beacons have a low deployment cost and are suitablefor a wide range of mobile devices. BLE and UWB beaconshave undoubtedly great potential because:
After installation of such beacons, the onlyequipment needed is a smartphone that incorporatesBLE support, whereas foot-mounted positioningneeds special inertial sensors.
The BLE approach supports a large variety ofmobile devices (both Android and IOS devices).
13Copyright (c) IARIA, 2020. ISBN: 978-1-61208-786-3
ICNS 2020 : The Sixteenth International Conference on Networking and Services
22 / 81
The installation cost of UWB and BLE beacons isrelatively low. After deployment, beacons continueto operate for a long duration using their batteries,due to the very low energy consumption rates.
This paper provides the design and development of anavigation system that assists people with special needsusing an audio guidance system that incorporates input froma voice recognition system. At its core, the system consists ofa device that provides the ability to navigate and route byvoice commands, based on the device's location andorientation capabilities. The instructions are based on thedevice's location and orientation capabilities and this deviceshall be connected to the server via the user's mobile phone(Android). The suggested voice synthesis system is used toguide the user through obstacles in indoor locations.Wireless connection between the user’s mobile phone andthe mobile device are made available through low energyconsumption BLE and UWB protocols. The overall system(when completed) will consist of the following components:
Equipment permanently installed in selected areas. A cloud server that will synchronize and coordinate
the various parts, store information about thefacilities and users, and will be responsible for theaccounting and invoicing parts.
Portable devices. Software that will run on smartphones.As far as the voice commands are concerned, Google
Cloud Text-To-Speech (TTS) will be used that supportsdifferent programming languages through its ApplicationProgramming Interface (API) (C#, GO, JAVA, NODE.JS,HYPERTEXT PREPROCESSOR (PHP), PYTHON,RUBY) [4]. The API uses online resources (thus, an activenetwork connection is mandatory) and is provided as aservice, or free, or comes with a small cost. The commandsfor the TTS conversion are provided through SpeechSynthesis Markup Language (SSML) language [5]. TheGuideMe device will give commands through UWB beaconsto the Android application of GuideMe and the application –using the Google Cloud TTS - shall provide the audiocommands.
The rest of this paper is organized as follows. Section IIdescribes the motivation behind our work. Section IIIprovides a literature review of other current works on thissubject. Section IV addresses the system’s architecturewhereas Section V goes into finer details in regard to theproposed algorithm for TTS through Bluetooth navigation inindoor spaces. Finally, Section VI summarizes our mainfindings and conclusions and suggests probable future work.The acknowledgement and conclusions close the article.
II. MOTIVATION
Blindness is the condition of lacking visual perceptiondue to physiological or neurological factors. People withblindness encounter many problems in everyday life. Blindpeople always depend on others. They can not move easilyfrom one place to another without help from others.
According to World Health Association [31] thefollowing are the key facts regarding blindness and visionimpairment
Globally, at least 2.2 billion people have a visionimpairment or blindness, of whom at least 1 billionhave a vision impairment that could have beenprevented or has yet to be addressed.
This 1 billion people includes those with moderateor severe distance vision impairment or blindnessdue to unaddressed refractive error, as well as nearvision impairment caused by unaddressedpresbyopia.
Globally, the leading causes of vision impairmentare uncorrected refractive errors and cataracts.
The majority of people with vision impairment areover the age of 50 years.
The GuideMe project [30] will develop a platform thatprovides guidance and security for out-of-home travel. Thesolution is built around a discreet portable device capable ofindoors localization with accuracy of 10 cm using UWBtechnology. The device can also determine the orientation ofthe user, receive voice commands, and transmit voiceinstructions. It is also capable of detecting crashes andsending updates. The feature is based on the collaboration ofa mobile device, a service running on the user's mobilephone and a server.
The motivation of the paper is to improve two areas inthe life of the blind people and people with special needs ingeneral: convenience and security. Specifically, with the useof the proposed system, users will feel more comfortablevisiting public places such as airports, shopping malls,stations, etc., as they will be guided by the system to reachtheir destination. At the same time, in case of emergenciesinvolving both the user (accidents) and the building (fire,earthquake etc.), the system will inform the users of the exactlocation of the users, whilst also guiding them to the nearestexit. The ultimate goal is to increase the presence of thepopulation with mobility or other problems in buildings by20%.
III. RELATED WORK
In this section, we present previous research work onindoor navigation systems targeted for people with specialneeds and provide a summarized overview of the researchconducted in this field. Our literature review is categorized inresearch work on indoor positioning and indoor navigation.
Following the previous studies, in this section, we willpresent similar projects to GuideMe. Indoo.rs and SanFrancisco International Airport worked together to create anapp for visually impaired passengers. The Entrepreneurship-in-Residence (EIR) project is an Edwin M. Lee collaborationwith the White House and other San Francisco businesspartners. At the beginning of 2014, they chose to help theSan Francisco Airport (SFO) create a tool to assist blind andvisually impaired travelers [11].
Recommendation ITU-T F.921 [12] determines the way anavigation system that is audio-based can be developed toguarantee that it is dedicated and responsive to the needs of
14Copyright (c) IARIA, 2020. ISBN: 978-1-61208-786-3
ICNS 2020 : The Sixteenth International Conference on Networking and Services
23 / 81
people with visual disabilities. It takes on a technologicallyneutral approach and sets the operating attributes of thesystem. The goal is to provide visual network systemdesigners with the audio data they require in the early stagesof development to prevent any problems that keep visionimpaired users from making full and independent use of thebuilt environment. This system explains how to adapt theuser experience to audio-based network navigation systemsand to secure the interoperability of these technologies. Inaddition, it acknowledges that, to meet the needs of peoplethat are visually impaired, networked audio navigationsystems can also benefit people with other age-relateddisabilities, as well as the general public.
The purpose of [13] is to implement a module-basedapplication developed in the context of preliminary projectsfor the mobile mass market, through an appropriate userinterface that responds to the needs of the visually impaired.The blind user should be able to use public transportindependently in a secure manner and navigate complexpublic transport terminals. As a result, the system combinesreal-time communication to and from public transportvehicles with precise positioning and guidance while it alsoprovides additional navigation assistance.
Same as [13], INK 2016, Indoor Navigation andCommunication in ÖPNV for blind and visually impairedpeople [14], combines real-time communication to and frompublic transport vehicles with precise positioning andguidance and has additional video call navigation assistancewhere the person can communicate with a professionaloperator.
Project Ways4all [15] is a new personalized indoornavigation system that can increase public transportaccessibility for all passengers and especially the visuallyimpaired, who will be able to access public transport and thenecessary up-to-date traffic information in a very simplifiedway.
Finally, project “Using an Integrated Technique forDeveloping Indoor Navigation Systems to Allow the Blindand Visually Impaired People to Reach Precise Objects”[16], uses a set of different technologies (WiFi, Bluetooth,and Radio-frequency Identification (RFID)) to help the userreach a micro element in the navigated environment. As aproof of concept, Yarmouk University will test the systemframework on their library to help the blind user find aspecific book. Therefore, it constitutes an intelligentinterface for precise indoor navigation for blind and visuallyimpaired people using a smart phone.
A. Text-To-Speech (TTS)
In this section, we present previous research work onTTS techniques targeted for people with special needs andprovide a summarized overview of the research conducted inthis field. Our literature review is categorized in researchwork on TTS and Bluetooth TTS for blind people.
There are several studies concerning TTS. Speechsynthesis is the artificial production of human speech.Attempts to control the quality of voice of synthesizedspeech, several prototypes and fully operating systems havebeen built based on different synthesis techniques. The
authors of [17] review recent advances in research anddevelopment of speech synthesis, so as to provide atechnological perspective. Their approach is based on theHidden Markov Model (HMM) and aims to summarize andcompare the characteristics of various speech synthesistechniques used by presenting their advantages anddisadvantages.
The purpose of [18] is to try to explain the aim of a TTSsynthesis system and how it works. In more detail, theauthors try to give a short and inclusive review of developinga system that is equal to human performance. The rule-basedtechniques (formant and articulatory synthesis) are describedby the authors and, finally, they propose an HMM synthesiscombined with a Harmonic plus Noise Model (HNM), so asto get a TTS synthesis system that requires lowerdevelopment time and cost.
As mentioned before, the commands for the TTSconversion are provided through SSML language [5]. SSMLis a component of a bigger set of markup specifications forvoice browsers developed through the open processes of theW3C. It is scheduled to provide a rich, XML-based markuplanguage in order to assist the generation of synthetic speechin Web and other applications. A TTS system (a synthesisprocessor) that supports SSML will be responsible forproviding a document as spoken output. It will also beresponsible for using the details contained in the markup toprovide the document, as intended by the author. Accordingto [18], a significant job of the markup language is to provideauthors of synthesizable content a standard way to controlsome characteristics of speech such as pronunciation,volume, pitch, rate, etc. across different synthesis-capableplatforms.
Special reference needs to be made on the API for TTSservices. The GuideMe device will give commands throughUWB beacons to the Android application of GuideMe andthe application – using the Google Cloud TTS -shall providethe audio commands. Particularly, [20] refers to a Cloud TTSconversion powered by machine learning. Google CloudTTS transmutes text into human-like speech. This isaccomplished in more than 180 voices across 30 variants andlanguages, or more. It applies groundbreaking research inspeech synthesis (WaveNet) and Google's powerful neuralnetworks to deliver high-fidelity audio. With this easy-to-useAPI, anyone can make live interactions with users thatconstitute customer service, device interaction, and otherapplications.
Another API for TTS service is [21]. This is part of theSpeech service of Microsoft and builds apps and servicesthat speak naturally. This API creates lifelike voices with theNeural Text to Speech capability built on breakthroughresearch in speech synthesis technology. It offers a widerange of voices and languages. One specific characteristic ofthis API is that it provides its users with models forcustomization in order to create a unique voice foreveryone’s solution and brand.
Similar to [21], another part of the Speech service ofMicrosoft is [22]. Respectively, it allows to convert text intosynthesized speech and get a list of supported voices for aregion using a set of REST APIs. Each available endpoint is
15Copyright (c) IARIA, 2020. ISBN: 978-1-61208-786-3
ICNS 2020 : The Sixteenth International Conference on Networking and Services
24 / 81
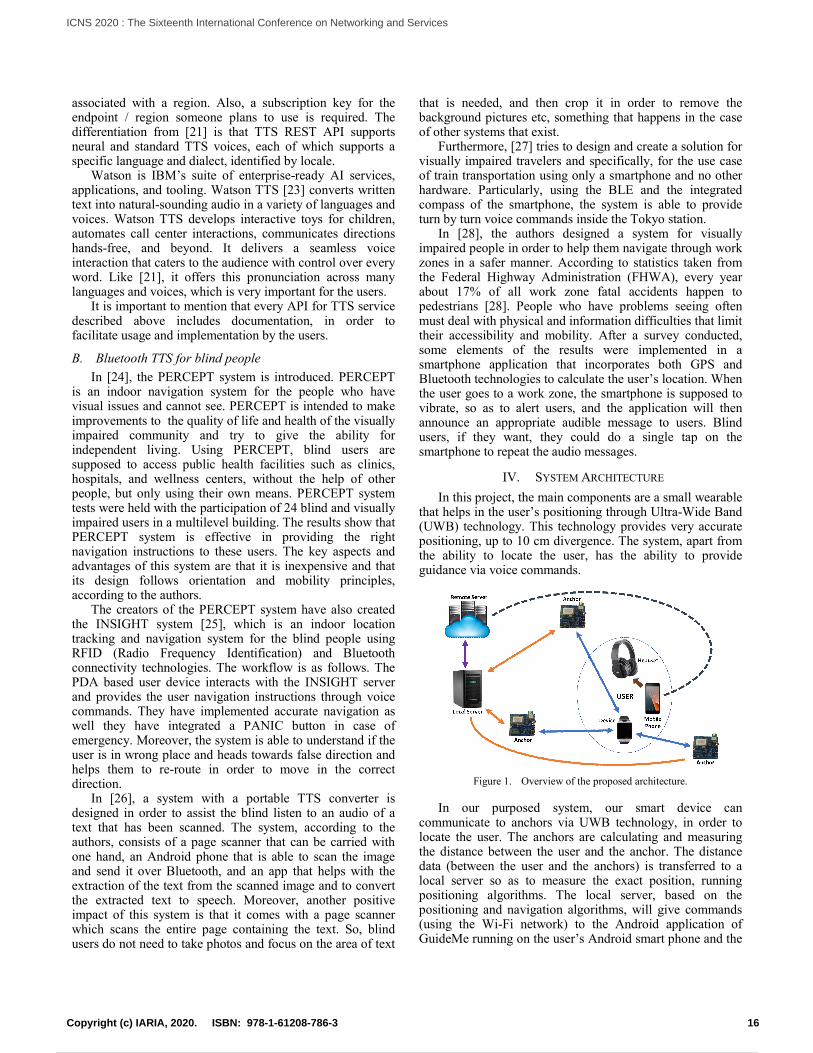
associated with a region. Also, a subscription key for theendpoint / region someone plans to use is required. Thedifferentiation from [21] is that TTS REST API supportsneural and standard TTS voices, each of which supports aspecific language and dialect, identified by locale.
Watson is IBM’s suite of enterprise-ready AI services,applications, and tooling. Watson TTS [23] converts writtentext into natural-sounding audio in a variety of languages andvoices. Watson TTS develops interactive toys for children,automates call center interactions, communicates directionshands-free, and beyond. It delivers a seamless voiceinteraction that caters to the audience with control over everyword. Like [21], it offers this pronunciation across manylanguages and voices, which is very important for the users.
It is important to mention that every API for TTS servicedescribed above includes documentation, in order tofacilitate usage and implementation by the users.
B. Bluetooth TTS for blind people
In [24], the PERCEPT system is introduced. PERCEPTis an indoor navigation system for the people who havevisual issues and cannot see. PERCEPT is intended to makeimprovements to the quality of life and health of the visuallyimpaired community and try to give the ability forindependent living. Using PERCEPT, blind users aresupposed to access public health facilities such as clinics,hospitals, and wellness centers, without the help of otherpeople, but only using their own means. PERCEPT systemtests were held with the participation of 24 blind and visuallyimpaired users in a multilevel building. The results show thatPERCEPT system is effective in providing the rightnavigation instructions to these users. The key aspects andadvantages of this system are that it is inexpensive and thatits design follows orientation and mobility principles,according to the authors.
The creators of the PERCEPT system have also createdthe INSIGHT system [25], which is an indoor locationtracking and navigation system for the blind people usingRFID (Radio Frequency Identification) and Bluetoothconnectivity technologies. The workflow is as follows. ThePDA based user device interacts with the INSIGHT serverand provides the user navigation instructions through voicecommands. They have implemented accurate navigation aswell they have integrated a PANIC button in case ofemergency. Moreover, the system is able to understand if theuser is in wrong place and heads towards false direction andhelps them to re-route in order to move in the correctdirection.
In [26], a system with a portable TTS converter isdesigned in order to assist the blind listen to an audio of atext that has been scanned. The system, according to theauthors, consists of a page scanner that can be carried withone hand, an Android phone that is able to scan the imageand send it over Bluetooth, and an app that helps with theextraction of the text from the scanned image and to convertthe extracted text to speech. Moreover, another positiveimpact of this system is that it comes with a page scannerwhich scans the entire page containing the text. So, blindusers do not need to take photos and focus on the area of text
that is needed, and then crop it in order to remove thebackground pictures etc, something that happens in the caseof other systems that exist.
Furthermore, [27] tries to design and create a solution forvisually impaired travelers and specifically, for the use caseof train transportation using only a smartphone and no otherhardware. Particularly, using the BLE and the integratedcompass of the smartphone, the system is able to provideturn by turn voice commands inside the Tokyo station.
In [28], the authors designed a system for visuallyimpaired people in order to help them navigate through workzones in a safer manner. According to statistics taken fromthe Federal Highway Administration (FHWA), every yearabout 17% of all work zone fatal accidents happen topedestrians [28]. People who have problems seeing oftenmust deal with physical and information difficulties that limittheir accessibility and mobility. After a survey conducted,some elements of the results were implemented in asmartphone application that incorporates both GPS andBluetooth technologies to calculate the user’s location. Whenthe user goes to a work zone, the smartphone is supposed tovibrate, so as to alert users, and the application will thenannounce an appropriate audible message to users. Blindusers, if they want, they could do a single tap on thesmartphone to repeat the audio messages.
IV. SYSTEM ARCHITECTURE
In this project, the main components are a small wearablethat helps in the user’s positioning through Ultra-Wide Band(UWB) technology. This technology provides very accuratepositioning, up to 10 cm divergence. The system, apart fromthe ability to locate the user, has the ability to provideguidance via voice commands.
Figure 1. Overview of the proposed architecture.
In our purposed system, our smart device cancommunicate to anchors via UWB technology, in order tolocate the user. The anchors are calculating and measuringthe distance between the user and the anchor. The distancedata (between the user and the anchors) is transferred to alocal server so as to measure the exact position, runningpositioning algorithms. The local server, based on thepositioning and navigation algorithms, will give commands(using the Wi-Fi network) to the Android application ofGuideMe running on the user’s Android smart phone and the
16Copyright (c) IARIA, 2020. ISBN: 978-1-61208-786-3
ICNS 2020 : The Sixteenth International Conference on Networking and Services
25 / 81
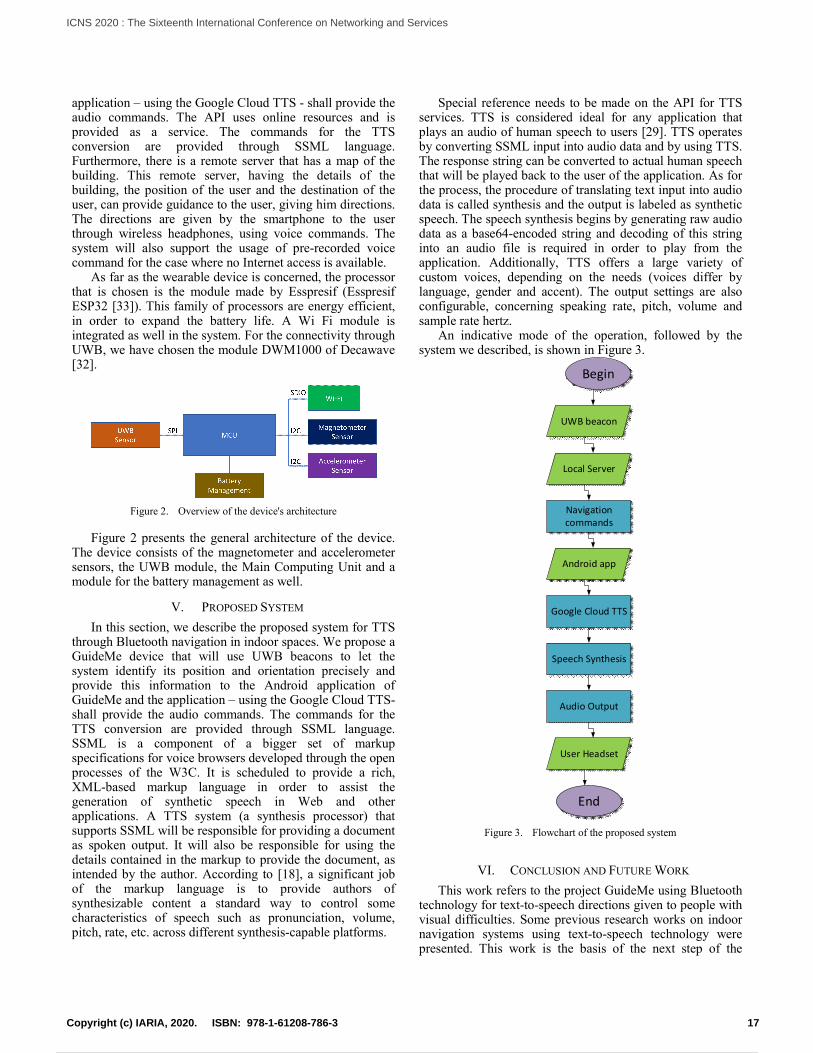
application – using the Google Cloud TTS - shall provide theaudio commands. The API uses online resources and isprovided as a service. The commands for the TTSconversion are provided through SSML language.Furthermore, there is a remote server that has a map of thebuilding. This remote server, having the details of thebuilding, the position of the user and the destination of theuser, can provide guidance to the user, giving him directions.The directions are given by the smartphone to the userthrough wireless headphones, using voice commands. Thesystem will also support the usage of pre-recorded voicecommand for the case where no Internet access is available.
As far as the wearable device is concerned, the processorthat is chosen is the module made by Esspresif (EsspresifESP32 [33]). This family of processors are energy efficient,in order to expand the battery life. A Wi Fi module isintegrated as well in the system. For the connectivity throughUWB, we have chosen the module DWM1000 of Decawave[32].
Figure 2. Overview of the device's architecture
Figure 2 presents the general architecture of the device.The device consists of the magnetometer and accelerometersensors, the UWB module, the Main Computing Unit and amodule for the battery management as well.
V. PROPOSED SYSTEM
In this section, we describe the proposed system for TTSthrough Bluetooth navigation in indoor spaces. We propose aGuideMe device that will use UWB beacons to let thesystem identify its position and orientation precisely andprovide this information to the Android application ofGuideMe and the application – using the Google Cloud TTS-shall provide the audio commands. The commands for theTTS conversion are provided through SSML language.SSML is a component of a bigger set of markupspecifications for voice browsers developed through the openprocesses of the W3C. It is scheduled to provide a rich,XML-based markup language in order to assist thegeneration of synthetic speech in Web and otherapplications. A TTS system (a synthesis processor) thatsupports SSML will be responsible for providing a documentas spoken output. It will also be responsible for using thedetails contained in the markup to provide the document, asintended by the author. According to [18], a significant jobof the markup language is to provide authors ofsynthesizable content a standard way to control somecharacteristics of speech such as pronunciation, volume,pitch, rate, etc. across different synthesis-capable platforms.
Special reference needs to be made on the API for TTSservices. TTS is considered ideal for any application thatplays an audio of human speech to users [29]. TTS operatesby converting SSML input into audio data and by using TTS.The response string can be converted to actual human speechthat will be played back to the user of the application. As forthe process, the procedure of translating text input into audiodata is called synthesis and the output is labeled as syntheticspeech. The speech synthesis begins by generating raw audiodata as a base64-encoded string and decoding of this stringinto an audio file is required in order to play from theapplication. Additionally, TTS offers a large variety ofcustom voices, depending on the needs (voices differ bylanguage, gender and accent). The output settings are alsoconfigurable, concerning speaking rate, pitch, volume andsample rate hertz.
Αn indicative mode of the operation, followed by the system we described, is shown in Figure 3.
Begin
UWB beacon
Local Server
Navigationcommands
Android app
Audio Output
Speech Synthesis
Google Cloud TTS
User Headset
End
Figure 3. Flowchart of the proposed system
VI. CONCLUSION AND FUTURE WORK
This work refers to the project GuideMe using Bluetoothtechnology for text-to-speech directions given to people withvisual difficulties. Some previous research works on indoornavigation systems using text-to-speech technology werepresented. This work is the basis of the next step of the
17Copyright (c) IARIA, 2020. ISBN: 978-1-61208-786-3
ICNS 2020 : The Sixteenth International Conference on Networking and Services
26 / 81
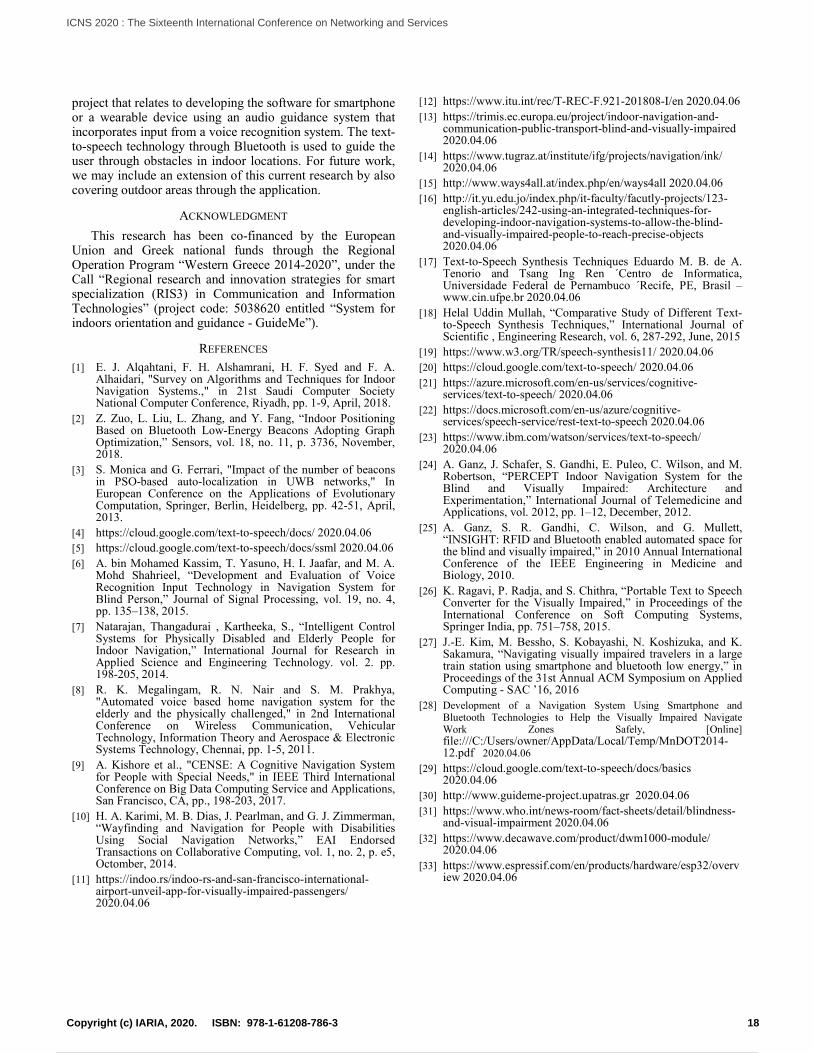
project that relates to developing the software for smartphoneor a wearable device using an audio guidance system thatincorporates input from a voice recognition system. The text-to-speech technology through Bluetooth is used to guide theuser through obstacles in indoor locations. For future work,we may include an extension of this current research by alsocovering outdoor areas through the application.
ACKNOWLEDGMENT
This research has been co-financed by the EuropeanUnion and Greek national funds through the RegionalOperation Program “Western Greece 2014-2020”, under theCall “Regional research and innovation strategies for smartspecialization (RIS3) in Communication and InformationTechnologies” (project code: 5038620 entitled “System forindoors orientation and guidance - GuideMe”).
REFERENCES
[1] E. J. Alqahtani, F. H. Alshamrani, H. F. Syed and F. A.Alhaidari, "Survey on Algorithms and Techniques for IndoorNavigation Systems.," in 21st Saudi Computer SocietyNational Computer Conference, Riyadh, pp. 1-9, April, 2018.
[2] Z. Zuo, L. Liu, L. Zhang, and Y. Fang, “Indoor PositioningBased on Bluetooth Low-Energy Beacons Adopting GraphOptimization,” Sensors, vol. 18, no. 11, p. 3736, November,2018.
[3] S. Monica and G. Ferrari, "Impact of the number of beaconsin PSO-based auto-localization in UWB networks," InEuropean Conference on the Applications of EvolutionaryComputation, Springer, Berlin, Heidelberg, pp. 42-51, April,2013.
[4] https://cloud.google.com/text-to-speech/docs/ 2020.04.06
[5] https://cloud.google.com/text-to-speech/docs/ssml 2020.04.06
[6] A. bin Mohamed Kassim, T. Yasuno, H. I. Jaafar, and M. A.Mohd Shahrieel, “Development and Evaluation of VoiceRecognition Input Technology in Navigation System forBlind Person,” Journal of Signal Processing, vol. 19, no. 4,pp. 135–138, 2015.
[7] Natarajan, Thangadurai , Kartheeka, S., “Intelligent ControlSystems for Physically Disabled and Elderly People forIndoor Navigation,” International Journal for Research inApplied Science and Engineering Technology. vol. 2. pp.198-205, 2014.
[8] R. K. Megalingam, R. N. Nair and S. M. Prakhya,"Automated voice based home navigation system for theelderly and the physically challenged," in 2nd InternationalConference on Wireless Communication, VehicularTechnology, Information Theory and Aerospace & ElectronicSystems Technology, Chennai, pp. 1-5, 2011.
[9] A. Kishore et al., "CENSE: A Cognitive Navigation Systemfor People with Special Needs," in IEEE Third InternationalConference on Big Data Computing Service and Applications,San Francisco, CA, pp., 198-203, 2017.
[10] H. A. Karimi, M. B. Dias, J. Pearlman, and G. J. Zimmerman,“Wayfinding and Navigation for People with DisabilitiesUsing Social Navigation Networks,” EAI EndorsedTransactions on Collaborative Computing, vol. 1, no. 2, p. e5,Octomber, 2014.
[11] https://indoo.rs/indoo-rs-and-san-francisco-international-airport-unveil-app-for-visually-impaired-passengers/2020.04.06
[12] https://www.itu.int/rec/T-REC-F.921-201808-I/en 2020.04.06
[13] https://trimis.ec.europa.eu/project/indoor-navigation-and-communication-public-transport-blind-and-visually-impaired2020.04.06
[14] https://www.tugraz.at/institute/ifg/projects/navigation/ink/2020.04.06
[15] http://www.ways4all.at/index.php/en/ways4all 2020.04.06
[16] http://it.yu.edu.jo/index.php/it-faculty/facutly-projects/123-english-articles/242-using-an-integrated-techniques-for-developing-indoor-navigation-systems-to-allow-the-blind-and-visually-impaired-people-to-reach-precise-objects2020.04.06
[17] Text-to-Speech Synthesis Techniques Eduardo M. B. de A.Tenorio and Tsang Ing Ren ´Centro de Informatica,Universidade Federal de Pernambuco ´Recife, PE, Brasil –www.cin.ufpe.br 2020.04.06
[18] Helal Uddin Mullah, “Comparative Study of Different Text-to-Speech Synthesis Techniques,” International Journal ofScientific , Engineering Research, vol. 6, 287-292, June, 2015
[19] https://www.w3.org/TR/speech-synthesis11/ 2020.04.06
[20] https://cloud.google.com/text-to-speech/ 2020.04.06
[21] https://azure.microsoft.com/en-us/services/cognitive-services/text-to-speech/ 2020.04.06
[22] https://docs.microsoft.com/en-us/azure/cognitive-services/speech-service/rest-text-to-speech 2020.04.06
[23] https://www.ibm.com/watson/services/text-to-speech/2020.04.06
[24] A. Ganz, J. Schafer, S. Gandhi, E. Puleo, C. Wilson, and M.Robertson, “PERCEPT Indoor Navigation System for theBlind and Visually Impaired: Architecture andExperimentation,” International Journal of Telemedicine andApplications, vol. 2012, pp. 1–12, December, 2012.
[25] A. Ganz, S. R. Gandhi, C. Wilson, and G. Mullett,“INSIGHT: RFID and Bluetooth enabled automated space forthe blind and visually impaired,” in 2010 Annual InternationalConference of the IEEE Engineering in Medicine andBiology, 2010.
[26] K. Ragavi, P. Radja, and S. Chithra, “Portable Text to SpeechConverter for the Visually Impaired,” in Proceedings of theInternational Conference on Soft Computing Systems,Springer India, pp. 751–758, 2015.
[27] J.-E. Kim, M. Bessho, S. Kobayashi, N. Koshizuka, and K.Sakamura, “Navigating visually impaired travelers in a largetrain station using smartphone and bluetooth low energy,” inProceedings of the 31st Annual ACM Symposium on AppliedComputing - SAC ’16, 2016
[28] Development of a Navigation System Using Smartphone andBluetooth Technologies to Help the Visually Impaired NavigateWork Zones Safely, [Online]file:///C:/Users/owner/AppData/Local/Temp/MnDOT2014-12.pdf 2020.04.06
[29] https://cloud.google.com/text-to-speech/docs/basics2020.04.06
[30] http://www.guideme-project.upatras.gr 2020.04.06
[31] https://www.who.int/news-room/fact-sheets/detail/blindness-and-visual-impairment 2020.04.06
[32] https://www.decawave.com/product/dwm1000-module/2020.04.06
[33] https://www.espressif.com/en/products/hardware/esp32/overview 2020.04.06
18Copyright (c) IARIA, 2020. ISBN: 978-1-61208-786-3
ICNS 2020 : The Sixteenth International Conference on Networking and Services
27 / 81
Calculation of Location Probabilities for Agent-based Target Tracking System
Masaru Shiozuka†‡, Tappei Yotsumoto†, Kenichi Takahashi‡, Takao Kawamura‡, Kazunori Sugahara‡
†System Engineering Department,
Melco Power Systems Co. Ltd.
Kobe, Japan
email: {Shiozuka.Masaru@zd, Yotsumoto.Tappei@zb}.MitsubishiElectric.co.jp
‡Graduate School of Engineering,
Tottori University
Tottori, Japan
email: {takahashi, kawamura, sugahara }@tottori-u.ac.jp
Abstract—Target monitoring systems are widely used in various
domains such as companies and schools to prevent crimes. Such
systems require operators to monitor the information sent from
sensor devices, such as cameras and beacon devices. To reduce
the workload on the operators, we proposed an automatic target
tracking system. However, issues arose due to target recognition
errors caused by the sensor devices. To address this problem, we
introduced groups of agent to reduce false tracking. The groups
were expanded to avoid losing the target; however, the location
of the target in the group was unclear. In this study, we
calculated the probabilities of the location of the target in a
group and improved tracking efficiency. The validity of this
approach was confirmed via simulations.
Keywords-Agent; Target Tracking; Camera; Monitoring
Systems.
I. INTRODUCTION
Various types of systems, such as entrance control systems for monitoring a suspicious person, have been introduced as security measures in companies and other places. However, as the number of cameras and tracking targets increases, it becomes difficult for an operator to track all the targets. Therefore, we proposed an agent-based tracking system applicable to an environment where each sensor is installed in a discrete location [1]-[3]. This system comprises cameras, tracking nodes, agents, and a monitoring terminal. In the proposed system, a node with a camera analyzes the data received from cameras. Agents move among the nodes by detecting the features of the target. An operator can follow the location of the target by checking the location of its corresponding agent.
If cameras could monitor area without any blind spots it would be possible to track targets. However, it is unrealistic to install cameras that cover all areas. A more realistic approach is to install a specific number of cameras at set points, e.g., entrances, rooms, and passages. In this case, there are instances when a target is not caught on any camera. Therefore, we proposed a method to calculate which cameras may detect the target next [2]. This method calculates the neighbor
relation nodes of each camera based on the value of each camera's shooting area and the floor map.
The system extracts the features of a target from a picture taken by the cameras. However, the features are not always extracted accurately; for example, when a camera tracks a person with brown hair color, their hair color may be recognized as black, depending on the intensity of the light. This results in target recognition errors. Therefore, a person who is not a target may be recognized as the target, and vice versa. This results in false tracking. To address such cases, we introduced groups of agent with two thresholds to reduce false tracking [1]. We defined a group as a set of agents that track the same target. Additionally, two thresholds were introduced (1) a decision threshold to determine a person as the target, and (2) a re-evaluation threshold to postpone the decision. If only one threshold is used, an agent must determine whether a person is its target or not. Hence, false tracking increases if the threshold value is low and non-detection increases if the threshold value is high. By introducing the second threshold, the decision is postponed when the evaluation value is between these two thresholds, and the group is temporarily expanded to cover the nodes where the target may appear next. By expanding the group, it was possible to prevent the target from leaving the group undetected. This method mitigated the cases of false tracking and non-detection.
In this study, group-based tracking was improved. Previous group-based tracking studies [1]-[3] did not consider where the target was in the group. However, in this study, the probabilities of each agent in a group were calculated. Thus, the most probable location of where a target is known by checking the probability of each agent in the group.
This paper is organized as follows: Section II reviews several studies on target tracking systems. Section III provides an overview of the agent-based target tracking system. Section IV explains the derived equations used to calculate probabilities. Section V evaluates the method and Section VI concludes the paper.
19Copyright (c) IARIA, 2020. ISBN: 978-1-61208-786-3
ICNS 2020 : The Sixteenth International Conference on Networking and Services
28 / 81
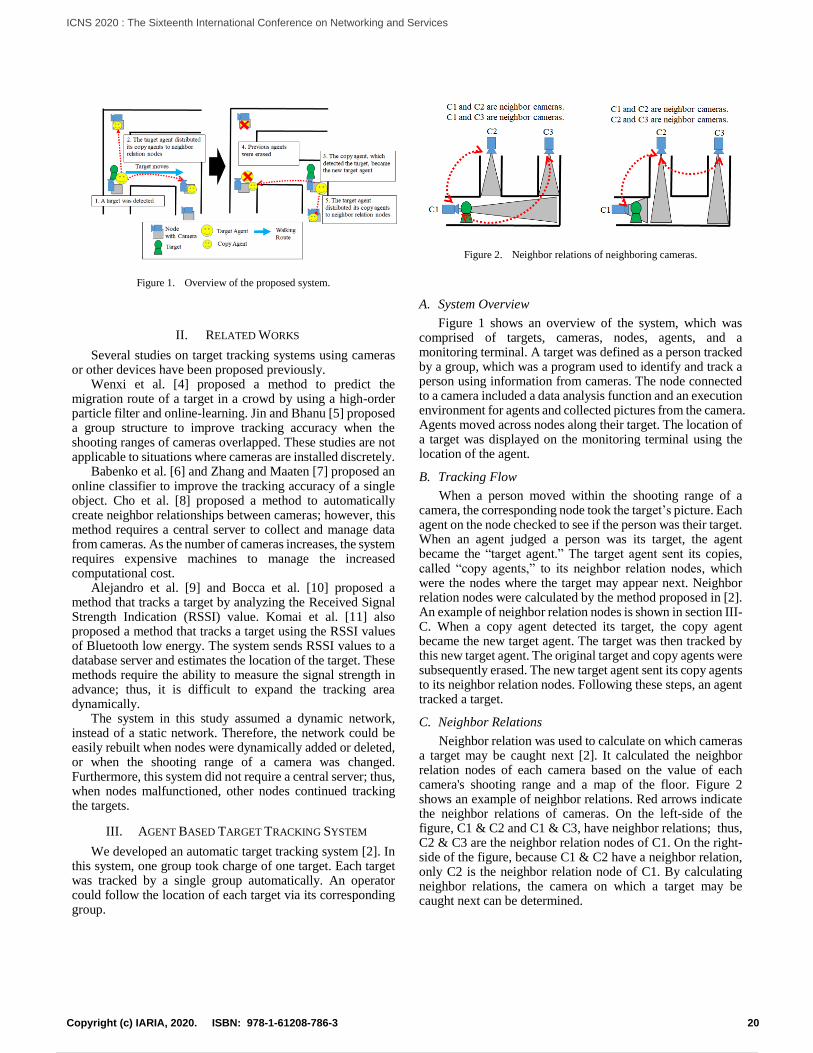
Figure 1. Overview of the proposed system.
II. RELATED WORKS
Several studies on target tracking systems using cameras or other devices have been proposed previously.
Wenxi et al. [4] proposed a method to predict the migration route of a target in a crowd by using a high-order particle filter and online-learning. Jin and Bhanu [5] proposed a group structure to improve tracking accuracy when the shooting ranges of cameras overlapped. These studies are not applicable to situations where cameras are installed discretely.
Babenko et al. [6] and Zhang and Maaten [7] proposed an online classifier to improve the tracking accuracy of a single object. Cho et al. [8] proposed a method to automatically create neighbor relationships between cameras; however, this method requires a central server to collect and manage data from cameras. As the number of cameras increases, the system requires expensive machines to manage the increased computational cost.
Alejandro et al. [9] and Bocca et al. [10] proposed a method that tracks a target by analyzing the Received Signal Strength Indication (RSSI) value. Komai et al. [11] also proposed a method that tracks a target using the RSSI values of Bluetooth low energy. The system sends RSSI values to a database server and estimates the location of the target. These methods require the ability to measure the signal strength in advance; thus, it is difficult to expand the tracking area dynamically.
The system in this study assumed a dynamic network, instead of a static network. Therefore, the network could be easily rebuilt when nodes were dynamically added or deleted, or when the shooting range of a camera was changed. Furthermore, this system did not require a central server; thus, when nodes malfunctioned, other nodes continued tracking the targets.
III. AGENT BASED TARGET TRACKING SYSTEM
We developed an automatic target tracking system [2]. In this system, one group took charge of one target. Each target was tracked by a single group automatically. An operator could follow the location of each target via its corresponding group.
Figure 2. Neighbor relations of neighboring cameras.
A. System Overview
Figure 1 shows an overview of the system, which was comprised of targets, cameras, nodes, agents, and a monitoring terminal. A target was defined as a person tracked by a group, which was a program used to identify and track a person using information from cameras. The node connected to a camera included a data analysis function and an execution environment for agents and collected pictures from the camera. Agents moved across nodes along their target. The location of a target was displayed on the monitoring terminal using the location of the agent.
B. Tracking Flow
When a person moved within the shooting range of a camera, the corresponding node took the target’s picture. Each agent on the node checked to see if the person was their target. When an agent judged a person was its target, the agent became the “target agent.” The target agent sent its copies, called “copy agents,” to its neighbor relation nodes, which were the nodes where the target may appear next. Neighbor relation nodes were calculated by the method proposed in [2]. An example of neighbor relation nodes is shown in section III-C. When a copy agent detected its target, the copy agent became the new target agent. The target was then tracked by this new target agent. The original target and copy agents were subsequently erased. The new target agent sent its copy agents to its neighbor relation nodes. Following these steps, an agent tracked a target.
C. Neighbor Relations
Neighbor relation was used to calculate on which cameras a target may be caught next [2]. It calculated the neighbor relation nodes of each camera based on the value of each camera's shooting range and a map of the floor. Figure 2 shows an example of neighbor relations. Red arrows indicate the neighbor relations of cameras. On the left-side of the figure, C1 & C2 and C1 & C3, have neighbor relations; thus, C2 & C3 are the neighbor relation nodes of C1. On the right-side of the figure, because C1 & C2 have a neighbor relation, only C2 is the neighbor relation node of C1. By calculating neighbor relations, the camera on which a target may be caught next can be determined.
20Copyright (c) IARIA, 2020. ISBN: 978-1-61208-786-3
ICNS 2020 : The Sixteenth International Conference on Networking and Services
29 / 81
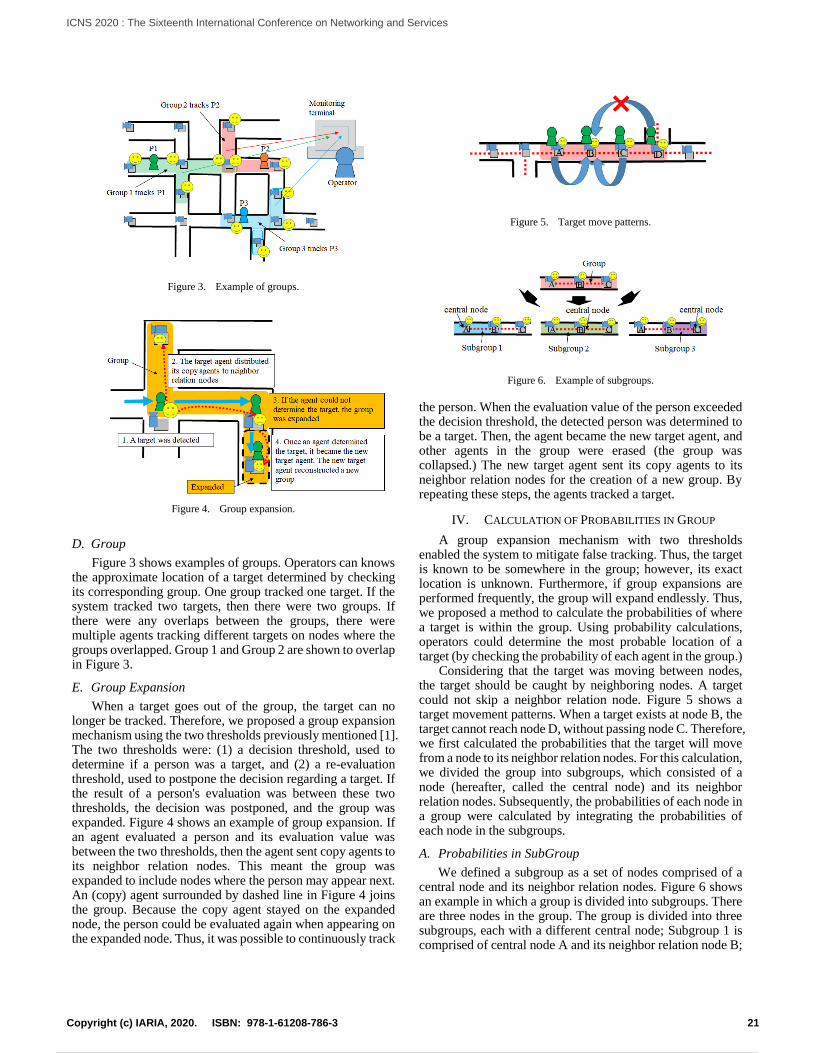
Figure 3. Example of groups.
Figure 4. Group expansion.
D. Group
Figure 3 shows examples of groups. Operators can knows the approximate location of a target determined by checking its corresponding group. One group tracked one target. If the system tracked two targets, then there were two groups. If there were any overlaps between the groups, there were multiple agents tracking different targets on nodes where the groups overlapped. Group 1 and Group 2 are shown to overlap in Figure 3.
E. Group Expansion
When a target goes out of the group, the target can no longer be tracked. Therefore, we proposed a group expansion mechanism using the two thresholds previously mentioned [1]. The two thresholds were: (1) a decision threshold, used to determine if a person was a target, and (2) a re-evaluation threshold, used to postpone the decision regarding a target. If the result of a person's evaluation was between these two thresholds, the decision was postponed, and the group was expanded. Figure 4 shows an example of group expansion. If an agent evaluated a person and its evaluation value was between the two thresholds, then the agent sent copy agents to its neighbor relation nodes. This meant the group was expanded to include nodes where the person may appear next. An (copy) agent surrounded by dashed line in Figure 4 joins the group. Because the copy agent stayed on the expanded node, the person could be evaluated again when appearing on the expanded node. Thus, it was possible to continuously track
Figure 5. Target move patterns.
Figure 6. Example of subgroups.
the person. When the evaluation value of the person exceeded the decision threshold, the detected person was determined to be a target. Then, the agent became the new target agent, and other agents in the group were erased (the group was collapsed.) The new target agent sent its copy agents to its neighbor relation nodes for the creation of a new group. By repeating these steps, the agents tracked a target.
IV. CALCULATION OF PROBABILITIES IN GROUP
A group expansion mechanism with two thresholds enabled the system to mitigate false tracking. Thus, the target is known to be somewhere in the group; however, its exact location is unknown. Furthermore, if group expansions are performed frequently, the group will expand endlessly. Thus, we proposed a method to calculate the probabilities of where a target is within the group. Using probability calculations, operators could determine the most probable location of a target (by checking the probability of each agent in the group.)
Considering that the target was moving between nodes, the target should be caught by neighboring nodes. A target could not skip a neighbor relation node. Figure 5 shows a target movement patterns. When a target exists at node B, the target cannot reach node D, without passing node C. Therefore, we first calculated the probabilities that the target will move from a node to its neighbor relation nodes. For this calculation, we divided the group into subgroups, which consisted of a node (hereafter, called the central node) and its neighbor relation nodes. Subsequently, the probabilities of each node in a group were calculated by integrating the probabilities of each node in the subgroups.
A. Probabilities in SubGroup
We defined a subgroup as a set of nodes comprised of a central node and its neighbor relation nodes. Figure 6 shows an example in which a group is divided into subgroups. There are three nodes in the group. The group is divided into three subgroups, each with a different central node; Subgroup 1 is comprised of central node A and its neighbor relation node B;
21Copyright (c) IARIA, 2020. ISBN: 978-1-61208-786-3
ICNS 2020 : The Sixteenth International Conference on Networking and Services
30 / 81
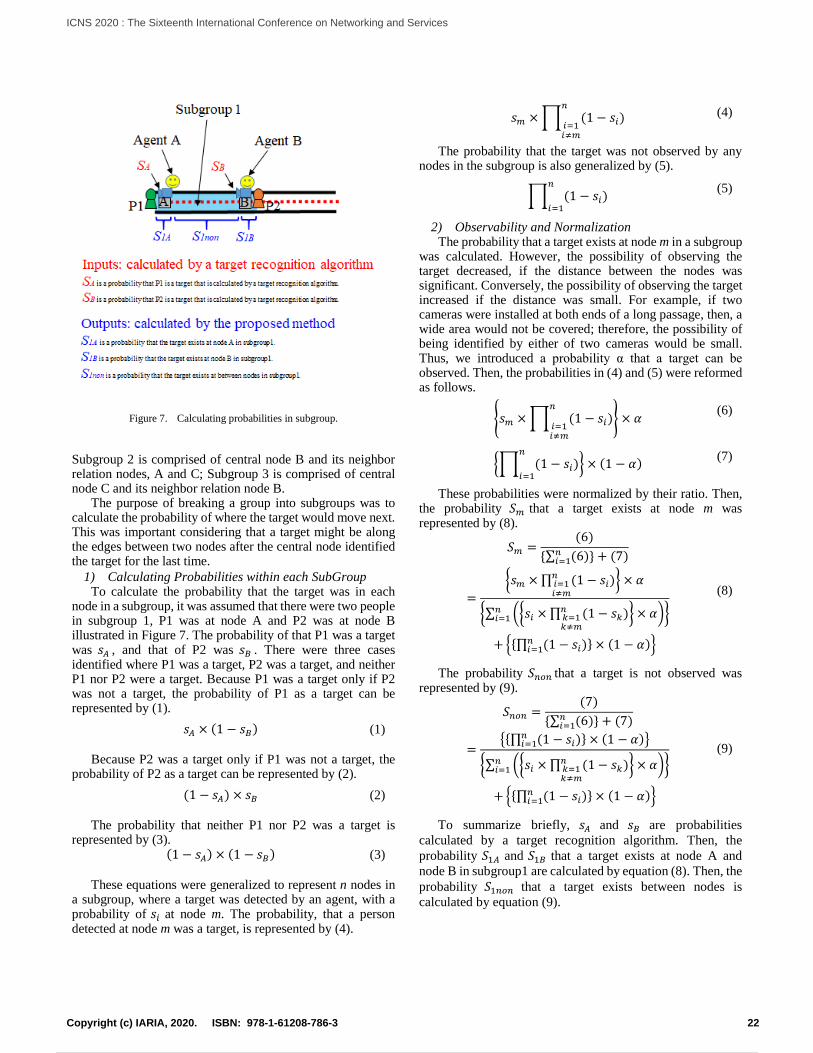
Figure 7. Calculating probabilities in subgroup.
Subgroup 2 is comprised of central node B and its neighbor relation nodes, A and C; Subgroup 3 is comprised of central node C and its neighbor relation node B.
The purpose of breaking a group into subgroups was to calculate the probability of where the target would move next. This was important considering that a target might be along the edges between two nodes after the central node identified the target for the last time.
1) Calculating Probabilities within each SubGroup To calculate the probability that the target was in each
node in a subgroup, it was assumed that there were two people in subgroup 1, P1 was at node A and P2 was at node B illustrated in Figure 7. The probability of that P1 was a target was 𝑠𝐴 , and that of P2 was 𝑠𝐵 . There were three cases identified where P1 was a target, P2 was a target, and neither P1 nor P2 were a target. Because P1 was a target only if P2 was not a target, the probability of P1 as a target can be represented by (1).
𝑠𝐴 × (1 − 𝑠𝐵) (1)
Because P2 was a target only if P1 was not a target, the probability of P2 as a target can be represented by (2).
(1 − 𝑠𝐴) × 𝑠𝐵 (2)
The probability that neither P1 nor P2 was a target is represented by (3).
(1 − 𝑠𝐴) × (1 − 𝑠𝐵) (3)
These equations were generalized to represent n nodes in a subgroup, where a target was detected by an agent, with a probability of 𝑠𝑖 at node m. The probability, that a person detected at node m was a target, is represented by (4).
𝑠𝑚 × ∏ (1 − 𝑠𝑖)𝑛
𝑖=1𝑖≠𝑚
(4)
The probability that the target was not observed by any nodes in the subgroup is also generalized by (5).
∏ (1 − 𝑠𝑖
𝑛
𝑖=1)
(5)
2) Observability and Normalization The probability that a target exists at node m in a subgroup
was calculated. However, the possibility of observing the target decreased, if the distance between the nodes was significant. Conversely, the possibility of observing the target increased if the distance was small. For example, if two cameras were installed at both ends of a long passage, then, a wide area would not be covered; therefore, the possibility of being identified by either of two cameras would be small. Thus, we introduced a probability α that a target can be observed. Then, the probabilities in (4) and (5) were reformed as follows.
{𝑠𝑚 × ∏ (1 − 𝑠𝑖)𝑛
𝑖=1𝑖≠𝑚
} × 𝛼 (6)
{∏ (1 − 𝑠𝑖
𝑛
𝑖=1)} × (1 − 𝛼)
(7)
These probabilities were normalized by their ratio. Then, the probability 𝑆𝑚 that a target exists at node m was represented by (8).
𝑆𝑚 =(6)
{∑ (6)𝑛𝑖=1 } + (7)
=
{𝑠𝑚 × ∏ (1 − 𝑠𝑖)𝑛𝑖=1𝑖≠𝑚
} × 𝛼
{∑ ({𝑠𝑖 × ∏ (1 − 𝑠𝑘)𝑛𝑘=1𝑘≠𝑚
} × 𝛼)𝑛𝑖=1 }
+ {{∏ (1 − 𝑠𝑖𝑛𝑖=1 )} × (1 − 𝛼)}
(8)
The probability 𝑆𝑛𝑜𝑛 that a target is not observed was represented by (9).
𝑆𝑛𝑜𝑛 =(7)
{∑ (6)𝑛𝑖=1 } + (7)
={{∏ (1 − 𝑠𝑖
𝑛𝑖=1 )} × (1 − 𝛼)}
{∑ ({𝑠𝑖 × ∏ (1 − 𝑠𝑘)𝑛𝑘=1𝑘≠𝑚
} × 𝛼)𝑛𝑖=1 }
+ {{∏ (1 − 𝑠𝑖𝑛𝑖=1 )} × (1 − 𝛼)}
(9)
To summarize briefly, 𝑠𝐴 and 𝑠𝐵 are probabilities
calculated by a target recognition algorithm. Then, the
probability 𝑆1𝐴 and 𝑆1𝐵 that a target exists at node A and
node B in subgroup1 are calculated by equation (8). Then, the
probability 𝑆1𝑛𝑜𝑛 that a target exists between nodes is
calculated by equation (9).
22Copyright (c) IARIA, 2020. ISBN: 978-1-61208-786-3
ICNS 2020 : The Sixteenth International Conference on Networking and Services
31 / 81
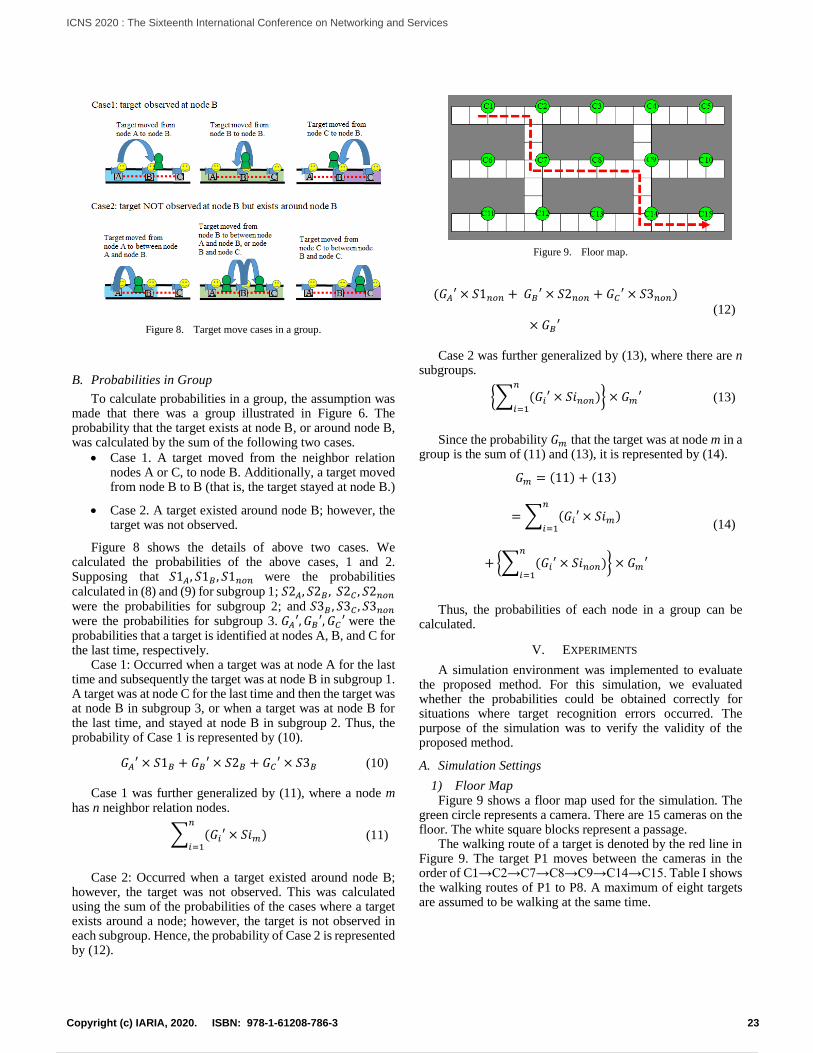
Figure 8. Target move cases in a group.
B. Probabilities in Group
To calculate probabilities in a group, the assumption was made that there was a group illustrated in Figure 6. The probability that the target exists at node B, or around node B, was calculated by the sum of the following two cases.
Case 1. A target moved from the neighbor relation nodes A or C, to node B. Additionally, a target moved from node B to B (that is, the target stayed at node B.)
Case 2. A target existed around node B; however, the target was not observed.
Figure 8 shows the details of above two cases. We calculated the probabilities of the above cases, 1 and 2. Supposing that 𝑆1𝐴, 𝑆1𝐵 , 𝑆1𝑛𝑜𝑛 were the probabilities calculated in (8) and (9) for subgroup 1; 𝑆2𝐴, 𝑆2𝐵 , 𝑆2𝐶 , 𝑆2𝑛𝑜𝑛 were the probabilities for subgroup 2; and 𝑆3𝐵 , 𝑆3𝐶 , 𝑆3𝑛𝑜𝑛 were the probabilities for subgroup 3. 𝐺𝐴′, 𝐺𝐵′, 𝐺𝐶 ′ were the probabilities that a target is identified at nodes A, B, and C for the last time, respectively.
Case 1: Occurred when a target was at node A for the last time and subsequently the target was at node B in subgroup 1. A target was at node C for the last time and then the target was at node B in subgroup 3, or when a target was at node B for the last time, and stayed at node B in subgroup 2. Thus, the probability of Case 1 is represented by (10).
𝐺𝐴′ × 𝑆1𝐵 + 𝐺𝐵′ × 𝑆2𝐵 + 𝐺𝐶′ × 𝑆3𝐵 (10)
Case 1 was further generalized by (11), where a node m has n neighbor relation nodes.
∑ (𝐺𝑖′ × 𝑆𝑖𝑚)𝑛
𝑖=1 (11)
Case 2: Occurred when a target existed around node B; however, the target was not observed. This was calculated using the sum of the probabilities of the cases where a target exists around a node; however, the target is not observed in each subgroup. Hence, the probability of Case 2 is represented by (12).
Figure 9. Floor map.
(𝐺𝐴′ × 𝑆1𝑛𝑜𝑛 + 𝐺𝐵′ × 𝑆2𝑛𝑜𝑛 + 𝐺𝐶 ′ × 𝑆3𝑛𝑜𝑛)
× 𝐺𝐵′ (12)
Case 2 was further generalized by (13), where there are n subgroups.
{∑ (𝐺𝑖′ × 𝑆𝑖𝑛𝑜𝑛)𝑛
𝑖=1} × 𝐺𝑚′ (13)
Since the probability 𝐺𝑚 that the target was at node m in a group is the sum of (11) and (13), it is represented by (14).
𝐺𝑚 = (11) + (13)
= ∑ (𝐺𝑖′ × 𝑆𝑖𝑚)𝑛
𝑖=1
+ {∑ (𝐺𝑖′ × 𝑆𝑖𝑛𝑜𝑛)𝑛
𝑖=1} × 𝐺𝑚′
(14)
Thus, the probabilities of each node in a group can be calculated.
V. EXPERIMENTS
A simulation environment was implemented to evaluate the proposed method. For this simulation, we evaluated whether the probabilities could be obtained correctly for situations where target recognition errors occurred. The purpose of the simulation was to verify the validity of the proposed method.
A. Simulation Settings
1) Floor Map Figure 9 shows a floor map used for the simulation. The
green circle represents a camera. There are 15 cameras on the floor. The white square blocks represent a passage.
The walking route of a target is denoted by the red line in Figure 9. The target P1 moves between the cameras in the order of C1→C2→C7→C8→C9→C14→C15. Table I shows the walking routes of P1 to P8. A maximum of eight targets are assumed to be walking at the same time.
23Copyright (c) IARIA, 2020. ISBN: 978-1-61208-786-3
ICNS 2020 : The Sixteenth International Conference on Networking and Services
32 / 81
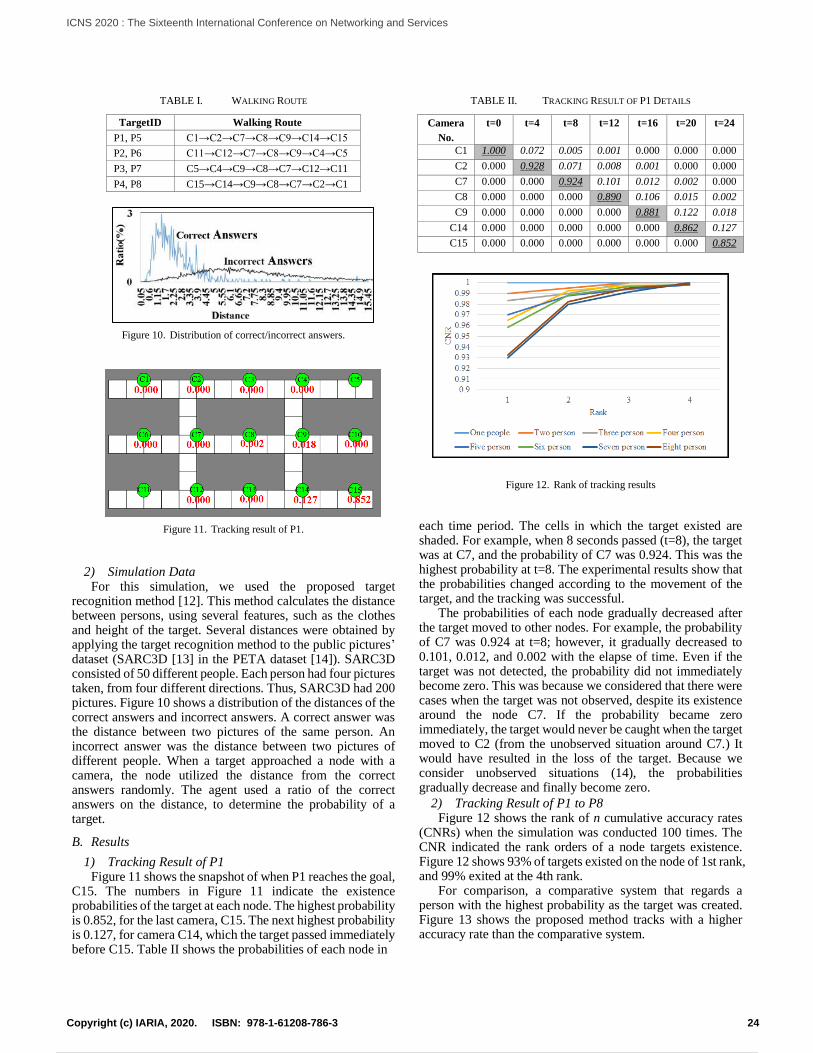
TABLE I. WALKING ROUTE
TargetID Walking Route
P1, P5 C1→C2→C7→C8→C9→C14→C15
P2, P6 C11→C12→C7→C8→C9→C4→C5
P3, P7 C5→C4→C9→C8→C7→C12→C11
P4, P8 C15→C14→C9→C8→C7→C2→C1
Figure 10. Distribution of correct/incorrect answers.
Figure 11. Tracking result of P1.
2) Simulation Data For this simulation, we used the proposed target
recognition method [12]. This method calculates the distance between persons, using several features, such as the clothes and height of the target. Several distances were obtained by applying the target recognition method to the public pictures’ dataset (SARC3D [13] in the PETA dataset [14]). SARC3D consisted of 50 different people. Each person had four pictures taken, from four different directions. Thus, SARC3D had 200 pictures. Figure 10 shows a distribution of the distances of the correct answers and incorrect answers. A correct answer was the distance between two pictures of the same person. An incorrect answer was the distance between two pictures of different people. When a target approached a node with a camera, the node utilized the distance from the correct answers randomly. The agent used a ratio of the correct answers on the distance, to determine the probability of a target.
B. Results
1) Tracking Result of P1 Figure 11 shows the snapshot of when P1 reaches the goal,
C15. The numbers in Figure 11 indicate the existence probabilities of the target at each node. The highest probability is 0.852, for the last camera, C15. The next highest probability is 0.127, for camera C14, which the target passed immediately before C15. Table II shows the probabilities of each node in
TABLE II. TRACKING RESULT OF P1 DETAILS
Camera
No.
t=0 t=4 t=8 t=12 t=16 t=20 t=24
C1 1.000 0.072 0.005 0.001 0.000 0.000 0.000
C2 0.000 0.928 0.071 0.008 0.001 0.000 0.000
C7 0.000 0.000 0.924 0.101 0.012 0.002 0.000
C8 0.000 0.000 0.000 0.890 0.106 0.015 0.002
C9 0.000 0.000 0.000 0.000 0.881 0.122 0.018
C14 0.000 0.000 0.000 0.000 0.000 0.862 0.127
C15 0.000 0.000 0.000 0.000 0.000 0.000 0.852
Figure 12. Rank of tracking results
each time period. The cells in which the target existed are shaded. For example, when 8 seconds passed (t=8), the target was at C7, and the probability of C7 was 0.924. This was the highest probability at t=8. The experimental results show that the probabilities changed according to the movement of the target, and the tracking was successful.
The probabilities of each node gradually decreased after the target moved to other nodes. For example, the probability of C7 was 0.924 at t=8; however, it gradually decreased to 0.101, 0.012, and 0.002 with the elapse of time. Even if the target was not detected, the probability did not immediately become zero. This was because we considered that there were cases when the target was not observed, despite its existence around the node C7. If the probability became zero immediately, the target would never be caught when the target moved to C2 (from the unobserved situation around C7.) It would have resulted in the loss of the target. Because we consider unobserved situations (14), the probabilities gradually decrease and finally become zero.
2) Tracking Result of P1 to P8 Figure 12 shows the rank of n cumulative accuracy rates
(CNRs) when the simulation was conducted 100 times. The CNR indicated the rank orders of a node targets existence. Figure 12 shows 93% of targets existed on the node of 1st rank, and 99% exited at the 4th rank.
For comparison, a comparative system that regards a person with the highest probability as the target was created. Figure 13 shows the proposed method tracks with a higher accuracy rate than the comparative system.
24Copyright (c) IARIA, 2020. ISBN: 978-1-61208-786-3
ICNS 2020 : The Sixteenth International Conference on Networking and Services
33 / 81
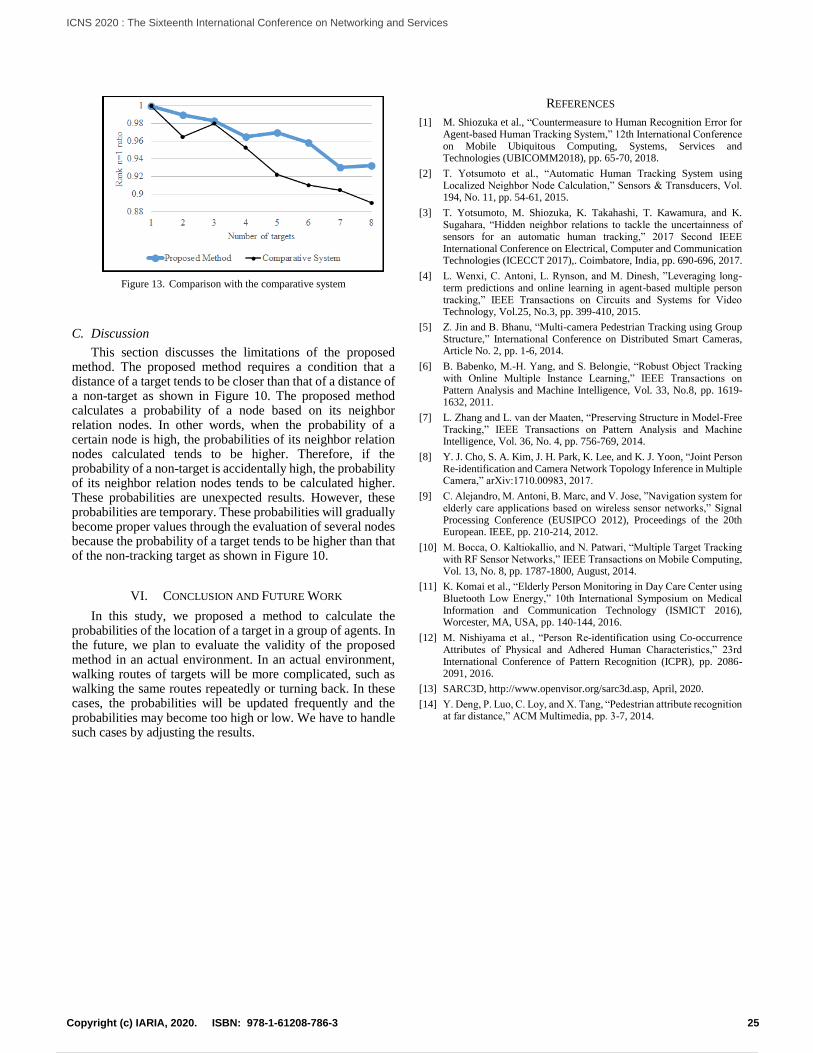
Figure 13. Comparison with the comparative system
C. Discussion
This section discusses the limitations of the proposed method. The proposed method requires a condition that a distance of a target tends to be closer than that of a distance of a non-target as shown in Figure 10. The proposed method calculates a probability of a node based on its neighbor relation nodes. In other words, when the probability of a certain node is high, the probabilities of its neighbor relation nodes calculated tends to be higher. Therefore, if the probability of a non-target is accidentally high, the probability of its neighbor relation nodes tends to be calculated higher. These probabilities are unexpected results. However, these probabilities are temporary. These probabilities will gradually become proper values through the evaluation of several nodes because the probability of a target tends to be higher than that of the non-tracking target as shown in Figure 10.
VI. CONCLUSION AND FUTURE WORK
In this study, we proposed a method to calculate the probabilities of the location of a target in a group of agents. In the future, we plan to evaluate the validity of the proposed method in an actual environment. In an actual environment, walking routes of targets will be more complicated, such as walking the same routes repeatedly or turning back. In these cases, the probabilities will be updated frequently and the probabilities may become too high or low. We have to handle such cases by adjusting the results.
REFERENCES
[1] M. Shiozuka et al., “Countermeasure to Human Recognition Error for Agent-based Human Tracking System,” 12th International Conference on Mobile Ubiquitous Computing, Systems, Services and Technologies (UBICOMM2018), pp. 65-70, 2018.
[2] T. Yotsumoto et al., “Automatic Human Tracking System using Localized Neighbor Node Calculation,” Sensors & Transducers, Vol. 194, No. 11, pp. 54-61, 2015.
[3] T. Yotsumoto, M. Shiozuka, K. Takahashi, T. Kawamura, and K. Sugahara, “Hidden neighbor relations to tackle the uncertainness of sensors for an automatic human tracking,” 2017 Second IEEE International Conference on Electrical, Computer and Communication Technologies (ICECCT 2017),. Coimbatore, India, pp. 690-696, 2017.
[4] L. Wenxi, C. Antoni, L. Rynson, and M. Dinesh, ”Leveraging long-term predictions and online learning in agent-based multiple person tracking,” IEEE Transactions on Circuits and Systems for Video Technology, Vol.25, No.3, pp. 399-410, 2015.
[5] Z. Jin and B. Bhanu, “Multi-camera Pedestrian Tracking using Group Structure,” International Conference on Distributed Smart Cameras, Article No. 2, pp. 1-6, 2014.
[6] B. Babenko, M.-H. Yang, and S. Belongie, “Robust Object Tracking with Online Multiple Instance Learning,” IEEE Transactions on Pattern Analysis and Machine Intelligence, Vol. 33, No.8, pp. 1619-1632, 2011.
[7] L. Zhang and L. van der Maaten, “Preserving Structure in Model-Free Tracking,” IEEE Transactions on Pattern Analysis and Machine Intelligence, Vol. 36, No. 4, pp. 756-769, 2014.
[8] Y. J. Cho, S. A. Kim, J. H. Park, K. Lee, and K. J. Yoon, “Joint Person Re-identification and Camera Network Topology Inference in Multiple Camera,” arXiv:1710.00983, 2017.
[9] C. Alejandro, M. Antoni, B. Marc, and V. Jose, ”Navigation system for elderly care applications based on wireless sensor networks,” Signal Processing Conference (EUSIPCO 2012), Proceedings of the 20th European. IEEE, pp. 210-214, 2012.
[10] M. Bocca, O. Kaltiokallio, and N. Patwari, “Multiple Target Tracking with RF Sensor Networks,” IEEE Transactions on Mobile Computing, Vol. 13, No. 8, pp. 1787-1800, August, 2014.
[11] K. Komai et al., “Elderly Person Monitoring in Day Care Center using Bluetooth Low Energy,” 10th International Symposium on Medical Information and Communication Technology (ISMICT 2016), Worcester, MA, USA, pp. 140-144, 2016.
[12] M. Nishiyama et al., “Person Re-identification using Co-occurrence Attributes of Physical and Adhered Human Characteristics,” 23rd International Conference of Pattern Recognition (ICPR), pp. 2086-2091, 2016.
[13] SARC3D, http://www.openvisor.org/sarc3d.asp, April, 2020.
[14] Y. Deng, P. Luo, C. Loy, and X. Tang, “Pedestrian attribute recognition at far distance,” ACM Multimedia, pp. 3-7, 2014.
25Copyright (c) IARIA, 2020. ISBN: 978-1-61208-786-3
ICNS 2020 : The Sixteenth International Conference on Networking and Services
34 / 81
Dynamic Intrusion Deception in a Cloud Environment
Chia-Chi Teng Cybersecurity
Brigham Young University
Provo, UT, USA
email: [email protected]
Aaron Cowley
Cybersecurity
Brigham Young University
Provo, UT, USA
email: [email protected]
Ressel Havens
Cybersecurity
Brigham Young University
Provo, UT, USA
email: [email protected]
Abstract—As cyber-attacks become more sophisticated,
Network Intrusion Detection Systems also need to adapt to
counter the evolving advanced persistent threats. Security
deception, such as Honeypot, is an emerging defense tactic for
security operation in enterprise network or commercial cloud
environment. A well designed Honeypot can fool attackers and
malicious agents into a made-up system that is monitored by
security operators who can safely observe the attacks and
promptly develop counter measures. However, the availability of
Anti-Honeypot technologies has made the deception defense more
challenging. A dynamic deception method is necessary to counter
the modern Honeypot detection systems. We propose a dynamic
intrusion deception method designed to run in a public cloud
environment. A prototype of Honeynet is built using the Microsoft
Windows Azure Resource Group virtual machines and network
management platform.
Keywords—Cloud Computing; Intrusion Detection; Intrusion
Deception; Honeypot; Honeynet.
I. INTRODUCTION
Since commercial cloud computing services became available over a decade ago, the cloud computing technology platforms have made significant advancement in research and development. Public cloud providers, such as Microsoft, Amazon, Google and IBM, are offering a large variety of services from infrastructure as a service (IaaS), platform as a service (PaaS) to software as a service (SaaS). Cloud computing is now the backbone of thousands of enterprises and organizations where a 2018 industry study shows 77% of enterprises have at least one application or a portion of their Information Technology (IT) infrastructure in the cloud [1] and trending up. While the industry continues to invest in cloud computing, the study also shows that about one-third of the IT decision-makers saying security concerns is one of their top challenges.
In addition to private enterprises and business, government agencies are also embracing the cloud computing technology to support their future infrastructure and services. For example, United States Department of Defense (DoD) listed cloud computing as one of the top priorities in their Digital Modernization Strategy [2]. DoD has also recently awarded a ten-year ten billion dollar (USD) contract to Microsoft for its Joint Enterprise Defense Infrastructure (JEDI) project [3].
With all the sensitive and classified information being stored in the cloud, the security requirement has also increased. It is important to understand the threat models, attack surfaces, and available controls in the cloud environment to effectively manage the security risks [4].
Intrusion Detection System (IDS) and Intrusion Prevention System (IPS) [5] are well-known security controls commonly deployed in enterprise or cloud computing environment. They can protect target systems based on network or host activities by denying access to malicious attacks. However, IDS/IPS do not usually attempt to discover additional information about the attacks or attackers, which is the primary function of the Honeypot technology.
Honeypots are usually designed to resemble valid systems or services with exploitable vulnerabilities to lure attackers to gain access. When working in conjunction with IDS, attackers’ activities are monitored and analyzed by security operators once they are in the Honeypots. Valuable information can be discovered while an attack is taking place.
Unfortunately, Anti-Honeypot technologies have also been developed by spammers and other malicious parties to counter this defense measure. The unique capabilities of public cloud computing platforms can enable a new type of Honeypot that is more dynamic, realistic and cost effective in a way that defensive resources mimicking real targets can be instantiated and configured in real time as malicious attacks are being detected.
A design and prototype of a dynamic Honeypot system is presented below with a review of other recent work on cloud computing related Honeypot and Honeynet. As the system detects potential attacks, such as Brute-force SSH, it dynamically creates containers, re-routes malicious network traffic and actively engages with the attacker to gather information about the attack and attacker. While the preliminary work is implemented and tested on Microsoft Windows Azure platform, it can easily be ported to other public cloud providers.
II. BACKGROUND
Since the concept of Honeypot was first introduced in 1998 [6], its applications have steadily been gaining popularity and support as Honeypot evolved from a non-traditional tool to one of the commonly used security controls. For example, United States DoD Cloud Computing Security Requirement Guide [7] specifies Honeypot as one of the standard controls. Many varieties of Honeypot intrusion deception systems have been proposed over the years, which can be classified based on their level of interaction, scope, or targeted attack type [8]. A recent survey [9] of Honeypot systems in a cloud environment further classifies them based on architectures and functionalities. These cloud-based solutions include
Honeynet [10]
26Copyright (c) IARIA, 2020. ISBN: 978-1-61208-786-3
ICNS 2020 : The Sixteenth International Conference on Networking and Services
35 / 81
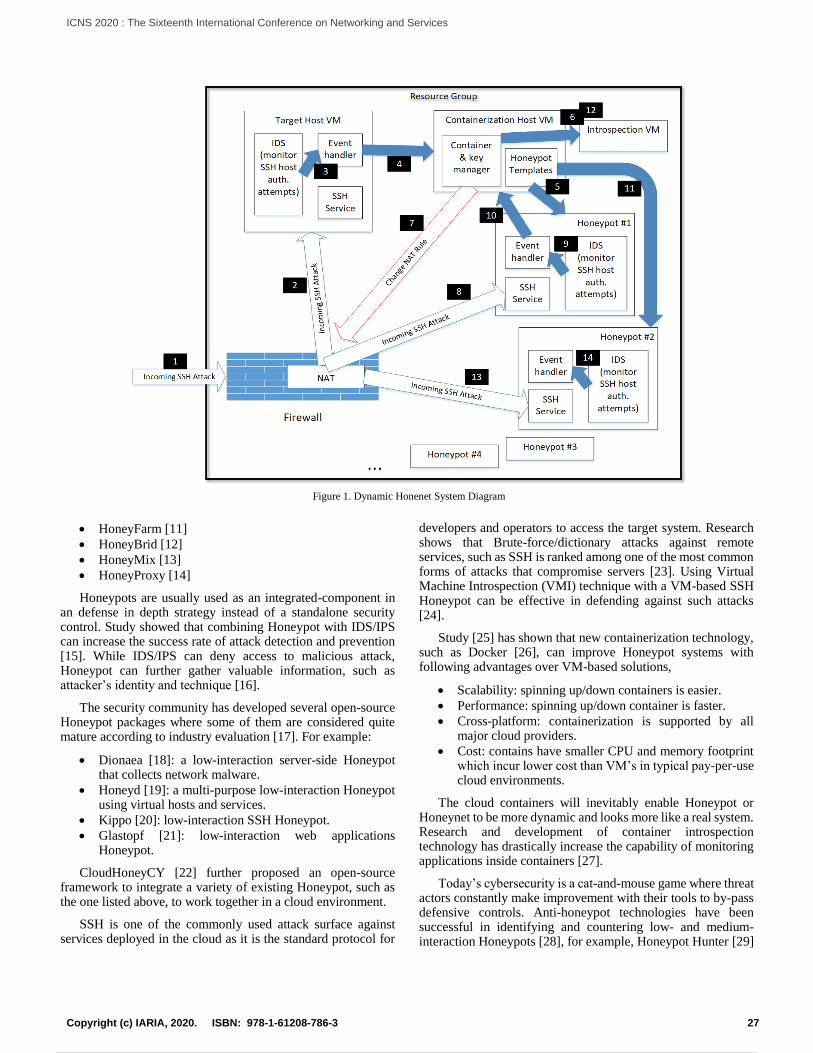
HoneyFarm [11]
HoneyBrid [12]
HoneyMix [13]
HoneyProxy [14]
Honeypots are usually used as an integrated-component in an defense in depth strategy instead of a standalone security control. Study showed that combining Honeypot with IDS/IPS can increase the success rate of attack detection and prevention [15]. While IDS/IPS can deny access to malicious attack, Honeypot can further gather valuable information, such as attacker’s identity and technique [16].
The security community has developed several open-source Honeypot packages where some of them are considered quite mature according to industry evaluation [17]. For example:
Dionaea [18]: a low-interaction server-side Honeypot that collects network malware.
Honeyd [19]: a multi-purpose low-interaction Honeypot using virtual hosts and services.
Kippo [20]: low-interaction SSH Honeypot.
Glastopf [21]: low-interaction web applications Honeypot.
CloudHoneyCY [22] further proposed an open-source framework to integrate a variety of existing Honeypot, such as the one listed above, to work together in a cloud environment.
SSH is one of the commonly used attack surface against services deployed in the cloud as it is the standard protocol for
developers and operators to access the target system. Research shows that Brute-force/dictionary attacks against remote services, such as SSH is ranked among one of the most common forms of attacks that compromise servers [23]. Using Virtual Machine Introspection (VMI) technique with a VM-based SSH Honeypot can be effective in defending against such attacks [24].
Study [25] has shown that new containerization technology, such as Docker [26], can improve Honeypot systems with following advantages over VM-based solutions,
Scalability: spinning up/down containers is easier.
Performance: spinning up/down container is faster.
Cross-platform: containerization is supported by all major cloud providers.
Cost: contains have smaller CPU and memory footprint which incur lower cost than VM’s in typical pay-per-use cloud environments.
The cloud containers will inevitably enable Honeypot or Honeynet to be more dynamic and looks more like a real system. Research and development of container introspection technology has drastically increase the capability of monitoring applications inside containers [27].
Today’s cybersecurity is a cat-and-mouse game where threat actors constantly make improvement with their tools to by-pass defensive controls. Anti-honeypot technologies have been successful in identifying and countering low- and medium-interaction Honeypots [28], for example, Honeypot Hunter [29]
Figure 1. Dynamic Honenet System Diagram
27Copyright (c) IARIA, 2020. ISBN: 978-1-61208-786-3
ICNS 2020 : The Sixteenth International Conference on Networking and Services
36 / 81
has been used by spammers to identify HTTP and SOCKS Honeypot proxies. Research [30] showed that a dynamic Honeypot can be effective in defending malicious attacks.
Leveraging the previous research and the latest cloud technology available, we propose a Honeynet system with the following characteristics,
Dynamically provision and revoke Honeypots based on level of malicious network activities.
High-interactivity Honeypots with dynamically configured SSH service.
Use container technology, e.g., Docker, for increased performance and scalability.
Easily deployable in a commercial cloud platform, e.g., Microsoft Azure.
The design and implementation of the proposed system are discussed below.
III. METHODS
This dynamic Honeynet design is currently targeting commercial public cloud computing services with large user base and mature technology platform. Leading providers, such as Microsoft Azure and Amazon AWS have the concept of “resource group”, which is a logical collection of assets grouped together for effective management, such as provisioning, monitoring, and access control. The high-level design of the proposed cloud-based Honeynet system is shown in Figure 1 above in a logical resource group environment. As this system must rely on the cloud provider’s resource management interface, e.g., Azure Resource Manager or AWS Resource Access Manager, the actual implementation might be somewhat platform dependent.
A resource group can be setup to include the following collection of items,
A Firewall and programmable Network Address Translation (NAT) or reverse proxy layer.
Regular service(s) which might be the initial target(s) of an SSH brute-force attack.
A target VM containing real services which also monitors network intrusion with an IDS. Event trigger will take place when certain pre-defined malicious activity is observed.
A VM host for the containerization software run-time, e.g., Docker, which also handles the IDS event triggered by an attack then dynamically provisions and configures Honeypot accordingly.
Pre-built container template of Honeypot with SSH services and IDS.
An Introspection VM for monitoring active Honeypots.
In the scenario of a SSH brute-force attack, the following step-by-step actions will take place as labelled in Figure 1.
1) Incoming SSH brute-force attack reaches Firewall and NAT.
2) Attack traffic directed to the target host. 3) After a number of failed SSH login attempts, an IDS
event triggers indicating a SSH brute-force attack taking place.
4) The event handler invokes container host services. 5) An initial Honeypot service (#1) container is
provisioned, which hosts a simulated SSH service and a pre-configured IDS.
6) Notify the Introspection VM to begin monitoring Honeypot #1.
7) Configure NAT to redirect attacker IP’s SSH traffic to the Honeypot service.
8) Incoming SSH attacks now goes to Honeypot #1. 9) IDS detects brute-force SSH attack on Honeypot #1. 10) Invoke container service to create new Honeypot
service (#2), generate authorized key for Honeypot #2, then allow attacker to successfully connect to the simulated SSH service where host and authorization information to Honeypot #2 can be found.
11) Honeypot #2 is provisioned. 12) Notify the Introspection VM to begin monitoring
Honeypot #2. 13) Attacker attempts connection to Honeypot #2 with the
host and authentication information found in Honeypot #1.
14) IDS detects attacker’s activity on Honeypot #2 and create new Honeypots as needed.
Depending on the security operator’s objective, the steps of detecting malicious activities, provisioning and directing attacker to a new Honeypot can be repeated as needed until certain information about the attacker is discovered, or until the attacker become inactive. The operator can configure the Honeynet based on available resources and desired level of interactivity.
The event handler in the Honeypots can be configured with a timer where it initiates the process of self-revocation or de-provision of the container if certain amount of time elapsed without the attacker actively engaged. The automated Honeypot provision and revocation feature can potentially make the Honeynet more dynamic and better at countering anti-Honeypot technology.
IV. RESULTS
Base on the design described above, a functioning prototype is successfully implemented with the following specifications as shown in Figure 2.
Cloud computing platform: Microsoft Windows Azure with Azure Virtual Network, Azure Resource Group and Resource Manager.
Target Host: Ubuntu Linux server running OpenSSH Daemon (sshd).
IDS: Zeek (formerly Bro) Network Security Monitor.
Network Address Translation (NAT): Azure Service Fabric Reverse Proxy.
Container Host: Docker and its Command-Line Interface (CLI), such as “docker run” and “docker cp”.
28Copyright (c) IARIA, 2020. ISBN: 978-1-61208-786-3
ICNS 2020 : The Sixteenth International Conference on Networking and Services
37 / 81
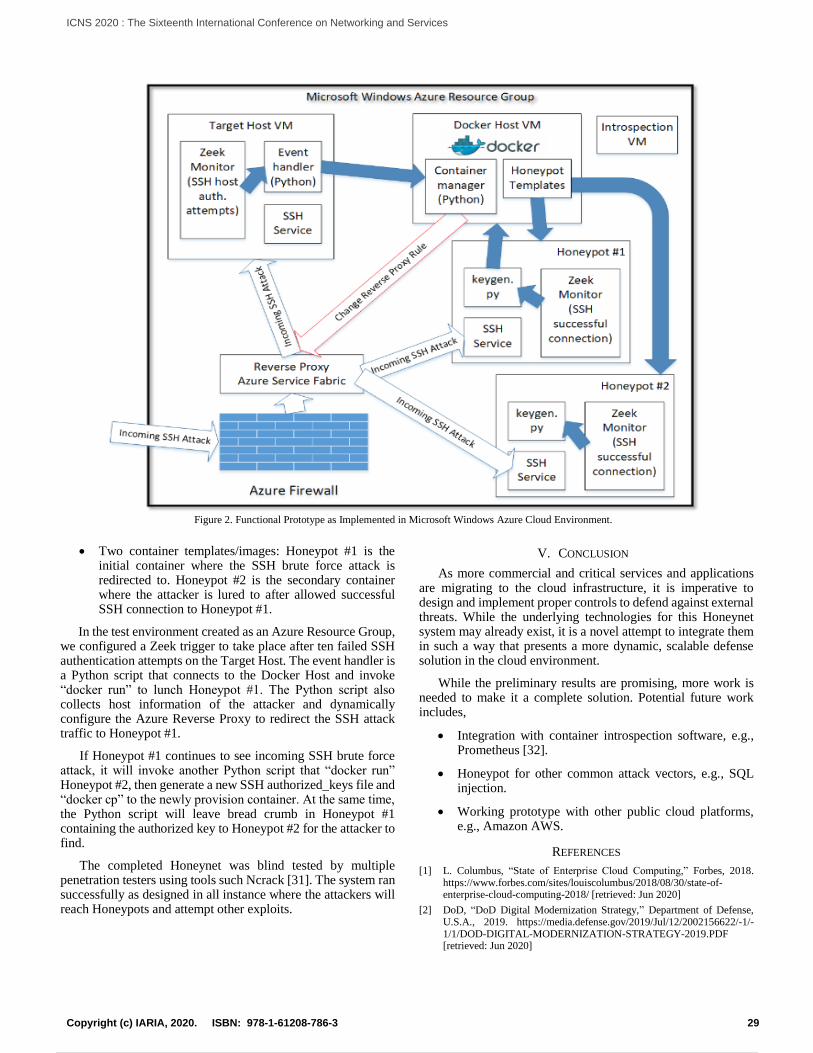
Two container templates/images: Honeypot #1 is the initial container where the SSH brute force attack is redirected to. Honeypot #2 is the secondary container where the attacker is lured to after allowed successful SSH connection to Honeypot #1.
In the test environment created as an Azure Resource Group, we configured a Zeek trigger to take place after ten failed SSH authentication attempts on the Target Host. The event handler is a Python script that connects to the Docker Host and invoke “docker run” to lunch Honeypot #1. The Python script also collects host information of the attacker and dynamically configure the Azure Reverse Proxy to redirect the SSH attack traffic to Honeypot #1.
If Honeypot #1 continues to see incoming SSH brute force attack, it will invoke another Python script that “docker run” Honeypot #2, then generate a new SSH authorized_keys file and “docker cp” to the newly provision container. At the same time, the Python script will leave bread crumb in Honeypot #1 containing the authorized key to Honeypot #2 for the attacker to find.
The completed Honeynet was blind tested by multiple penetration testers using tools such Ncrack [31]. The system ran successfully as designed in all instance where the attackers will reach Honeypots and attempt other exploits.
V. CONCLUSION
As more commercial and critical services and applications are migrating to the cloud infrastructure, it is imperative to design and implement proper controls to defend against external threats. While the underlying technologies for this Honeynet system may already exist, it is a novel attempt to integrate them in such a way that presents a more dynamic, scalable defense solution in the cloud environment.
While the preliminary results are promising, more work is needed to make it a complete solution. Potential future work includes,
Integration with container introspection software, e.g., Prometheus [32].
Honeypot for other common attack vectors, e.g., SQL injection.
Working prototype with other public cloud platforms, e.g., Amazon AWS.
REFERENCES
[1] L. Columbus, “State of Enterprise Cloud Computing,” Forbes, 2018. https://www.forbes.com/sites/louiscolumbus/2018/08/30/state-of-enterprise-cloud-computing-2018/ [retrieved: Jun 2020]
[2] DoD, “DoD Digital Modernization Strategy,” Department of Defense, U.S.A., 2019. https://media.defense.gov/2019/Jul/12/2002156622/-1/-1/1/DOD-DIGITAL-MODERNIZATION-STRATEGY-2019.PDF [retrieved: Jun 2020]
Figure 2. Functional Prototype as Implemented in Microsoft Windows Azure Cloud Environment.
29Copyright (c) IARIA, 2020. ISBN: 978-1-61208-786-3
ICNS 2020 : The Sixteenth International Conference on Networking and Services
38 / 81
[3] Congressional Research Service, “DOD’s Cloud Strategy and the JEDI Cloud Procurement,” 2019. https://fas.org/sgp/crs/natsec/IF11264.pdf [retrieved: Jun 2020]
[4] N. Afshan, “Analysis and Assessment of the Vulnerabilities in Cloud Computing,” International Journal of Advanced Research in Computer Science, vol. 8, no. 2, 2017.
[5] M. Rani and Gagandeep, “A Review of Intrusion Detection System in Cloud Computing,” in proceedings International Conference on Sustainable Computing in Science, Technology & Management (SUSCOM 2019), pp. 770-776, 2019.
[6] F. Cohen, “The Deception Toolkit,” Risks Digest vol. 19, 1998.
[7] DoD, “Department of Defense Cloud Computing Security Requirement Guide,” Defense Information Systems Agency, U.S.A., 2017. https://rmf.org/wp-content/uploads/2018/05/Cloud_Computing_SRG_v1r3.pdf [retrieved: Jun 2020]
[8] C. K. Ng, L. Pan, and Y. Xiang, “Honeypot Frameworks and Their Applications: A New Framework,” Springer Briefs on Cyber Security Systems and Networks, 2018.
[9] S. Krishnaveni, S. Prabakaran, and S. Sivamohan, “A Survey on Honeypot and Honeynet Systems for Intrusion Detection in Cloud Environment,” Journal of Computational and Theoretical Nanoscience, vol. 15, pp. 2949-2935, 2018.
[10] L. Spitzner, “The Honeynet Project: Trapping the Hackers,” IEEE Security & Privacy, vol. 1, no. 2, pp. 15-23, 2003.
[11] L. Spitzner, “Honeypot Farms,” Symantec, 2003. https://www.symantec.com/connect/articles/honeypot-farms [retrieved: Jun 2020]
[12] R. Bertheir, “HoneyBrid: Combining Low and High Interaction Honeypots,” Honeynet, 2009. https://www.honeynet.org/2009/05/27/honeybrid-combining-low-and-high-interaction-honeypots/ [retrieved: Jun 2020]
[13] W. Han, Z. Zhao, A. Doupe, and G. J. Ahn, “HoneyMix: Toward SDN-based Intelligent Honeynet,” in proceedings 2016 ACM International Workshop on Security in Software Defined Networks & Network Function Virtualization (SDN-NFV Security '16), pp. 1-6, 2016.
[14] S. Kyung et al., “HoneyProxy: Design and implementation of next-generation honeynet via SDN,” In proceedings 2017 IEEE Conference on Communications and Network Security (CNS 2017), pp. 1-9, 2017.
[15] S. Ravji and M. Ali, “Integrated Intrusion Detection and Prevention System with Honeypot in Cloud Computing,” in proceedings 2018 International Conference on Computing, Electronics & Communications Engineering (iCCECE), pp. 95-100, 2018.
[16] P. A. Pandire and V. B. Gaikwad, “Attack Detection in Cloud Virtual Environment and Prevention using Honeypot,” in proceedings of the International Conference on Inventive Research Applications (ICIRCA 2018), pp. 515-520, 2018.
[17] C. Polska, “Proactive Detection of Security incidents: Honeypots,” ENISA, Tech. Rep., 2012.
[18] Dionaea, http://dionaea.carnivore.it/ [retrieved: Jun 2020]
[19] Honeyd, http://www.honeyd.org/ [retrieved: Jun 2020]
[20] Kippo, https://github.com/desaster/kippo/ [retrieved: Jun 2020]
[21] Glastopf, http://glastopf.org/ [retrieved: Jun 2020]
[22] H. Gjermundrod and I. Dionysiou, “CloudHoneyCY - An Integrated Honeypot Framework for Cloud Infrastructures,” in proceedings 2015 IEEE/ACM 8th International Conference on Utility and Cloud Computing, pp. 630-635, 2015.
[23] V. Singh and S. K. Pandey, “Revisiting Cloud Security Threat: Dictionary Attack,” in proceedings of International Conference on Advancements in Computing & Management (ICACM 2019), pp. 175-180, 2019.
[24] S. Sentanoe, B. Taubmann, and H. P. Reiser, “Virtual Machine Introspection Based SSH Honeypot,” in proceedings of the 4th Workshop on Security in Highly Connected IT Systems (SHCIS’17), pp. 13-18, 2017.
[25] N. Majithia, “Honey-System: Design, Implementation and Attack Analysis,” PhD Thesis, Indian Institute of Technology, Kanpur, 2017.
[26] M. N. Khandhar and M. S. Shah, “Docker-The Future of Virtualization,” International Journal of Research and Analytical Reviews, 6(2), pp. 164–167, 2019.
[27] T. Watts, R. G. Benton, W. B. Glisson, and J. Shropshire, “Insight from a Docker Container Introspection,” in proceedings of the 52nd Hawaii International Conference on System Sciences (HICSS 2019), pp. 7194-7203, 2019.
[28] J. Uitto, S. Rauti, S. Laurén, and V. Leppänen, “A Survey on Anti-honeypot and Anti-Introspection Methods,” Recent Advances in Information Systems and Technologies. WorldCIST 2017. Advances in Intelligent Systems and Computing, vol. 570, Springer, 2017.
[29] N. Krawetz, “Anti-Honeypot Technology,” IEEE Security & Privacy, vol. 2, no. 1, pp. 76-79, 2004.
[30] K. R. Sekar, V. Gayathri, G. Anisha, K. S. Ravichandran, and R. Manikandan, “Dynamic Honeypot Configuration for Intrusion Detection,” in proceedings 2nd International Conference on Trends in Electronics and Informatics (ICOEI 2018), pp. 1397-1401, 2018.
[31] Ncrack, https://nmap.org/ncrack/ [retrieved: Jun 2020]
[32] Prometheus, https://prometheus.io/ [retrieved: Jun 2020]
30Copyright (c) IARIA, 2020. ISBN: 978-1-61208-786-3
ICNS 2020 : The Sixteenth International Conference on Networking and Services
39 / 81
On Business Models for Vehicle-to-Everything Systems Based on 5G Slicing
Eugen Borcoci, Marius Vochin, Serban Georgica Obreja University POLITEHNICA of Bucharest - UPB
Bucharest, Romania Emails: [email protected], [email protected], [email protected]
Abstract—Vehicle-to-Everything (V2X) and Internet of Vehicles are complex multi-actor systems offering to vehicles capabilities to exchange data with other entities (vehicles, infrastructure, grid, pedestrians, etc.) The V2X services aim to improve the transport, safety and comfort on the roads and also to help autonomous driving. The 5G technology can provide a powerful support for V2X, in multi-tenant, multi-domain, multi-operator and end-to-end contexts. Particularly, the 5G slicing technology is able to construct dedicated slices, to serve V2X needs. The complexity of the V2X systems and the multitude of visions led to proposal of many variants of V2X business models and ecosystems, comprising several cooperating actors. The business models are important, given that they essentially determines the requirements and architectures; for V2X systems and is still an open research topic. This work in progress attempts to analyze some relevant business models for 5G slicing and discuss how they can be adapted for rich V2X environment. The paper can help the reader to understand what are the possible stakeholders sets in the V2X complex environment, their interactions and to define the architecture followed by the design of a particular V2X system.
Keywords—Vehicle-to-Everthing; 2X; 5G slicing; Business
models; Stakeholders; Management and Orchestration; Software Defined Networking; Network Function Virtualization; Service management.
I. INTRODUCTION
The Vehicle-to-Everything (V2X) communications and services include many use cases in single or multi-tenancy, multi-operator and multi-domain contexts. Consequently, different sets of service requirements exist, e.g., from enhanced real-time navigation systems on board, to a self-automated car, or a video streaming played on the in-vehicle infotainment system.
The basic vehicular communications have covered essentially vehicle-to-vehicle (V2V) and vehicle-to-road/infrastructure (V2R/V2I) communications. Recently, extended models and services are included in the V2X umbrella, like: vehicle-to-pedestrian (V2P) - direct communication, vehicle-to-vulnerable road user (VRU), vehicle-to-network (V2N) - including cellular networks and Internet, Vehicle to sensors (V2S), vehicle-to-power grid (V2G) and vehicle-to-home (V2H).
V2X allows vehicles to directly communicate with each other, to roadside infrastructure, and to other road users for the benefit of better road safety, traffic efficiency, smart
mobility, environmental sustainability, and driver convenience. V2X contributes to fully autonomous driving development through its unique non-line-of-sight sensing capability which allows vehicles to detect potential hazards, traffic, and road conditions from longer distances. Typical use cases and services/applications for V2X comprise: active road safety applications (including autonomous driving); warnings, notifications, assistance; traffic efficiency and management applications; infotainment applications. Therefore, IoV extends the traditional basic functions like vehicles driving and safety to novel target domains such as enhanced traffic management, automobile production, repair and vehicle insurance, road infrastructure construction and repair, logistics and transportation, etc.
Internet of Vehicles (IoV) is an extension of the V2X, aiming to create a global network of vehicles – enabled by various Wireless Access Technologies (WAT) [1][2]. It involves the Internet and includes heterogeneous access networks. IoV can be seen as a special use case of Internet of Things (IoT); however, IoV contains intelligent “terminals” such as vehicles (maybe some of them - autonomous). The complexity of the V2X/IoV claims for a strong support infrastructure. The 5G slicing technology is considered to be an appropriate candidate.
The 5G mobile network technologies offer powerful features, in terms of capacity, speed, flexibility and services, to answer the increasing demand and challenges addressed to communication systems and Internet [3]-[5]. 5G can provide specific types of services to simultaneously satisfy various customer/tenant demands in a multi-x fashion (the notation –x stands for: tenant, domain, operator and provider).
The 5G network slicing concept (based on virtualization and softwarization) enables programmability and modularity for network resources provisioning, adapted to different vertical service requirements (in terms of bandwidth, latency, mobility, etc.) [6]-[9]. In a general view, a Network Slice (NSL) is a managed logical group of subsets of resources, organized as virtual dedicated networks, isolated from each other (w.r.t. performance and security), but sharing the same infrastructure. The NSLs functionalities are implemented by Physical/Virtual network functions (PNFs/VNFs), chained in graphs, in order to compose services dedicated to different sets of users. The slices are programmable and have the ability to expose their capabilities to the users. The actual run-time execution
31Copyright (c) IARIA, 2020. ISBN: 978-1-61208-786-3
ICNS 2020 : The Sixteenth International Conference on Networking and Services
40 / 81
entities are instantiated slices, whose life cycles are controlled by the management and control entities belonging to the Management, Orchestration and Control Plane (MO&C). The Network Function Virtualization (NFV)[10]-[13] and Software Defined Networks (SDN) technologies can cooperate [14] to manage, orchestrate and control the 5G sliced environment, in a flexible and programmable way. The 3GPP [4][5] has defined three fundamental categories of 5G slice scenarios: Massive machine type communication (mMTC); Ultra reliability low latency communication (URLLC); Enhanced mobile broadband (eMBB).
The 5G slicing is considered to be a strong candidate to fulfill the requirements of V2X systems. Several studies and projects deal with development of V2X systems based on 5G sliced infrastructure; some examples are [15]-[19]. The dedicated 5G slices can provide the required capabilities for multiple tenants, while working over a 5G shared infrastructure. However, it is recognized [15][16], that the heterogeneous and complex features of V2X services neither allow the straightforward mapping of them onto basic reference slice types – like eMBB, URLLC and mMTC services, nor the mapping into a single V2X slice. Additional customization is necessary in order to create V2X dedicated slices.
The V2X/IoV systems are highly complex, involving several technical and organizational entities which cooperate in a business ecosystem. Generally, a business ecosystem is a network of organizations/stakeholders such as suppliers, distributors, customers, competitors, government agencies, etc., involved in the delivery of a specific product or service through both competition and cooperation. The entities/stakeholders/actors interact with each other, in order to achieve together the goals of the system. An equivalent term is Business Model (BM) to define the set of stakeholders and their interactions.
In a V2X ecosystem new actors are involved, besides traditional Internet and network/service providers or operators. These new actors could be road authorities, municipalities, regulators and vehicle manufacturers Original Equipment Manufacturers (OEM).
The development of the 5G complex sliced systems supposes to initially define the BMs, which essentially determines the roles and responsibilities of the entities and then the system requirements and architecture. This need is equally true for V2X systems and today it is still an open research topic. Concerning V2X BMs, it is recognized (see 5G PPP Automotive Working Group, Business Feasibility Study for 5G V2X Deployment [22]) that there is still some lack of insights into the required rollout conditions, roles of different stakeholders, investments, business models and expected profit from Connected and Automated Mobility (CAM) services. On the other side, the general BMs for 5G sliced networks should be adapted and refined in order to well serve the V2X system’s needs.
Considering the above reasons, this work in progress attempts to analyze some relevant BMs for 5G slicing and discuss how they can be adapted for V2X environment.
Due to space limitation, this text cannot afford to offer detailed explanations about the BMs presented; the objective is to identify the major points of similarity of different BMs for 5G slicing, then 5G-V2X approaches and to study their possible mapping. The paper contribution is mainly an overview and comparison of different solutions.
The paper structure is described below. Section II outlines the stakeholder roles in 5G slicing, given that such definitions determine essentially the overall system architecture. Section III refines the general BMs to be adapted to 5G V2X communications and services. Section IV performs an analysis of some factors that lead to different V2X-5G business models. Section VI summarizes conclusions and future work.
II. BUSINESS MODEL AND STAKEHOLDER ROLES IN 5G
SLICING
The objective of this section is to present a few relevant BMs proposed for 5G sliced systems and to identify the main roles of actors, in order to prepare their customization for V2X case in the next section. The layered architecture of the 5G slicing strongly depends on the stakeholder roles defined by the BM. Different BMs have been proposed, aiming to support multi-tenant, multi-domain end-to-end (E2E) and multi-operator capabilities in various contexts. Several examples are summarized below.
A. Example 1
A basic model (see A. Galis, [7]) defines four main roles:
End User (EU): consumes (part of) the services supplied by the slice tenant, without providing them to other business actors.
Slice Tenant (SLT): is the generic user of a specific slice, including network/cloud/data centers, which can host customized services. A SLT can request from a Network Slice Provider (NSLP) to create a new slice instance dedicated to support some SLT specific services. The SLT can lease virtual resources from one or more NSLPs in the form of a virtual network, where the tenant can realize, manage and then provide Network Services (NS) to its individual end users. A NS is a composition of Network Functions (NFs), defined in terms of the individual NFs and the mechanism used to connect them. A single tenant may define and run one or several slices in its domain.
Network Slice Provider (NSLP): can be typically a telecommunication service provider (owner or tenant of the infrastructures from which network slices are constructed). The NSLP can construct multi-tenant, multi-domain slices, on top of infrastructures offered by one or several InPs.
Infrastructure Provider (InP): owns and manages the physical infrastructure (network/cloud/data centre). It could lease its infrastructure (as it is) to a slice provider, or it can itself construct slices (the BM is flexible) and then lease the infrastructure in network slicing fashion.
Note that the scope of the above model is limited; it is operational only, i.e., it does not detail all external entities of the overall ecosystem, which may have strong impact on
32Copyright (c) IARIA, 2020. ISBN: 978-1-61208-786-3
ICNS 2020 : The Sixteenth International Conference on Networking and Services
41 / 81
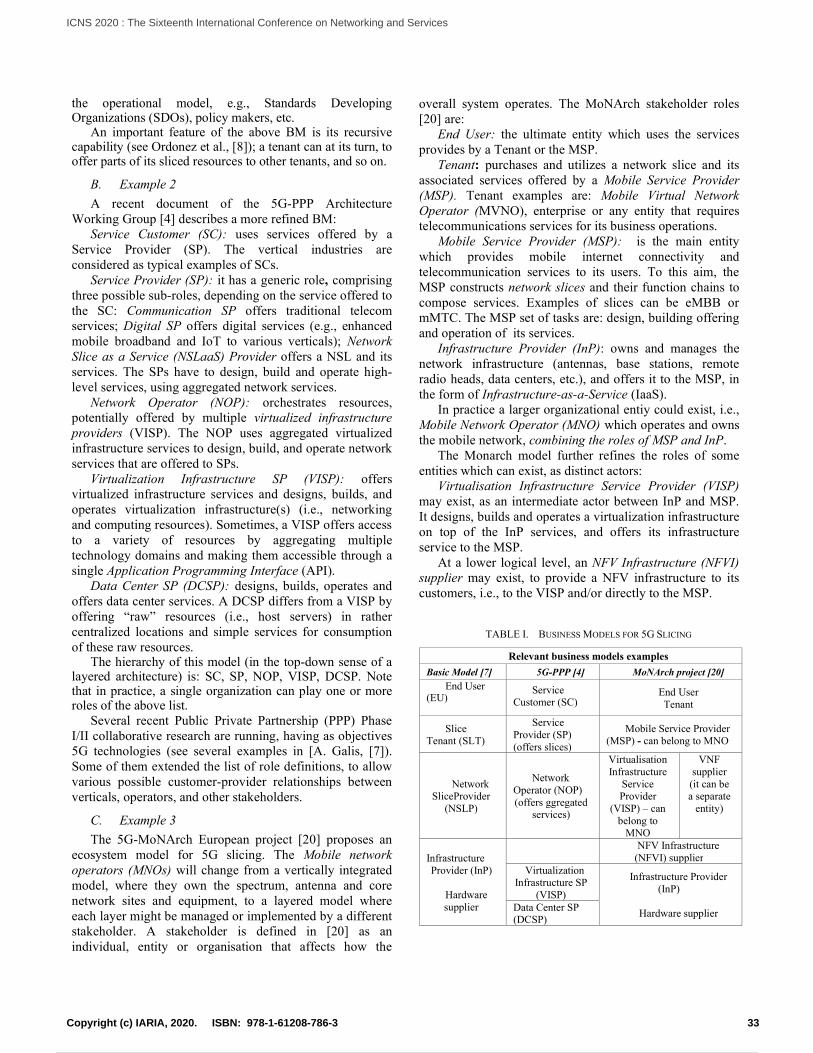
the operational model, e.g., Standards Developing Organizations (SDOs), policy makers, etc.
An important feature of the above BM is its recursive capability (see Ordonez et al., [8]); a tenant can at its turn, to offer parts of its sliced resources to other tenants, and so on.
B. Example 2
A recent document of the 5G-PPP Architecture Working Group [4] describes a more refined BM:
Service Customer (SC): uses services offered by a Service Provider (SP). The vertical industries are considered as typical examples of SCs.
Service Provider (SP): it has a generic role, comprising three possible sub-roles, depending on the service offered to the SC: Communication SP offers traditional telecom services; Digital SP offers digital services (e.g., enhanced mobile broadband and IoT to various verticals); Network Slice as a Service (NSLaaS) Provider offers a NSL and its services. The SPs have to design, build and operate high-level services, using aggregated network services.
Network Operator (NOP): orchestrates resources, potentially offered by multiple virtualized infrastructure providers (VISP). The NOP uses aggregated virtualized infrastructure services to design, build, and operate network services that are offered to SPs.
Virtualization Infrastructure SP (VISP): offers virtualized infrastructure services and designs, builds, and operates virtualization infrastructure(s) (i.e., networking and computing resources). Sometimes, a VISP offers access to a variety of resources by aggregating multiple technology domains and making them accessible through a single Application Programming Interface (API).
Data Center SP (DCSP): designs, builds, operates and offers data center services. A DCSP differs from a VISP by offering “raw” resources (i.e., host servers) in rather centralized locations and simple services for consumption of these raw resources.
The hierarchy of this model (in the top-down sense of a layered architecture) is: SC, SP, NOP, VISP, DCSP. Note that in practice, a single organization can play one or more roles of the above list.
Several recent Public Private Partnership (PPP) Phase I/II collaborative research are running, having as objectives 5G technologies (see several examples in [A. Galis, [7]). Some of them extended the list of role definitions, to allow various possible customer-provider relationships between verticals, operators, and other stakeholders.
C. Example 3
The 5G-MoNArch European project [20] proposes an ecosystem model for 5G slicing. The Mobile network operators (MNOs) will change from a vertically integrated model, where they own the spectrum, antenna and core network sites and equipment, to a layered model where each layer might be managed or implemented by a different stakeholder. A stakeholder is defined in [20] as an individual, entity or organisation that affects how the
overall system operates. The MoNArch stakeholder roles [20] are:
End User: the ultimate entity which uses the services provides by a Tenant or the MSP.
Tenant: purchases and utilizes a network slice and its associated services offered by a Mobile Service Provider (MSP). Tenant examples are: Mobile Virtual Network Operator (MVNO), enterprise or any entity that requires telecommunications services for its business operations.
Mobile Service Provider (MSP): is the main entity which provides mobile internet connectivity and telecommunication services to its users. To this aim, the MSP constructs network slices and their function chains to compose services. Examples of slices can be eMBB or mMTC. The MSP set of tasks are: design, building offering and operation of its services.
Infrastructure Provider (InP): owns and manages the network infrastructure (antennas, base stations, remote radio heads, data centers, etc.), and offers it to the MSP, in the form of Infrastructure-as-a-Service (IaaS).
In practice a larger organizational entiy could exist, i.e., Mobile Network Operator (MNO) which operates and owns the mobile network, combining the roles of MSP and InP.
The Monarch model further refines the roles of some entities which can exist, as distinct actors:
Virtualisation Infrastructure Service Provider (VISP) may exist, as an intermediate actor between InP and MSP. It designs, builds and operates a virtualization infrastructure on top of the InP services, and offers its infrastructure service to the MSP.
At a lower logical level, an NFV Infrastructure (NFVI) supplier may exist, to provide a NFV infrastructure to its customers, i.e., to the VISP and/or directly to the MSP.
TABLE I. BUSINESS MODELS FOR 5G SLICING
Relevant business models examples
Basic Model [7] 5G-PPP [4] MoNArch project [20]
End User (EU)
Service Customer (SC)
End User Tenant
Slice Tenant (SLT)
Service Provider (SP) (offers slices)
Mobile Service Provider (MSP) - can belong to MNO
Network SliceProvider
(NSLP)
Network Operator (NOP) (offers ggregated
services)
Virtualisation Infrastructure
Service Provider
(VISP) – can belong to
MNO
VNF supplier
(it can be a separate
entity)
Infrastructure Provider (InP)
Hardware supplier
NFV Infrastructure
(NFVI) supplier Virtualization
Infrastructure SP (VISP)
Infrastructure Provider (InP)
Hardware supplier Data Center SP
(DCSP)
33Copyright (c) IARIA, 2020. ISBN: 978-1-61208-786-3
ICNS 2020 : The Sixteenth International Conference on Networking and Services
42 / 81
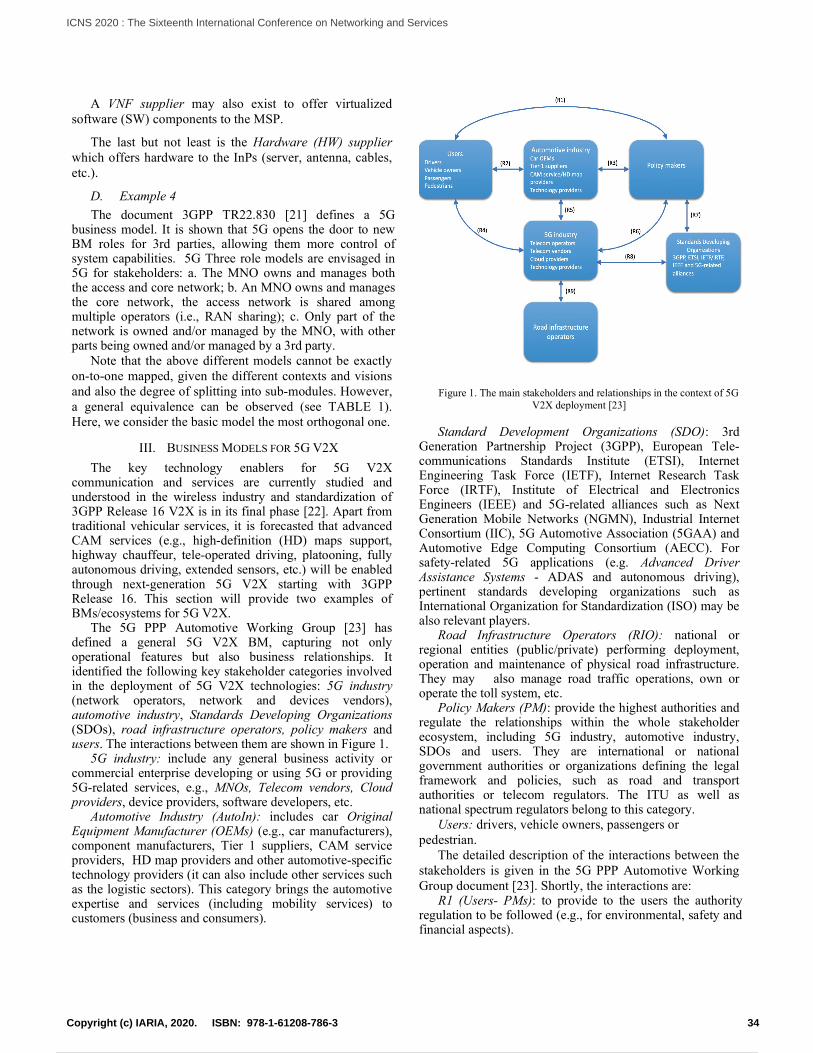
A VNF supplier may also exist to offer virtualized software (SW) components to the MSP.
The last but not least is the Hardware (HW) supplier which offers hardware to the InPs (server, antenna, cables, etc.).
D. Example 4
The document 3GPP TR22.830 [21] defines a 5G business model. It is shown that 5G opens the door to new BM roles for 3rd parties, allowing them more control of system capabilities. 5G Three role models are envisaged in 5G for stakeholders: a. The MNO owns and manages both the access and core network; b. An MNO owns and manages the core network, the access network is shared among multiple operators (i.e., RAN sharing); c. Only part of the network is owned and/or managed by the MNO, with other parts being owned and/or managed by a 3rd party.
Note that the above different models cannot be exactly on-to-one mapped, given the different contexts and visions and also the degree of splitting into sub-modules. However, a general equivalence can be observed (see TABLE 1). Here, we consider the basic model the most orthogonal one.
III. BUSINESS MODELS FOR 5G V2X
The key technology enablers for 5G V2X communication and services are currently studied and understood in the wireless industry and standardization of 3GPP Release 16 V2X is in its final phase [22]. Apart from traditional vehicular services, it is forecasted that advanced CAM services (e.g., high-definition (HD) maps support, highway chauffeur, tele-operated driving, platooning, fully autonomous driving, extended sensors, etc.) will be enabled through next-generation 5G V2X starting with 3GPP Release 16. This section will provide two examples of BMs/ecosystems for 5G V2X.
The 5G PPP Automotive Working Group [23] has defined a general 5G V2X BM, capturing not only operational features but also business relationships. It identified the following key stakeholder categories involved in the deployment of 5G V2X technologies: 5G industry (network operators, network and devices vendors), automotive industry, Standards Developing Organizations (SDOs), road infrastructure operators, policy makers and users. The interactions between them are shown in Figure 1.
5G industry: include any general business activity or commercial enterprise developing or using 5G or providing 5G-related services, e.g., MNOs, Telecom vendors, Cloud providers, device providers, software developers, etc.
Automotive Industry (AutoIn): includes car Original Equipment Manufacturer (OEMs) (e.g., car manufacturers), component manufacturers, Tier 1 suppliers, CAM service providers, HD map providers and other automotive-specific technology providers (it can also include other services such as the logistic sectors). This category brings the automotive expertise and services (including mobility services) to customers (business and consumers).
Figure 1. The main stakeholders and relationships in the context of 5G V2X deployment [23]
Standard Development Organizations (SDO): 3rd Generation Partnership Project (3GPP), European Tele-communications Standards Institute (ETSI), Internet Engineering Task Force (IETF), Internet Research Task Force (IRTF), Institute of Electrical and Electronics Engineers (IEEE) and 5G-related alliances such as Next Generation Mobile Networks (NGMN), Industrial Internet Consortium (IIC), 5G Automotive Association (5GAA) and Automotive Edge Computing Consortium (AECC). For safety-related 5G applications (e.g. Advanced Driver Assistance Systems - ADAS and autonomous driving), pertinent standards developing organizations such as International Organization for Standardization (ISO) may be also relevant players.
Road Infrastructure Operators (RIO): national or regional entities (public/private) performing deployment, operation and maintenance of physical road infrastructure. They may also manage road traffic operations, own or operate the toll system, etc.
Policy Makers (PM): provide the highest authorities and regulate the relationships within the whole stakeholder ecosystem, including 5G industry, automotive industry, SDOs and users. They are international or national government authorities or organizations defining the legal framework and policies, such as road and transport authorities or telecom regulators. The ITU as well as national spectrum regulators belong to this category.
Users: drivers, vehicle owners, passengers or pedestrian.
The detailed description of the interactions between the stakeholders is given in the 5G PPP Automotive Working Group document [23]. Shortly, the interactions are:
R1 (Users- PMs): to provide to the users the authority regulation to be followed (e.g., for environmental, safety and financial aspects).
34Copyright (c) IARIA, 2020. ISBN: 978-1-61208-786-3
ICNS 2020 : The Sixteenth International Conference on Networking and Services
43 / 81
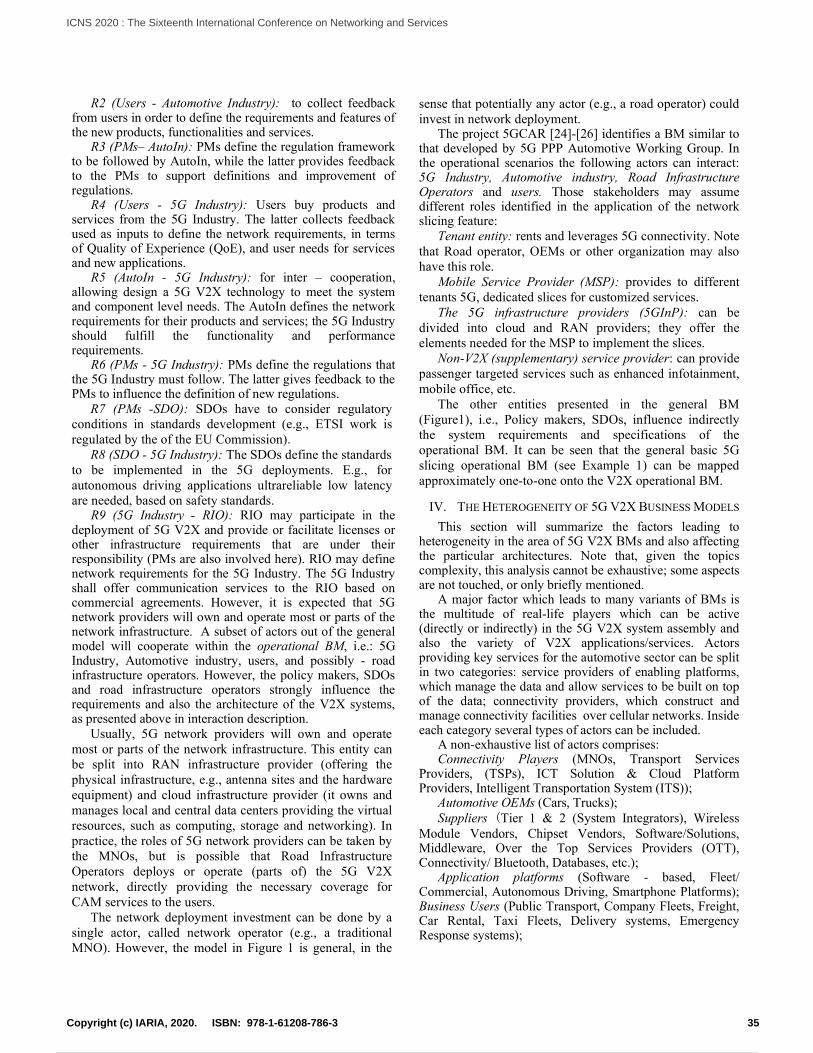
R2 (Users - Automotive Industry): to collect feedback from users in order to define the requirements and features of the new products, functionalities and services.
R3 (PMs– AutoIn): PMs define the regulation framework to be followed by AutoIn, while the latter provides feedback to the PMs to support definitions and improvement of regulations.
R4 (Users - 5G Industry): Users buy products and services from the 5G Industry. The latter collects feedback used as inputs to define the network requirements, in terms of Quality of Experience (QoE), and user needs for services and new applications.
R5 (AutoIn - 5G Industry): for inter – cooperation, allowing design a 5G V2X technology to meet the system and component level needs. The AutoIn defines the network requirements for their products and services; the 5G Industry should fulfill the functionality and performance requirements.
R6 (PMs - 5G Industry): PMs define the regulations that the 5G Industry must follow. The latter gives feedback to the PMs to influence the definition of new regulations.
R7 (PMs -SDO): SDOs have to consider regulatory conditions in standards development (e.g., ETSI work is regulated by the of the EU Commission).
R8 (SDO - 5G Industry): The SDOs define the standards to be implemented in the 5G deployments. E.g., for autonomous driving applications ultrareliable low latency are needed, based on safety standards.
R9 (5G Industry - RIO): RIO may participate in the deployment of 5G V2X and provide or facilitate licenses or other infrastructure requirements that are under their responsibility (PMs are also involved here). RIO may define network requirements for the 5G Industry. The 5G Industry shall offer communication services to the RIO based on commercial agreements. However, it is expected that 5G network providers will own and operate most or parts of the network infrastructure. A subset of actors out of the general model will cooperate within the operational BM, i.e.: 5G Industry, Automotive industry, users, and possibly - road infrastructure operators. However, the policy makers, SDOs and road infrastructure operators strongly influence the requirements and also the architecture of the V2X systems, as presented above in interaction description.
Usually, 5G network providers will own and operate most or parts of the network infrastructure. This entity can be split into RAN infrastructure provider (offering the physical infrastructure, e.g., antenna sites and the hardware equipment) and cloud infrastructure provider (it owns and manages local and central data centers providing the virtual resources, such as computing, storage and networking). In practice, the roles of 5G network providers can be taken by the MNOs, but is possible that Road Infrastructure Operators deploys or operate (parts of) the 5G V2X network, directly providing the necessary coverage for CAM services to the users.
The network deployment investment can be done by a single actor, called network operator (e.g., a traditional MNO). However, the model in Figure 1 is general, in the
sense that potentially any actor (e.g., a road operator) could invest in network deployment.
The project 5GCAR [24]-[26] identifies a BM similar to that developed by 5G PPP Automotive Working Group. In the operational scenarios the following actors can interact: 5G Industry, Automotive industry, Road Infrastructure Operators and users. Those stakeholders may assume different roles identified in the application of the network slicing feature:
Tenant entity: rents and leverages 5G connectivity. Note that Road operator, OEMs or other organization may also have this role.
Mobile Service Provider (MSP): provides to different tenants 5G, dedicated slices for customized services.
The 5G infrastructure providers (5GInP): can be divided into cloud and RAN providers; they offer the elements needed for the MSP to implement the slices.
Non-V2X (supplementary) service provider: can provide passenger targeted services such as enhanced infotainment, mobile office, etc.
The other entities presented in the general BM (Figure1), i.e., Policy makers, SDOs, influence indirectly the system requirements and specifications of the operational BM. It can be seen that the general basic 5G slicing operational BM (see Example 1) can be mapped approximately one-to-one onto the V2X operational BM.
IV. THE HETEROGENEITY OF 5G V2X BUSINESS MODELS
This section will summarize the factors leading to heterogeneity in the area of 5G V2X BMs and also affecting the particular architectures. Note that, given the topics complexity, this analysis cannot be exhaustive; some aspects are not touched, or only briefly mentioned.
A major factor which leads to many variants of BMs is the multitude of real-life players which can be active (directly or indirectly) in the 5G V2X system assembly and also the variety of V2X applications/services. Actors providing key services for the automotive sector can be split in two categories: service providers of enabling platforms, which manage the data and allow services to be built on top of the data; connectivity providers, which construct and manage connectivity facilities over cellular networks. Inside each category several types of actors can be included.
A non-exhaustive list of actors comprises: Connectivity Players (MNOs, Transport Services
Providers, (TSPs), ICT Solution & Cloud Platform Providers, Intelligent Transportation System (ITS));
Automotive OEMs (Cars, Trucks); Suppliers (Tier 1 & 2 (System Integrators), Wireless
Module Vendors, Chipset Vendors, Software/Solutions, Middleware, Over the Top Services Providers (OTT), Connectivity/ Bluetooth, Databases, etc.);
Application platforms (Software - based, Fleet/ Commercial, Autonomous Driving, Smartphone Platforms); Business Users (Public Transport, Company Fleets, Freight, Car Rental, Taxi Fleets, Delivery systems, Emergency Response systems);
35Copyright (c) IARIA, 2020. ISBN: 978-1-61208-786-3
ICNS 2020 : The Sixteenth International Conference on Networking and Services
44 / 81
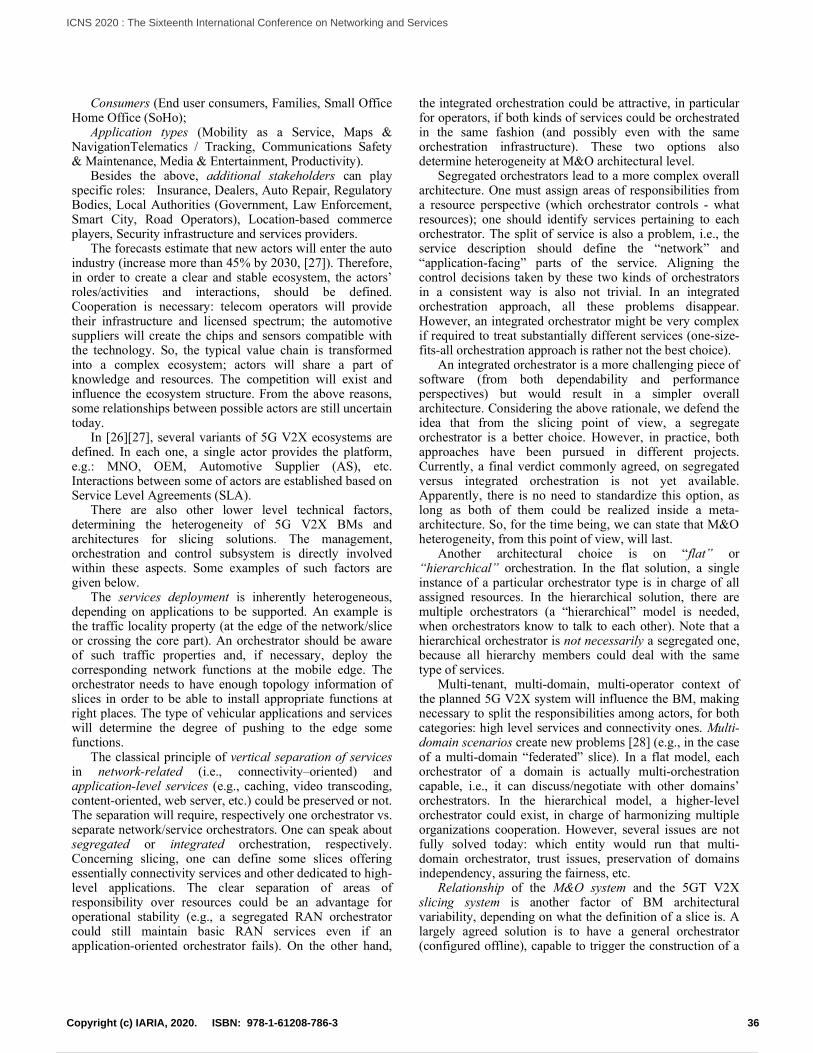
Consumers (End user consumers, Families, Small Office Home Office (SoHo);
Application types (Mobility as a Service, Maps & NavigationTelematics / Tracking, Communications Safety & Maintenance, Media & Entertainment, Productivity).
Besides the above, additional stakeholders can play specific roles: Insurance, Dealers, Auto Repair, Regulatory Bodies, Local Authorities (Government, Law Enforcement, Smart City, Road Operators), Location-based commerce players, Security infrastructure and services providers.
The forecasts estimate that new actors will enter the auto industry (increase more than 45% by 2030, [27]). Therefore, in order to create a clear and stable ecosystem, the actors’ roles/activities and interactions, should be defined. Cooperation is necessary: telecom operators will provide their infrastructure and licensed spectrum; the automotive suppliers will create the chips and sensors compatible with the technology. So, the typical value chain is transformed into a complex ecosystem; actors will share a part of knowledge and resources. The competition will exist and influence the ecosystem structure. From the above reasons, some relationships between possible actors are still uncertain today.
In [26][27], several variants of 5G V2X ecosystems are defined. In each one, a single actor provides the platform, e.g.: MNO, OEM, Automotive Supplier (AS), etc. Interactions between some of actors are established based on Service Level Agreements (SLA).
There are also other lower level technical factors, determining the heterogeneity of 5G V2X BMs and architectures for slicing solutions. The management, orchestration and control subsystem is directly involved within these aspects. Some examples of such factors are given below.
The services deployment is inherently heterogeneous, depending on applications to be supported. An example is the traffic locality property (at the edge of the network/slice or crossing the core part). An orchestrator should be aware of such traffic properties and, if necessary, deploy the corresponding network functions at the mobile edge. The orchestrator needs to have enough topology information of slices in order to be able to install appropriate functions at right places. The type of vehicular applications and services will determine the degree of pushing to the edge some functions.
The classical principle of vertical separation of services in network-related (i.e., connectivity–oriented) and application-level services (e.g., caching, video transcoding, content-oriented, web server, etc.) could be preserved or not. The separation will require, respectively one orchestrator vs. separate network/service orchestrators. One can speak about segregated or integrated orchestration, respectively. Concerning slicing, one can define some slices offering essentially connectivity services and other dedicated to high-level applications. The clear separation of areas of responsibility over resources could be an advantage for operational stability (e.g., a segregated RAN orchestrator could still maintain basic RAN services even if an application-oriented orchestrator fails). On the other hand,
the integrated orchestration could be attractive, in particular for operators, if both kinds of services could be orchestrated in the same fashion (and possibly even with the same orchestration infrastructure). These two options also determine heterogeneity at M&O architectural level.
Segregated orchestrators lead to a more complex overall architecture. One must assign areas of responsibilities from a resource perspective (which orchestrator controls - what resources); one should identify services pertaining to each orchestrator. The split of service is also a problem, i.e., the service description should define the “network” and “application-facing” parts of the service. Aligning the control decisions taken by these two kinds of orchestrators in a consistent way is also not trivial. In an integrated orchestration approach, all these problems disappear. However, an integrated orchestrator might be very complex if required to treat substantially different services (one-size-fits-all orchestration approach is rather not the best choice).
An integrated orchestrator is a more challenging piece of software (from both dependability and performance perspectives) but would result in a simpler overall architecture. Considering the above rationale, we defend the idea that from the slicing point of view, a segregate orchestrator is a better choice. However, in practice, both approaches have been pursued in different projects. Currently, a final verdict commonly agreed, on segregated versus integrated orchestration is not yet available. Apparently, there is no need to standardize this option, as long as both of them could be realized inside a meta-architecture. So, for the time being, we can state that M&O heterogeneity, from this point of view, will last.
Another architectural choice is on “flat” or “hierarchical” orchestration. In the flat solution, a single instance of a particular orchestrator type is in charge of all assigned resources. In the hierarchical solution, there are multiple orchestrators (a “hierarchical” model is needed, when orchestrators know to talk to each other). Note that a hierarchical orchestrator is not necessarily a segregated one, because all hierarchy members could deal with the same type of services.
Multi-tenant, multi-domain, multi-operator context of the planned 5G V2X system will influence the BM, making necessary to split the responsibilities among actors, for both categories: high level services and connectivity ones. Multi-domain scenarios create new problems [28] (e.g., in the case of a multi-domain “federated” slice). In a flat model, each orchestrator of a domain is actually multi-orchestration capable, i.e., it can discuss/negotiate with other domains’ orchestrators. In the hierarchical model, a higher-level orchestrator could exist, in charge of harmonizing multiple organizations cooperation. However, several issues are not fully solved today: which entity would run that multi-domain orchestrator, trust issues, preservation of domains independency, assuring the fairness, etc.
Relationship of the M&O system and the 5GT V2X slicing system is another factor of BM architectural variability, depending on what the definition of a slice is. A largely agreed solution is to have a general orchestrator (configured offline), capable to trigger the construction of a
36Copyright (c) IARIA, 2020. ISBN: 978-1-61208-786-3
ICNS 2020 : The Sixteenth International Conference on Networking and Services
45 / 81
new slice and then to install in this new slice its own dedicated orchestrator (before the slice run-time). To still assure the basic services outside any slice (e.g., packet forwarding at network level) one can construct an additional special orchestrator installed outside of all slices. Currently, many combinations have been proposed, and there is still no consensus on such matters. The convergence of solutions will be determined probably by the adoption of a more unique definition of a slice – which could assure better inter-operability.
V. CONCLUSIONS AND FUTURE WORK
This is an overview-type paper; it analyzed several business models/ecosystems for 5G slicing and then those for V2X and discuss how the 5G BM can be adapted for V2X environment. It has been shown that a large variety of proposals exist in various studies, standards and projects, given the multitude of V2X use cases and the rich set of business actors that could be potentially involved. Some major factors determining the heterogeneity of the BMs proposals have been identified in Section IV.
Considering the above analysis, and to conclude this preliminary study, we propose the steps to be followed to start a 5G V2X system development in slicing approach.
First, the V2X set of high level of services (seen from the end user perspectives) to be implemented should be defined among the rich possible ones (see Section IV).
The identification of the set of involved actors and a first assignment of their roles (especially from business/services point of view) is a major step. Here, some actors would provide only indirect actions (Policy Makers, SDOs, local regulators, etc.). Other actors will participate at operational phases (MNOs, OEMs, Service providers - e.g., OTT, Infrastructure providers, etc.) at run-time.
The multi-domain, multi-tenant, multi-operator characteristics of the 5G V2X system should be selected. Definition of interactions between the actors will complete the high-level description of the 5G V2X BM/ecosystem.
The following steps will refine the BM and go to the requirement identification and architectural definition. The main connectivity and processing/storage technologies should be identified. The regulations, standards, etc., to be enforced have to be identified; they will define but also limit the system capabilities and scope. System requirements identification will follow, considering requirements coming from all actors involved in BM.
The 5G V2X slicing solution (for RAN, core and transport part of the network) should be selected. Here, the refinement of the BM is possible (see Table 1). Then, the system architecture (general and layered - functional) has to be defined, allowing further technical refinement of the system design.
Future work can go further to consider more deeply the multi-x aspects, related to the business models and impact of the BM upon the system management orchestration and control for 5G V2X dedicated slices.
ACKNOWLEDGMENT
The work has been partially funded by the Operational Program Human Capital of the Ministry of European Funds through the Financial Agreement 51675/09.07.2019, SMIS code 125125.
REFERENCES
[1] M. K. Priyan and G. Usha Devi, "A survey on internet of vehicles: applications, technologies, challenges and opportunities", Int. J. Advanced Intelligence Paradigms, Vol. 12, Nos. 1/2, 2019.
[2] C. Renato Storck and F. Duarte-Figueiredo, “A 5G V2X Ecosystem Providing Internet of Vehicles”, Sensors 2019, 19,550, doi: 10.3390/s19030550, www.mdpi.com/journal/sensors, [retrieved January, 2020].
[3] N. Panwar, S. Sharma, A. K. Singh ‘A Survey on 5G: The Next Generation of Mobile Communication’ Elsevier Physical Communication, 4 Nov 2015, http://arxiv.org/pdf/1511.01643v1.pdf
[4] 5G-PPP Architecture Working Group, “View on 5G Architecture”, Version 3.0, June, 2019, https://5g-ppp.eu/wp-content/uploads/2019/07/5G-PPP-5G-Architecture-White-Paper_v3.0_PublicConsultation.pdf, [retrieved June, 2019].
[5] 3GPP TS 23.501 V15.2.0 (2018-06), System Architecture for the 5G System; Stage 2, (Release 15)
[6] X. Foukas, G. Patounas, A. Elmokashfi, and M. K. Marina, “Network Slicing in 5G: Survey and Challenges”, IEEE Communications Magazine, May 2017, pp. 94-100.
[7] A. Galis, “Network Slicing- A holistic architectural approach, orchestration and management with applicability in mobile and fixed networks and clouds”, http://discovery.ucl.ac.uk/10051374/, [retrieved July, 2019].
[8] J. Ordonez-Lucena et al., “Network Slicing for 5G with SDN/NFV: Concepts, Architectures and Challenges”, IEEE Communications Magazine, 2017, pp. 80-87, Citation information: DOI 10.1109/MCOM.2017.1600935.
[9] I. Afolabi, T. Taleb, K. Samdanis, A. Ksentini, and H. Flinck, “Network Slicing & Softwarization: A Survey on Principles, Enabling Technologies & Solutions”, IEEE Communications Surveys & Tutorials, March 2018, pp. 2429-2453.
[10] ETSI GS NFV 002, “NFV Architectural Framework”, V1.2.1, December 2014.
[11] ETSI GS NFV-IFA 009, “Network Functions Virtualisation (NFV); Management and Orchestration; Report on Architectural Options”, Technical Report, V1.1.1, July 2016.
[12] ETSI GR NFV-IFA 028, “Network Functions Virtualisation (NFV) Release 3; Management and Orchestration; Report on architecture options to support multiple administrative domains”, Technical Report, V3.1.1, January, 2018.
[13] ETSI GR NFV-EVE 012, Release 3 “NFV Evolution and Ecosystem; Report on Network Slicing Support with ETSI NFV Architecture Framework”, Technical Report, V3.1.1, December, 2017.
[14] ONF TR-526, “Applying SDN Architecture to 5G Slicing”, April 2016, https://www.opennetworking.org/wp-content/uploads/2014/10/Applying_SDN_Architecture_to_5G_Slicing_TR-526.pdf, [retrieved December, 2019].
[15] A. Molinaro and C. Campolo, “5G for V2X Communications”, https://www.5gitaly.eu/2018/wp-
37Copyright (c) IARIA, 2020. ISBN: 978-1-61208-786-3
ICNS 2020 : The Sixteenth International Conference on Networking and Services
46 / 81
content/uploads/2019/01/5G-Italy-White-eBook-5G-for-V2X-Communications.pdf, [retrieved December, 2019].
[16] S. A. Ali Shah, E. Ahmed, M. Imran, and S. Zeadally, "5G for Vehicular Communications", IEEE Communications Magazine, January 2018, pp.111-117.
[17] K. Katsaros and M. Dianati, "A Conceptual 5G Vehicular Networking Architecture“, October 2017, https://www.researchgate.net/publication/309149571, DOI: 10.1007/978-3-319-34208-5_22, [retrieved December 2019].
[18] C. Campolo, A. Molinaro, A. Iera, and F. Menichella, "5G Network Slicing for Vehicle-to-Everything Services", IEEE Wireless Communications, Volume: 24 Issue: 6, DOI: 10.1109/MWC.2017.160040, [retrieved December, 2019].
[19] Friedhelm Ramme, ITS, Transport & Automotive, Ericsson 5G: "From Concepts to Reality“ Technology Roadmaps https://5gaa.org/wp-content/uploads/2019/02/Final-Presentation-MWC19-Friedhelm-Ramme-ERICSSON.pdf, [retrieved January, 2020].
[20] H2020-ICT-2016-2, Monarch Project, 5G Mobile Network Architecture for diverse services, use cases and applications in 5G and beyond, Deliverable D2.2, "Initial overall architecture and concepts for enabling innovations", https://5g-monarch.eu/deliverables/ 2018,[retrieved June, 2019].
[21] 3GPP TR 22.830 V16.1.0, TS Group Services and System Aspects, "Feasibility Study on Business Role Models for Network Slicing", (Release 16), 2018 https://itectec.com/archive/3gpp-specification-tr-22-830/ [retrieved May, 2020].
[22] https://www.3gpp.org/release-16. [23] 5G PPP Automotive Working Group, “Business Feasibility
Study for 5G V2X Deployment”, https://bscw.5g-ppp.eu/pub/bscw.cgi/d293672/5G%20PPP%20Automotive%20WG_White%20Paper_Feb2019.pdf, [retrieved, January, 2020].
[24] 5GCAR White Paper : Executive Summary, Version: v1.0, 2019-12-10, https://5gcar.eu/wp-content/uploads/2019/12/5GCAR-Executive-Summary-White-Paper.pdf, [retrieved, January 2020].
[25] 5GCAR, Fifth Generation Communication Automotive Research and innovation Deliverable D1.2 5GCAR Mid-Project Report, v1.0 2018-05-31, https://5gcar.eu/wp-content/uploads/2018/08/5GCAR_D1.2_v1.0.pdf, [retrieved, January, 2020].
[26] 5GCAR, Fifth Generation Communication Automotive Research and innovation Deliverable D2.2 “Intermediate Report on V2X Business Models and Spectrum”, v2.0, 2019-02-28,https://5gcar.eu/wp-content/uploads/2018/08/5GCAR_D2.2_v1.0.pdf, [retrieved, January, 2020].
[27] B. Martínez de Aragón, J. Alonso-Zarateand, and A. Laya, "How connectivity is transforming the automotive ecosystem". Internet Technology Letters. 2018;1:e14. https://doi.org/10.1001/itl2.14 [retrieved, January, 2020].
[28] Katsalis, N. Nikaein, and A. Edmonds, "Multi-Domain Orchestration for NFV: Challenges and Research Directions", 2016 15th Int'l Conf. on Ubiquitous Computing and Communications and International Symposium on Cyberspace and Security (IUCC-CSS), pp. 189–195, DOI: 10.1109/IUCC-CSS.2016.034, https://ieeexplore.ieee.org/document/7828601, [retrieved July, 2019].
38Copyright (c) IARIA, 2020. ISBN: 978-1-61208-786-3
ICNS 2020 : The Sixteenth International Conference on Networking and Services
47 / 81
Meshed Trees for Resilient Switched Networks
Peter Willis1, Nirmala Shenoy2
Dept. of Information Sciences and Technologies,Golisano College of Computing and Information Sciences
Rochester Institute of Technology, Rochester, New York, USAe-mail: [email protected], [email protected]
Abstract— Layer 2 (L2) protocols are fundamental to allnetwork communications. Loop-avoidance in L2 operationsis essential for forwarding broadcast frames without themlooping throughout network. Loop-avoidance protocolsconstruct a logical tree on the meshed topology, normallyused to provide path redundancy in switched networks.Repairing the tree on topology changes results in expensivenetwork downtime and is major challenge faced in L2networks. In this article, we present the Meshed TreeProtocol (MTP) based on a novel Meshed Tree Algorithm(MTA) as a clean-slate approach to loop avoidance inswitched network. MTP leverages the connectivity in themeshed topology to pre-construct several trees from a root.Multiple backup paths are in readiness to takeover in theevent of failure of the main path for fast convergence. Welimit our work in this article to a comparison of a codedprototype implementation of MTP vs. the Rapid SpanningTree Protocol (RSTP) in L2 customer networks. Theevaluation was conducted on the GENI (Global Environmentfor Network Innovation) testbed.
Keywords-Meshed Trees; Pre-constructed Paths; PathVector VIDs; Hysteresis in Failure Detection.
I. INTRODUCTION
High-performance switched networks are in greatdemand with the growth in L2 Customer (C), ServiceProvider (SP) and Backbone Provider (BP) networks.Meshed topologies are adopted in switched networks toprovide path redundancy. Consequently, handling ofbroadcast frames poses a challenge. When a switchreceives a broadcast frame on a port it forwards it on allother ports (except the port it was received on). Becausethere are physical loops in the network due to the meshedtopology, this can result in broadcast frames looping in thenetwork infinitely and crashing the network. For thispurpose, it is important to forward brought broadcastframes on paths that do not loop. The traditional approachis to construct a logical tree on the physical meshedtopology and allow broadcast frames to be forwardedalong the tree paths. To construct a logical tree on theswitched network, loop avoidance protocols are used.Loop-avoidance protocols use tree algorithms such asSpanning tree and Dijkstra tree to construct the logicaltree. Tree algorithms allow construction of a single treefrom a root. Hence on a link or switch failure when a treebranch fails, protocols based of these algorithms mustreconstruct/repair the tree. As a result, the convergencelatency in the event of a network component failure can behigh. This is a setback for applications running onswitched networks that desire high availability.
Constructing a single logical tree on a meshed topologylogically sacrifices the rich path redundancy in the meshedtopology. We propose a novel meshed trees algorithm(MTA) that allows construction of multiple trees from asingle root. The branches from the multiple trees mesh atthe switches thus keeping the redundant paths in readinessand the failover in the event of a (currently used) pathfailure is immediate. We further propose a novel virtualidentifier to pre-construct and maintain the multiple trees.This simplifies the meshed tree protocol implementationsignificantly, making the protocol lightweight and robust.
In this article, we limit our performance comparison ofMTP vs RSTP to highlight the significant performanceimprovement (several magnitudes) in terms ofconvergence on link failures that can be achieved with asimple and robust protocol, especially in L2 customernetworks. RSTP is a standard protocol and its code isavailable on the GENI testbed, hence it is readily availableto compare the two working prototypes. RSTP also servesas a reference. We collect measurements of animplementation of MTP and RSTP on the GENI testbed[10], for multiple network topologies. A detailed analysisand study of MTP vs RSTP convergence processconsidering tree construction and recovery on failures,based on message exchanges and port role changes isprovided. Several sets of test cases were evaluated. Thetree construction process with MTP and RSTP arehighlighted and contrasted to explain the difference inoperational complexity between the two protocols and tojustify the performance improvements with MTP. Futurework will cover a study of MTP vs IS-IS based loop-avoidance protocols for L2 SP and BP networks.
The rest of the paper is structured as follows. InSection II, we discuss background work on loop-avoidanceprotocols, primarily focusing on standards, followed by anintroduction to meshed trees. We discuss IS-IS basedprotocols, the latest loop avoidance protocol standards toaddress convergence delays experienced by spanning treeprotocols, only to highlight their complexity andlimitations. We also introduce and compare meshed treeswith Dijkstra and spanning trees. Section III describes ameshed trees implementation in a switched network withan example highlighting several of its attributes. SectionIV focusses on the performance metrics that will bestudied and their significance. Section V provides detailson protocol evaluations, and tools and techniques to assessperformance. Subsections discuss in detail the performancein three different topologies for multiple test cases. Thefailures were limited to single link failures and the relativeposition in the tree which plays an important role in the
39Copyright (c) IARIA, 2020. ISBN: 978-1-61208-786-3
ICNS 2020 : The Sixteenth International Conference on Networking and Services
48 / 81
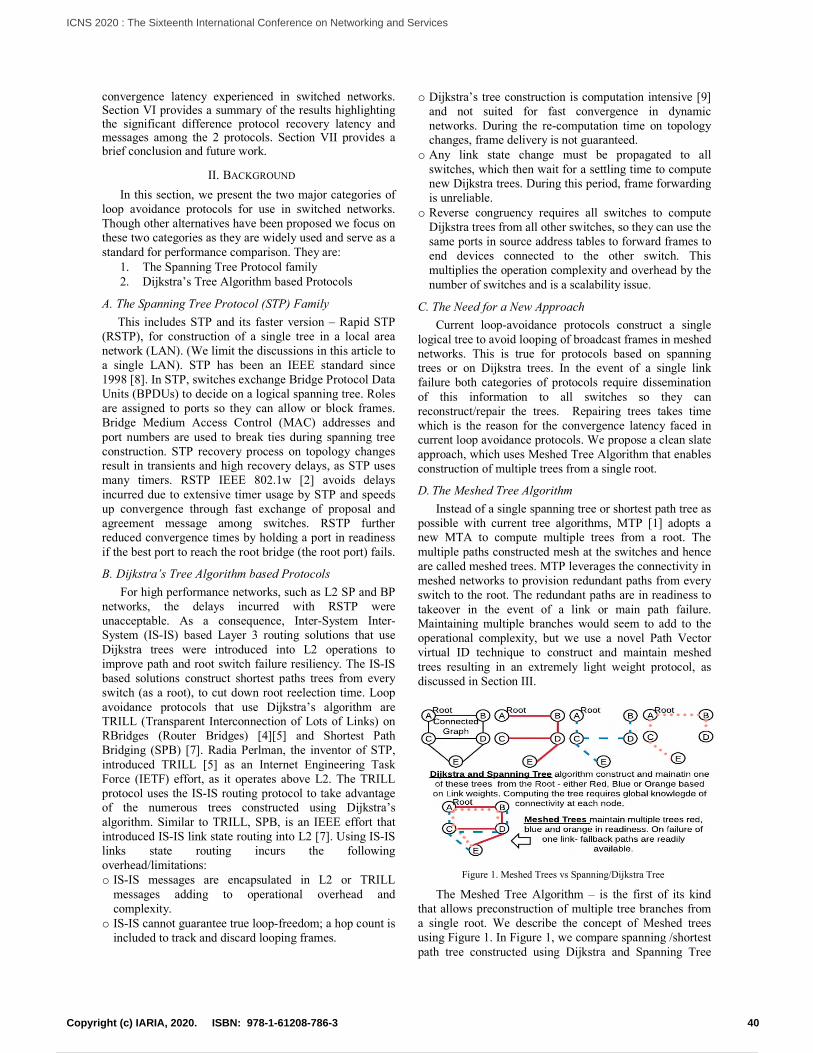
Figure 1. Meshed Trees vs Spanning/Dijkstra Tree
convergence latency experienced in switched networks.Section VI provides a summary of the results highlightingthe significant difference protocol recovery latency andmessages among the 2 protocols. Section VII provides abrief conclusion and future work.
II. BACKGROUND
In this section, we present the two major categories ofloop avoidance protocols for use in switched networks.Though other alternatives have been proposed we focus onthese two categories as they are widely used and serve as astandard for performance comparison. They are:
1. The Spanning Tree Protocol family2. Dijkstra’s Tree Algorithm based Protocols
A. The Spanning Tree Protocol (STP) Family
This includes STP and its faster version – Rapid STP(RSTP), for construction of a single tree in a local areanetwork (LAN). (We limit the discussions in this article toa single LAN). STP has been an IEEE standard since1998 [8]. In STP, switches exchange Bridge Protocol DataUnits (BPDUs) to decide on a logical spanning tree. Rolesare assigned to ports so they can allow or block frames.Bridge Medium Access Control (MAC) addresses andport numbers are used to break ties during spanning treeconstruction. STP recovery process on topology changesresult in transients and high recovery delays, as STP usesmany timers. RSTP IEEE 802.1w [2] avoids delaysincurred due to extensive timer usage by STP and speedsup convergence through fast exchange of proposal andagreement message among switches. RSTP furtherreduced convergence times by holding a port in readinessif the best port to reach the root bridge (the root port) fails.
B. Dijkstra’s Tree Algorithm based Protocols
For high performance networks, such as L2 SP and BPnetworks, the delays incurred with RSTP wereunacceptable. As a consequence, Inter-System Inter-System (IS-IS) based Layer 3 routing solutions that useDijkstra trees were introduced into L2 operations toimprove path and root switch failure resiliency. The IS-ISbased solutions construct shortest paths trees from everyswitch (as a root), to cut down root reelection time. Loopavoidance protocols that use Dijkstra’s algorithm areTRILL (Transparent Interconnection of Lots of Links) onRBridges (Router Bridges) [4][5] and Shortest PathBridging (SPB) [7]. Radia Perlman, the inventor of STP,introduced TRILL [5] as an Internet Engineering TaskForce (IETF) effort, as it operates above L2. The TRILLprotocol uses the IS-IS routing protocol to take advantageof the numerous trees constructed using Dijkstra’salgorithm. Similar to TRILL, SPB, is an IEEE effort thatintroduced IS-IS link state routing into L2 [7]. Using IS-ISlinks state routing incurs the followingoverhead/limitations:o IS-IS messages are encapsulated in L2 or TRILL
messages adding to operational overhead andcomplexity.
o IS-IS cannot guarantee true loop-freedom; a hop count isincluded to track and discard looping frames.
o Dijkstra’s tree construction is computation intensive [9]and not suited for fast convergence in dynamicnetworks. During the re-computation time on topologychanges, frame delivery is not guaranteed.
o Any link state change must be propagated to allswitches, which then wait for a settling time to computenew Dijkstra trees. During this period, frame forwardingis unreliable.
o Reverse congruency requires all switches to computeDijkstra trees from all other switches, so they can use thesame ports in source address tables to forward frames toend devices connected to the other switch. Thismultiplies the operation complexity and overhead by thenumber of switches and is a scalability issue.
C. The Need for a New Approach
Current loop-avoidance protocols construct a singlelogical tree to avoid looping of broadcast frames in meshednetworks. This is true for protocols based on spanningtrees or on Dijkstra trees. In the event of a single linkfailure both categories of protocols require disseminationof this information to all switches so they canreconstruct/repair the trees. Repairing trees takes timewhich is the reason for the convergence latency faced incurrent loop avoidance protocols. We propose a clean slateapproach, which uses Meshed Tree Algorithm that enablesconstruction of multiple trees from a single root.
D. The Meshed Tree Algorithm
Instead of a single spanning tree or shortest path tree aspossible with current tree algorithms, MTP [1] adopts anew MTA to compute multiple trees from a root. Themultiple paths constructed mesh at the switches and henceare called meshed trees. MTP leverages the connectivity inmeshed networks to provision redundant paths from everyswitch to the root. The redundant paths are in readiness totakeover in the event of a link or main path failure.Maintaining multiple branches would seem to add to theoperational complexity, but we use a novel Path Vectorvirtual ID technique to construct and maintain meshedtrees resulting in an extremely light weight protocol, asdiscussed in Section III.
The Meshed Tree Algorithm – is the first of its kindthat allows preconstruction of multiple tree branches froma single root. We describe the concept of Meshed treesusing Figure 1. In Figure 1, we compare spanning /shortestpath tree constructed using Dijkstra and Spanning Tree
40Copyright (c) IARIA, 2020. ISBN: 978-1-61208-786-3
ICNS 2020 : The Sixteenth International Conference on Networking and Services
49 / 81
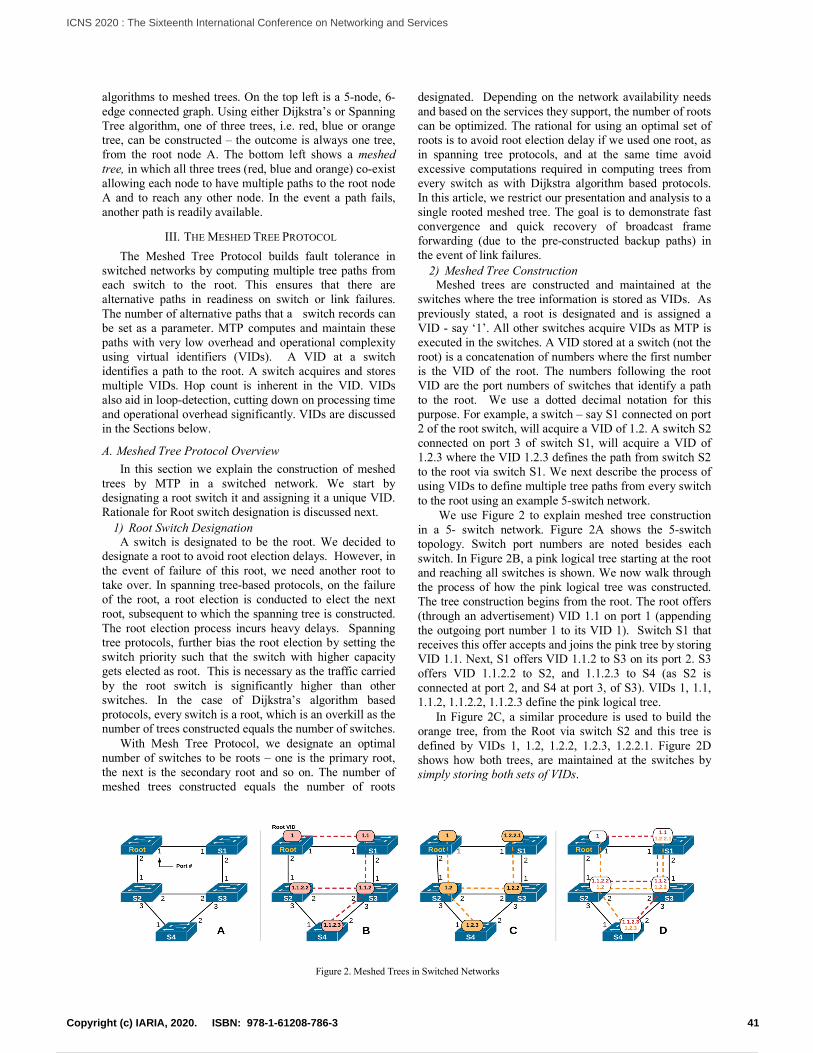
algorithms to meshed trees. On the top left is a 5-node, 6-edge connected graph. Using either Dijkstra’s or SpanningTree algorithm, one of three trees, i.e. red, blue or orangetree, can be constructed – the outcome is always one tree,from the root node A. The bottom left shows a meshedtree, in which all three trees (red, blue and orange) co-existallowing each node to have multiple paths to the root nodeA and to reach any other node. In the event a path fails,another path is readily available.
III. THE MESHED TREE PROTOCOL
The Meshed Tree Protocol builds fault tolerance inswitched networks by computing multiple tree paths fromeach switch to the root. This ensures that there arealternative paths in readiness on switch or link failures.The number of alternative paths that a switch records canbe set as a parameter. MTP computes and maintain thesepaths with very low overhead and operational complexityusing virtual identifiers (VIDs). A VID at a switchidentifies a path to the root. A switch acquires and storesmultiple VIDs. Hop count is inherent in the VID. VIDsalso aid in loop-detection, cutting down on processing timeand operational overhead significantly. VIDs are discussedin the Sections below.
A. Meshed Tree Protocol Overview
In this section we explain the construction of meshedtrees by MTP in a switched network. We start bydesignating a root switch it and assigning it a unique VID.Rationale for Root switch designation is discussed next.
1) Root Switch DesignationA switch is designated to be the root. We decided to
designate a root to avoid root election delays. However, inthe event of failure of this root, we need another root totake over. In spanning tree-based protocols, on the failureof the root, a root election is conducted to elect the nextroot, subsequent to which the spanning tree is constructed.The root election process incurs heavy delays. Spanningtree protocols, further bias the root election by setting theswitch priority such that the switch with higher capacitygets elected as root. This is necessary as the traffic carriedby the root switch is significantly higher than otherswitches. In the case of Dijkstra’s algorithm basedprotocols, every switch is a root, which is an overkill as thenumber of trees constructed equals the number of switches.
With Mesh Tree Protocol, we designate an optimalnumber of switches to be roots – one is the primary root,the next is the secondary root and so on. The number ofmeshed trees constructed equals the number of roots
designated. Depending on the network availability needsand based on the services they support, the number of rootscan be optimized. The rational for using an optimal set ofroots is to avoid root election delay if we used one root, asin spanning tree protocols, and at the same time avoidexcessive computations required in computing trees fromevery switch as with Dijkstra algorithm based protocols.In this article, we restrict our presentation and analysis to asingle rooted meshed tree. The goal is to demonstrate fastconvergence and quick recovery of broadcast frameforwarding (due to the pre-constructed backup paths) inthe event of link failures.
2) Meshed Tree ConstructionMeshed trees are constructed and maintained at the
switches where the tree information is stored as VIDs. Aspreviously stated, a root is designated and is assigned aVID - say ‘1’. All other switches acquire VIDs as MTP isexecuted in the switches. A VID stored at a switch (not theroot) is a concatenation of numbers where the first numberis the VID of the root. The numbers following the rootVID are the port numbers of switches that identify a pathto the root. We use a dotted decimal notation for thispurpose. For example, a switch – say S1 connected on port2 of the root switch, will acquire a VID of 1.2. A switch S2connected on port 3 of switch S1, will acquire a VID of1.2.3 where the VID 1.2.3 defines the path from switch S2to the root via switch S1. We next describe the process ofusing VIDs to define multiple tree paths from every switchto the root using an example 5-switch network.
We use Figure 2 to explain meshed tree constructionin a 5- switch network. Figure 2A shows the 5-switchtopology. Switch port numbers are noted besides eachswitch. In Figure 2B, a pink logical tree starting at the rootand reaching all switches is shown. We now walk throughthe process of how the pink logical tree was constructed.The tree construction begins from the root. The root offers(through an advertisement) VID 1.1 on port 1 (appendingthe outgoing port number 1 to its VID 1). Switch S1 thatreceives this offer accepts and joins the pink tree by storingVID 1.1. Next, S1 offers VID 1.1.2 to S3 on its port 2. S3offers VID 1.1.2.2 to S2, and 1.1.2.3 to S4 (as S2 isconnected at port 2, and S4 at port 3, of S3). VIDs 1, 1.1,1.1.2, 1.1.2.2, 1.1.2.3 define the pink logical tree.
In Figure 2C, a similar procedure is used to build theorange tree, from the Root via switch S2 and this tree isdefined by VIDs 1, 1.2, 1.2.2, 1.2.3, 1.2.2.1. Figure 2Dshows how both trees, are maintained at the switches bysimply storing both sets of VIDs.
Figure 2. Meshed Trees in Switched Networks
41Copyright (c) IARIA, 2020. ISBN: 978-1-61208-786-3
ICNS 2020 : The Sixteenth International Conference on Networking and Services
50 / 81

MTP uses messages that advertise VIDs, and a switchthat accepts a VID informs the upstream switch of theVIDs it accepts. We do not include the protocolimplementation details in this article, but restrict ourpresentation to its operations. On startup as only the rootswitch has a VID, switches that do not have a VID willissue a join-request message on their ports. Figure 3 is aflow chart used at the switches to construct meshed trees.
When MTP is started in a switch, the switch firstchecks if it is designated root. If this is true (it will havean assigned VID), the root will send a VID advertisementon all its ports. The VID advertisement on each port willbe different because when advertising its VID it willappend the port number on which the VID advertisementwill be sent. Switches that are not designated roots willsend a join-request to receive VID advertisements from itsneighbors. Every switch that acquires a VID will advertiseon all other ports except the port on which the VID wasacquired. Thus, switches receive multiple VIDadvertisements and are able to select VIDs based on thepath metric and store them in a VID table, in order ofpreference. Before accepting a VID, switches do a loopcheck which is explained below. MTP uses the hello timerto keep its neighbors informed about its current activestatus. Any changes to the VID tables are advertised.
3) Loop Detection and PreemptionWe explain loop detection and pre-emption using an
example from Figure 2D. Let S3 offer VID 1.1.2.1 toswitch S1. S1 compares the offered VID with its currentVIDs, 1.1 and 1.2.2.1. Its current VID 1.1 is a properprefix of the offered VID 1.1.2.1, so S1 knows it is itsown ancestor in the offered path to the root. S1 thusdetects a loop and will not accept this VID. (Note - thenumber of digits in the VID is direct measure of hopcount).
4) The Distributed Approach to Tree ConstructionThe process of selecting the best set of VIDs is decided
by each switch independently based on the advertisementsit hears from its neighbors. On receiving multiple VIDs, aswitch stores them in order of preference based on hopcount, path cost, or any other metric. In this article, hopcount is used. To limit the tree meshing and conserve onmemory usage the number of VIDs stored by a switch islimited. The limited number of VID’s in thisimplementation is 3. The fact that each switchindependently decides on the VIDs it stores based on apreference criterion makes the protocol robust.
5) The Broadcast TreeOf the multiple tree paths from each switch to the
root, at any time only one path will be used to avoid
looping of broadcast frames. For this purpose, a switchdeclares one of its VIDs as Primary VID (PVID). ThePVID is decided based hop count in this study. Thus, inthis study, switches use the shortest VID from the set ofVID’s that they have stored, as the PVID. A PVID and thePVID port provide the lowest cost path from a switch tothe root.
A switch also records its neighbors who have chosen itas the “PVID parent”, noting their PVID as a child-PVID(CPVID) and their port of connection. While a PVID andits port of acquisition connect a switch to the Root, aCPVID port and its port of connection provides the linkbetween a downstream switch and an upstream switch.The PVID, CPVID ports map out the broadcast tree toreach every switch – the broadcast tree is the tree thatspans all switches and is used to forward the broadcastframe. We use Figure 2D to explain the broadcast treedefined by MTP. In Figure 4 we show Figure 2D onlywith the PVID selected by each switch, its port ofacquisition and the CPVID port recorded by a switch andthe port on which the CPVID was issued. In Figure 4, theconnected CPVID and PVID ports using green arrowsrepresent the broadcast tree. Note that the broadcast treereach is limited to the switches and not extended to thelinks between the switches. This is in line with the laterloop avoidance protocols that do not support hubs orshared media: example IS-IS based protocols. Thisfurther simplifies the tree construction as compared tospanning tree protocols.
6) Reducing Failure Detection TimeFailure detection time is one of the major contributors
to convergence latency in most routing and loop-avoidanceprotocols. To reduce failure detection, BidirectionalFailure Detection (BFD) protocols was introduced [13].BFD can be invoked by any protocol or application that
Figure 4. Broadcast Tree for Meshed tree in Figure 2D
Figure 3. Flow Chart for Simplified Meshed Tree Construction in Switched Network
42Copyright (c) IARIA, 2020. ISBN: 978-1-61208-786-3
ICNS 2020 : The Sixteenth International Conference on Networking and Services
51 / 81
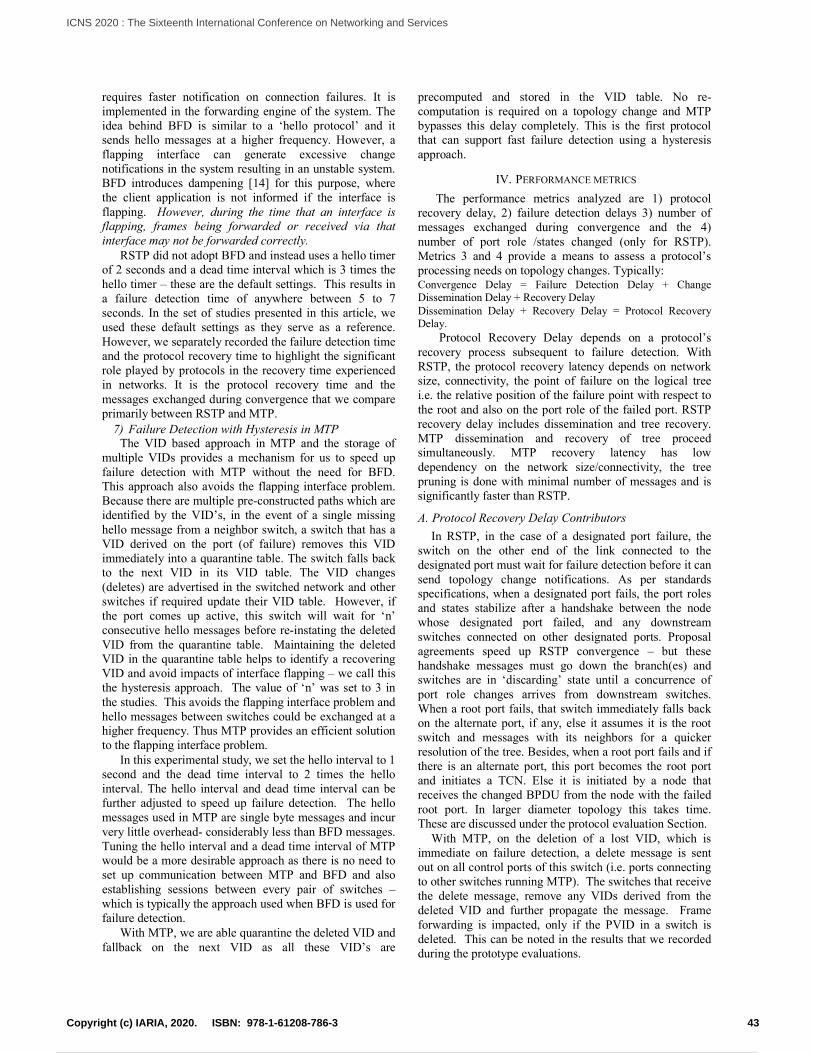
requires faster notification on connection failures. It isimplemented in the forwarding engine of the system. Theidea behind BFD is similar to a ‘hello protocol’ and itsends hello messages at a higher frequency. However, aflapping interface can generate excessive changenotifications in the system resulting in an unstable system.BFD introduces dampening [14] for this purpose, wherethe client application is not informed if the interface isflapping. However, during the time that an interface isflapping, frames being forwarded or received via thatinterface may not be forwarded correctly.
RSTP did not adopt BFD and instead uses a hello timerof 2 seconds and a dead time interval which is 3 times thehello timer – these are the default settings. This results ina failure detection time of anywhere between 5 to 7seconds. In the set of studies presented in this article, weused these default settings as they serve as a reference.However, we separately recorded the failure detection timeand the protocol recovery time to highlight the significantrole played by protocols in the recovery time experiencedin networks. It is the protocol recovery time and themessages exchanged during convergence that we compareprimarily between RSTP and MTP.
7) Failure Detection with Hysteresis in MTPThe VID based approach in MTP and the storage of
multiple VIDs provides a mechanism for us to speed upfailure detection with MTP without the need for BFD.This approach also avoids the flapping interface problem.Because there are multiple pre-constructed paths which areidentified by the VID’s, in the event of a single missinghello message from a neighbor switch, a switch that has aVID derived on the port (of failure) removes this VIDimmediately into a quarantine table. The switch falls backto the next VID in its VID table. The VID changes(deletes) are advertised in the switched network and otherswitches if required update their VID table. However, ifthe port comes up active, this switch will wait for ‘n’consecutive hello messages before re-instating the deletedVID from the quarantine table. Maintaining the deletedVID in the quarantine table helps to identify a recoveringVID and avoid impacts of interface flapping – we call thisthe hysteresis approach. The value of ‘n’ was set to 3 inthe studies. This avoids the flapping interface problem andhello messages between switches could be exchanged at ahigher frequency. Thus MTP provides an efficient solutionto the flapping interface problem.
In this experimental study, we set the hello interval to 1second and the dead time interval to 2 times the hellointerval. The hello interval and dead time interval can befurther adjusted to speed up failure detection. The hellomessages used in MTP are single byte messages and incurvery little overhead- considerably less than BFD messages.Tuning the hello interval and a dead time interval of MTPwould be a more desirable approach as there is no need toset up communication between MTP and BFD and alsoestablishing sessions between every pair of switches –which is typically the approach used when BFD is used forfailure detection.
With MTP, we are able quarantine the deleted VID andfallback on the next VID as all these VID’s are
precomputed and stored in the VID table. No re-computation is required on a topology change and MTPbypasses this delay completely. This is the first protocolthat can support fast failure detection using a hysteresisapproach.
IV. PERFORMANCE METRICS
The performance metrics analyzed are 1) protocolrecovery delay, 2) failure detection delays 3) number ofmessages exchanged during convergence and the 4)number of port role /states changed (only for RSTP).Metrics 3 and 4 provide a means to assess a protocol’sprocessing needs on topology changes. Typically:Convergence Delay = Failure Detection Delay + ChangeDissemination Delay + Recovery DelayDissemination Delay + Recovery Delay = Protocol RecoveryDelay.
Protocol Recovery Delay depends on a protocol’srecovery process subsequent to failure detection. WithRSTP, the protocol recovery latency depends on networksize, connectivity, the point of failure on the logical treei.e. the relative position of the failure point with respect tothe root and also on the port role of the failed port. RSTPrecovery delay includes dissemination and tree recovery.MTP dissemination and recovery of tree proceedsimultaneously. MTP recovery latency has lowdependency on the network size/connectivity, the treepruning is done with minimal number of messages and issignificantly faster than RSTP.
A. Protocol Recovery Delay Contributors
In RSTP, in the case of a designated port failure, theswitch on the other end of the link connected to thedesignated port must wait for failure detection before it cansend topology change notifications. As per standardsspecifications, when a designated port fails, the port rolesand states stabilize after a handshake between the nodewhose designated port failed, and any downstreamswitches connected on other designated ports. Proposalagreements speed up RSTP convergence – but thesehandshake messages must go down the branch(es) andswitches are in ‘discarding’ state until a concurrence ofport role changes arrives from downstream switches.When a root port fails, that switch immediately falls backon the alternate port, if any, else it assumes it is the rootswitch and messages with its neighbors for a quickerresolution of the tree. Besides, when a root port fails and ifthere is an alternate port, this port becomes the root portand initiates a TCN. Else it is initiated by a node thatreceives the changed BPDU from the node with the failedroot port. In larger diameter topology this takes time.These are discussed under the protocol evaluation Section.
With MTP, on the deletion of a lost VID, which isimmediate on failure detection, a delete message is sentout on all control ports of this switch (i.e. ports connectingto other switches running MTP). The switches that receivethe delete message, remove any VIDs derived from thedeleted VID and further propagate the message. Frameforwarding is impacted, only if the PVID in a switch isdeleted. This can be noted in the results that we recordedduring the prototype evaluations.
43Copyright (c) IARIA, 2020. ISBN: 978-1-61208-786-3
ICNS 2020 : The Sixteenth International Conference on Networking and Services
52 / 81
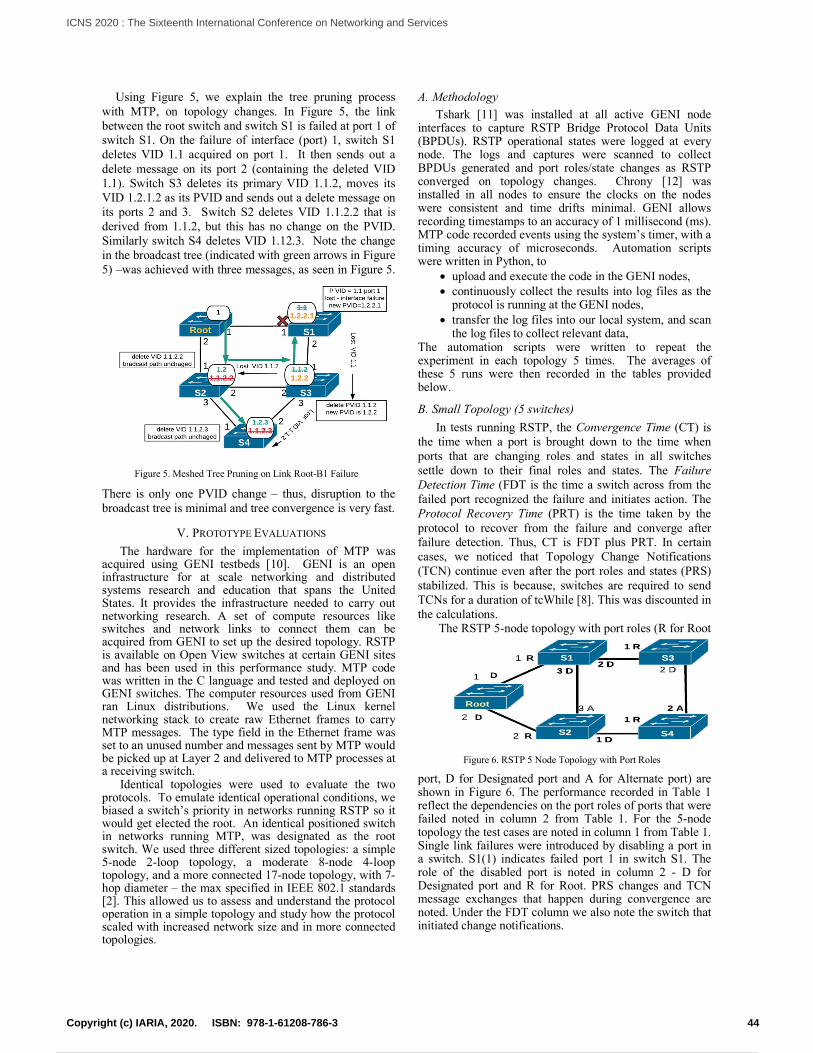
Using Figure 5, we explain the tree pruning processwith MTP, on topology changes. In Figure 5, the linkbetween the root switch and switch S1 is failed at port 1 ofswitch S1. On the failure of interface (port) 1, switch S1deletes VID 1.1 acquired on port 1. It then sends out adelete message on its port 2 (containing the deleted VID1.1). Switch S3 deletes its primary VID 1.1.2, moves itsVID 1.2.1.2 as its PVID and sends out a delete message onits ports 2 and 3. Switch S2 deletes VID 1.1.2.2 that isderived from 1.1.2, but this has no change on the PVID.Similarly switch S4 deletes VID 1.12.3. Note the changein the broadcast tree (indicated with green arrows in Figure5) –was achieved with three messages, as seen in Figure 5.
There is only one PVID change – thus, disruption to thebroadcast tree is minimal and tree convergence is very fast.
V. PROTOTYPE EVALUATIONS
The hardware for the implementation of MTP wasacquired using GENI testbeds [10]. GENI is an openinfrastructure for at scale networking and distributedsystems research and education that spans the UnitedStates. It provides the infrastructure needed to carry outnetworking research. A set of compute resources likeswitches and network links to connect them can beacquired from GENI to set up the desired topology. RSTPis available on Open View switches at certain GENI sitesand has been used in this performance study. MTP codewas written in the C language and tested and deployed onGENI switches. The computer resources used from GENIran Linux distributions. We used the Linux kernelnetworking stack to create raw Ethernet frames to carryMTP messages. The type field in the Ethernet frame wasset to an unused number and messages sent by MTP wouldbe picked up at Layer 2 and delivered to MTP processes ata receiving switch.
Identical topologies were used to evaluate the twoprotocols. To emulate identical operational conditions, webiased a switch’s priority in networks running RSTP so itwould get elected the root. An identical positioned switchin networks running MTP, was designated as the rootswitch. We used three different sized topologies: a simple5-node 2-loop topology, a moderate 8-node 4-looptopology, and a more connected 17-node topology, with 7-hop diameter – the max specified in IEEE 802.1 standards[2]. This allowed us to assess and understand the protocoloperation in a simple topology and study how the protocolscaled with increased network size and in more connectedtopologies.
A. Methodology
Tshark [11] was installed at all active GENI nodeinterfaces to capture RSTP Bridge Protocol Data Units(BPDUs). RSTP operational states were logged at everynode. The logs and captures were scanned to collectBPDUs generated and port roles/state changes as RSTPconverged on topology changes. Chrony [12] wasinstalled in all nodes to ensure the clocks on the nodeswere consistent and time drifts minimal. GENI allowsrecording timestamps to an accuracy of 1 millisecond (ms).MTP code recorded events using the system’s timer, with atiming accuracy of microseconds. Automation scriptswere written in Python, to
upload and execute the code in the GENI nodes, continuously collect the results into log files as the
protocol is running at the GENI nodes, transfer the log files into our local system, and scan
the log files to collect relevant data,The automation scripts were written to repeat theexperiment in each topology 5 times. The averages ofthese 5 runs were then recorded in the tables providedbelow.
B. Small Topology (5 switches)
In tests running RSTP, the Convergence Time (CT) isthe time when a port is brought down to the time whenports that are changing roles and states in all switchessettle down to their final roles and states. The FailureDetection Time (FDT is the time a switch across from thefailed port recognized the failure and initiates action. TheProtocol Recovery Time (PRT) is the time taken by theprotocol to recover from the failure and converge afterfailure detection. Thus, CT is FDT plus PRT. In certaincases, we noticed that Topology Change Notifications(TCN) continue even after the port roles and states (PRS)stabilized. This is because, switches are required to sendTCNs for a duration of tcWhile [8]. This was discounted inthe calculations.
The RSTP 5-node topology with port roles (R for Root
port, D for Designated port and A for Alternate port) areshown in Figure 6. The performance recorded in Table 1reflect the dependencies on the port roles of ports that werefailed noted in column 2 from Table 1. For the 5-nodetopology the test cases are noted in column 1 from Table 1.Single link failures were introduced by disabling a port ina switch. S1(1) indicates failed port 1 in switch S1. Therole of the disabled port is noted in column 2 - D forDesignated port and R for Root. PRS changes and TCNmessage exchanges that happen during convergence arenoted. Under the FDT column we also note the switch thatinitiated change notifications.
Figure 6. RSTP 5 Node Topology with Port Roles
Figure 5. Meshed Tree Pruning on Link Root-B1 Failure
44Copyright (c) IARIA, 2020. ISBN: 978-1-61208-786-3
ICNS 2020 : The Sixteenth International Conference on Networking and Services
53 / 81
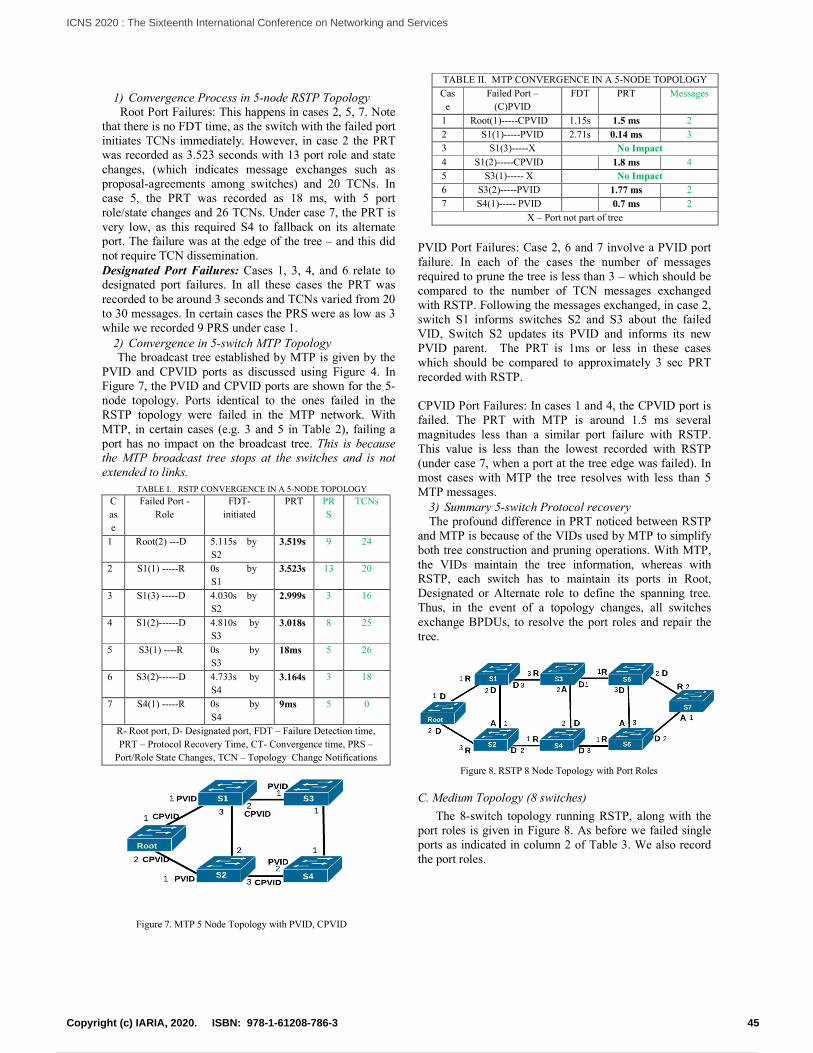
1) Convergence Process in 5-node RSTP TopologyRoot Port Failures: This happens in cases 2, 5, 7. Note
that there is no FDT time, as the switch with the failed portinitiates TCNs immediately. However, in case 2 the PRTwas recorded as 3.523 seconds with 13 port role and statechanges, (which indicates message exchanges such asproposal-agreements among switches) and 20 TCNs. Incase 5, the PRT was recorded as 18 ms, with 5 portrole/state changes and 26 TCNs. Under case 7, the PRT isvery low, as this required S4 to fallback on its alternateport. The failure was at the edge of the tree – and this didnot require TCN dissemination.Designated Port Failures: Cases 1, 3, 4, and 6 relate todesignated port failures. In all these cases the PRT wasrecorded to be around 3 seconds and TCNs varied from 20to 30 messages. In certain cases the PRS were as low as 3while we recorded 9 PRS under case 1.
2) Convergence in 5-switch MTP TopologyThe broadcast tree established by MTP is given by the
PVID and CPVID ports as discussed using Figure 4. InFigure 7, the PVID and CPVID ports are shown for the 5-node topology. Ports identical to the ones failed in theRSTP topology were failed in the MTP network. WithMTP, in certain cases (e.g. 3 and 5 in Table 2), failing aport has no impact on the broadcast tree. This is becausethe MTP broadcast tree stops at the switches and is notextended to links.
PVID Port Failures: Case 2, 6 and 7 involve a PVID portfailure. In each of the cases the number of messagesrequired to prune the tree is less than 3 – which should becompared to the number of TCN messages exchangedwith RSTP. Following the messages exchanged, in case 2,switch S1 informs switches S2 and S3 about the failedVID, Switch S2 updates its PVID and informs its newPVID parent. The PRT is 1ms or less in these caseswhich should be compared to approximately 3 sec PRTrecorded with RSTP.
CPVID Port Failures: In cases 1 and 4, the CPVID port isfailed. The PRT with MTP is around 1.5 ms severalmagnitudes less than a similar port failure with RSTP.This value is less than the lowest recorded with RSTP(under case 7, when a port at the tree edge was failed). Inmost cases with MTP the tree resolves with less than 5MTP messages.
3) Summary 5-switch Protocol recoveryThe profound difference in PRT noticed between RSTP
and MTP is because of the VIDs used by MTP to simplifyboth tree construction and pruning operations. With MTP,the VIDs maintain the tree information, whereas withRSTP, each switch has to maintain its ports in Root,Designated or Alternate role to define the spanning tree.Thus, in the event of a topology changes, all switchesexchange BPDUs, to resolve the port roles and repair thetree.
C. Medium Topology (8 switches)
The 8-switch topology running RSTP, along with theport roles is given in Figure 8. As before we failed singleports as indicated in column 2 of Table 3. We also recordthe port roles.
TABLE I. RSTP CONVERGENCE IN A 5-NODE TOPOLOGY
C
as
e
Failed Port -
Role
FDT-
initiated
PRT PR
S
TCNs
1 Root(2) ---D 5.115s by
S2
3.519s 9 24
2 S1(1) -----R 0s by
S1
3.523s 13 20
3 S1(3) -----D 4.030s by
S2
2.999s 3 16
4 S1(2)------D 4.810s by
S3
3.018s 8 25
5 S3(1) ----R 0s by
S3
18ms 5 26
6 S3(2)------D 4.733s by
S4
3.164s 3 18
7 S4(1) -----R 0s by
S4
9ms 5 0
R- Root port, D- Designated port, FDT – Failure Detection time,
PRT – Protocol Recovery Time, CT- Convergence time, PRS –
Port/Role State Changes, TCN – Topology Change Notifications
TABLE II. MTP CONVERGENCE IN A 5-NODE TOPOLOGY
Cas
e
Failed Port –
(C)PVID
FDT PRT Messages
1 Root(1)-----CPVID 1.15s 1.5 ms 2
2 S1(1)-----PVID 2.71s 0.14 ms 3
3 S1(3)-----X No Impact
4 S1(2)-----CPVID 1.8 ms 4
5 S3(1)----- X No Impact
6 S3(2)-----PVID 1.77 ms 2
7 S4(1)----- PVID 0.7 ms 2
X – Port not part of tree
Figure 7. MTP 5 Node Topology with PVID, CPVID
Figure 8. RSTP 8 Node Topology with Port Roles
45Copyright (c) IARIA, 2020. ISBN: 978-1-61208-786-3
ICNS 2020 : The Sixteenth International Conference on Networking and Services
54 / 81
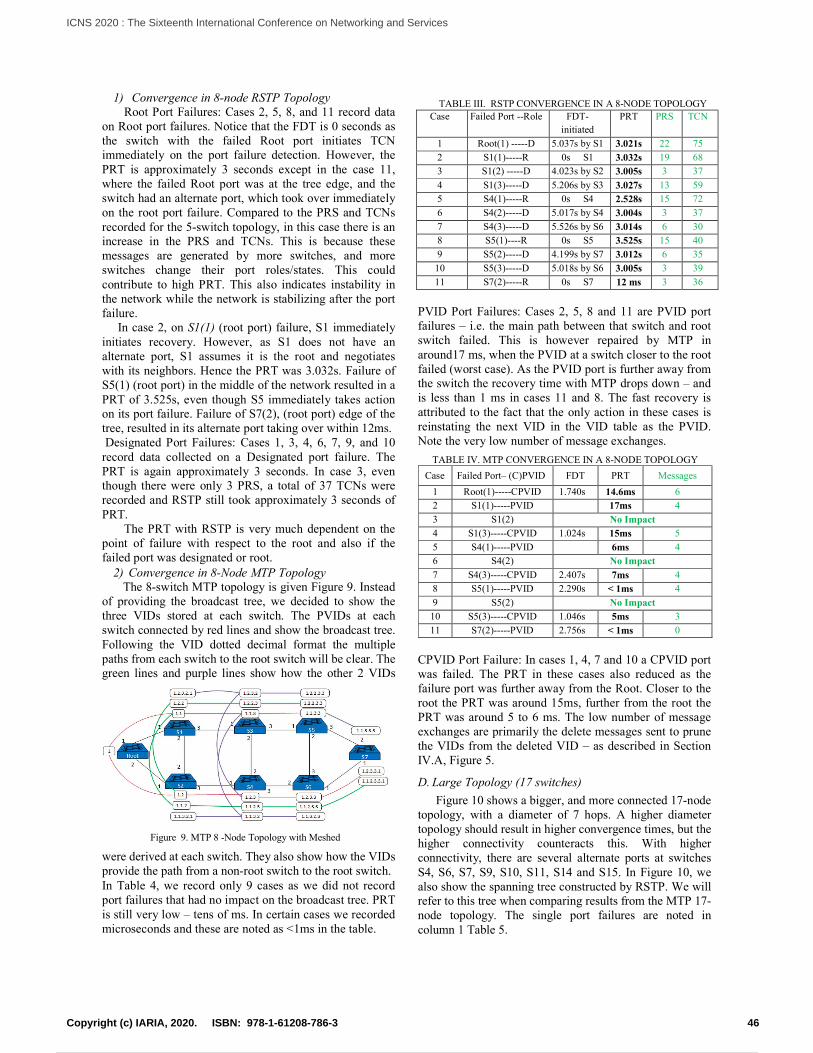
1) Convergence in 8-node RSTP TopologyRoot Port Failures: Cases 2, 5, 8, and 11 record data
on Root port failures. Notice that the FDT is 0 seconds asthe switch with the failed Root port initiates TCNimmediately on the port failure detection. However, thePRT is approximately 3 seconds except in the case 11,where the failed Root port was at the tree edge, and theswitch had an alternate port, which took over immediatelyon the root port failure. Compared to the PRS and TCNsrecorded for the 5-switch topology, in this case there is anincrease in the PRS and TCNs. This is because thesemessages are generated by more switches, and moreswitches change their port roles/states. This couldcontribute to high PRT. This also indicates instability inthe network while the network is stabilizing after the portfailure.
In case 2, on S1(1) (root port) failure, S1 immediatelyinitiates recovery. However, as S1 does not have analternate port, S1 assumes it is the root and negotiateswith its neighbors. Hence the PRT was 3.032s. Failure ofS5(1) (root port) in the middle of the network resulted in aPRT of 3.525s, even though S5 immediately takes actionon its port failure. Failure of S7(2), (root port) edge of thetree, resulted in its alternate port taking over within 12ms.Designated Port Failures: Cases 1, 3, 4, 6, 7, 9, and 10
record data collected on a Designated port failure. ThePRT is again approximately 3 seconds. In case 3, eventhough there were only 3 PRS, a total of 37 TCNs wererecorded and RSTP still took approximately 3 seconds ofPRT.
The PRT with RSTP is very much dependent on thepoint of failure with respect to the root and also if thefailed port was designated or root.
2) Convergence in 8-Node MTP TopologyThe 8-switch MTP topology is given Figure 9. Instead
of providing the broadcast tree, we decided to show thethree VIDs stored at each switch. The PVIDs at eachswitch connected by red lines and show the broadcast tree.Following the VID dotted decimal format the multiplepaths from each switch to the root switch will be clear. Thegreen lines and purple lines show how the other 2 VIDs
were derived at each switch. They also show how the VIDsprovide the path from a non-root switch to the root switch.In Table 4, we record only 9 cases as we did not recordport failures that had no impact on the broadcast tree. PRTis still very low – tens of ms. In certain cases we recordedmicroseconds and these are noted as <1ms in the table.
PVID Port Failures: Cases 2, 5, 8 and 11 are PVID portfailures – i.e. the main path between that switch and rootswitch failed. This is however repaired by MTP inaround17 ms, when the PVID at a switch closer to the rootfailed (worst case). As the PVID port is further away fromthe switch the recovery time with MTP drops down – andis less than 1 ms in cases 11 and 8. The fast recovery isattributed to the fact that the only action in these cases isreinstating the next VID in the VID table as the PVID.Note the very low number of message exchanges.
CPVID Port Failure: In cases 1, 4, 7 and 10 a CPVID portwas failed. The PRT in these cases also reduced as thefailure port was further away from the Root. Closer to theroot the PRT was around 15ms, further from the root thePRT was around 5 to 6 ms. The low number of messageexchanges are primarily the delete messages sent to prunethe VIDs from the deleted VID – as described in SectionIV.A, Figure 5.
D. Large Topology (17 switches)
Figure 10 shows a bigger, and more connected 17-nodetopology, with a diameter of 7 hops. A higher diametertopology should result in higher convergence times, but thehigher connectivity counteracts this. With higherconnectivity, there are several alternate ports at switchesS4, S6, S7, S9, S10, S11, S14 and S15. In Figure 10, wealso show the spanning tree constructed by RSTP. We willrefer to this tree when comparing results from the MTP 17-node topology. The single port failures are noted incolumn 1 Table 5.
TABLE III. RSTP CONVERGENCE IN A 8-NODE TOPOLOGY
Case Failed Port --Role FDT-
initiated
PRT PRS TCN
1 Root(1) -----D 5.037s by S1 3.021s 22 75
2 S1(1)-----R 0s S1 3.032s 19 68
3 S1(2) -----D 4.023s by S2 3.005s 3 37
4 S1(3)-----D 5.206s by S3 3.027s 13 59
5 S4(1)-----R 0s S4 2.528s 15 72
6 S4(2)-----D 5.017s by S4 3.004s 3 37
7 S4(3)-----D 5.526s by S6 3.014s 6 30
8 S5(1)----R 0s S5 3.525s 15 40
9 S5(2)-----D 4.199s by S7 3.012s 6 35
10 S5(3)-----D 5.018s by S6 3.005s 3 39
11 S7(2)-----R 0s S7 12 ms 3 36
TABLE IV. MTP CONVERGENCE IN A 8-NODE TOPOLOGY
Case Failed Port– (C)PVID FDT PRT Messages
1 Root(1)-----CPVID 1.740s 14.6ms 6
2 S1(1)-----PVID 17ms 4
3 S1(2) No Impact
4 S1(3)-----CPVID 1.024s 15ms 5
5 S4(1)-----PVID 6ms 4
6 S4(2) No Impact
7 S4(3)-----CPVID 2.407s 7ms 4
8 S5(1)-----PVID 2.290s < 1ms 4
9 S5(2) No Impact
10 S5(3)-----CPVID 1.046s 5ms 3
11 S7(2)-----PVID 2.756s < 1ms 0
Figure 9. MTP 8 -Node Topology with MeshedTrees
46Copyright (c) IARIA, 2020. ISBN: 978-1-61208-786-3
ICNS 2020 : The Sixteenth International Conference on Networking and Services
55 / 81
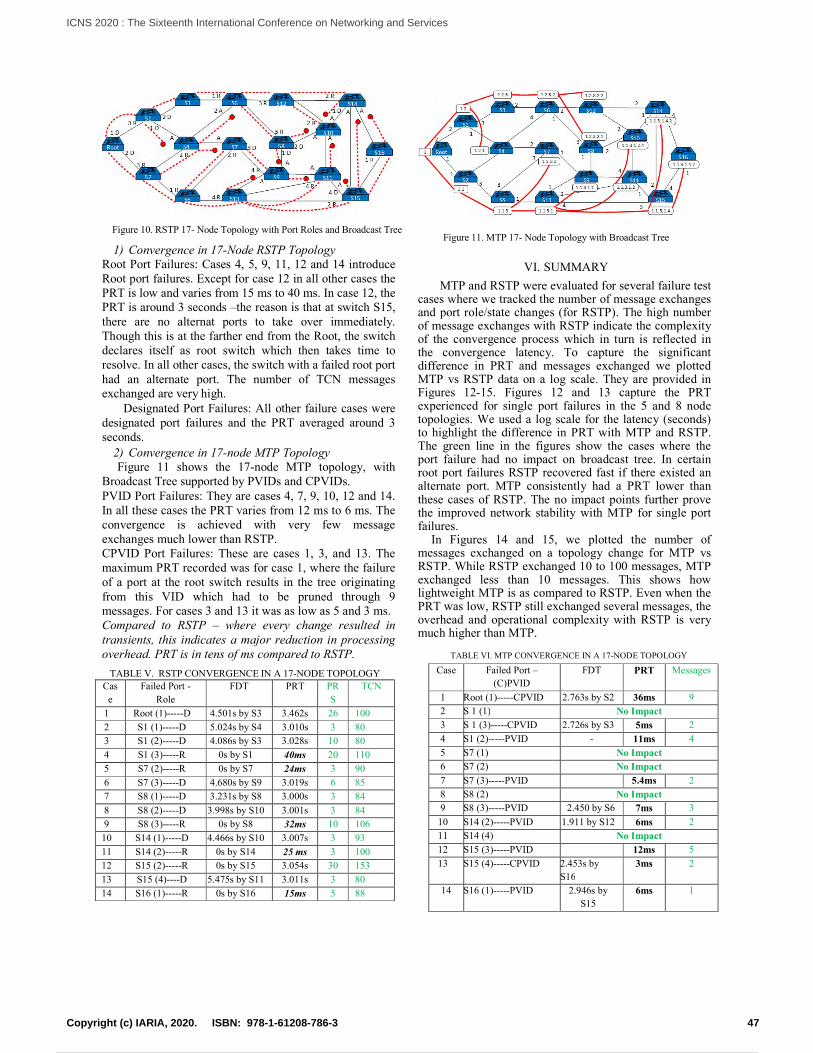
1) Convergence in 17-Node RSTP TopologyRoot Port Failures: Cases 4, 5, 9, 11, 12 and 14 introduceRoot port failures. Except for case 12 in all other cases thePRT is low and varies from 15 ms to 40 ms. In case 12, thePRT is around 3 seconds –the reason is that at switch S15,there are no alternat ports to take over immediately.Though this is at the farther end from the Root, the switchdeclares itself as root switch which then takes time toresolve. In all other cases, the switch with a failed root porthad an alternate port. The number of TCN messagesexchanged are very high.
Designated Port Failures: All other failure cases weredesignated port failures and the PRT averaged around 3seconds.
2) Convergence in 17-node MTP TopologyFigure 11 shows the 17-node MTP topology, with
Broadcast Tree supported by PVIDs and CPVIDs.PVID Port Failures: They are cases 4, 7, 9, 10, 12 and 14.In all these cases the PRT varies from 12 ms to 6 ms. Theconvergence is achieved with very few messageexchanges much lower than RSTP.CPVID Port Failures: These are cases 1, 3, and 13. Themaximum PRT recorded was for case 1, where the failureof a port at the root switch results in the tree originatingfrom this VID which had to be pruned through 9messages. For cases 3 and 13 it was as low as 5 and 3 ms.Compared to RSTP – where every change resulted intransients, this indicates a major reduction in processingoverhead. PRT is in tens of ms compared to RSTP.
VI. SUMMARY
MTP and RSTP were evaluated for several failure testcases where we tracked the number of message exchangesand port role/state changes (for RSTP). The high numberof message exchanges with RSTP indicate the complexityof the convergence process which in turn is reflected inthe convergence latency. To capture the significantdifference in PRT and messages exchanged we plottedMTP vs RSTP data on a log scale. They are provided inFigures 12-15. Figures 12 and 13 capture the PRTexperienced for single port failures in the 5 and 8 nodetopologies. We used a log scale for the latency (seconds)to highlight the difference in PRT with MTP and RSTP.The green line in the figures show the cases where theport failure had no impact on broadcast tree. In certainroot port failures RSTP recovered fast if there existed analternate port. MTP consistently had a PRT lower thanthese cases of RSTP. The no impact points further provethe improved network stability with MTP for single portfailures.
In Figures 14 and 15, we plotted the number ofmessages exchanged on a topology change for MTP vsRSTP. While RSTP exchanged 10 to 100 messages, MTPexchanged less than 10 messages. This shows howlightweight MTP is as compared to RSTP. Even when thePRT was low, RSTP still exchanged several messages, theoverhead and operational complexity with RSTP is verymuch higher than MTP.
TABLE V. RSTP CONVERGENCE IN A 17-NODE TOPOLOGY
Cas
e
Failed Port -
Role
FDT PRT PR
S
TCN
1 Root (1)-----D 4.501s by S3 3.462s 26 100
2 S1 (1)-----D 5.024s by S4 3.010s 3 80
3 S1 (2)-----D 4.086s by S3 3.028s 10 80
4 S1 (3)-----R 0s by S1 40ms 20 110
5 S7 (2)-----R 0s by S7 24ms 3 90
6 S7 (3)-----D 4.680s by S9 3.019s 6 85
7 S8 (1)-----D 3.231s by S8 3.000s 3 84
8 S8 (2)-----D 3.998s by S10 3.001s 3 84
9 S8 (3)-----R 0s by S8 32ms 10 106
10 S14 (1)-----D 4.466s by S10 3.007s 3 93
11 S14 (2)-----R 0s by S14 25 ms 3 100
12 S15 (2)-----R 0s by S15 3.054s 30 153
13 S15 (4)----D 5.475s by S11 3.011s 3 80
14 S16 (1)-----R 0s by S16 15ms 5 88
TABLE VI. MTP CONVERGENCE IN A 17-NODE TOPOLOGY
Case Failed Port –
(C)PVID
FDT PRT Messages
1 Root (1)-----CPVID 2.763s by S2 36ms 9
2 S 1 (1) No Impact
3 S 1 (3)-----CPVID 2.726s by S3 5ms 2
4 S1 (2)-----PVID - 11ms 4
5 S7 (1) No Impact
6 S7 (2) No Impact
7 S7 (3)-----PVID 5.4ms 2
8 S8 (2) No Impact
9 S8 (3)-----PVID 2.450 by S6 7ms 3
10 S14 (2)-----PVID 1.911 by S12 6ms 2
11 S14 (4) No Impact
12 S15 (3)-----PVID 12ms 5
13 S15 (4)-----CPVID 2.453s by
S16
3ms 2
14 S16 (1)-----PVID 2.946s by
S15
6ms 1
Figure 10. RSTP 17- Node Topology with Port Roles and Broadcast TreeFigure 11. MTP 17- Node Topology with Broadcast Tree
47Copyright (c) IARIA, 2020. ISBN: 978-1-61208-786-3
ICNS 2020 : The Sixteenth International Conference on Networking and Services
56 / 81
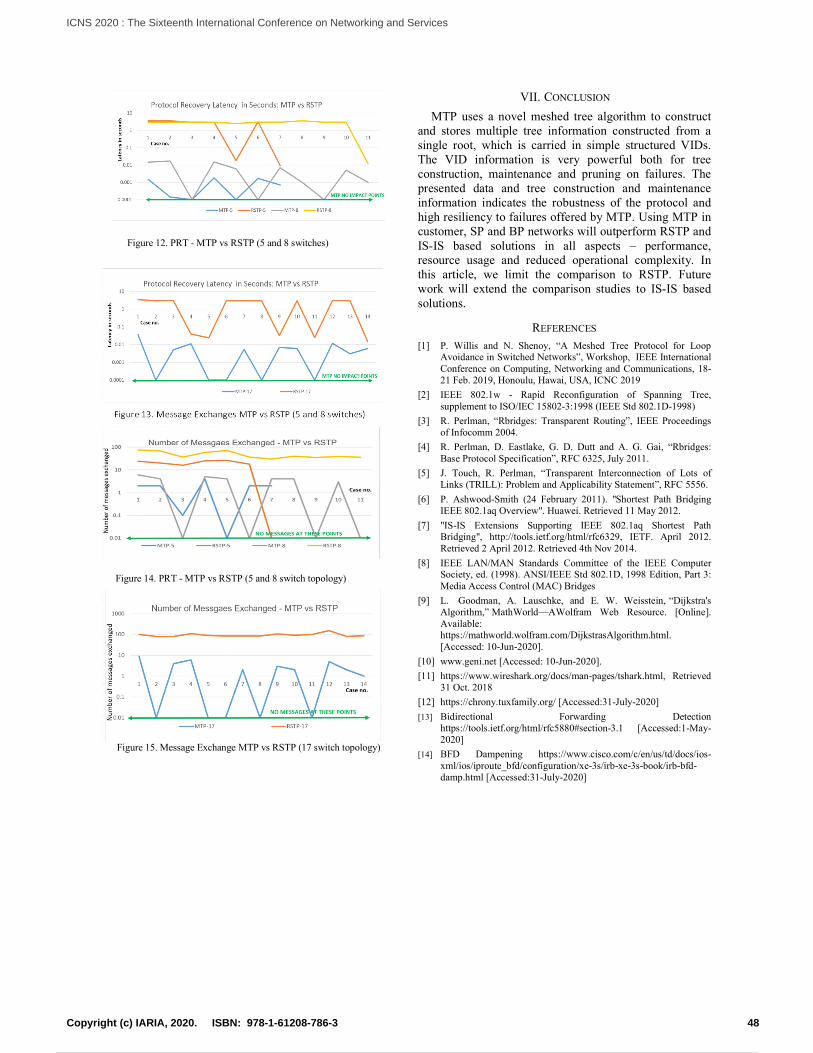
Figure 15. Message Exchange MTP vs RSTP (17 switch topology)
VII. CONCLUSION
MTP uses a novel meshed tree algorithm to constructand stores multiple tree information constructed from asingle root, which is carried in simple structured VIDs.The VID information is very powerful both for treeconstruction, maintenance and pruning on failures. Thepresented data and tree construction and maintenanceinformation indicates the robustness of the protocol andhigh resiliency to failures offered by MTP. Using MTP incustomer, SP and BP networks will outperform RSTP andIS-IS based solutions in all aspects – performance,resource usage and reduced operational complexity. Inthis article, we limit the comparison to RSTP. Futurework will extend the comparison studies to IS-IS basedsolutions.
REFERENCES
[1] P. Willis and N. Shenoy, “A Meshed Tree Protocol for LoopAvoidance in Switched Networks”, Workshop, IEEE InternationalConference on Computing, Networking and Communications, 18-21 Feb. 2019, Honoulu, Hawai, USA, ICNC 2019
[2] IEEE 802.1w - Rapid Reconfiguration of Spanning Tree,supplement to ISO/IEC 15802-3:1998 (IEEE Std 802.1D-1998)
[3] R. Perlman, “Rbridges: Transparent Routing”, IEEE Proceedingsof Infocomm 2004.
[4] R. Perlman, D. Eastlake, G. D. Dutt and A. G. Gai, “Rbridges:Base Protocol Specification”, RFC 6325, July 2011.
[5] J. Touch, R. Perlman, “Transparent Interconnection of Lots ofLinks (TRILL): Problem and Applicability Statement”, RFC 5556.
[6] P. Ashwood-Smith (24 February 2011). "Shortest Path BridgingIEEE 802.1aq Overview". Huawei. Retrieved 11 May 2012.
[7] "IS-IS Extensions Supporting IEEE 802.1aq Shortest PathBridging", http://tools.ietf.org/html/rfc6329, IETF. April 2012.Retrieved 2 April 2012. Retrieved 4th Nov 2014.
[8] IEEE LAN/MAN Standards Committee of the IEEE ComputerSociety, ed. (1998). ANSI/IEEE Std 802.1D, 1998 Edition, Part 3:Media Access Control (MAC) Bridges
[9] L. Goodman, A. Lauschke, and E. W. Weisstein, “Dijkstra'sAlgorithm,” MathWorld—AWolfram Web Resource. [Online].Available:https://mathworld.wolfram.com/DijkstrasAlgorithm.html.[Accessed: 10-Jun-2020].
[10] www.geni.net [Accessed: 10-Jun-2020].
[11] https://www.wireshark.org/docs/man-pages/tshark.html, Retrieved31 Oct. 2018
[12] https://chrony.tuxfamily.org/ [Accessed:31-July-2020]
[13] Bidirectional Forwarding Detectionhttps://tools.ietf.org/html/rfc5880#section-3.1 [Accessed:1-May-2020]
[14] BFD Dampening https://www.cisco.com/c/en/us/td/docs/ios-xml/ios/iproute_bfd/configuration/xe-3s/irb-xe-3s-book/irb-bfd-damp.html [Accessed:31-July-2020]
Figure 12. PRT - MTP vs RSTP (5 and 8 switches)
Figure 14. PRT - MTP vs RSTP (5 and 8 switch topology)
48Copyright (c) IARIA, 2020. ISBN: 978-1-61208-786-3
ICNS 2020 : The Sixteenth International Conference on Networking and Services
57 / 81

An Authentication Technique to Handle DDoS Attacks in Proxy-Based Architecture
Poonam Dharam Computer Science and Information Systems
Saginaw Valley State University Saginaw, MI, USA
email: [email protected]
Jarin Musarrat Computer Science and Information Systems
Saginaw Valley State University Saginaw, MI, USA
email: [email protected]
Abstract— Recent years have witnessed an increase in Distributed Denial of Service (DDoS) attacks that overwhelm available network and backend server resources such as bandwidth, buffers, etc. To handle such attacks, proxy-based network architectures have been implemented to manage and Load Balance incoming traffic by spawning new servers in the event of unexpected rise in network traffic. However, DDoS attacks continue to persist with the attack target shifting from the main backend application servers to proxy servers. The redirection of users to one of the available proxy servers results in the discovery of their (proxy server’s) IP address. A botnet can then be used by the attacker to generate a huge amount of traffic and direct it to the proxy server, thus causing DDoS. In this paper, we propose an authentication technique to ensure the uniform distribution of the incoming requests and to avoid/drop the illegitimate requests from occupying servers’ resources. Our simulation results show that the proposed solution detects and handles DDoS attacks in an efficient manner.
Keywords-Distributed Denial of Service; proxy-based architecture; flooding attacks.
I. INTRODUCTION
Internet Distributed Denial of Service (DDoS) attacks have emerged as one of the biggest threats to Internet security, with thousands of them occurring every year. Hackers are turning to DDoS to bring down organizations’ services and to compromise their sensitive data. Recent times have witnessed a dramatic increase in such attacks due to the declining cost of launching an attack and the popularity of Internet of Things (IoT) devices [1] that could be used as botnets. Recently, the Mirai botnet [2], that brought down major services including Twitter, Netflix, CNN (Cable News Network), and many others, was largely made up of IoT devices such as digital cameras and Digital Video Recorder (DVR) players [3].
The DDoS attack mainly targets the availability of a
service by exhausting the resources associated with the service. In the context of computer and communications, the focus is generally on network services that are attacked over their network connection. A classic flooding DDoS attack [4] involves a significant amount of malicious traffic directed towards a target server. The volume of the attack traffic can
be scaled up by using multiple systems that are either compromised user workstations, PCs, or IoT. For example, attackers identify devices that use default login credentials to gain backdoor access to them and install an attack agent that they can control. A large collection of such systems under the control of one attacker can be created, collectively forming a botnet. This traffic overwhelms any legitimate traffic, effectively denying legitimate users’ access to the server.
Internet Control Message Protocol (ICMP), User
Datagram Protocol (UDP), or Transmission Control Protocol (TCP) SYN packets are most commonly used for flooding attacks. Any packet that is permitted to flow over the links, towards the targeted system, can be used to fill up the available capacity. Such attacks flood the network link with a huge number of malicious packets in turn competing with regular user traffic flowing to the server. Many packets, mostly valid traffic, will be dropped on the path to the server due to the congestion caused by flooding. For example, a DDoS flooding attack on a Web Server involves several valid Hyper Text Transport Protocol (HTTP) requests, each using significant server resources. This then limits the server’s ability to service requests from other users. For instance, HTTP requests use TCP as transport layer protocol. For each TCP connection made, some amount of buffer space at the server’s end is reserved for reliable data transfer, congestion control, and flow control. Also, the server only has a limited amount of memory for user buffer space. Once the TCP connections fill up the server’s buffer, future requests will be either cached or dropped until the buffer space frees up [5]. Another example would be a Web Server that includes the ability to make database queries. If a database query that takes a large amount of time for the server to respond can be constructed, then an attacker could generate many such queries to overload the server. This limits the ability to respond to valid requests from other servers.
Most of the DDoS attacks use forged source addresses to
generate large volumes of packets with the target system as destination and randomly selected, usually different, source address for each packet. This, in turn, makes it harder to identify the attacking system. Also, the volume of network traffic can be easily scaled up by using multiple systems.
49Copyright (c) IARIA, 2020. ISBN: 978-1-61208-786-3
ICNS 2020 : The Sixteenth International Conference on Networking and Services
58 / 81
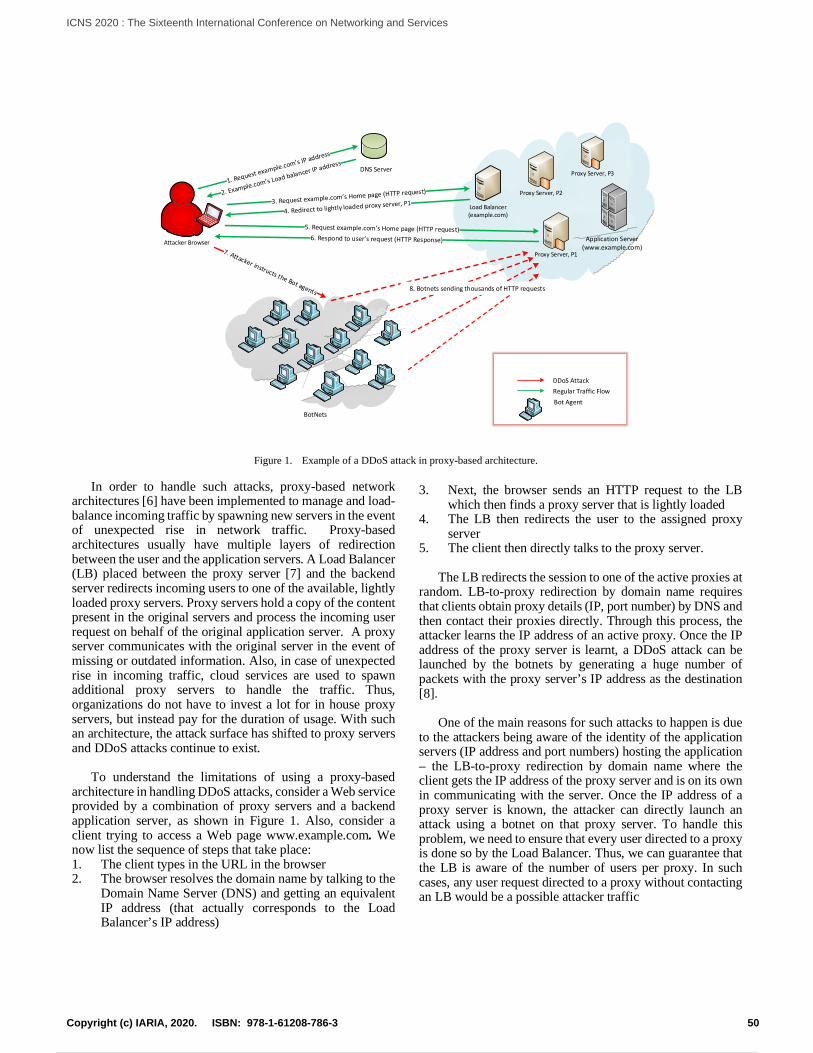
In order to handle such attacks, proxy-based network architectures [6] have been implemented to manage and load-balance incoming traffic by spawning new servers in the event of unexpected rise in network traffic. Proxy-based architectures usually have multiple layers of redirection between the user and the application servers. A Load Balancer (LB) placed between the proxy server [7] and the backend server redirects incoming users to one of the available, lightly loaded proxy servers. Proxy servers hold a copy of the content present in the original servers and process the incoming user request on behalf of the original application server. A proxy server communicates with the original server in the event of missing or outdated information. Also, in case of unexpected rise in incoming traffic, cloud services are used to spawn additional proxy servers to handle the traffic. Thus, organizations do not have to invest a lot for in house proxy servers, but instead pay for the duration of usage. With such an architecture, the attack surface has shifted to proxy servers and DDoS attacks continue to exist.
To understand the limitations of using a proxy-based
architecture in handling DDoS attacks, consider a Web service provided by a combination of proxy servers and a backend application server, as shown in Figure 1. Also, consider a client trying to access a Web page www.example.com. We now list the sequence of steps that take place: 1. The client types in the URL in the browser 2. The browser resolves the domain name by talking to the
Domain Name Server (DNS) and getting an equivalent IP address (that actually corresponds to the Load Balancer’s IP address)
3. Next, the browser sends an HTTP request to the LB which then finds a proxy server that is lightly loaded
4. The LB then redirects the user to the assigned proxy server
5. The client then directly talks to the proxy server. The LB redirects the session to one of the active proxies at
random. LB-to-proxy redirection by domain name requires that clients obtain proxy details (IP, port number) by DNS and then contact their proxies directly. Through this process, the attacker learns the IP address of an active proxy. Once the IP address of the proxy server is learnt, a DDoS attack can be launched by the botnets by generating a huge number of packets with the proxy server’s IP address as the destination [8].
One of the main reasons for such attacks to happen is due
to the attackers being aware of the identity of the application servers (IP address and port numbers) hosting the application – the LB-to-proxy redirection by domain name where the client gets the IP address of the proxy server and is on its own in communicating with the server. Once the IP address of a proxy server is known, the attacker can directly launch an attack using a botnet on that proxy server. To handle this problem, we need to ensure that every user directed to a proxy is done so by the Load Balancer. Thus, we can guarantee that the LB is aware of the number of users per proxy. In such cases, any user request directed to a proxy without contacting an LB would be a possible attacker traffic
Proxy Server, P3
Load Balancer(example.com)
Proxy Server, P1
Application Server(www.example.com)
Attacker Browser
DNS Server
Proxy Server, P2
Bot Agent
DDoS AttackRegular Traffic Flow
8. Botnets sending thousands of HTTP requests
BotNets
Figure 1. Example of a DDoS attack in proxy-based architecture.
50Copyright (c) IARIA, 2020. ISBN: 978-1-61208-786-3
ICNS 2020 : The Sixteenth International Conference on Networking and Services
59 / 81
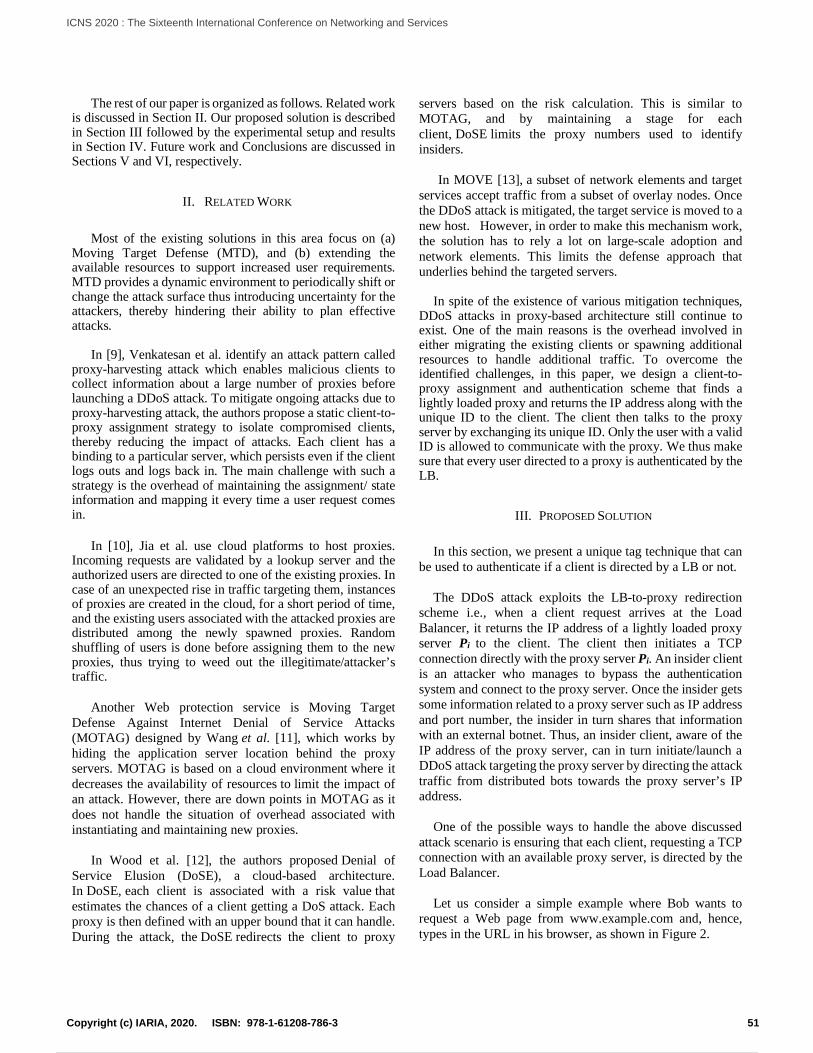
The rest of our paper is organized as follows. Related work is discussed in Section II. Our proposed solution is described in Section III followed by the experimental setup and results in Section IV. Future work and Conclusions are discussed in Sections V and VI, respectively.
II. RELATED WORK
Most of the existing solutions in this area focus on (a) Moving Target Defense (MTD), and (b) extending the available resources to support increased user requirements. MTD provides a dynamic environment to periodically shift or change the attack surface thus introducing uncertainty for the attackers, thereby hindering their ability to plan effective attacks.
In [9], Venkatesan et al. identify an attack pattern called proxy-harvesting attack which enables malicious clients to collect information about a large number of proxies before launching a DDoS attack. To mitigate ongoing attacks due to proxy-harvesting attack, the authors propose a static client-to-proxy assignment strategy to isolate compromised clients, thereby reducing the impact of attacks. Each client has a binding to a particular server, which persists even if the client logs outs and logs back in. The main challenge with such a strategy is the overhead of maintaining the assignment/ state information and mapping it every time a user request comes in.
In [10], Jia et al. use cloud platforms to host proxies. Incoming requests are validated by a lookup server and the authorized users are directed to one of the existing proxies. In case of an unexpected rise in traffic targeting them, instances of proxies are created in the cloud, for a short period of time, and the existing users associated with the attacked proxies are distributed among the newly spawned proxies. Random shuffling of users is done before assigning them to the new proxies, thus trying to weed out the illegitimate/attacker’s traffic.
Another Web protection service is Moving Target Defense Against Internet Denial of Service Attacks (MOTAG) designed by Wang et al. [11], which works by hiding the application server location behind the proxy servers. MOTAG is based on a cloud environment where it decreases the availability of resources to limit the impact of an attack. However, there are down points in MOTAG as it does not handle the situation of overhead associated with instantiating and maintaining new proxies.
In Wood et al. [12], the authors proposed Denial of Service Elusion (DoSE), a cloud-based architecture. In DoSE, each client is associated with a risk value that estimates the chances of a client getting a DoS attack. Each proxy is then defined with an upper bound that it can handle. During the attack, the DoSE redirects the client to proxy
servers based on the risk calculation. This is similar to MOTAG, and by maintaining a stage for each client, DoSE limits the proxy numbers used to identify insiders.
In MOVE [13], a subset of network elements and target
services accept traffic from a subset of overlay nodes. Once the DDoS attack is mitigated, the target service is moved to a new host. However, in order to make this mechanism work, the solution has to rely a lot on large-scale adoption and network elements. This limits the defense approach that underlies behind the targeted servers.
In spite of the existence of various mitigation techniques, DDoS attacks in proxy-based architecture still continue to exist. One of the main reasons is the overhead involved in either migrating the existing clients or spawning additional resources to handle additional traffic. To overcome the identified challenges, in this paper, we design a client-to-proxy assignment and authentication scheme that finds a lightly loaded proxy and returns the IP address along with the unique ID to the client. The client then talks to the proxy server by exchanging its unique ID. Only the user with a valid ID is allowed to communicate with the proxy. We thus make sure that every user directed to a proxy is authenticated by the LB.
III. PROPOSED SOLUTION
In this section, we present a unique tag technique that can be used to authenticate if a client is directed by a LB or not.
The DDoS attack exploits the LB-to-proxy redirection scheme i.e., when a client request arrives at the Load Balancer, it returns the IP address of a lightly loaded proxy server Pi to the client. The client then initiates a TCP connection directly with the proxy server Pi. An insider client is an attacker who manages to bypass the authentication system and connect to the proxy server. Once the insider gets some information related to a proxy server such as IP address and port number, the insider in turn shares that information with an external botnet. Thus, an insider client, aware of the IP address of the proxy server, can in turn initiate/launch a DDoS attack targeting the proxy server by directing the attack traffic from distributed bots towards the proxy server’s IP address.
One of the possible ways to handle the above discussed
attack scenario is ensuring that each client, requesting a TCP connection with an available proxy server, is directed by the Load Balancer.
Let us consider a simple example where Bob wants to
request a Web page from www.example.com and, hence, types in the URL in his browser, as shown in Figure 2.
51Copyright (c) IARIA, 2020. ISBN: 978-1-61208-786-3
ICNS 2020 : The Sixteenth International Conference on Networking and Services
60 / 81
We now list the sequence of steps that takes place: 1. Bob’s browser talks to the DNS server requesting for
example.com’s IP address; DNS returns the IP address corresponding to the LB;
2. Bob’s browser then sends a HTTP request to the LB, requesting to access example.com’s home page;
3. The LB generates a unique tag and returns it to the user
along with the IP address of the proxy. The unique tag is generated as a function of (proxy server, LB, client) IP address and client’s port number. To avoid the tag being forged, the tag is encrypted using proxy’s public key;
4. The user then sends a HTTP request to the proxy server
along with the unique tag assigned to it; 5. The proxy first decodes the unique tag, using its
private/secret key and verifies the credentials present in the tag. On successful verification of the client, the proxy sends a corresponding HTTP response; otherwise, the client request/connection is dropped.
We now discuss a few attack scenarios and how our proposed scheme helps in dealing with such attacks.
1. If more than one user arrives at the proxy with the same unique tag, this situation implies that the unique tag was forged and used for another user. In that case, the user IP address and port number are monitored for possible attack traffic.
2. If an attacker manages to find the IP address of another proxy server, through another client, it is possible that the attacker might direct all the clients with a unique tag ID towards a single server. To handle this situation, the function to generate tags is dependent on the client’s IP address, LB’s IP address, and proxy server’s IP address. Thus, only when the client arrives at the right proxy server, its request will be serviced. Thus, we make sure that the flow of traffic is regulated.
IV. EXPERIMENTAL SETUP AND SIMULATION RESULTS For our experiments, we simulate a simple network using
socket programming in Java. Each component (LB, clients, proxy servers, and application servers) is a Java class running on the localhost i.e., 127.0.0.1. For our experimental setup, we have a LB that processes incoming requests from the client, and four proxy servers, which are, in turn, connected to the application servers.
Proxy Server, P2
Load Balancer(example.com)
Proxy Server, P1
Application Server
(www.example.com)Request example.com’s IP address
example.com’s Load Balancer IP address
Request example.com’s home page
Redirect to lightly loaded proxy Server,P1returning a unique tag
Request example.com’s home page (HTTP Request)Send the unique tag assigned by the LB
Verify the unique tagIf valid tag, respond to user’s request
Botnets sending series of HTTP requests (multiple clients, each with different IP)
DNS Server Attacker Browser
Requests from botnetsare dropped in the
network due to invalid tag. Only the requests
forwarded by the LB will have a valid tag.
BotNets
Figure 2. Our proposed solution.
52Copyright (c) IARIA, 2020. ISBN: 978-1-61208-786-3
ICNS 2020 : The Sixteenth International Conference on Networking and Services
61 / 81
Our implementation works as follows:
1. Initially, when a user request arrives at the LB, it generates a unique tag which is a function of Source/client, LB, and proxy server’s IP address and encodes it into a secret tag.
2. The user request is then redirected by the LB using HTTP response 302 Found. The secret tag generated is placed as a part of the Location field in the HTTP response, along with the proxy server’s IP address.
3. The redirected user request then arrives at the proxy server, where the server first extracts the unique tag and verifies the IP addresses.
4. If the secret tag is a valid one, the user request is processed; otherwise, the request is dropped. The requests will be dropped due to invalid/missing secret tags.
We simulated about 50 valid user requests by hosting client
programs and sending simple HTTP GET requests for a valid document available at the Application server. Additionally, we simulated about 30 requests which were mainly attack traffic. The way we simulated the attack traffic is described below. We assume user-1 is the attacker.
1. A valid user request is sent to the LB from user-1; 2. The LB then finds a proxy server with the lowest load
and returns the IP address of the proxy with a unique tag that contains user-1’s IP address and port number;
3. User-1 then generates 30 requests directed to the proxy servers chosen in step-2;
In terms of performance evaluation, our primitive
implementation resulted in a uniform load distribution, each proxy server having an average of about 7 users. Additionally, our proposed model was able to detect malicious/ illegitimate traffic successfully. All the valid requests were successfully redirected by the LB to available proxy servers such that the load on each proxy server was close evenly distributed. In case of attack traffic, the user requests with unique valid tags were successfully authenticated and processed by proxy servers, whereas the attack traffic without valid tags was dropped by the proxy servers.
V. FUTURE WORK
In our proposed solution, the encryption of the tag using secret key requires both the LB and the proxy server to exchange a key periodically that will be used to protect the transferred data. The encryption process may add a little bit of overhead during the initial key exchange, converting plain text to ciphertext at the LB’s end and vice versa at the proxy server’s end. We intend to study their effects on performance in terms of the time take to direct an incoming client to one of the proxy servers, the time it takes to process the client’s HTTP request, as well as the number of false positives and negatives during DDoS detection. Additionally, we would like to compare our work with available solutions and current commercial state.
VI. CONCLUSIONS In this paper, we propose an authentication mechanism to
detect and prevent DDoS attacks in a proxy-based architecture. Our proposed technique ensures that each client request arriving at a proxy server is directed by the Load Balancer. A proxy server will only service those clients that are originally redirected by the Load Balancer. Since the Load Balancer’s job is to uniformly distribute the incoming client traffic among existing proxy servers, the chances of a DDoS attack due to a huge amount of incoming traffic is mitigated. Thus, the DDoS attacks caused due to botnets can be easily handled.
REFERENCES
[1] M. Sysel and O. Doležal, “An Educational HTTP Proxy Server,” In Procedia Engineering, vol. 69, 2014, pp. 128–132.
[2] M. Antonakakis et al., “Understanding the Mirai Botnet,” USENIX Security Symposium, 2017, pp. 1093–1110.
[3] N. Woolf, “DDoS Attack That Disrupted Internet Was Largest of Its Kind in History, Experts Say,” in The Guardian, Guardian News and Media, 26 Oct. 2016, Retrieved from: www.theguardian.com/technology/2016/oct/26/ddos-attack-dyn-mirai-botnet [accesses Oct., 2016].
[4] S. Mahrach and A. Haqiq, “DDoS Flooding Attack Mitigation in Software Defined Networks,” in International Journal of Advanced Computer Science and Applications, vol. 11, 2020.
[5] K. S. Vanitha, S. V. UMA, and S. K. Mahidhar, "Distributed denial of service: Attack techniques and mitigation," International Conference on Circuits, Controls, and Communications (CCUBE), 2017, pp. 226-231, doi: 10.1109/CCUBE.2017.8394146.
[6] S. Kumar, P. Tiwari, and M. Zymbler, “Internet of Things is a revolutionary approach for future technology enhancement: a review,” Journal of Big Data, vol. 6, 2019 doi: 10.1186/s40537-019-0268-2
[7] A. Baptiste, “Use a Load Balancer as a First Row of Defense Against DDOS,” in Haproxy, Feb. 27, 2012, Retrieved from: www.haproxy.com/blog/use-a-load-balancer-as-a-first-row-of-defense-against-ddos/ [accesses Feb., 2012]
[8] P. Jeff, J. Blankenship, and A. Cser, “How The Mirai Botnet is Fueling Today’s Largest and Most Crippling DDoS Attacks,” in Akamai Forrester Research 24 Oct. 2016, Retrieved from: https://www.akamai.com/uk/en/multimedia/documents/white-paper/akamai-mirai-botnet-and-attacks-against-dns-servers-white-paper.pdf [accesses Oct., 2016]
[9] S. Venkatesan, M. Albanese, K. Amin, S. Jajodia, and M. Wright, “A Moving Target Defense Approach to Mitigate DDoS Attacks against Proxy-Based Architectures,” in Proceedings of the Communications and Network Security (CNS), 2016, pp. 198-206.
[10] Q. Jia, H. Wang, D. Fleck, F. Li, A. Stavrou, and W. Powell, “Catch me if you can: A cloud-enabled DDoS defense,” in Proceedings of the 44th Annual IEEE/IFIP International Conference on Dependable Systems and Networks (DSN), 2014, pp. 264 – 275.
[11] H. Wang, Q. Jia, D. Fleck, W. Powell, F. Li, and A. Stavrou, “A Moving Target DDoS Defense Mechanism,” Computer Communications, vol. 46, June 2014, pp. 10 – 21.
[12] P. Wood, C. Gutierrez, and S. Bagchi, “Denial of Service Elusion (DoSE): Keeping clients connected for less,” in
53Copyright (c) IARIA, 2020. ISBN: 978-1-61208-786-3
ICNS 2020 : The Sixteenth International Conference on Networking and Services
62 / 81

Proceedings of the 34th IEEE Symposium on Reliable Distributed Systems (SRDS), 2015, pp. 94–103.
[13] A. Stavrou, A. D. Keromytis, J. Nieh, V. Misra, and D. Rubenstein, “MOVE: An end-to-end solution to network denial of service,” in Proceedings of the Network and Distributed System Security Symposium (NDSS), February 2005, pp. 81–96.
54Copyright (c) IARIA, 2020. ISBN: 978-1-61208-786-3
ICNS 2020 : The Sixteenth International Conference on Networking and Services
63 / 81
Towards Stable and Hybrid UDP-TCP Relay Routing for Streamingand VoIP Services
Salim MohamedElectrical and Computer Engineering
Michigan State UniversityEast Lansing, USA
Email: [email protected]
Osama MohammedService Delivery and Management
InnovawayNapoli, Italy
Email: [email protected]
Abstract—Relay or overlay routing for IP networks has beenwell-documented in past years. However, the implementationcost of relay solutions has not yet been conclusively identified.Dynamic-relay routing relies on periodic probing for enhancedperformance while static-relay routing uses less and non-periodicprobes to measure latency and packet loss. For both types, thereexists considerable research focused on understanding routingdynamics. However, the literature has insufficient exploration ofrelay attributes, such as stability and mechanisms for reducingthe relay probing burden. This paper, in particular, examinesrelay statistical boundaries and characteristics, such as thenumber of hops in a minimum delay and relay path or Hop-To-Live (HTL) count inherited from the self-similar model ofInternet data. The HTL is introduced in a novel analysis to assistin predicting minimum and stable relay paths while minimizingprobing overhead. For doing so, our work is based on analyzing awide-set on 19, 460 Ping and 14, 762 IPerf paths, respectively, ofa network of 140 Planetlab nodes. Further, we briefly evaluatedthe performance of a new hybrid User Datagram Protocol andTransmission Control Protocol (UDP-TCP) relay streaming overan inexpensive relay selection mechanism managed by a stableHTL modeling. Here, we highlight a preliminary performance ofapplying a layer-3 and hybrid UDP-TCP streaming a replacementfor the current TCP-based stream services, such as YouTube andVoice over IP (VoIP). The main results emphasize the unnecessaryrepetitive probing burden over the period of 24 hours instead ofa careful set of measurements for capturing and predicting relaychanges. This work validates this claim by presenting that ourimplemented HTL-based path estimation predicts stable relaypaths for the hybrid UDP-TCP streaming to overcome the highdrop-rates caused by the individual TCP or UDP streamingservices.
Keywords-UDP streaming; relay characteristics; Internetmeasurements.
I. INTRODUCTION
A. Overview
Existing relay solutions are completely dynamic while rely-ing on continuous probing when measuring routing changes.In contrast, static relay, routing metrics, such as latency andpacket loss are not continuously measured. The ultimate goalof the static relay is reliability so that nodes remain connected.Dynamic relay, however, is used to improve the Quality of
Service (QoS) periodically. The study in [11] focused onunderstanding Time-To-Live (TTL) changes in the IP substrate(underlay) routing. However, here, we introduce and examinethe influence of a new relay (overlay) routing metric thatdefines the number of hops in a minimum delay relay path. Forthe remainder of this paper, we refer to this metric as calledthe Hop-To-Live (HTL). Generally, our work is a compositionof two parts. The first part is an analysis of the stabilitycharacteristics of relay (overlay) routing. Preliminary, in thesecond part, we performed a performance evaluation of a newstreaming scheme called hybrid UDP-TCP streaming. The ideahere is new and simply relies on combining for each streamtwo distinct transport sessions. The first is a conventional TCPsession for handling errors and out-of-sequence packets in thestream, and this session is only invoked whenever such anerror occurs. The second session is a normal UDP sessionthat carries the major part of the stream. The performanceof our hybrid protocol is simply examined by the UDP droprate, at which the TCP back-end protocol is involved. Thisevaluation was performed using relay paths determined via ourproposed estimation-based path selection model. This modeloperates based on the HTL characteristics described in thefirst part. The input of this model is as a set of 19, 460 relaypaths connect a 140 Planetlab nodes, and outputs a smaller setof stable relay paths for each end-to-end pair of nodes. Theinput relay paths represent the relay features used to derive ourpath estimation model, and all such paths capture only routingchanges as we vary Round-Trip-Time (RTT), traffic sizes, andrates.
The main question addressed here is to determine how stableis a measurement-less model of relay paths over 24−hoursso that a single instance of underlay measurement could bereused for estimating new stable paths. The next inquiry isto look into the scale of achieved benefit when implementingour estimation model into real-time scenarios, such as a pathserving for the hybrid UDP-TCP protocol.
The motivation behind using hybrid UDP-TCP instead ofTCP is slightly similar to the Quick UDP Internet Connections(QUIC) protocol in [24]. QUIC is a multi-purpose application-layer protocol initially designed by Google Langley et al.[25]. Later, in 2013 QUIC was announced publicly for exper-
55Copyright (c) IARIA, 2020. ISBN: 978-1-61208-786-3
ICNS 2020 : The Sixteenth International Conference on Networking and Services
64 / 81
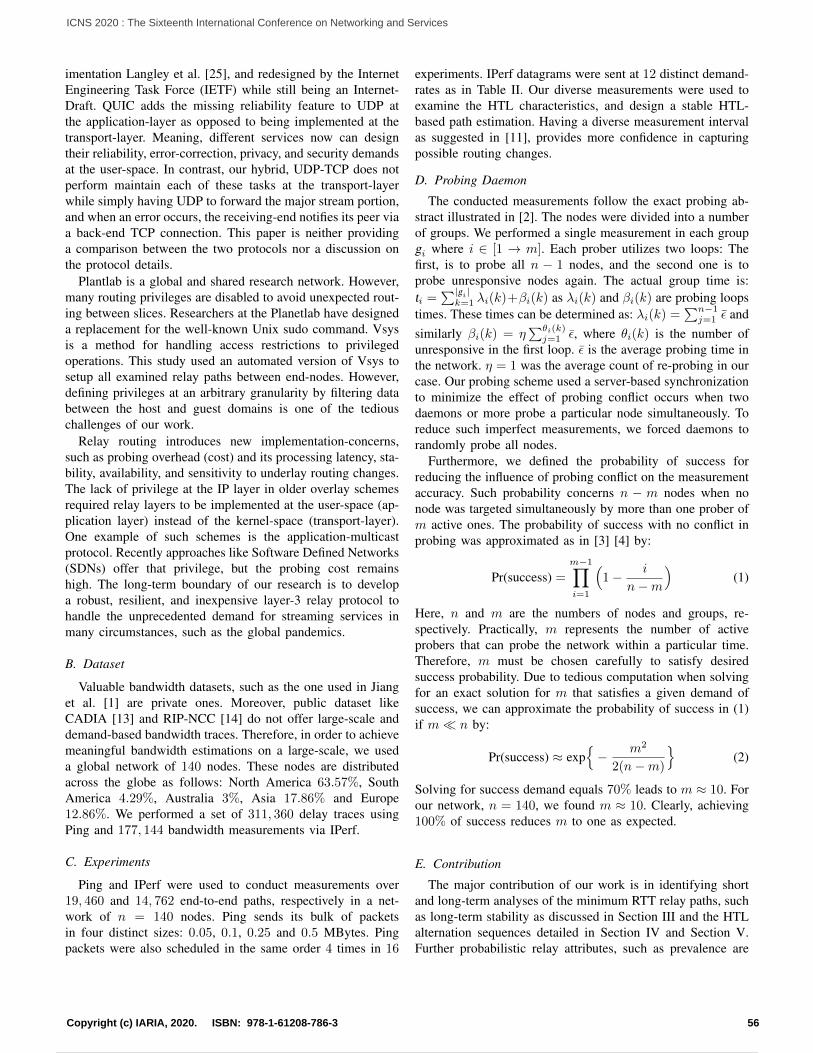
imentation Langley et al. [25], and redesigned by the InternetEngineering Task Force (IETF) while still being an Internet-Draft. QUIC adds the missing reliability feature to UDP atthe application-layer as opposed to being implemented at thetransport-layer. Meaning, different services now can designtheir reliability, error-correction, privacy, and security demandsat the user-space. In contrast, our hybrid, UDP-TCP does notperform maintain each of these tasks at the transport-layerwhile simply having UDP to forward the major stream portion,and when an error occurs, the receiving-end notifies its peer viaa back-end TCP connection. This paper is neither providinga comparison between the two protocols nor a discussion onthe protocol details.
Plantlab is a global and shared research network. However,many routing privileges are disabled to avoid unexpected rout-ing between slices. Researchers at the Planetlab have designeda replacement for the well-known Unix sudo command. Vsysis a method for handling access restrictions to privilegedoperations. This study used an automated version of Vsys tosetup all examined relay paths between end-nodes. However,defining privileges at an arbitrary granularity by filtering databetween the host and guest domains is one of the tediouschallenges of our work.
Relay routing introduces new implementation-concerns,such as probing overhead (cost) and its processing latency, sta-bility, availability, and sensitivity to underlay routing changes.The lack of privilege at the IP layer in older overlay schemesrequired relay layers to be implemented at the user-space (ap-plication layer) instead of the kernel-space (transport-layer).One example of such schemes is the application-multicastprotocol. Recently approaches like Software Defined Networks(SDNs) offer that privilege, but the probing cost remainshigh. The long-term boundary of our research is to developa robust, resilient, and inexpensive layer-3 relay protocol tohandle the unprecedented demand for streaming services inmany circumstances, such as the global pandemics.
B. Dataset
Valuable bandwidth datasets, such as the one used in Jianget al. [1] are private ones. Moreover, public dataset likeCADIA [13] and RIP-NCC [14] do not offer large-scale anddemand-based bandwidth traces. Therefore, in order to achievemeaningful bandwidth estimations on a large-scale, we useda global network of 140 nodes. These nodes are distributedacross the globe as follows: North America 63.57%, SouthAmerica 4.29%, Australia 3%, Asia 17.86% and Europe12.86%. We performed a set of 311, 360 delay traces usingPing and 177, 144 bandwidth measurements via IPerf.
C. Experiments
Ping and IPerf were used to conduct measurements over19, 460 and 14, 762 end-to-end paths, respectively in a net-work of n = 140 nodes. Ping sends its bulk of packetsin four distinct sizes: 0.05, 0.1, 0.25 and 0.5 MBytes. Pingpackets were also scheduled in the same order 4 times in 16
experiments. IPerf datagrams were sent at 12 distinct demand-rates as in Table II. Our diverse measurements were used toexamine the HTL characteristics, and design a stable HTL-based path estimation. Having a diverse measurement intervalas suggested in [11], provides more confidence in capturingpossible routing changes.
D. Probing Daemon
The conducted measurements follow the exact probing ab-stract illustrated in [2]. The nodes were divided into a numberof groups. We performed a single measurement in each groupgi where i ∈ [1 → m]. Each prober utilizes two loops: Thefirst, is to probe all n − 1 nodes, and the second one is toprobe unresponsive nodes again. The actual group time is:ti =
∑|gi|k=1 λi(k)+βi(k) as λi(k) and βi(k) are probing loops
times. These times can be determined as: λi(k) =∑n−1j=1 ε̄ and
similarly βi(k) = η∑θi(k)j=1 ε̄, where θi(k) is the number of
unresponsive in the first loop. ε̄ is the average probing time inthe network. η = 1 was the average count of re-probing in ourcase. Our probing scheme used a server-based synchronizationto minimize the effect of probing conflict occurs when twodaemons or more probe a particular node simultaneously. Toreduce such imperfect measurements, we forced daemons torandomly probe all nodes.
Furthermore, we defined the probability of success forreducing the influence of probing conflict on the measurementaccuracy. Such probability concerns n − m nodes when nonode was targeted simultaneously by more than one prober ofm active ones. The probability of success with no conflict inprobing was approximated as in [3] [4] by:
Pr(success) =
m−1∏i=1
(1− i
n−m
)(1)
Here, n and m are the numbers of nodes and groups, re-spectively. Practically, m represents the number of activeprobers that can probe the network within a particular time.Therefore, m must be chosen carefully to satisfy desiredsuccess probability. Due to tedious computation when solvingfor an exact solution for m that satisfies a given demand ofsuccess, we can approximate the probability of success in (1)if m� n by:
Pr(success) ≈ exp{− m2
2(n−m)
}(2)
Solving for success demand equals 70% leads to m ≈ 10. Forour network, n = 140, we found m ≈ 10. Clearly, achieving100% of success reduces m to one as expected.
E. Contribution
The major contribution of our work is in identifying shortand long-term analyses of the minimum RTT relay paths, suchas long-term stability as discussed in Section III and the HTLalternation sequences detailed in Section IV and Section V.Further probabilistic relay attributes, such as prevalence are
56Copyright (c) IARIA, 2020. ISBN: 978-1-61208-786-3
ICNS 2020 : The Sixteenth International Conference on Networking and Services
65 / 81
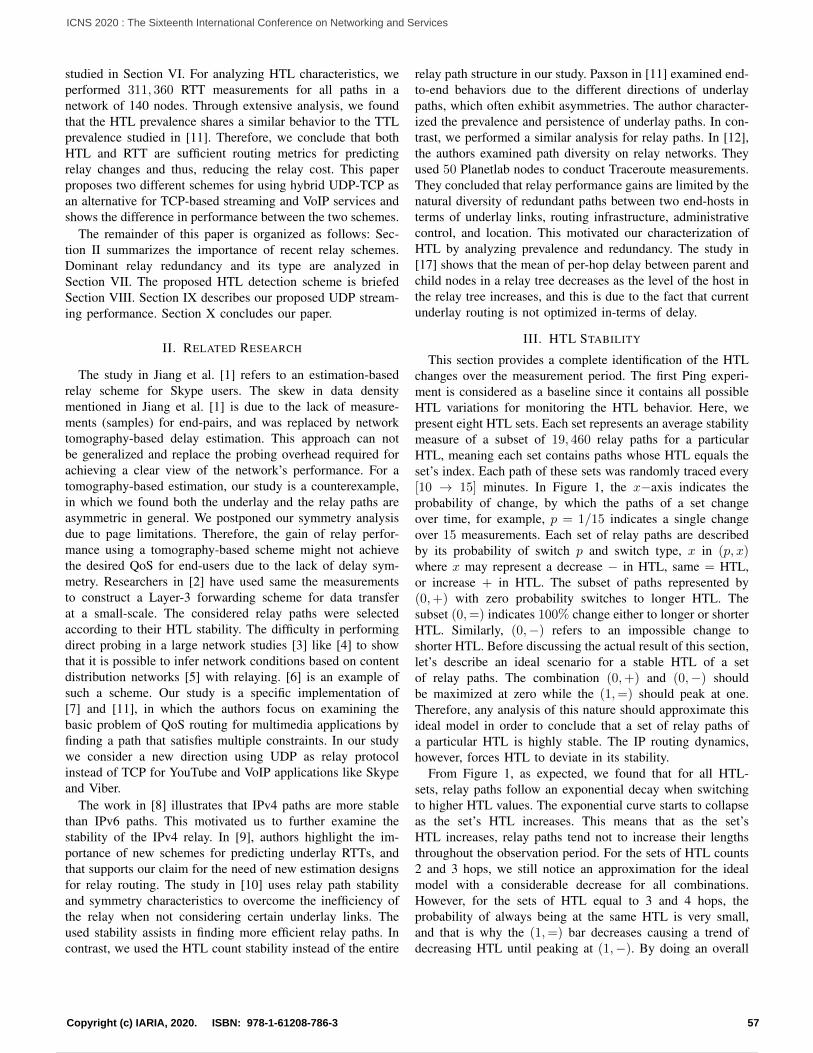
studied in Section VI. For analyzing HTL characteristics, weperformed 311, 360 RTT measurements for all paths in anetwork of 140 nodes. Through extensive analysis, we foundthat the HTL prevalence shares a similar behavior to the TTLprevalence studied in [11]. Therefore, we conclude that bothHTL and RTT are sufficient routing metrics for predictingrelay changes and thus, reducing the relay cost. This paperproposes two different schemes for using hybrid UDP-TCP asan alternative for TCP-based streaming and VoIP services andshows the difference in performance between the two schemes.
The remainder of this paper is organized as follows: Sec-tion II summarizes the importance of recent relay schemes.Dominant relay redundancy and its type are analyzed inSection VII. The proposed HTL detection scheme is briefedSection VIII. Section IX describes our proposed UDP stream-ing performance. Section X concludes our paper.
II. RELATED RESEARCH
The study in Jiang et al. [1] refers to an estimation-basedrelay scheme for Skype users. The skew in data densitymentioned in Jiang et al. [1] is due to the lack of measure-ments (samples) for end-pairs, and was replaced by networktomography-based delay estimation. This approach can notbe generalized and replace the probing overhead required forachieving a clear view of the network’s performance. For atomography-based estimation, our study is a counterexample,in which we found both the underlay and the relay paths areasymmetric in general. We postponed our symmetry analysisdue to page limitations. Therefore, the gain of relay perfor-mance using a tomography-based scheme might not achievethe desired QoS for end-users due to the lack of delay sym-metry. Researchers in [2] have used same the measurementsto construct a Layer-3 forwarding scheme for data transferat a small-scale. The considered relay paths were selectedaccording to their HTL stability. The difficulty in performingdirect probing in a large network studies [3] like [4] to showthat it is possible to infer network conditions based on contentdistribution networks [5] with relaying. [6] is an example ofsuch a scheme. Our study is a specific implementation of[7] and [11], in which the authors focus on examining thebasic problem of QoS routing for multimedia applications byfinding a path that satisfies multiple constraints. In our studywe consider a new direction using UDP as relay protocolinstead of TCP for YouTube and VoIP applications like Skypeand Viber.
The work in [8] illustrates that IPv4 paths are more stablethan IPv6 paths. This motivated us to further examine thestability of the IPv4 relay. In [9], authors highlight the im-portance of new schemes for predicting underlay RTTs, andthat supports our claim for the need of new estimation designsfor relay routing. The study in [10] uses relay path stabilityand symmetry characteristics to overcome the inefficiency ofthe relay when not considering certain underlay links. Theused stability assists in finding more efficient relay paths. Incontrast, we used the HTL count stability instead of the entire
relay path structure in our study. Paxson in [11] examined end-to-end behaviors due to the different directions of underlaypaths, which often exhibit asymmetries. The author character-ized the prevalence and persistence of underlay paths. In con-trast, we performed a similar analysis for relay paths. In [12],the authors examined path diversity on relay networks. Theyused 50 Planetlab nodes to conduct Traceroute measurements.They concluded that relay performance gains are limited by thenatural diversity of redundant paths between two end-hosts interms of underlay links, routing infrastructure, administrativecontrol, and location. This motivated our characterization ofHTL by analyzing prevalence and redundancy. The study in[17] shows that the mean of per-hop delay between parent andchild nodes in a relay tree decreases as the level of the host inthe relay tree increases, and this is due to the fact that currentunderlay routing is not optimized in-terms of delay.
III. HTL STABILITY
This section provides a complete identification of the HTLchanges over the measurement period. The first Ping experi-ment is considered as a baseline since it contains all possibleHTL variations for monitoring the HTL behavior. Here, wepresent eight HTL sets. Each set represents an average stabilitymeasure of a subset of 19, 460 relay paths for a particularHTL, meaning each set contains paths whose HTL equals theset’s index. Each path of these sets was randomly traced every[10 → 15] minutes. In Figure 1, the x−axis indicates theprobability of change, by which the paths of a set changeover time, for example, p = 1/15 indicates a single changeover 15 measurements. Each set of relay paths are describedby its probability of switch p and switch type, x in (p, x)where x may represent a decrease − in HTL, same = HTL,or increase + in HTL. The subset of paths represented by(0,+) with zero probability switches to longer HTL. Thesubset (0,=) indicates 100% change either to longer or shorterHTL. Similarly, (0,−) refers to an impossible change toshorter HTL. Before discussing the actual result of this section,let’s describe an ideal scenario for a stable HTL of a setof relay paths. The combination (0,+) and (0,−) shouldbe maximized at zero while the (1,=) should peak at one.Therefore, any analysis of this nature should approximate thisideal model in order to conclude that a set of relay paths ofa particular HTL is highly stable. The IP routing dynamics,however, forces HTL to deviate in its stability.
From Figure 1, as expected, we found that for all HTL-sets, relay paths follow an exponential decay when switchingto higher HTL values. The exponential curve starts to collapseas the set’s HTL increases. This means that as the set’sHTL increases, relay paths tend not to increase their lengthsthroughout the observation period. For the sets of HTL counts2 and 3 hops, we still notice an approximation for the idealmodel with a considerable decrease for all combinations.However, for the sets of HTL equal to 3 and 4 hops, theprobability of always being at the same HTL is very small,and that is why the (1,=) bar decreases causing a trend ofdecreasing HTL until peaking at (1,−). By doing an overall
57Copyright (c) IARIA, 2020. ISBN: 978-1-61208-786-3
ICNS 2020 : The Sixteenth International Conference on Networking and Services
66 / 81
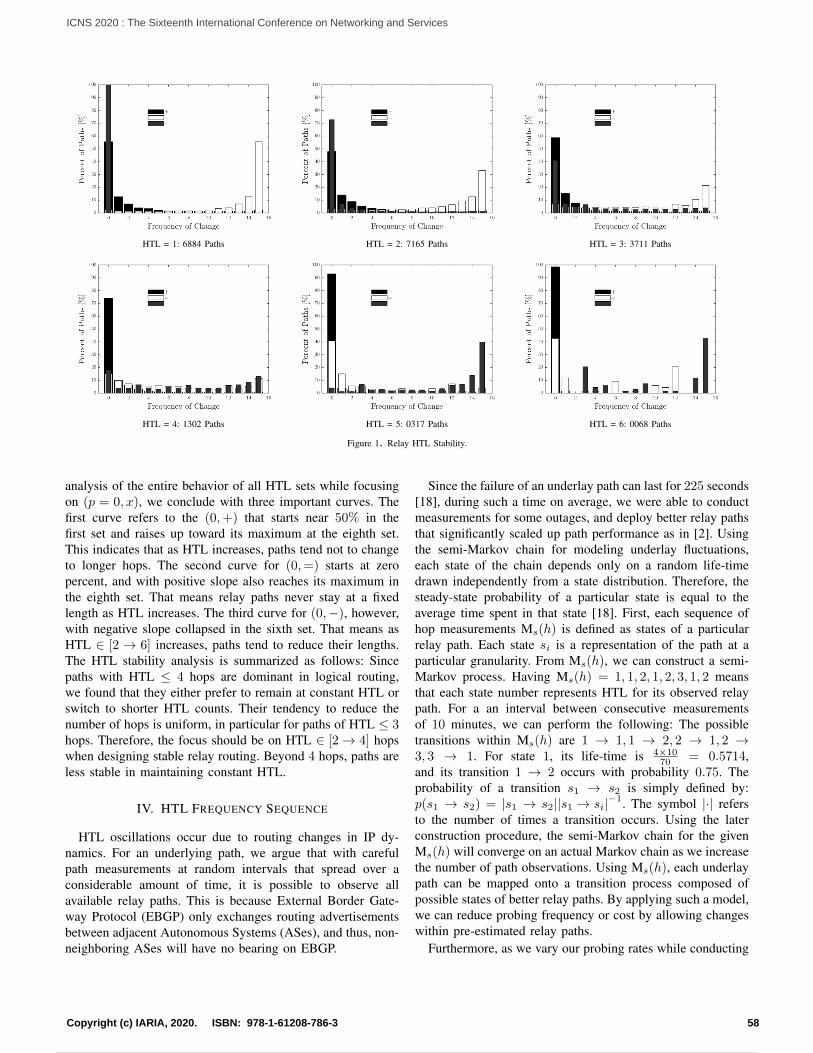
HTL = 1: 6884 Paths HTL = 2: 7165 Paths HTL = 3: 3711 Paths
HTL = 4: 1302 Paths HTL = 5: 0317 Paths HTL = 6: 0068 Paths
Figure 1. Relay HTL Stability.
analysis of the entire behavior of all HTL sets while focusingon (p = 0, x), we conclude with three important curves. Thefirst curve refers to the (0,+) that starts near 50% in thefirst set and raises up toward its maximum at the eighth set.This indicates that as HTL increases, paths tend not to changeto longer hops. The second curve for (0,=) starts at zeropercent, and with positive slope also reaches its maximum inthe eighth set. That means relay paths never stay at a fixedlength as HTL increases. The third curve for (0,−), however,with negative slope collapsed in the sixth set. That means asHTL ∈ [2 → 6] increases, paths tend to reduce their lengths.The HTL stability analysis is summarized as follows: Sincepaths with HTL ≤ 4 hops are dominant in logical routing,we found that they either prefer to remain at constant HTL orswitch to shorter HTL counts. Their tendency to reduce thenumber of hops is uniform, in particular for paths of HTL ≤ 3hops. Therefore, the focus should be on HTL ∈ [2→ 4] hopswhen designing stable relay routing. Beyond 4 hops, paths areless stable in maintaining constant HTL.
IV. HTL FREQUENCY SEQUENCE
HTL oscillations occur due to routing changes in IP dy-namics. For an underlying path, we argue that with carefulpath measurements at random intervals that spread over aconsiderable amount of time, it is possible to observe allavailable relay paths. This is because External Border Gate-way Protocol (EBGP) only exchanges routing advertisementsbetween adjacent Autonomous Systems (ASes), and thus, non-neighboring ASes will have no bearing on EBGP.
Since the failure of an underlay path can last for 225 seconds[18], during such a time on average, we were able to conductmeasurements for some outages, and deploy better relay pathsthat significantly scaled up path performance as in [2]. Usingthe semi-Markov chain for modeling underlay fluctuations,each state of the chain depends only on a random life-timedrawn independently from a state distribution. Therefore, thesteady-state probability of a particular state is equal to theaverage time spent in that state [18]. First, each sequence ofhop measurements Ms(h) is defined as states of a particularrelay path. Each state si is a representation of the path at aparticular granularity. From Ms(h), we can construct a semi-Markov process. Having Ms(h) = 1, 1, 2, 1, 2, 3, 1, 2 meansthat each state number represents HTL for its observed relaypath. For a an interval between consecutive measurementsof 10 minutes, we can perform the following: The possibletransitions within Ms(h) are 1 → 1, 1 → 2, 2 → 1, 2 →3, 3 → 1. For state 1, its life-time is 4×10
70 = 0.5714,and its transition 1 → 2 occurs with probability 0.75. Theprobability of a transition s1 → s2 is simply defined by:p(s1 → s2) = |s1 → s2||s1 → si|−1. The symbol |·| refersto the number of times a transition occurs. Using the laterconstruction procedure, the semi-Markov chain for the givenMs(h) will converge on an actual Markov chain as we increasethe number of path observations. Using Ms(h), each underlaypath can be mapped onto a transition process composed ofpossible states of better relay paths. By applying such a model,we can reduce probing frequency or cost by allowing changeswithin pre-estimated relay paths.
Furthermore, as we vary our probing rates while conducting
58Copyright (c) IARIA, 2020. ISBN: 978-1-61208-786-3
ICNS 2020 : The Sixteenth International Conference on Networking and Services
67 / 81
a measurement sequence, we were interested in answeringquestions, such as what is the overall HTL miss-rate? Howlikely is it that a particular HTL will not be observed? To an-swer our first question, we introduced for each underlay path asecond HTL sequence of the most probable relay HTLs so thatwhenever probing is required, only paths of these lengths willbe investigated. This sequence is called frequency sequenceFs(h). For a given underlay path r, if Ms(h) = 3, 3, 5, 2, 4, 5,then Fs(h) = 3, 5, 2, 4. Finding Fs(h) for every path in ournetwork shows that only 4.8% of 19, 460 paths with at leastone alternative relay path suffer HTL miss(es). The interactionbetween underlay and relay substrates causes exactly 56.6%of the 4.8% relay paths to suffering from high fluctuationsduring our measurement period.
During analysis, there were 8, 863 paths whose Fs(h)sequences demonstrated multi-hop paths (relay was alwaysbetter), and suffered no HTL miss. Furthermore, an additional5, 824 paths whose underlay candidates still included in Fs(h)also suffered no HTL miss. This indicates about 75.4% ofpaths change their HTL within a stable Fs(h) during themeasurement period. By excluding fixed underlay paths, wefound only 949 paths suffered HTL miss(es). Such a numberis quite small compared to the total of 19, 640 paths. Figure 2details the fraction of paths per each HTL miss.
Figure 2. The Overall HTL Miss.
The probing Ping bulks were used in our measurementsto create congestion and consequently to stimulate routingchanges. However, despite a 2% packet loss on some paths,2% of such paths of the total underlay paths remained constantas one-hop. The topological location of their ends might bea strong reason for such behaviour. Larger HTLs were lessobserved, and yet still not common in some relay paths.
V. HTL TRANSITION SEQUENCE
The discussion in Section IV neither investigates the natureof HTL switching, gradual or random, nor how often HTLmiss(es) occur. Further, there is no strong evidence that gradualtransition indicates path symmetry at the node granularity.Thus, considering time will help studying relay symmetry.
The new sequence Ts(h) takes time into consideration foridentifying HTL miss(es) that occur between consecutivemeasurements. Generally, Ms(h) is a sub-sequence of Ts(h),and therefore, Ts(h) can be generated by placing all themissing HTLs. For example, at the HTL granularity: Ms(h) =1, 3, 1, 2, 4, 1, Ts(h) = 1, 2, 3, 2, 1, 2, 3, 4, 3, 2, 1. The upperbar indicates a miss when switching to higher HTL and viceversa. Note, HTL = 2 and 3 are not misses in Ms(h), butthey are in Ts(h). Using Fs(h), we can catch missing HTLcounts, but not determine neither a probable miss-time nor thatcommon path fluctuations caused a transition miss.
From Ts(h), if a particular HTL is a frequent transitionmiss, such HTL count is not favorable. For a particular HTL,it can show as a miss in Ts(h) while not in Fs(h). For example,Ms(h) = 2, 1, 3, 3, 2, the corresponding Fs(h) = 2, 3, 1 andTs(h) = 2, 1, 2, 3, 3, 2. Here we consider Ts(h) as miss-freesince the miss chance of HTL = 2 is small, 0.2. However, forMs(h) = 4, 3, 3, 3, 3, Fs(h) = 3, 4 and Ts(h) = 4, 2, 3, 3, 3, 3,and despite the 0.2 small miss likelihood of HTL = 2, weconsider such Ts(h) with a miss since HTL = 2 is not inFs(h). For HTL = 2 hops, about 90% of our relay pathshad no miss(es) during path switching. Figure 3 shows aCumulative Distribution Function (CDF) breakdown of thetransition misses for the most common relay HTLs. From sucha result, we can conclude that nature of HTL switching in relayfollows a gradual transition rather than a random one.
Figure 3. HTL Transition Miss Breakdown.
VI. DOMINANT PATH PREVALENCE
Let us define for an underlay path r with a set of m underlaymeasurements: U(r) = r1, r2, r2, . . . rm, and another set ofshorter delay relay paths: O(r) = r1, r2, r1, . . . , rm. Let’salso introduce a dominant set Di(r), where i ∈ [1 → x∗]as x∗ is the possible number of distinct dominant sets we canobserve out of m measurements for r. Each Di(r) containsa subset of O(r) of relay paths that appear at a uniquefrequency of occurrence ωi(r). For instance D1(r) contains theprevalent relay paths observed at the highest frequency, ω1(r),and D2(r) encompasses paths with second highest frequency,
59Copyright (c) IARIA, 2020. ISBN: 978-1-61208-786-3
ICNS 2020 : The Sixteenth International Conference on Networking and Services
68 / 81
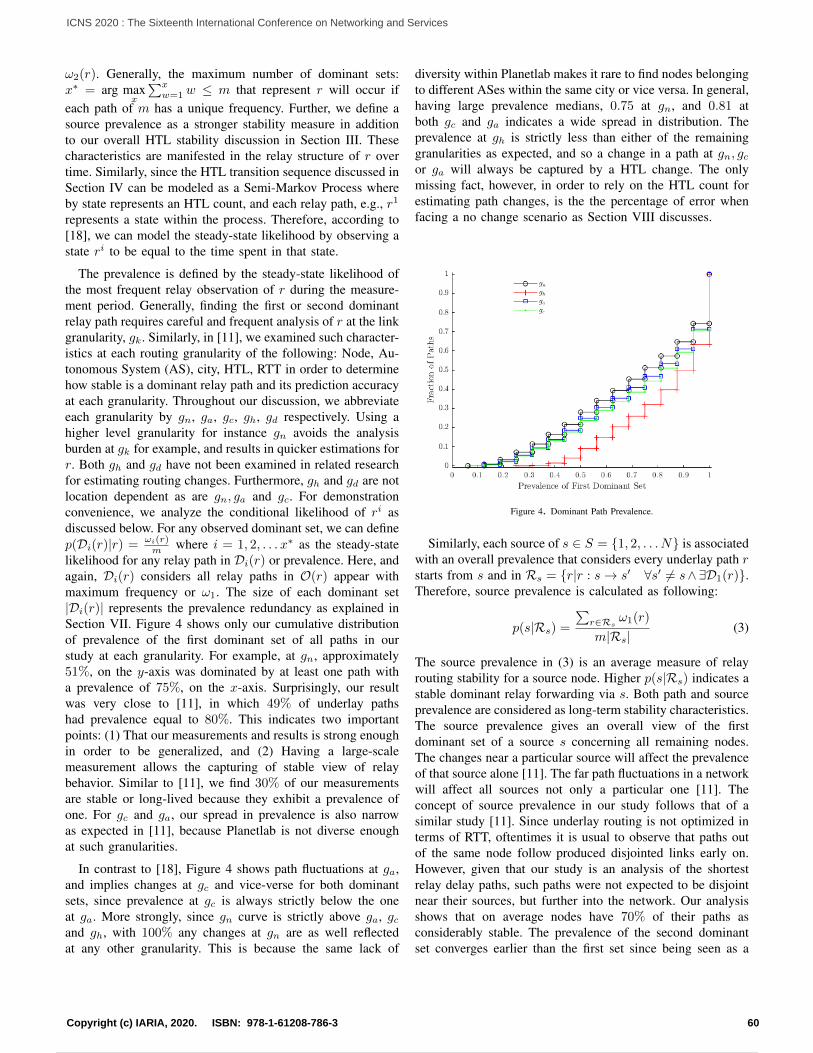
ω2(r). Generally, the maximum number of dominant sets:x∗ = arg max
x
∑xw=1 w ≤ m that represent r will occur if
each path of m has a unique frequency. Further, we define asource prevalence as a stronger stability measure in additionto our overall HTL stability discussion in Section III. Thesecharacteristics are manifested in the relay structure of r overtime. Similarly, since the HTL transition sequence discussed inSection IV can be modeled as a Semi-Markov Process whereby state represents an HTL count, and each relay path, e.g., r1
represents a state within the process. Therefore, according to[18], we can model the steady-state likelihood by observing astate ri to be equal to the time spent in that state.
The prevalence is defined by the steady-state likelihood ofthe most frequent relay observation of r during the measure-ment period. Generally, finding the first or second dominantrelay path requires careful and frequent analysis of r at the linkgranularity, gk. Similarly, in [11], we examined such character-istics at each routing granularity of the following: Node, Au-tonomous System (AS), city, HTL, RTT in order to determinehow stable is a dominant relay path and its prediction accuracyat each granularity. Throughout our discussion, we abbreviateeach granularity by gn, ga, gc, gh, gd respectively. Using ahigher level granularity for instance gn avoids the analysisburden at gk for example, and results in quicker estimations forr. Both gh and gd have not been examined in related researchfor estimating routing changes. Furthermore, gh and gd are notlocation dependent as are gn, ga and gc. For demonstrationconvenience, we analyze the conditional likelihood of ri asdiscussed below. For any observed dominant set, we can definep(Di(r)|r) = ωi(r)
m where i = 1, 2, . . . x∗ as the steady-statelikelihood for any relay path in Di(r) or prevalence. Here, andagain, Di(r) considers all relay paths in O(r) appear withmaximum frequency or ω1. The size of each dominant set|Di(r)| represents the prevalence redundancy as explained inSection VII. Figure 4 shows only our cumulative distributionof prevalence of the first dominant set of all paths in ourstudy at each granularity. For example, at gn, approximately51%, on the y-axis was dominated by at least one path witha prevalence of 75%, on the x-axis. Surprisingly, our resultwas very close to [11], in which 49% of underlay pathshad prevalence equal to 80%. This indicates two importantpoints: (1) That our measurements and results is strong enoughin order to be generalized, and (2) Having a large-scalemeasurement allows the capturing of stable view of relaybehavior. Similar to [11], we find 30% of our measurementsare stable or long-lived because they exhibit a prevalence ofone. For gc and ga, our spread in prevalence is also narrowas expected in [11], because Planetlab is not diverse enoughat such granularities.
In contrast to [18], Figure 4 shows path fluctuations at ga,and implies changes at gc and vice-verse for both dominantsets, since prevalence at gc is always strictly below the oneat ga. More strongly, since gn curve is strictly above ga, gcand gh, with 100% any changes at gn are as well reflectedat any other granularity. This is because the same lack of
diversity within Planetlab makes it rare to find nodes belongingto different ASes within the same city or vice versa. In general,having large prevalence medians, 0.75 at gn, and 0.81 atboth gc and ga indicates a wide spread in distribution. Theprevalence at gh is strictly less than either of the remaininggranularities as expected, and so a change in a path at gn, gcor ga will always be captured by a HTL change. The onlymissing fact, however, in order to rely on the HTL count forestimating path changes, is the the percentage of error whenfacing a no change scenario as Section VIII discusses.
Figure 4. Dominant Path Prevalence.
Similarly, each source of s ∈ S = {1, 2, . . . N} is associatedwith an overall prevalence that considers every underlay path rstarts from s and in Rs = {r|r : s→ s′ ∀s′ 6= s∧∃D1(r)}.Therefore, source prevalence is calculated as following:
p(s|Rs) =
∑r∈Rs
ω1(r)
m|Rs|(3)
The source prevalence in (3) is an average measure of relayrouting stability for a source node. Higher p(s|Rs) indicates astable dominant relay forwarding via s. Both path and sourceprevalence are considered as long-term stability characteristics.The source prevalence gives an overall view of the firstdominant set of a source s concerning all remaining nodes.The changes near a particular source will affect the prevalenceof that source alone [11]. The far path fluctuations in a networkwill affect all sources not only a particular one [11]. Theconcept of source prevalence in our study follows that of asimilar study [11]. Since underlay routing is not optimized interms of RTT, oftentimes it is usual to observe that paths outof the same node follow produced disjointed links early on.However, given that our study is an analysis of the shortestrelay delay paths, such paths were not expected to be disjointnear their sources, but further into the network. Our analysisshows that on average nodes have 70% of their paths asconsiderably stable. The prevalence of the second dominantset converges earlier than the first set since being seen as a
60Copyright (c) IARIA, 2020. ISBN: 978-1-61208-786-3
ICNS 2020 : The Sixteenth International Conference on Networking and Services
69 / 81
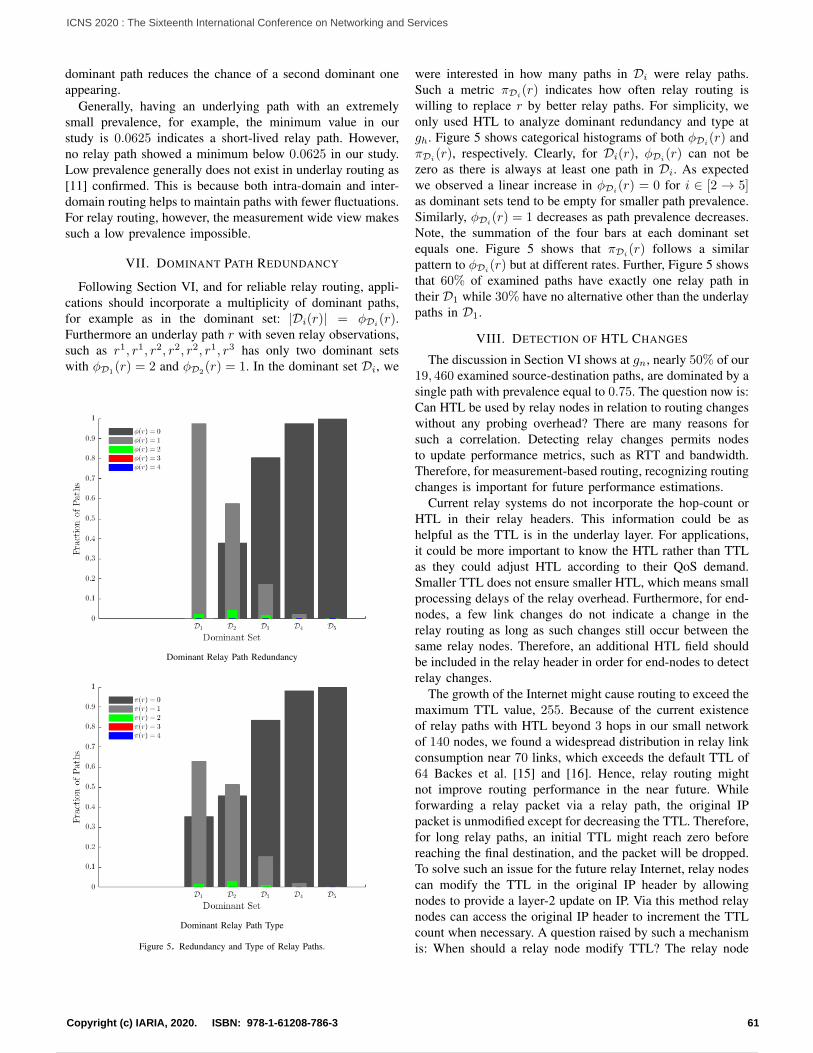
dominant path reduces the chance of a second dominant oneappearing.
Generally, having an underlying path with an extremelysmall prevalence, for example, the minimum value in ourstudy is 0.0625 indicates a short-lived relay path. However,no relay path showed a minimum below 0.0625 in our study.Low prevalence generally does not exist in underlay routing as[11] confirmed. This is because both intra-domain and inter-domain routing helps to maintain paths with fewer fluctuations.For relay routing, however, the measurement wide view makessuch a low prevalence impossible.
VII. DOMINANT PATH REDUNDANCY
Following Section VI, and for reliable relay routing, appli-cations should incorporate a multiplicity of dominant paths,for example as in the dominant set: |Di(r)| = φDi
(r).Furthermore an underlay path r with seven relay observations,such as r1, r1, r2, r2, r2, r1, r3 has only two dominant setswith φD1(r) = 2 and φD2(r) = 1. In the dominant set Di, we
Dominant Relay Path Redundancy
Dominant Relay Path Type
Figure 5. Redundancy and Type of Relay Paths.
were interested in how many paths in Di were relay paths.Such a metric πDi(r) indicates how often relay routing iswilling to replace r by better relay paths. For simplicity, weonly used HTL to analyze dominant redundancy and type atgh. Figure 5 shows categorical histograms of both φDi
(r) andπDi
(r), respectively. Clearly, for Di(r), φDi(r) can not be
zero as there is always at least one path in Di. As expectedwe observed a linear increase in φDi(r) = 0 for i ∈ [2 → 5]as dominant sets tend to be empty for smaller path prevalence.Similarly, φDi
(r) = 1 decreases as path prevalence decreases.Note, the summation of the four bars at each dominant setequals one. Figure 5 shows that πDi
(r) follows a similarpattern to φDi(r) but at different rates. Further, Figure 5 showsthat 60% of examined paths have exactly one relay path intheir D1 while 30% have no alternative other than the underlaypaths in D1.
VIII. DETECTION OF HTL CHANGES
The discussion in Section VI shows at gn, nearly 50% of our19, 460 examined source-destination paths, are dominated by asingle path with prevalence equal to 0.75. The question now is:Can HTL be used by relay nodes in relation to routing changeswithout any probing overhead? There are many reasons forsuch a correlation. Detecting relay changes permits nodesto update performance metrics, such as RTT and bandwidth.Therefore, for measurement-based routing, recognizing routingchanges is important for future performance estimations.
Current relay systems do not incorporate the hop-count orHTL in their relay headers. This information could be ashelpful as the TTL is in the underlay layer. For applications,it could be more important to know the HTL rather than TTLas they could adjust HTL according to their QoS demand.Smaller TTL does not ensure smaller HTL, which means smallprocessing delays of the relay overhead. Furthermore, for end-nodes, a few link changes do not indicate a change in therelay routing as long as such changes still occur between thesame relay nodes. Therefore, an additional HTL field shouldbe included in the relay header in order for end-nodes to detectrelay changes.
The growth of the Internet might cause routing to exceed themaximum TTL value, 255. Because of the current existenceof relay paths with HTL beyond 3 hops in our small networkof 140 nodes, we found a widespread distribution in relay linkconsumption near 70 links, which exceeds the default TTL of64 Backes et al. [15] and [16]. Hence, relay routing mightnot improve routing performance in the near future. Whileforwarding a relay packet via a relay path, the original IPpacket is unmodified except for decreasing the TTL. Therefore,for long relay paths, an initial TTL might reach zero beforereaching the final destination, and the packet will be dropped.To solve such an issue for the future relay Internet, relay nodescan modify the TTL in the original IP header by allowingnodes to provide a layer-2 update on IP. Via this method relaynodes can access the original IP header to increment the TTLcount when necessary. A question raised by such a mechanismis: When should a relay node modify TTL? The relay node
61Copyright (c) IARIA, 2020. ISBN: 978-1-61208-786-3
ICNS 2020 : The Sixteenth International Conference on Networking and Services
70 / 81
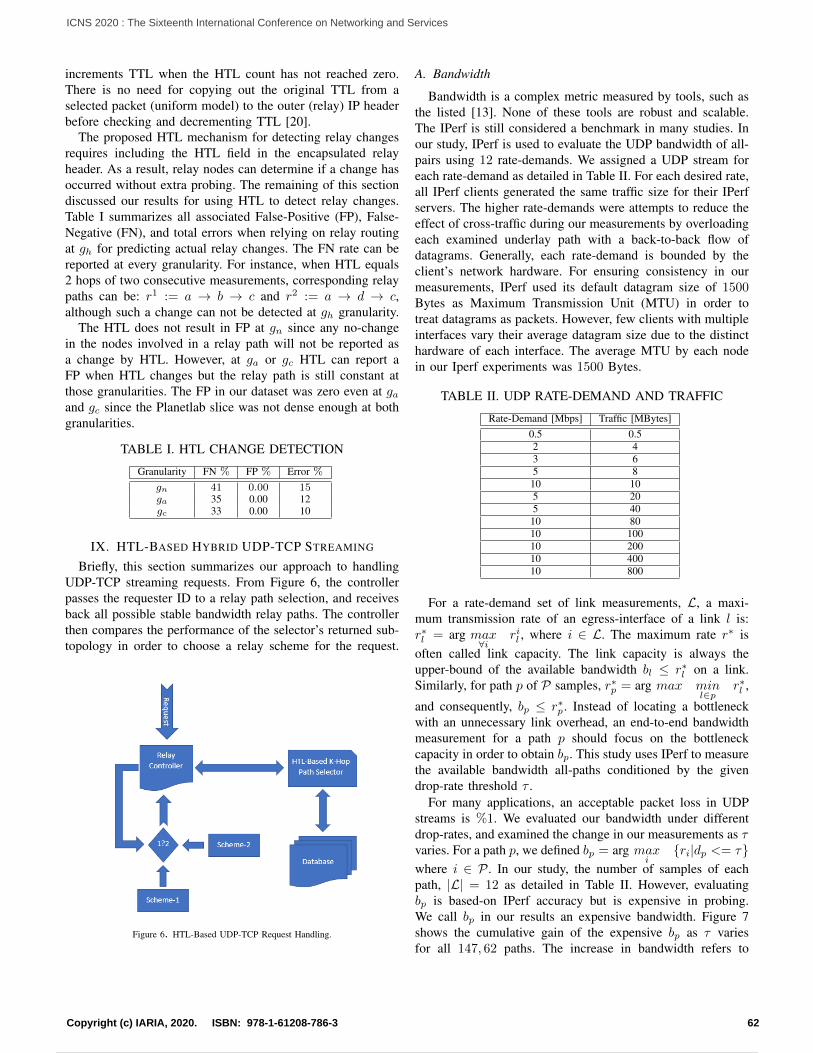
increments TTL when the HTL count has not reached zero.There is no need for copying out the original TTL from aselected packet (uniform model) to the outer (relay) IP headerbefore checking and decrementing TTL [20].
The proposed HTL mechanism for detecting relay changesrequires including the HTL field in the encapsulated relayheader. As a result, relay nodes can determine if a change hasoccurred without extra probing. The remaining of this sectiondiscussed our results for using HTL to detect relay changes.Table I summarizes all associated False-Positive (FP), False-Negative (FN), and total errors when relying on relay routingat gh for predicting actual relay changes. The FN rate can bereported at every granularity. For instance, when HTL equals2 hops of two consecutive measurements, corresponding relaypaths can be: r1 := a → b → c and r2 := a → d → c,although such a change can not be detected at gh granularity.
The HTL does not result in FP at gn since any no-changein the nodes involved in a relay path will not be reported asa change by HTL. However, at ga or gc HTL can report aFP when HTL changes but the relay path is still constant atthose granularities. The FP in our dataset was zero even at gaand gc since the Planetlab slice was not dense enough at bothgranularities.
TABLE I. HTL CHANGE DETECTION
Granularity FN % FP % Error %gn 41 0.00 15ga 35 0.00 12gc 33 0.00 10
IX. HTL-BASED HYBRID UDP-TCP STREAMING
Briefly, this section summarizes our approach to handlingUDP-TCP streaming requests. From Figure 6, the controllerpasses the requester ID to a relay path selection, and receivesback all possible stable bandwidth relay paths. The controllerthen compares the performance of the selector’s returned sub-topology in order to choose a relay scheme for the request.
Figure 6. HTL-Based UDP-TCP Request Handling.
A. Bandwidth
Bandwidth is a complex metric measured by tools, such asthe listed [13]. None of these tools are robust and scalable.The IPerf is still considered a benchmark in many studies. Inour study, IPerf is used to evaluate the UDP bandwidth of all-pairs using 12 rate-demands. We assigned a UDP stream foreach rate-demand as detailed in Table II. For each desired rate,all IPerf clients generated the same traffic size for their IPerfservers. The higher rate-demands were attempts to reduce theeffect of cross-traffic during our measurements by overloadingeach examined underlay path with a back-to-back flow ofdatagrams. Generally, each rate-demand is bounded by theclient’s network hardware. For ensuring consistency in ourmeasurements, IPerf used its default datagram size of 1500Bytes as Maximum Transmission Unit (MTU) in order totreat datagrams as packets. However, few clients with multipleinterfaces vary their average datagram size due to the distincthardware of each interface. The average MTU by each nodein our Iperf experiments was 1500 Bytes.
TABLE II. UDP RATE-DEMAND AND TRAFFIC
Rate-Demand [Mbps] Traffic [MBytes]0.5 0.52 43 65 810 105 205 4010 8010 10010 20010 40010 800
For a rate-demand set of link measurements, L, a maxi-mum transmission rate of an egress-interface of a link l is:r∗l = arg max
∀iril , where i ∈ L. The maximum rate r∗ is
often called link capacity. The link capacity is always theupper-bound of the available bandwidth bl ≤ r∗l on a link.Similarly, for path p of P samples, r∗p = arg max min
l∈pr∗l ,
and consequently, bp ≤ r∗p . Instead of locating a bottleneckwith an unnecessary link overhead, an end-to-end bandwidthmeasurement for a path p should focus on the bottleneckcapacity in order to obtain bp. This study uses IPerf to measurethe available bandwidth all-paths conditioned by the givendrop-rate threshold τ .
For many applications, an acceptable packet loss in UDPstreams is %1. We evaluated our bandwidth under differentdrop-rates, and examined the change in our measurements as τvaries. For a path p, we defined bp = arg max
i{ri|dp <= τ}
where i ∈ P . In our study, the number of samples of eachpath, |L| = 12 as detailed in Table II. However, evaluatingbp is based-on IPerf accuracy but is expensive in probing.We call bp in our results an expensive bandwidth. Figure 7shows the cumulative gain of the expensive bp as τ variesfor all 147, 62 paths. The increase in bandwidth refers to
62Copyright (c) IARIA, 2020. ISBN: 978-1-61208-786-3
ICNS 2020 : The Sixteenth International Conference on Networking and Services
71 / 81
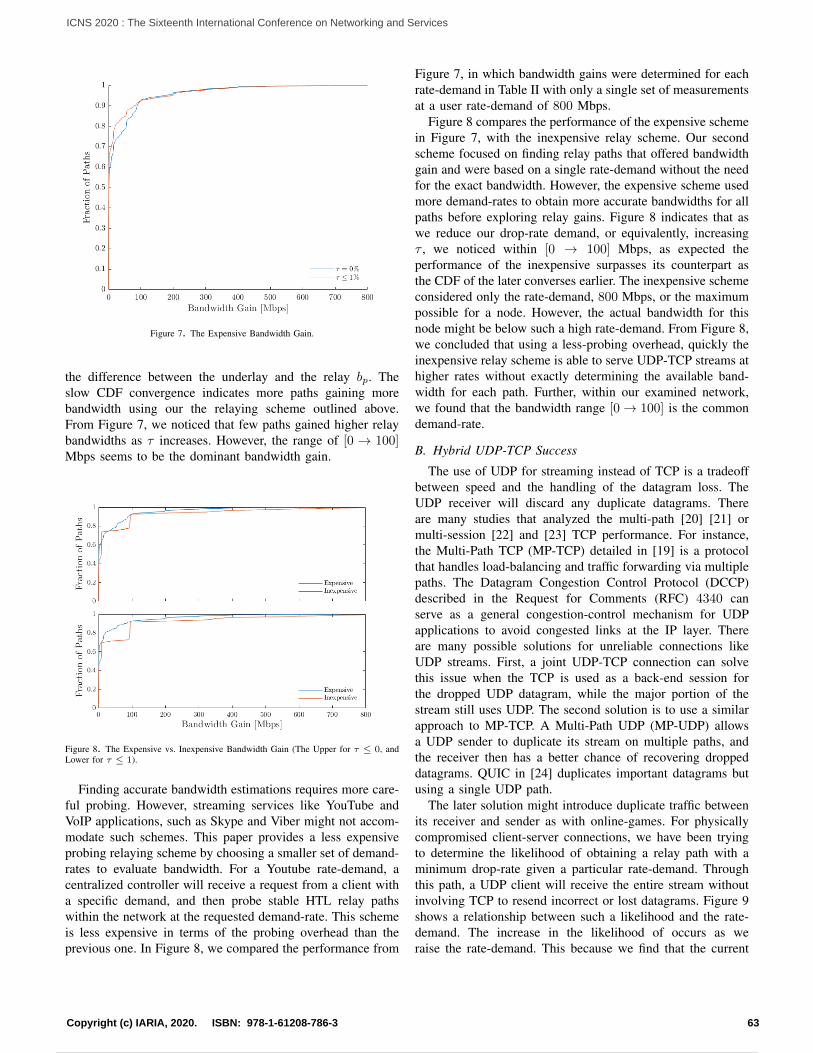
Figure 7. The Expensive Bandwidth Gain.
the difference between the underlay and the relay bp. Theslow CDF convergence indicates more paths gaining morebandwidth using our the relaying scheme outlined above.From Figure 7, we noticed that few paths gained higher relaybandwidths as τ increases. However, the range of [0 → 100]Mbps seems to be the dominant bandwidth gain.
Figure 8. The Expensive vs. Inexpensive Bandwidth Gain (The Upper for τ ≤ 0, andLower for τ ≤ 1).
Finding accurate bandwidth estimations requires more care-ful probing. However, streaming services like YouTube andVoIP applications, such as Skype and Viber might not accom-modate such schemes. This paper provides a less expensiveprobing relaying scheme by choosing a smaller set of demand-rates to evaluate bandwidth. For a Youtube rate-demand, acentralized controller will receive a request from a client witha specific demand, and then probe stable HTL relay pathswithin the network at the requested demand-rate. This schemeis less expensive in terms of the probing overhead than theprevious one. In Figure 8, we compared the performance from
Figure 7, in which bandwidth gains were determined for eachrate-demand in Table II with only a single set of measurementsat a user rate-demand of 800 Mbps.
Figure 8 compares the performance of the expensive schemein Figure 7, with the inexpensive relay scheme. Our secondscheme focused on finding relay paths that offered bandwidthgain and were based on a single rate-demand without the needfor the exact bandwidth. However, the expensive scheme usedmore demand-rates to obtain more accurate bandwidths for allpaths before exploring relay gains. Figure 8 indicates that aswe reduce our drop-rate demand, or equivalently, increasingτ , we noticed within [0 → 100] Mbps, as expected theperformance of the inexpensive surpasses its counterpart asthe CDF of the later converses earlier. The inexpensive schemeconsidered only the rate-demand, 800 Mbps, or the maximumpossible for a node. However, the actual bandwidth for thisnode might be below such a high rate-demand. From Figure 8,we concluded that using a less-probing overhead, quickly theinexpensive relay scheme is able to serve UDP-TCP streams athigher rates without exactly determining the available band-width for each path. Further, within our examined network,we found that the bandwidth range [0→ 100] is the commondemand-rate.
B. Hybrid UDP-TCP Success
The use of UDP for streaming instead of TCP is a tradeoffbetween speed and the handling of the datagram loss. TheUDP receiver will discard any duplicate datagrams. Thereare many studies that analyzed the multi-path [20] [21] ormulti-session [22] and [23] TCP performance. For instance,the Multi-Path TCP (MP-TCP) detailed in [19] is a protocolthat handles load-balancing and traffic forwarding via multiplepaths. The Datagram Congestion Control Protocol (DCCP)described in the Request for Comments (RFC) 4340 canserve as a general congestion-control mechanism for UDPapplications to avoid congested links at the IP layer. Thereare many possible solutions for unreliable connections likeUDP streams. First, a joint UDP-TCP connection can solvethis issue when the TCP is used as a back-end session forthe dropped UDP datagram, while the major portion of thestream still uses UDP. The second solution is to use a similarapproach to MP-TCP. A Multi-Path UDP (MP-UDP) allowsa UDP sender to duplicate its stream on multiple paths, andthe receiver then has a better chance of recovering droppeddatagrams. QUIC in [24] duplicates important datagrams butusing a single UDP path.
The later solution might introduce duplicate traffic betweenits receiver and sender as with online-games. For physicallycompromised client-server connections, we have been tryingto determine the likelihood of obtaining a relay path with aminimum drop-rate given a particular rate-demand. Throughthis path, a UDP client will receive the entire stream withoutinvolving TCP to resend incorrect or lost datagrams. Figure 9shows a relationship between such a likelihood and the rate-demand. The increase in the likelihood of occurs as weraise the rate-demand. This because we find that the current
63Copyright (c) IARIA, 2020. ISBN: 978-1-61208-786-3
ICNS 2020 : The Sixteenth International Conference on Networking and Services
72 / 81
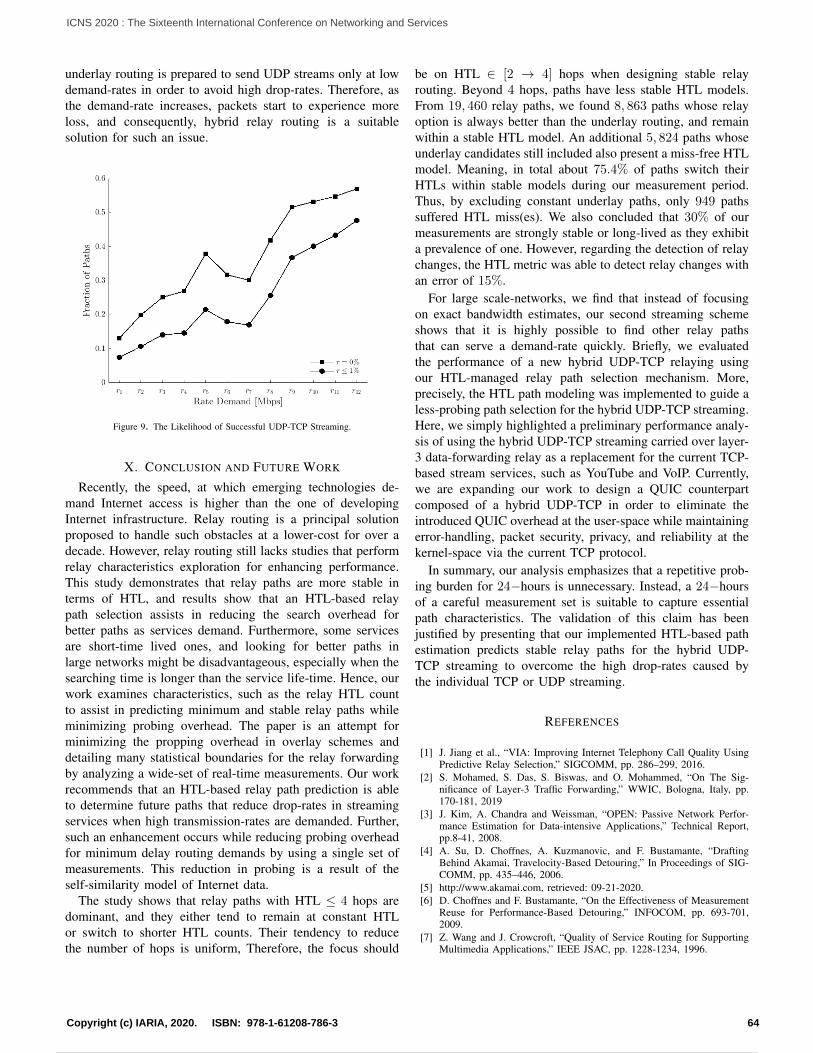
underlay routing is prepared to send UDP streams only at lowdemand-rates in order to avoid high drop-rates. Therefore, asthe demand-rate increases, packets start to experience moreloss, and consequently, hybrid relay routing is a suitablesolution for such an issue.
Figure 9. The Likelihood of Successful UDP-TCP Streaming.
X. CONCLUSION AND FUTURE WORK
Recently, the speed, at which emerging technologies de-mand Internet access is higher than the one of developingInternet infrastructure. Relay routing is a principal solutionproposed to handle such obstacles at a lower-cost for over adecade. However, relay routing still lacks studies that performrelay characteristics exploration for enhancing performance.This study demonstrates that relay paths are more stable interms of HTL, and results show that an HTL-based relaypath selection assists in reducing the search overhead forbetter paths as services demand. Furthermore, some servicesare short-time lived ones, and looking for better paths inlarge networks might be disadvantageous, especially when thesearching time is longer than the service life-time. Hence, ourwork examines characteristics, such as the relay HTL countto assist in predicting minimum and stable relay paths whileminimizing probing overhead. The paper is an attempt forminimizing the propping overhead in overlay schemes anddetailing many statistical boundaries for the relay forwardingby analyzing a wide-set of real-time measurements. Our workrecommends that an HTL-based relay path prediction is ableto determine future paths that reduce drop-rates in streamingservices when high transmission-rates are demanded. Further,such an enhancement occurs while reducing probing overheadfor minimum delay routing demands by using a single set ofmeasurements. This reduction in probing is a result of theself-similarity model of Internet data.
The study shows that relay paths with HTL ≤ 4 hops aredominant, and they either tend to remain at constant HTLor switch to shorter HTL counts. Their tendency to reducethe number of hops is uniform, Therefore, the focus should
be on HTL ∈ [2 → 4] hops when designing stable relayrouting. Beyond 4 hops, paths have less stable HTL models.From 19, 460 relay paths, we found 8, 863 paths whose relayoption is always better than the underlay routing, and remainwithin a stable HTL model. An additional 5, 824 paths whoseunderlay candidates still included also present a miss-free HTLmodel. Meaning, in total about 75.4% of paths switch theirHTLs within stable models during our measurement period.Thus, by excluding constant underlay paths, only 949 pathssuffered HTL miss(es). We also concluded that 30% of ourmeasurements are strongly stable or long-lived as they exhibita prevalence of one. However, regarding the detection of relaychanges, the HTL metric was able to detect relay changes withan error of 15%.
For large scale-networks, we find that instead of focusingon exact bandwidth estimates, our second streaming schemeshows that it is highly possible to find other relay pathsthat can serve a demand-rate quickly. Briefly, we evaluatedthe performance of a new hybrid UDP-TCP relaying usingour HTL-managed relay path selection mechanism. More,precisely, the HTL path modeling was implemented to guide aless-probing path selection for the hybrid UDP-TCP streaming.Here, we simply highlighted a preliminary performance analy-sis of using the hybrid UDP-TCP streaming carried over layer-3 data-forwarding relay as a replacement for the current TCP-based stream services, such as YouTube and VoIP. Currently,we are expanding our work to design a QUIC counterpartcomposed of a hybrid UDP-TCP in order to eliminate theintroduced QUIC overhead at the user-space while maintainingerror-handling, packet security, privacy, and reliability at thekernel-space via the current TCP protocol.
In summary, our analysis emphasizes that a repetitive prob-ing burden for 24−hours is unnecessary. Instead, a 24−hoursof a careful measurement set is suitable to capture essentialpath characteristics. The validation of this claim has beenjustified by presenting that our implemented HTL-based pathestimation predicts stable relay paths for the hybrid UDP-TCP streaming to overcome the high drop-rates caused bythe individual TCP or UDP streaming.
REFERENCES
[1] J. Jiang et al., “VIA: Improving Internet Telephony Call Quality UsingPredictive Relay Selection,” SIGCOMM, pp. 286–299, 2016.
[2] S. Mohamed, S. Das, S. Biswas, and O. Mohammed, “On The Sig-nificance of Layer-3 Traffic Forwarding,” WWIC, Bologna, Italy, pp.170-181, 2019
[3] J. Kim, A. Chandra and Weissman, “OPEN: Passive Network Perfor-mance Estimation for Data-intensive Applications,” Technical Report,pp.8-41, 2008.
[4] A. Su, D. Choffnes, A. Kuzmanovic, and F. Bustamante, “DraftingBehind Akamai, Travelocity-Based Detouring,” In Proceedings of SIG-COMM, pp. 435–446, 2006.
[5] http://www.akamai.com, retrieved: 09-21-2020.[6] D. Choffnes and F. Bustamante, “On the Effectiveness of Measurement
Reuse for Performance-Based Detouring,” INFOCOM, pp. 693-701,2009.
[7] Z. Wang and J. Crowcroft, “Quality of Service Routing for SupportingMultimedia Applications,” IEEE JSAC, pp. 1228-1234, 1996.
64Copyright (c) IARIA, 2020. ISBN: 978-1-61208-786-3
ICNS 2020 : The Sixteenth International Conference on Networking and Services
73 / 81
[8] F. Golkar, T. Dreibholz, and A. Kvalbein, “Measuring and ComparingInternet Path Stability in IPv4 and IPv6,” In Proceedings of the 5th IEEEInternational Conference on the Network of the Future (NoF), pp. 1-5,2014.
[9] R. Fontugne, J. Mazel, and K. Fukuda, “An Empirical Mixture Modelfor Large-Scale RTT Measurements,” In Proceedings. IEEE INFOCOM,pp. 2470-2478, 2015.
[10] A. Lareida, D. Meier, T. Bocek, and B. Stiller, “Towards Path QualityMetrics for Overlay Networks,” IEEE 41st Conference on Local Com-puter Networks, pp. 156–159, 2016.
[11] V. Paxson, “End-to-End Internet Packet Dynamics,” In Proceedings ofSIGCOMM, pp. 139-152, 1997.
[12] J. Han, D. Watson, and F. Jahanian, “An Experimental Study ofInternet Path Diversity,” IEEE Transactions on Dependable and SecureComputing, pp. 273-288, 2006.
[13] https://www.caida.org, retrieved: 09-21-2020.[14] https://www.ripe.net, retrieved: 09-21-2020.[15] M. Backes, “On the Feasibility of TTL-Based Filtering for DRDoS
Mitigation,” RAID, pp 303-322, 2016.[16] “IP Option Numbers: The Current Recommended Default TTL for
Internet Protocol is 64 [RFC791] and [RFC1122],” https://www.iana.org/assignments/ip-parameters/ip-parameters.xml, retrieved: 09-21-2020.
[17] S. Fahmy and M. Kwon, “Characterizing Overlay Multicast Networksand Their Costs,” IEEE/ACM Transactions on Networking, pp. 373-386,2007.
[18] V. Paxson, “Measurements and Analysis of End-to-End Internet Dynam-ics,” Ph.D. Thesis, pp. 1-386, 1997.
[19] A. Ford, C. Raiciu, M. Handley, and O. Bonaventure, “TCP Extensionsfor Multipath Operation with Multiple Addresses”, Internet-draft, IETF,pp. 1-64, 2011, retrieved: 09-21-2020.
[20] V. Tran, Q. Coninck, B. Hesmans, R. Sadre, and O. Bonaventure,“Observing real Multipath TCP Traffic,” Journal of Computer Commu-nications, pp. 114-122, 2016.
[21] L. Chaufournier, A. Ali-Eldin, and P. Sharma, “Performance Evaluationof Multi-Path TCP for Data Center and Cloud Workloads,” ICPE, pp.13-24, 2019.
[22] A. Baldini, L. De Carli and F. Risso, “Increasing Performances of TCPData Transfers Through Multiple Parallel Connections,” ISCC, pp. 630-636, 2009.
[23] T. Nguyen and S. Cheung, “Multimedia Streaming Using Multiple TCPConnections,” PCCC, pp. 215-223, 2005.
[24] J. Iyengar and M. Thomson, “QUIC: A UDP-Based Multi-plexed and Secure Transport,” Internet-Draft, https://tools.ietf.org/html/draft-ietf-quic-transport-29, retrieved: 09-21-2020.
[25] A, Langley et al., “The QUIC Transport Protocol: Design and Internet-Scale Deployment,” SIGCOMM, pp. 183-196, 2017.
65Copyright (c) IARIA, 2020. ISBN: 978-1-61208-786-3
ICNS 2020 : The Sixteenth International Conference on Networking and Services
74 / 81
Towards Securing Big Data on Software Defined Network:
Performance Aware Architecture Design
Ahmed Mohammed AlghamdiDepartment of Software Engineering
College of Computer Science and EngineeringUniversity of JeddahJeddah, Saudi Arabia
E-mail: [email protected]
Abstract—Big data security and privacy have been the mainconcern because many organizations have started to depend onbig data for their operations. Big data refers to a large amountof structure and unstructured data that has been defineddifferently, but, in general, this term refers to the collection ofdata sets, which has special characteristics. Big data securityfaces the need to protect sensitive data by using differenttechnologies and policies. It has been argued that there is nocomprehensive security solution for big data, however, toachieve this comprehensive solution, parts of big data shouldbe protected and secured. In addition, Software DefinedNetwork (SDN) has gained more interest due to its advantagesin improving network management, as well as monitoring withmore programmability and better network resourceutilization. Many researches have been done in this field, butthe trade-off between security and performance has not beenconsidered, especially considering SDN. In this paper, anarchitecture design is proposed for big data security, whichconsiders security and performance trade-off. The proposedarchitecture is based on giving each part of big data the propersecurity mechanism to protect them efficiently, which not onlyimproves the performance, but also saves resources.
Keywords-Big Data; Big data security; Hadoop; SoftwareDefined Network.
I. INTRODUCTION
In recent years, big data has become increasingly one ofthe hot topics in Information Technology (IT) researchsociety. This importance comes from the various data usagesas well as its analysis and huge size. According to Big Datastatistics, data has increased 300 times to be 40,000 Exabytesin 2020 and the Big Data market is currently worth $138.9billion [1]. The uses of big data and its analysis haveattracted information science researchers, decision-makers inpublic and private sectors, healthcare systems, and ITcompanies. In addition, Software Defined Networking(SDN) has been recently gaining more interest due to manyfeatures that are offered by SDN, which improves thenetwork management and resource utilization. According toStatistics MRC, the "World Software Defined Networking(SDN) Market accounted for $10.88 billion in 2015 and isprojected to rise to $134.51 billion by 2022 at a CAGR of43.2% from 2015 to 2022", which is very high [2].
SDN provides many advantages including programmablenetwork access, large and complex data traffic management,reduced network hardware capital and operating costs, andpersonalized data control, which has inspired companies toembrace this technology. SDN is a layered networkarchitecture offering unparalleled programmability,automation, and network control by the ramification of thenetwork's control plane and data plane [2]. The networkknowledge and states are logically centralized in the SDNarchitecture, and the underlying network infrastructure fornetwork applications is abstracted. One of the keyadvantages of this approach is that it offers a more organizedsoftware framework for the creation of network-wideabstractions while simplifying the data plane capacity.
Big data refers to any large amount of structured andunstructured data. There are various explanations of big datavia Vs, which range from 3 to 6 Vs. Typically, 5 Vs used tocharacterize the big data including; volume, velocity, variety,veracity, and value. The volume is the data size; velocity isthe speed of generating and changing the data; variety is thedata in many forms; veracity is accuracy and validity of thedata; and value, which provides output from large data set[1][3][4]. Big data have many challenges and difficulties dueto their characteristics. It is also important to emphasize thatbig data can be used for critical decision-making andsensitive tasks; as a result, data trustworthiness is a criticalrequirement [5]. Data must be protected from unauthorizedaccess and modifications, accurate, complete, and up-to-date.Big data security can be seen from three main aspectsincluding; confidentiality, integrity, and availability. Manycomponents of big data need to be secure including; the dataitself during storage, transferring, processing, and the valueextracted from these data. Also, other hardware and softwarecomponents as well as the cloud providers and big dataplatforms. However, a comprehensive security solution isdifficult to achieve in big data.
The rest of this paper is structured as follows. Section 2discusses big data definitions, characteristics, as well as SDNrelated aspects. In Section 3, a literature review of big datasecurity challenges and solutions will be shown, as well asSDN-big data related researches. In Section 4, the proposedarchitecture will be displayed and described. Section 5,evaluation and comparative study are discussed and
66Copyright (c) IARIA, 2020. ISBN: 978-1-61208-786-3
ICNS 2020 : The Sixteenth International Conference on Networking and Services
75 / 81
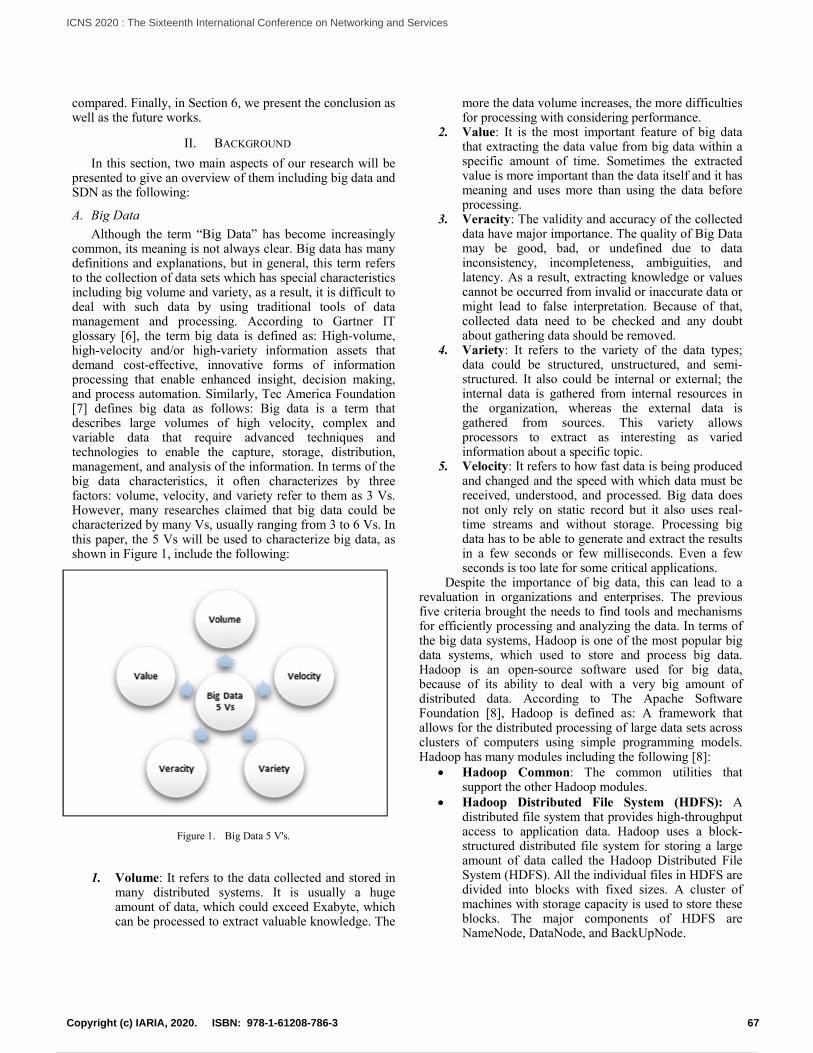
compared. Finally, in Section 6, we present the conclusion aswell as the future works.
II. BACKGROUND
In this section, two main aspects of our research will bepresented to give an overview of them including big data andSDN as the following:
A. Big Data
Although the term “Big Data” has become increasinglycommon, its meaning is not always clear. Big data has manydefinitions and explanations, but in general, this term refersto the collection of data sets which has special characteristicsincluding big volume and variety, as a result, it is difficult todeal with such data by using traditional tools of datamanagement and processing. According to Gartner ITglossary [6], the term big data is defined as: High-volume,high-velocity and/or high-variety information assets thatdemand cost-effective, innovative forms of informationprocessing that enable enhanced insight, decision making,and process automation. Similarly, Tec America Foundation[7] defines big data as follows: Big data is a term thatdescribes large volumes of high velocity, complex andvariable data that require advanced techniques andtechnologies to enable the capture, storage, distribution,management, and analysis of the information. In terms of thebig data characteristics, it often characterizes by threefactors: volume, velocity, and variety refer to them as 3 Vs.However, many researches claimed that big data could becharacterized by many Vs, usually ranging from 3 to 6 Vs. Inthis paper, the 5 Vs will be used to characterize big data, asshown in Figure 1, include the following:
Figure 1. Big Data 5 V's.
1. Volume: It refers to the data collected and stored inmany distributed systems. It is usually a hugeamount of data, which could exceed Exabyte, whichcan be processed to extract valuable knowledge. The
more the data volume increases, the more difficultiesfor processing with considering performance.
2. Value: It is the most important feature of big datathat extracting the data value from big data within aspecific amount of time. Sometimes the extractedvalue is more important than the data itself and it hasmeaning and uses more than using the data beforeprocessing.
3. Veracity: The validity and accuracy of the collecteddata have major importance. The quality of Big Datamay be good, bad, or undefined due to datainconsistency, incompleteness, ambiguities, andlatency. As a result, extracting knowledge or valuescannot be occurred from invalid or inaccurate data ormight lead to false interpretation. Because of that,collected data need to be checked and any doubtabout gathering data should be removed.
4. Variety: It refers to the variety of the data types;data could be structured, unstructured, and semi-structured. It also could be internal or external; theinternal data is gathered from internal resources inthe organization, whereas the external data isgathered from sources. This variety allowsprocessors to extract as interesting as variedinformation about a specific topic.
5. Velocity: It refers to how fast data is being producedand changed and the speed with which data must bereceived, understood, and processed. Big data doesnot only rely on static record but it also uses real-time streams and without storage. Processing bigdata has to be able to generate and extract the resultsin a few seconds or few milliseconds. Even a fewseconds is too late for some critical applications.
Despite the importance of big data, this can lead to arevaluation in organizations and enterprises. The previousfive criteria brought the needs to find tools and mechanismsfor efficiently processing and analyzing the data. In terms ofthe big data systems, Hadoop is one of the most popular bigdata systems, which used to store and process big data.Hadoop is an open-source software used for big data,because of its ability to deal with a very big amount ofdistributed data. According to The Apache SoftwareFoundation [8], Hadoop is defined as: A framework thatallows for the distributed processing of large data sets acrossclusters of computers using simple programming models.Hadoop has many modules including the following [8]:
Hadoop Common: The common utilities thatsupport the other Hadoop modules.
Hadoop Distributed File System (HDFS): Adistributed file system that provides high-throughputaccess to application data. Hadoop uses a block-structured distributed file system for storing a largeamount of data called the Hadoop Distributed FileSystem (HDFS). All the individual files in HDFS aredivided into blocks with fixed sizes. A cluster ofmachines with storage capacity is used to store theseblocks. The major components of HDFS areNameNode, DataNode, and BackUpNode.
67Copyright (c) IARIA, 2020. ISBN: 978-1-61208-786-3
ICNS 2020 : The Sixteenth International Conference on Networking and Services
76 / 81

Hadoop YARN: A framework for job schedulingand cluster resource management.
Hadoop MapReduce: A YARN-based system forparallel processing of large data sets.
Big data has many security issues and challenges as wellas privacy concerns, which must be taken into considerationbefore building a big data environment. The following aresome of the most important challenges that should beconsidered when dealing with big data:
Access Control Communication Security Data Integrity Computations Security Privacy Random Distribution Cloud Security Hadoop Security End-Point input validation and filteringTraditional security solutions are insufficient when
dealing with big data to ensure security and privacy.Encryption techniques, access permissions, firewalls,transport layer security can be broken. For these reasons,advanced techniques and technologies are needed to protect,monitor, and audit big data in terms of data, applications, andinfrastructures.
B. Software Defined Network (SDN)
SDN has been defined as an emerging networkarchitecture designed to improve and simplify networkmanagement as well as improve network resource utilization.SDN can be viewed in three different layers including dataplane, control plane, and application plane. This separationof network devices from their management enables thenetwork control to be programmable, independentlydeveloped, and have a flexible design compared to thetraditional network architectures [2]. The following Figure 2shows the SDN architecture.
Figure 2. SDN Architecture [9].
The first layer of the SDN architecture is a data plane thatincludes switches, whether physical and virtual switches, thatare considered as forwarding devices. The switches give aview of the programmable flow tables that can describe anoperation related to a particular flow for each packet. Thesecond layer of the SDN architecture is the control plane thatmoves the control logic to an external body, called the SDNcontroller, which lies within the architecture's control plane.The controller is a software interface that has a full view ofthe network and the ability to make optimal routingdecisions, thereby increasing the visibility of the network.The network is programmable by application softwareprograms located in the third layer, named application plane,that runs at the top of the control plane. This plane has aseries of applications that enforce certain functions ofnetwork control, such as routing, load balancing, faulttolerance, recovery, etc. By means of a well-definedprogramming interface between the switches and the SDNcontroller, the separation of the control plane and the dataplane can be understood. The controller controls theelements of the data plane directly through a well-definedApplication Programming Interface (API), as shown inFigure 2, the so-called Southbound API.
SDN provides various features for all SDN-enableddevices, such as centralized and decentralized control ofmultiple cross-vendor network components, primarily dataplane platforms with a specific abstraction layer of APIs. Itdecreases the difficulty of network configuration andoperation achieved through the automation of high-levelnetwork feature configuration and forwarding behavior [7].SDN enables fast implementation of new protocols andnetwork-services leading to the high abstraction ofoperations. The SDN infrastructure can be tailored to thespecific user application running on it through a controlplane, which improves the user experience considerably.
SDN, however, has its disadvantages: the addedflexibility and functionality allow additional overhead on theequipment and, as a result, processing speed and throughputcapacity are forfeited. It does not mean that the overallefficiency is automatically decreasing; the SDN-enabledequipment will perform many network services and tasksperformed by the end-nodes of the control layers of thenetwork systems in a simpler and faster manner.
III. RELATED WORK
Several researches have been done in big data securityand privacy, yet there is no comprehensive securityarchitecture for big data. Because it is impossible to protectall big data and its attributes, big data security has been seenfrom a different perspective. Many researches and techniqueshave been deployed and implemented to improve big datasecurity. Some related works are presented as the following:
In the research published in [10], an access controlschemes for Hadoop data storage has been proposed basedon concepts from BitTorrent and the secure sharing storageover the cloud. Their paper has described the Hadooparchitecture as well as the process flows. The security risksthat faced Hadoop have been reviewed and a solution forsecuring data stored on Hadoop over cloud systems has been
68Copyright (c) IARIA, 2020. ISBN: 978-1-61208-786-3
ICNS 2020 : The Sixteenth International Conference on Networking and Services
77 / 81
proposed. This proposed solution is based on creating anddistributing access token over a web server by encrypting themeta-data records from the Hadoop client and creatingaccess token file and encrypting them as well. Finally, theencrypted access token files are distributed to the cloudstorage providers. This solution has not been implemented orevaluated in terms of performance and applications foraccess control.
A dynamic adaptive access control scheme for Hadoopplatform has been proposed in [11] that platform that adoptsuser suspicious status evaluation and user authorizationpolicy based on labels and attributes. This scheme can realizethe real-time dynamic adjustment of user authority accordingto user behavior by designing the trigger mechanism ofauthority automatic change, thereby more effectivelyprotecting user sensitive information and private data in a bigdata environment.
A new architecture for securing MapReduce computationin the cloud has been introduced in [12] aiming to secure theTag-MapReduce framework providing high secureMapReduce computation in the cloud with low overhead. Inthis paper data integrity, verification, and privacy have beenfocused on. Security challenges have been discussed andpresented for big data processing using MapReduce. Theirarchitecture based on a hybrid cloud and the MapReduce willmove to the cloud especially the public cloud which makes itinsecure. Their design not only secures the MapReduce butalso considering the overhead as well as avoiding somevulnerability. A comparison between the architecture withthe previous solutions has been done.
The paper published in [13] has presented a meta-modelfor security policies and a comprehensive framework foraccess management at the Infrastructure as a Service (IaaS)level. The proposed framework is being implemented on theopen-source IaaS platform OpenStack, using HDFS andMySQL for data storage and adopting IBE as the encryptionmethod. This architecture could be divided into two parts:the trusted authority domain and the data center domain. Thetrusted authority domain includes two components: anidentity & key management engine and a policy engine. Thedata center domain stores the encrypted data. This paper didnot include any evaluation or comparative study.
An approach to provide security to unstructured Big Datahas been discussed in [14], that developed to give adequatesecurity to the unstructured data by considering the types ofthe data and their sensitivity levels. They also have shownthat data classification concerning sensitivity levels enhancesthe performance of the system.
The paper published in [15] focuses on the issue ofreaching sensitive data by the cloud operators and proposes anovel approach that can efficiently split the file andseparately store the data in the distributed cloud servers, inwhich the data cannot be directly reached by cloud serviceoperators. The proposed scheme is entitled as Security-Aware Efficient Distributed Storage (SAEDS) model, whichis mainly supported by the proposed algorithms, namedSecure Efficient Data Distributions (SED2) Algorithm andEfficient Data Conflation (EDCon) Algorithm. The main
problem solved by their proposed scheme is preventingcloud providers from directly reaching users' original data.
In addition, the SDN security related to big data that inthe paper published in [16] security challenges in the SDNnetwork have been addressed. They propose an approach topredict attacks in the SDN networks by applying machinelearning techniques instead of using the traditional techniquewith threshold values, which tend to be problematic due todynamic environments of SDN. Their proposed method notonly predicts the presence of attack but also attack type by apredictive model, which represents the behaviors of thenetwork, particularly under ARP attack, LLDP Attack, or noattack.
The research in [17] proposed a big data analysis-basedsecure cluster management architecture for the optimizedcontrol plane. A security authentication scheme has beenalso proposed for cluster management to ensure the legalityof the data sources. Moreover, ant colony optimization wasused to enable a big data analysis scheme and animplementation system was proposed to optimize the controlplane. This work is significant in improving the performanceand efficiency of applications running in SDN.
An approach to efficient network design andcharacterization using SDN and Hadoop has been proposedin [18], which shows a method to control characteristics andprovide security to the network, which is helpful in capacityplanning and attack detection and prevention and severalways.
IV. THE PROPOSED ARCHITECTURE
From the literature review, it is not clear how to have asoftware architecture design to present a solution for big datasecurity. Our proposed architecture aims to secure the bigdata, taking into consideration the performance of writing toor reading from big data storing systems. The main twofunctions of this architecture are writing and reading. Manysecurity aspects have been considered in this architectureincluding; file policies, fragmentation, and encryption filesby using different techniques. In terms of the performanceaspect, this architecture divided the load into a number ofagents that will improve the performance. In addition, thedata classification will improve the performance by givingeach file the relative storing process with its respectiveimportance. Finally, this architecture has flexibility becauseit can deal with any big data storing system. The followingFigure 3 shows the proposed architecture, including thefollowing components:
A. Interface Agent
This agent is responsible for displaying the GraphicalUser Interface (GUI) on the screen and receiving the username and password from the user as well as displaying thefile after retrieving them.
B. Authentication
This agent is responsible for authenticating the user andmake sure only the legitimate user can enter the system. Thisagent checks the user name and password and uses a digitalsignature to confirm the identity of the user. In addition, a
69Copyright (c) IARIA, 2020. ISBN: 978-1-61208-786-3
ICNS 2020 : The Sixteenth International Conference on Networking and Services
78 / 81
one-time authentication code can be used for moreprotection. This agent can also utilize existing authenticationtechniques, such as OAuth, OTP, etc.
C. Authorization
In this agent, the access rights to files will be controlled.Access control in particular is the main function of thisagent. This agent displays the available files, which the userhas permissions to access, read, write, etc. It is connected topolicy storage that saves all file policies and userpermissions. To secure this storage, the authorization agent isconnected to the encryption/decryption agent to encrypt thepolicy storage by using public/private key cryptography.RSA algorithm will be used for this purpose. However, dueto heavy computation regarding the encryption, data at restwill be encrypted and once it is not in used. Data that isbeing processed will only be encrypted once the relatedprocesses are terminated. In terms of giving permissions, theuser can update or add permissions to his files by using thisagent. However, in some cases, there is some concernregarding the access to unwanted parts of the dataset such asPersonal Identifiable Information (PII) through utilizingprocess' global permission. In this case, all events must belogged to a log server for auditing and monitoring anyincident that happened intentionally or unintentionally.
D. Main Agent
The main agent is considered as the main menu, whichgives the user the ability to choose to write, update, or readfiles that he has the authority to access. This agent isconnected to the write/update agent and read agent as well asthe authorization agent.
E. Write/Update Agent
This agent is responsible for writing a new file to thesystem or updating existing files. It is connected to the meta-data agent to extract information about the exciting files thatwill be updated or to store meta-data after writing new files.
F. Read Agent
This agent is used to read files from the storing system.This agent is connected to the meta-data, which gives thisagent the ability to reach the files and the needed operationsif necessary. This agent also connected to thefragmentation/merge agent, which will be used in case ofretrieving fragmented files. It will receive merge files fromthe fragmentation/merge agent and send it to the collectoragent. Furthermore, it is connected to theencryption/decryption agent, which allows the read agent toretrieve encrypted files and decrypt them by using this agentand send them to the collector agent.
G. Data Classification Agent
This agent will receive the user's choice of his data andtag the files with the security classification code, whichdifferentiate the files by its criticality. In this architecture, thedata has been classified into:
1. Sensitive Data: The data is valuable and need thehighest level of security with a different type of
protection techniques. The strongest algorithms andstandards will be used in this class of data to provideprotection. These data might be related to nationalsecurity, military secrets, or industrial secrets.
2. Confidential Data: this class of data has a middlelevel of sensitivity, needs security algorithms withgood processing speed, and might use algorithmsless strong than the algorithms used in the sensitivedata. This class of data may include data related tomilitary equipment, country political and economicsituations, or new changes in the company's future.
3. Public Data: This class of data will be open foreveryone or give access for registered users using idand password, such as files on the universitywebsites given to the university students.
By using this classification, an adequate level of securitywill be provided and enhance the processing performance ofthe system.
H. Fragmentation/Merge Agent
This agent is responsible for fragmenting files into arandom number of fragments with different sizes, for moreprotection, in terms of the writing process. In terms of thereading process, this agent is responsible for merging filesand assembles the file to be complete again. This agent willbe used in case of writing or updating sensitive data files. Inaddition, this agent is connected to the meta-data agent toadd or update these files records and keep track of the files'fragments places. Also, this agent is connected to theencryption/decryption agent for encrypting these fragments.
I. Encryption/Decryption Agent
This agent will be used to encrypt confidential files aswell as encrypt sensitive data that comes from thefragmentation agent. This agent is also connected to themeta-data and authorization agents to protect their storageand provide security to them. In contrast, the decryptionfunction will be used to decrypt files and send them to theread agent as well as decrypting fragments. Finally, afterencrypting the data files, the files will be sent to the storingsystems.
J. Meta-Data Agent
This agent is responsible for storing all meta-data of thesaved files as well as the new files. This agent is connectedto five agents including; write, read, data classification,fragmentation, and encryption agents. It has meta-datastorage that has been protected by using encryptionalgorithms.
K. Collector Agent
This agent will collect files from the storing systems andapply the reading-related functions to them and at the endsending the complete file to the interface agent.
V. EVALUATION AND COMPARATIVE STUDY
In this section, the evaluation of the proposedarchitecture will be discussed and compared with somerelated literature review. In many researches, security issues
70Copyright (c) IARIA, 2020. ISBN: 978-1-61208-786-3
ICNS 2020 : The Sixteenth International Conference on Networking and Services
79 / 81
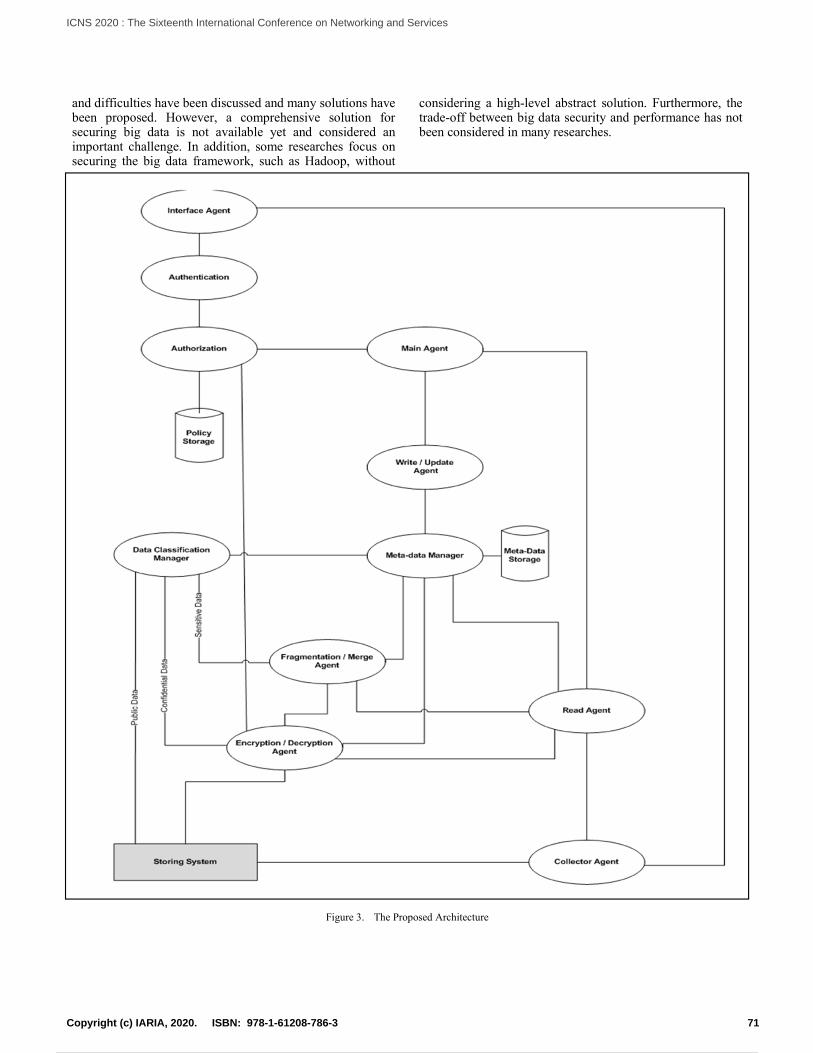
and difficulties have been discussed and many solutions havebeen proposed. However, a comprehensive solution forsecuring big data is not available yet and considered animportant challenge. In addition, some researches focus onsecuring the big data framework, such as Hadoop, without
considering a high-level abstract solution. Furthermore, thetrade-off between big data security and performance has notbeen considered in many researches.
Figure 3. The Proposed Architecture
71Copyright (c) IARIA, 2020. ISBN: 978-1-61208-786-3
ICNS 2020 : The Sixteenth International Conference on Networking and Services
80 / 81
In the proposed architecture, a high-level solution hasbeen considered, which gives this architecture the ability towork with any big data framework. This could allow thisarchitecture to work with multiple storing systems at thesame time without affecting the architecture design orfunctionality. In terms of performance, this architectureconsidered the trade-off between security and performanceby classifying the data into categories and gives the properprotection to each category. This technique not onlyimproves the performance but it saves the related resources.In addition, the load has been distributed into several agentsto improve the performance, such as having the collectoragent to take some load from the read agent.
The agent architecture style has been used to benefit fromits advantages as well as its mobility. Dealing with a bigamount of data, which is a big data characteristic, needs amobile agent to travel rather than bring all data to the user.An agent architecture is a dynamic architecture that will becreated during the runtime and has the ability to run ondifferent software and hardware, which will be needed in abig data environment.
VI. CONCLUSION AND FUTURE WORKS
In this paper, an overview of big data and its relatedcharacteristics and security challenges have been presented.Some related works were revised and discussed. Anarchitecture design has been proposed for big data security,which considers security and performance trade-off. Theproposed architecture is based on giving each part of big datathe proper security mechanism to protect it in a moreefficient way. This not only improves the performance, butalso saves resources and gives every part what is reallyneeded. In addition, some sequence diagrams have beenpresented to explain some processes of the proposedarchitecture. Finally, a comparative study has been done toevaluate the proposed architecture.
For future works, the proposed architecture needs somerelated works to have a comprehensive security solution forbig data. In addition, some performance measurements areneeded to discover the architecture performance in differentscenarios and to improve any notices regarding the loaddistributions or the processing time, especially theencryption/decryption processes and fragment/mergeprocesses. Finally, an implementation of this architecturewill be needed as well as including some transportationsecurity solutions to improve security.
REFERENCES
[1] D. S. Terzi, R. Terzi, and S. Sagiroglu, “A survey on securityand privacy issues in big data,” in 2015 10th InternationalConference for Internet Technology and Secured Transactions(ICITST), 2015, pp. 202–207, doi:10.1109/ICITST.2015.7412089.
[2] M. Alsaeedi, M. M. Mohamad, and A. A. Al-Roubaiey,“Toward Adaptive and Scalable OpenFlow-SDN FlowControl: A Survey,” IEEE Access, vol. 7, pp. 107346–107379, 2019, doi: 10.1109/ACCESS.2019.2932422.
[3] P. Adluru, S. S. Datla, and X. Zhang, “Hadoop eco system forbig data security and privacy,” in 2015 Long Island Systems,Applications and Technology, 2015, pp. 1–6, doi:10.1109/LISAT.2015.7160211.
[4] Y. Gahi, M. Guennoun, and H. T. Mouftah, “Big DataAnalytics: Security and privacy challenges,” in 2016 IEEESymposium on Computers and Communication (ISCC), 2016,pp. 952–957, doi: 10.1109/ISCC.2016.7543859.
[5] E. Bertino, “Big Data - Security and Privacy,” in 2015 IEEEInternational Congress on Big Data, 2015, pp. 757–761, doi:10.1109/BigDataCongress.2015.126.
[6] I. Gartner, “Gartner IT Glossary,” 2016. [Online]. Available:http://www.gartner.com/it-glossary/big-data/. [Accessed: 01-Jul-2020].
[7] S. Mills, S. Lucas, L. Irakliotis, M. Rappa, T. Carlson, and B.Perlowitz, “Demystifying Big Data: A Practical Guide toTransforming the Business of Government,” 2012.
[8] The Apache Software Foundation, “What Is ApacheHadoop?,” The Apache Software Foundation, 2016. [Online].Available: http://hadoop.apache.org/index.html. [Accessed:01-Jul-2020].
[9] T. Das, V. Sridharan, and M. Gurusamy, “A Survey onController Placement in SDN,” IEEE Commun. Surv.Tutorials, vol. 22, no. 1, pp. 472–503, 2020, doi:10.1109/COMST.2019.2935453.
[10] C. Rong, Z. Quan, and A. Chakravorty, “On Access ControlSchemes for Hadoop Data Storage,” in 2013 InternationalConference on Cloud Computing and Big Data, 2013, pp.641–645, doi: 10.1109/CLOUDCOM-ASIA.2013.82.
[11] J. Li, G. Zhao, X. Sun, and Y. Liu, “A Dynamic AdaptiveAccess Control Scheme for Hadoop Platform,” in 2019 IEEE2nd International Conference on Computer andCommunication Engineering Technology (CCET), 2019, pp.79–83, doi: 10.1109/CCET48361.2019.8989081.
[12] C. A. A. Bissiriou and M. Zbakh, “Towards Secure Tag-MapReduce Framework in Cloud,” in 2016 IEEE 2ndInternational Conference on Big Data Security on Cloud(BigDataSecurity), IEEE International Conference on HighPerformance and Smart Computing (HPSC), and IEEEInternational Conference on Intelligent Data and Security(IDS), 2016, pp. 96–104, doi: 10.1109/BigDataSecurity-HPSC-IDS.2016.78.
[13] S. Li, T. Zhang, J. Gao, and Y. Park, “A Sticky PolicyFramework for Big Data Security,” in 2015 IEEE FirstInternational Conference on Big Data Computing Service andApplications, 2015, pp. 130–137, doi:10.1109/BigDataService.2015.71.
[14] M. R. Islam and M. E. Islam, “An approach to providesecurity to unstructured Big Data,” in The 8th InternationalConference on Software, Knowledge, InformationManagement and Applications (SKIMA 2014), 2014, pp. 1–5,doi: 10.1109/SKIMA.2014.7083392.
[15] K. Gai, M. Qiu, and H. Zhao, “Security-Aware Efficient MassDistributed Storage Approach for Cloud Systems in BigData,” in 2016 IEEE 2nd International Conference on BigData Security on Cloud (BigDataSecurity), IEEEInternational Conference on High Performance and SmartComputing (HPSC), and IEEE International Conference onIntelligent Data and Security (IDS), 2016, pp. 140–145, doi:10.1109/BigDataSecurity-HPSC-IDS.2016.68.
[16] E. Unal, S. Sen-Baidya, and R. Hewett, “Towards Predictionof Security Attacks on Software Defined Networks: A BigData Analytic Approach,” in 2018 IEEE InternationalConference on Big Data (Big Data), 2018, pp. 4582–4588,doi: 10.1109/BigData.2018.8622524.
[17] J. Wu, M. Dong, K. Ota, J. Li, and Z. Guan, “Big DataAnalysis-Based Secure Cluster Management for OptimizedControl Plane in Software-Defined Networks,” IEEE Trans.Netw. Serv. Manag., vol. 15, no. 1, pp. 27–38, Mar. 2018,doi: 10.1109/TNSM.2018.2799000.
[18] A. Desai, K. S. Nagegowda, and T. Ninikrishna,“Characterization Using SDN and Hadoop,” 2016 Int. Conf.Circuit, Power Comput. Technol. (ICCPCT), pp. 1–6, 2016,doi: 10.1109/ICCPCT.2016.7530122.
72Copyright (c) IARIA, 2020. ISBN: 978-1-61208-786-3
ICNS 2020 : The Sixteenth International Conference on Networking and Services
Powered by TCPDF (www.tcpdf.org)
81 / 81