Embed Size (px)
Citation preview
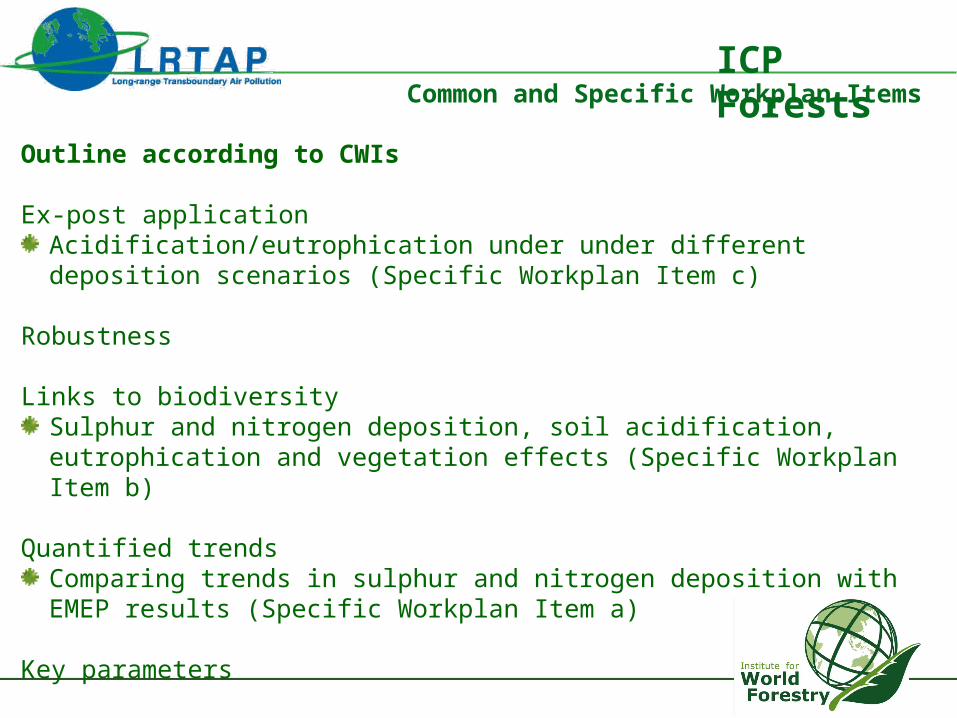
ICP ForestsCommon and Specific Workplan Items
Outline according to CWIs
Ex-post applicationAcidification/eutrophication under under different deposition scenarios (Specific Workplan Item c)
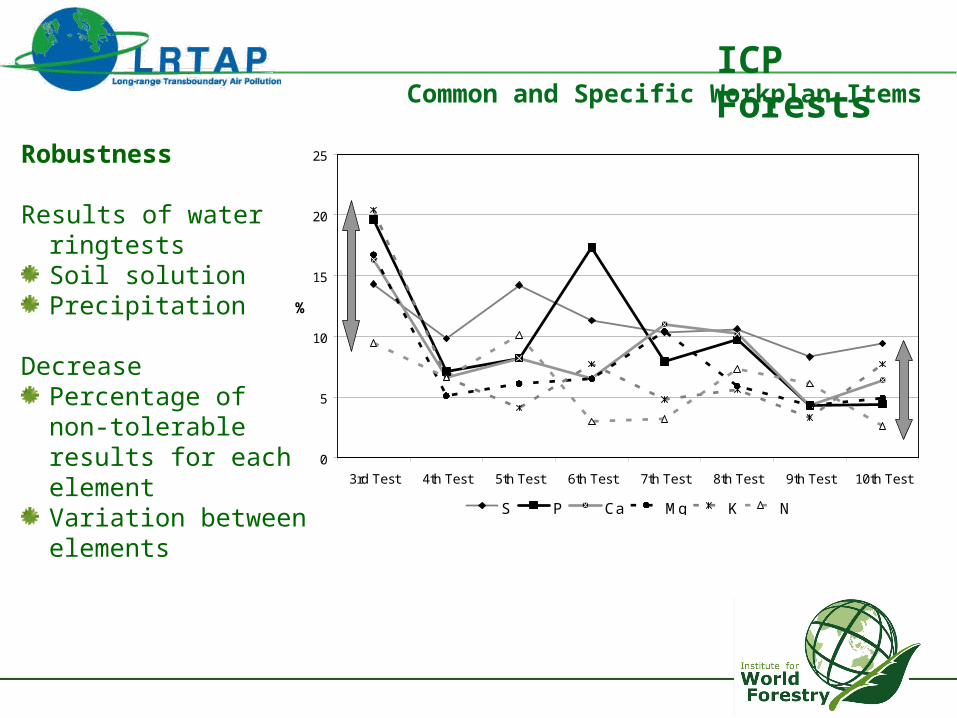
Robustness
Links to biodiversitySulphur and nitrogen deposition, soil acidification, eutrophication and vegetation effects (Specific Workplan Item b)
Quantified trendsComparing trends in sulphur and nitrogen deposition with EMEP results (Specific Workplan Item a)
Key parameters
ICP ForestsCommon and Specific Workplan Items
Ex-post application
Development of acidification and eutrophication of forest soils under differentdeposition scenarios (Specific Workplan Item c)
ICP M&M recommended (26th TFM in Paris)Application of VSD+ and BERN ModelsCooperation between ICP M&M and other ICPs
ICP Forests cooperates with German NFC of ICP M&M (ÖKO-DATA)ÖKO-DATA will for 75-100 ICP Forests Level II plots calculate
Critical loads for acidity and nitrogen (SMB-Model)Critical loads exceedancesDynamics of C and N (VSD+ Model)Possibility degree
Species (BERN)Plant communities (BERN)
ScenariosDepositionClimate
ICP ForestsCommon and Specific Workplan Items
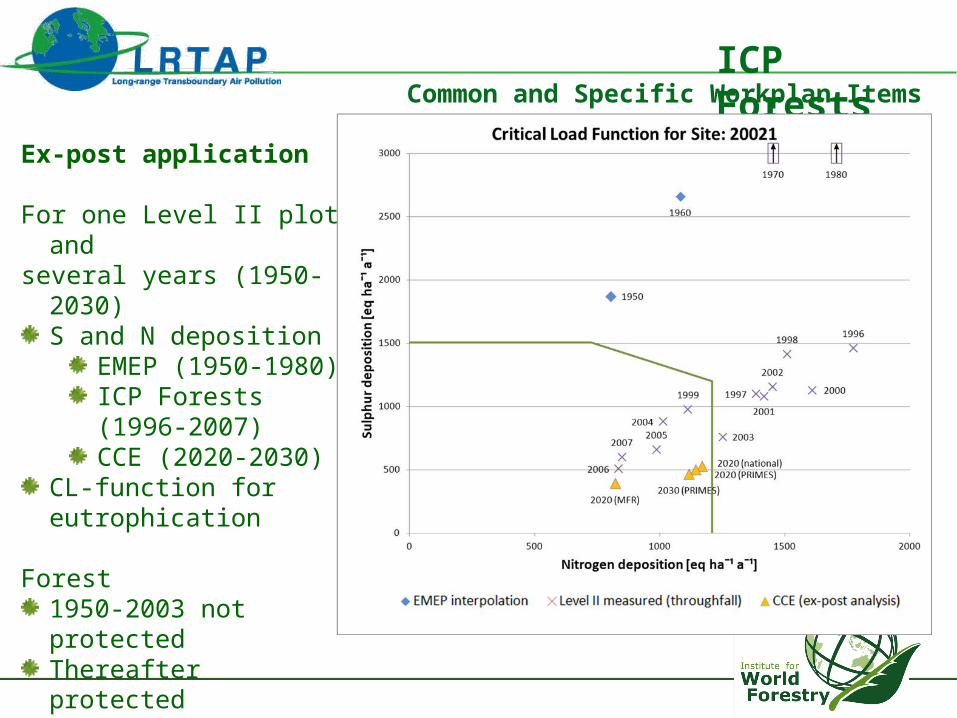
Ex-post application
For one Level II plot andseveral years (1950-2030)
S and N depositionEMEP (1950-1980)ICP Forests (1996-2007)CCE (2020-2030)
CL-function for eutrophication
Forest1950-2003 not protectedThereafter protected
ICP ForestsCommon and Specific Workplan Items
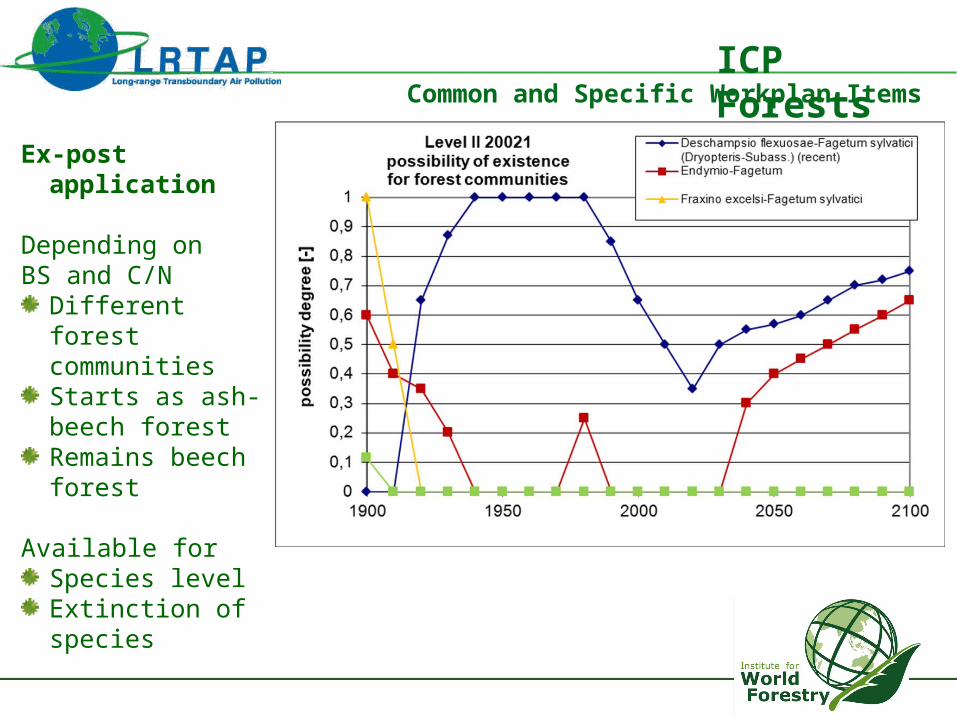
Ex-post application
Depending onBS and C/N
Different forest communitiesStarts as ash-beech forestRemains beech forest
Available forSpecies levelExtinction of species
ICP ForestsCommon and Specific Workplan Items
Robustness
Regularly conductedLaboratory intercomparison exercises (ringtests)
Soil analysesSoil solution analysesPrecipitation (deposition) analysesNeedle-leaf chemistry
International intercalibration courses (ICCs)Crown condition
DefoliationBiotic and abiotic damage types
Deviations between labs decrease over time
ICP ForestsCommon and Specific Workplan Items
Robustness
Results of water ringtestsSoil solutionPrecipitation
DecreasePercentage of non-tolerable results for each elementVariation between elements
0
5
10
15
20
25
3rd Test 4th Test 5th Test 6th Test 7th Test 8th Test 9th Test 10th Test
%
S P Ca Mg K N
ICP ForestsCommon and Specific Workplan Items
Links with biodiversity
Canocial Correspondence AnalysisExplanation of variance in ground vegetation species by e. g.
pHBSCECN depositionS depositionBC deposition
on 477 Level II plots withGround vegetationSoil conditionDeposition
Modelled (EMEP)Measured by ICP Forests (181 plots)
ICP ForestsCommon and Specific Workplan Items
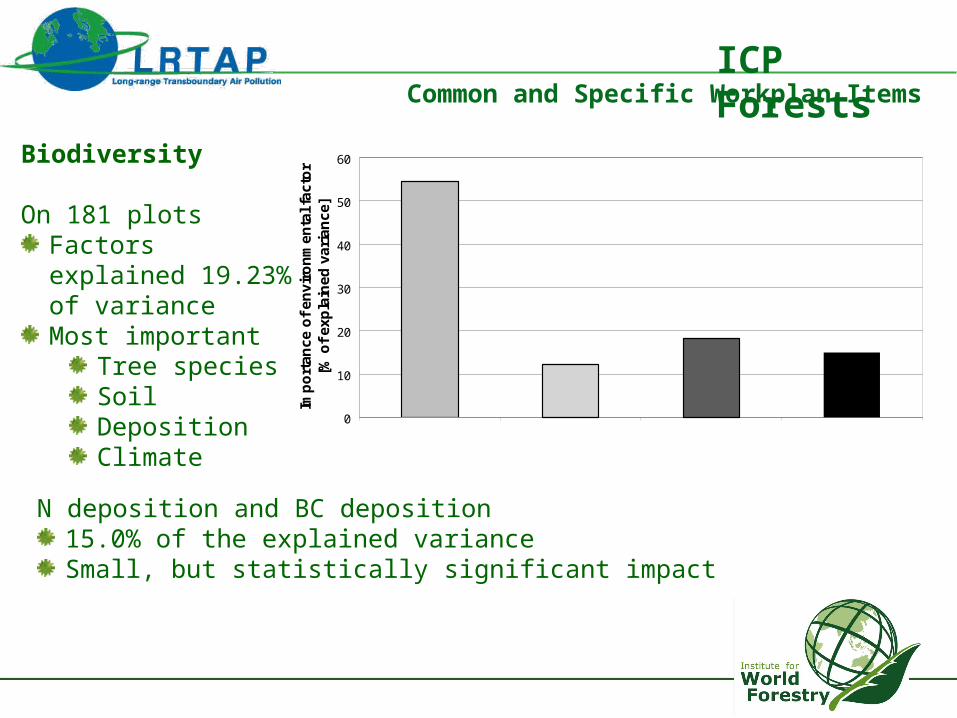
Biodiversity
On 181 plotsFactors explained 19.23% of varianceMost important
Tree speciesSoilDepositionClimate
0
10
20
30
40
50
60
1 2 3 4
Imp
ort
ance
of
envi
ron
men
tal f
acto
r[%
of
exp
lain
ed
var
ian
ce]
Main tree species
Climate Soil Deposition
N deposition and BC deposition15.0% of the explained varianceSmall, but statistically significant impact
ICP ForestsCommon and Specific Workplan Items
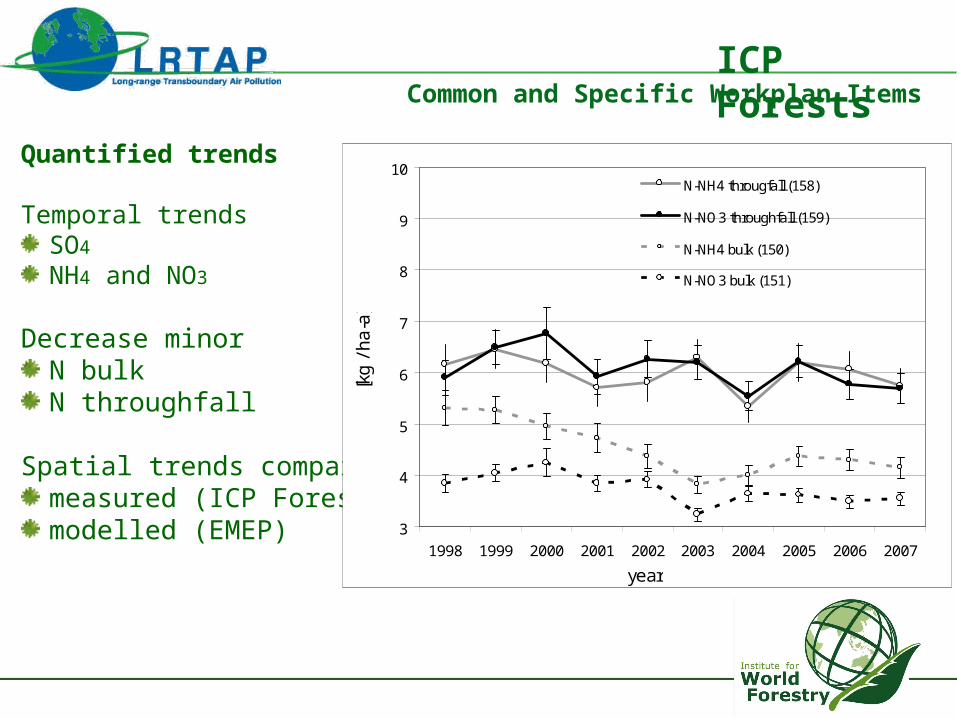
Quantified trends
Temporal trendsSO4
NH4 and NO3
Decrease minorN bulkN throughfall
Spatial trends comparedmeasured (ICP Forests)modelled (EMEP) 3
4
5
6
7
8
9
10
1998 1999 2000 2001 2002 2003 2004 2005 2006 2007
year
[kg
/ h
a-a
]
N-NH4 througfall (158)
N-NO3 throughfall (159)
N-NH4 bulk (150)
N-NO3 bulk (151)
ICP ForestsCommon and Specific Workplan Items
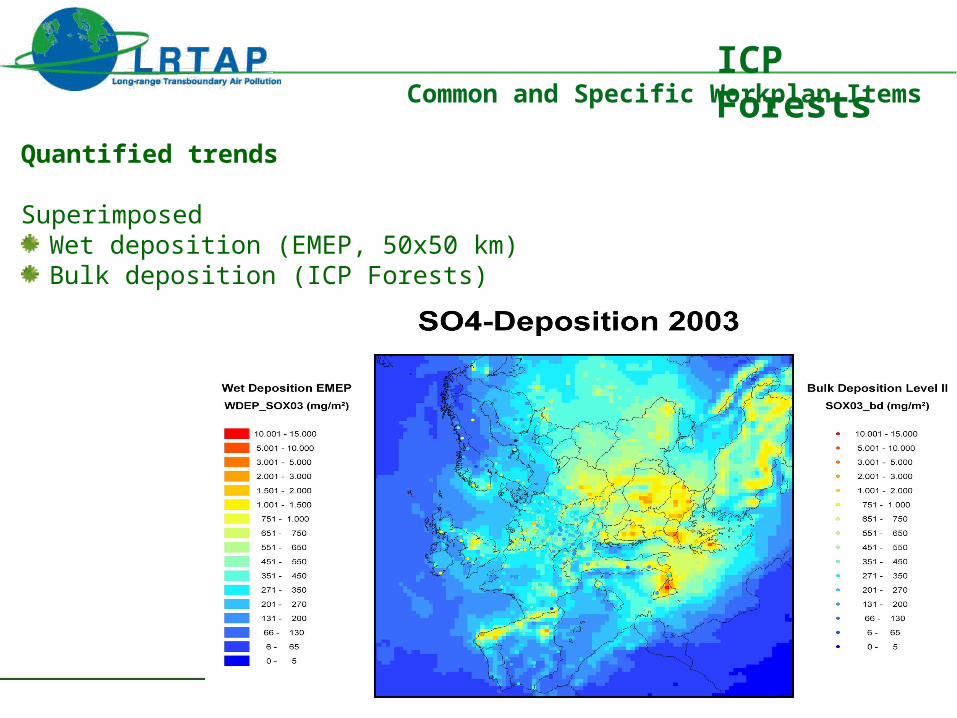
Quantified trends
SuperimposedWet deposition (EMEP, 50x50 km)Bulk deposition (ICP Forests)
ICP ForestsCommon and Specific Workplan Items
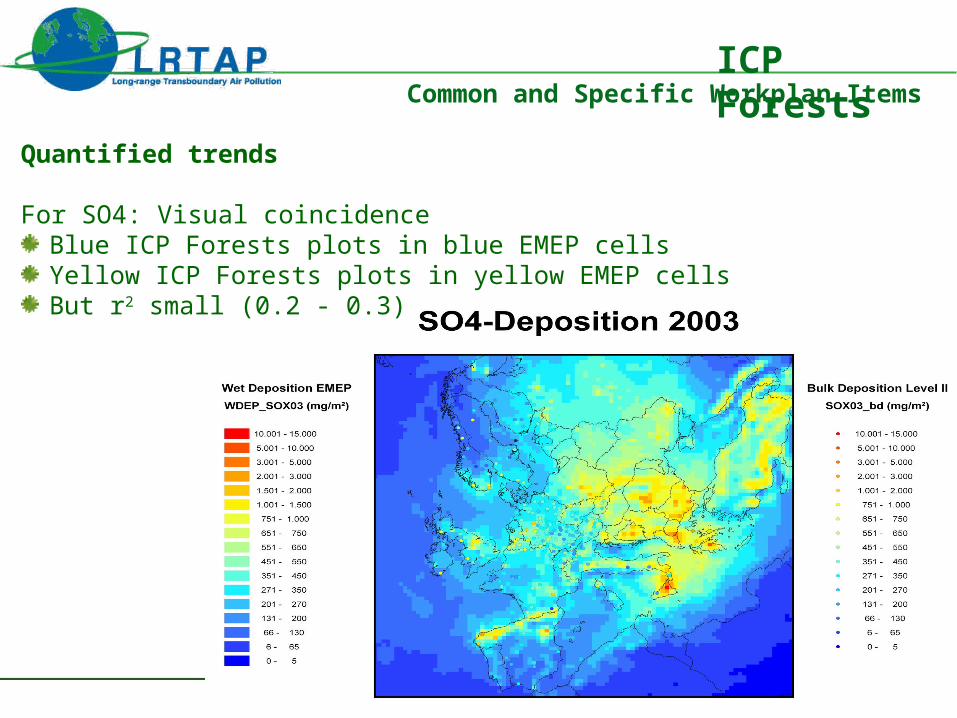
Quantified trends
For SO4: Visual coincidenceBlue ICP Forests plots in blue EMEP cells Yellow ICP Forests plots in yellow EMEP cellsBut r2 small (0.2 - 0.3)
ICP ForestsCommon and Specific Workplan Items
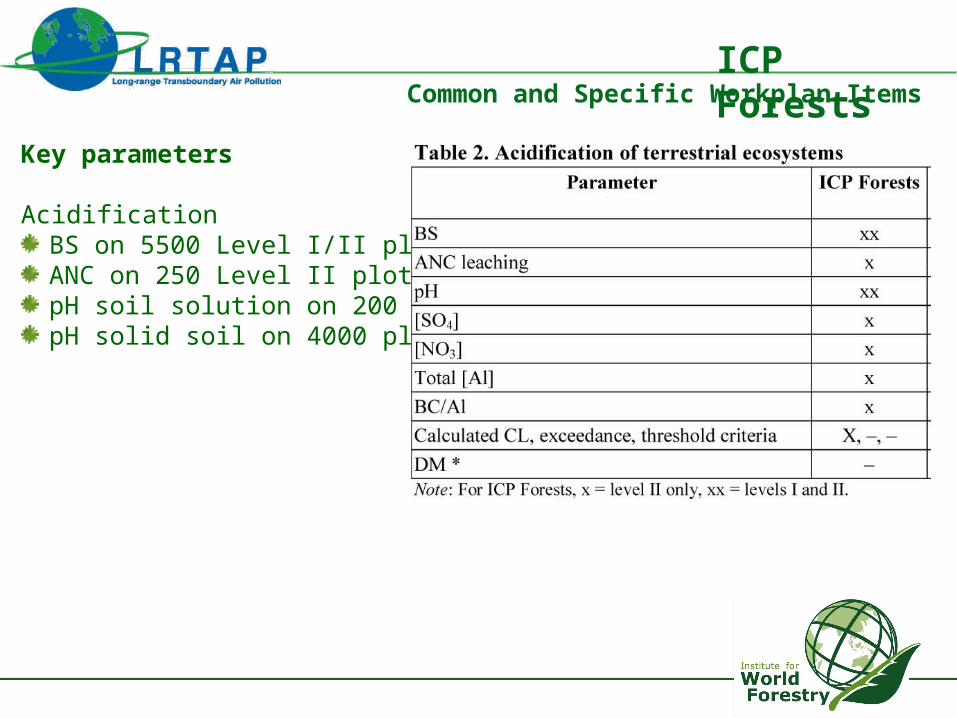
Key parameters
AcidificationBS on 5500 Level I/II plotsANC on 250 Level II plotspH soil solution on 200 plotspH solid soil on 4000 plots
ICP ForestsCommon and Specific Workplan Items
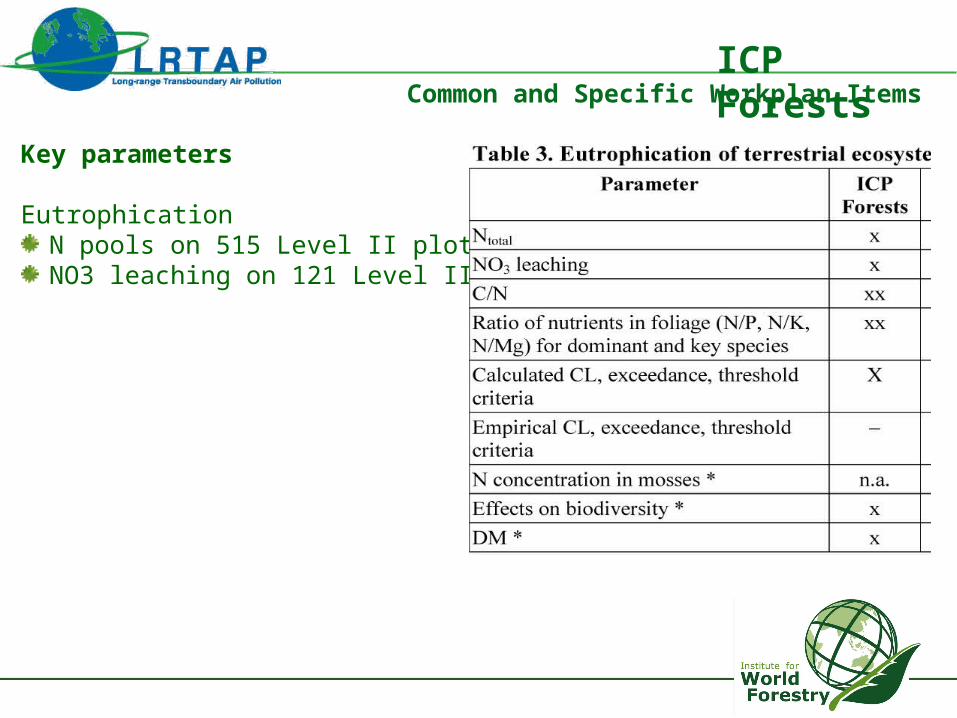
Key parameters
EutrophicationN pools on 515 Level II plotsNO3 leaching on 121 Level II plots
ICP ForestsCommon and Specific Workplan Items
Results
Described in greater detail in 3 Technical Reports1 Executive Report (glossy)
Laid out in the Salle