Embed Size (px)
Citation preview
Inductively Coupled Plasma/Optical Emission Spectrometry
Xiandeng Hou and Bradley T. Jones
inEncyclopedia of Analytical Chemistry
R.A. Meyers (Ed.)pp. 9468–9485
John Wiley & Sons Ltd, Chichester, 2000

INDUCTIVELY COUPLED PLASMA/OPTICAL EMISSION SPECTROMETRY 1
Inductively CoupledPlasma/Optical EmissionSpectrometry
Xiandeng Hou and Bradley T. JonesWake Forest University, Winston-Salem, USA
1 Introduction 1
2 Theory 22.1 Inductively Coupled Plasma
Operation 22.2 Inductively Coupled Plasma
Characteristics 3
3 Sample Introduction 33.1 Nebulizers 43.2 Hydride Generation 53.3 Electrothermal
Vaporization 63.4 Chromatographic Couplers 6
4 Torch Configuration 74.1 Radial View 74.2 Axial View 74.3 Dual View 7
5 Detection of Emission 75.1 Gratings 75.2 The Photomultiplier Tube 105.3 Array Detectors 115.4 Simultaneous Versus Sequential
Detection 12
6 Analytical Performance 126.1 Analytical Wavelength 126.2 Analytical Figures of Merit 126.3 Interferences 14
Acknowledgments 15
Abbreviations and Acronyms 15
Related Articles 15
References 16
Inductively coupled plasma/optical emission spectrometry(ICP/OES) is a powerful tool for the determinationof metals in a variety of different sample matrices.With this technique, liquid samples are injected into aradiofrequency (RF)-induced argon plasma using one ofa variety of nebulizers or sample introduction techniques.The sample mist reaching the plasma is quickly dried,
vaporized, and energized through collisional excitationat high temperature. The atomic emission emanatingfrom the plasma is viewed in either a radial or axialconfiguration, collected with a lens or mirror, and imagedonto the entrance slit of a wavelength selection device.Single element measurements can be performed cost-effectively with a simple monochromator/photomultipliertube (PMT) combination, and simultaneous multielementdeterminations are performed for up to 70 elements withthe combination of a polychromator and an array detector.The analytical performance of such systems is competitivewith most other inorganic analysis techniques, especiallywith regards to sample throughput and sensitivity.
1 INTRODUCTION
ICP/OES is one of the most powerful and popularanalytical tools for the determination of trace elementsin a myriad of sample types (Table 1). The technique isbased upon the spontaneous emission of photons fromatoms and ions that have been excited in a RF discharge.Liquid and gas samples may be injected directly intothe instrument, while solid samples require extraction oracid digestion so that the analytes will be present in asolution. The sample solution is converted to an aerosoland directed into the central channel of the plasma. Atits core the inductively coupled plasma (ICP) sustains atemperature of approximately 10 000 K, so the aerosolis quickly vaporized. Analyte elements are liberatedas free atoms in the gaseous state. Further collisionalexcitation within the plasma imparts additional energy tothe atoms, promoting them to excited states. Sufficientenergy is often available to convert the atoms to ions andsubsequently promote the ions to excited states. Boththe atomic and ionic excited state species may then relaxto the ground state via the emission of a photon. Thesephotons have characteristic energies that are determinedby the quantized energy level structure for the atoms orions. Thus the wavelength of the photons can be usedto identify the elements from which they originated. Thetotal number of photons is directly proportional to theconcentration of the originating element in the sample.
The instrumentation associated with an ICP/OESsystem is relatively simple. A portion of the photonsemitted by the ICP is collected with a lens or a concavemirror. This focusing optic forms an image of the ICP onthe entrance aperture of a wavelength selection devicesuch as a monochromator. The particular wavelengthexiting the monochromator is converted to an electricalsignal by a photodetector. The signal is amplified andprocessed by the detector electronics, then displayed andstored by a personal computer.
Encyclopedia of Analytical ChemistryR.A. Meyers (Ed.) Copyright John Wiley & Sons Ltd
2 ATOMIC SPECTROSCOPY
Table 1 Survey of elemental application areas of ICP/OES.1 – 3/
Categories Examples of samples
Agricultural and food Animal tissues, beverages, feeds, fertilizers, garlic, nutrients, pesticides, plant materials, rice flour,soils, vegetables, wheat flour
Biological and clinical Brain tissue, blood, bone, bovine liver, feces, fishes, milk powder, orchard leaves, pharmaceuticals,pollen, serum, urine
Geological Coal, minerals, fossils, fossil fuel, ore, rocks, sediments, soils, waterEnvironmental and water Brines, coal fly ash, drinking water, dust, mineral water, municipal wastewater, plating bath,
sewage sludge, slags, seawater, soilMetals Alloys, aluminum, high-purity metals, iron, precious metals, solders, steel, tinOrganic Adhesives, amino acids, antifreeze, combustion materials, cosmetics, cotton cellulose, dried wood,
dyes, elastomers, epoxy, lubricant, organometallic, organophosphates, oils, organic solvent,polymers, sugars
Other materials Acids, carbon, catalytic materials, electronics, fiber, film, packaging materials, paints and coatings,phosphates, semiconductors, superconducting materials
The characteristics of the ICP as an analytical atomicemission source are so impressive that virtually allother emission sources [such as the flame, microwave-induced plasma (MIP), direct current plasma (DCP),laser-induced plasma (LIP), and electrical discharge]have been relegated to specific, narrowly defined appli-cation niches. Indeed, even much of the application fieldoriginally assigned to atomic absorption spectrometry(AAS), using both the flame and graphite furnace atomicabsorption spectrometry (GFAAS), has been relin-quished to the ICP. Compared to these other techniques,ICP/OES enjoys a higher atomization temperature, amore inert environment, and the natural ability to pro-vide simultaneous determinations for up to 70 elements.This makes the ICP less susceptible to matrix interfer-ences, and better able to correct for them when they occur.In cases where sample volume is not limited, ICP/OESprovides detection limits as low as, or lower than itsbest competitor, GFAAS, for all but a few elements.Even for these elements, the simplicity with which theICP/OES instrument is operated often outweighs the lossin sensitivity.
2 THEORY
The ICP was developed for optical emission spectrom-etry (OES) by Fassel et al. at Iowa State University inthe US and by Greenfield et al. at Albright & Wilson,Ltd. in the UK in the mid-1960s..1,4,5/ The first commer-cially available ICP/OES instrument was introduced in1974. The ICP is now not only the most popular sourcefor OES but it is also an excellent ion source for induc-tively coupled plasma mass spectrometry (ICPMS)..6/
ICP/OES is a proven commercial success, and the futureis still bright for ICP-based spectroscopic techniques.Detectability has been continuously and dramaticallyimproved over the past 35 years. Detection limits, for
example, have improved by a factor of four to six orders ofmagnitude for many elements. Nevertheless, research andcommercial opportunities for the further development ofICP/OES remain intriguing..6/
2.1 Inductively Coupled Plasma Operation
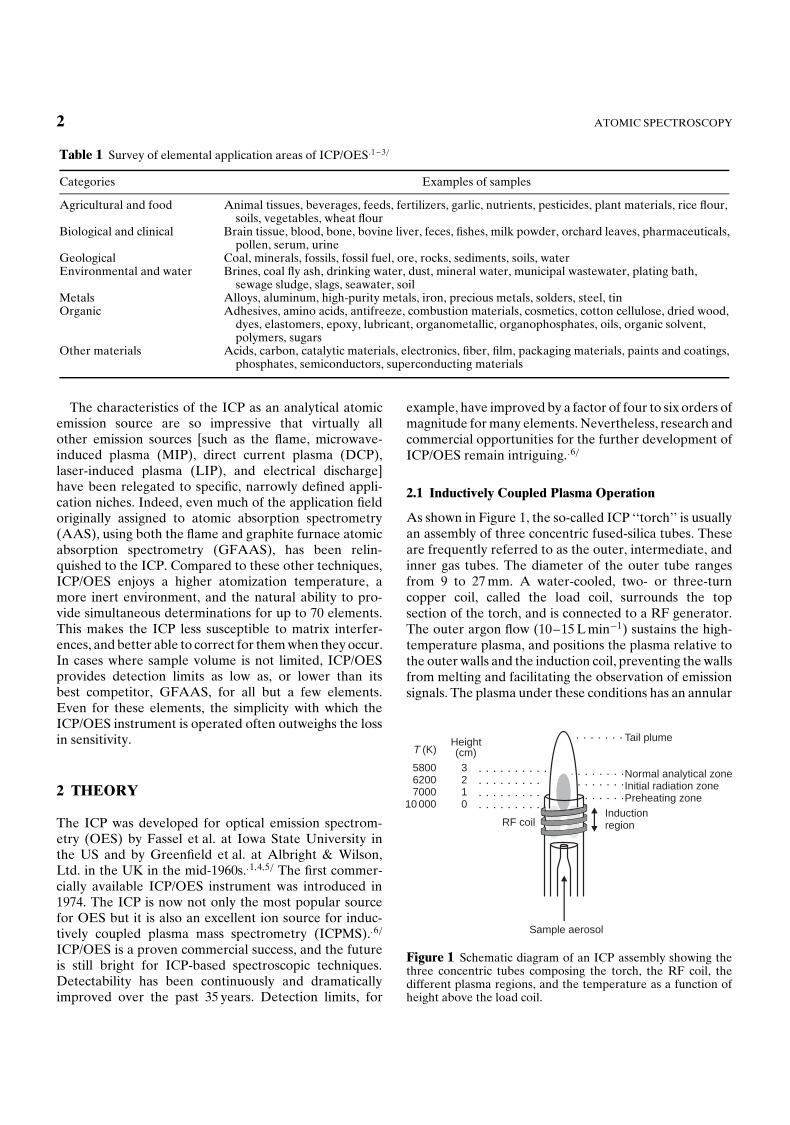
As shown in Figure 1, the so-called ICP ‘‘torch’’ is usuallyan assembly of three concentric fused-silica tubes. Theseare frequently referred to as the outer, intermediate, andinner gas tubes. The diameter of the outer tube rangesfrom 9 to 27 mm. A water-cooled, two- or three-turncopper coil, called the load coil, surrounds the topsection of the torch, and is connected to a RF generator.The outer argon flow (10–15 L min�1) sustains the high-temperature plasma, and positions the plasma relative tothe outer walls and the induction coil, preventing the wallsfrom melting and facilitating the observation of emissionsignals. The plasma under these conditions has an annular
Sample aerosol
RF coilInductionregion
Preheating zoneInitial radiation zoneNormal analytical zone
Tail plume
0123
10 000700062005800
T (K)Height(cm)
Figure 1 Schematic diagram of an ICP assembly showing thethree concentric tubes composing the torch, the RF coil, thedifferent plasma regions, and the temperature as a function ofheight above the load coil.
INDUCTIVELY COUPLED PLASMA/OPTICAL EMISSION SPECTROMETRY 3
shape. The sample aerosol carried by the inner argon flow(0.5–1.5 L min�1) enters the central channel of the plasmaand helps to sustain the shape. The intermediate argonflow (0–1.5 L min�1) is optional and has the function oflifting the plasma slightly and diluting the inner gas flowin the presence of organic solvents.
The ICP is generated as follows. RF power, typically700–1500 W, is applied to the load coil and an alternatingcurrent oscillates inside the coil at a rate correspondingto the frequency of the RF generator. For most ICP/OESinstruments, the RF generator has a frequency of either27 or 40 MHz. The oscillation of the current at this highfrequency causes the same high-frequency oscillation ofelectric and magnetic fields to be set up inside the topof the torch. With argon gas flowing through the torch, aspark from a Tesla coil is used to produce ‘‘seed’’ electronsand ions in the argon gas inside the load coil region.These ions and electrons are then accelerated by themagnetic field, and collide with other argon atoms, causingfurther ionization in a chain reaction manner. This processcontinues until a very intense, brilliant white, teardrop-shaped, high-temperature plasma is formed. Addingenergy to the plasma via RF-induced collision is known asinductive coupling, and thus the plasma is called an ICP.The ICP is sustained within the torch as long as sufficientRF energy is applied..1/ In a cruder sense, the couplingof RF power to the plasma can be visualized as positivelycharged Ar ions in the plasma gas attempting to followthe negatively charged electrons flowing in the load coilas the flow changes direction 27 million times per second.
Figure 1 shows the temperature gradient within the ICPwith respect to height above the load coil. It also givesthe nomenclature for the different zones of the plasma assuggested by Koirtyohann et al..7/ The induction region(IR) at the base of the plasma is ‘‘doughnut-shaped’’ asdescribed above, and it is the region where the inductiveenergy transfer occurs. This is also the region of highesttemperature and it is characterized by a bright continuumemission. From the IR upward towards to the tail plume,the temperature decreases.
An aerosol, or very fine mist of liquid droplets, isgenerated from a liquid sample by the use of a nebulizer.The aerosol is carried into the center of the plasma bythe argon gas flow through the IR. Upon entering theplasma, the droplets undergo three processes. The firststep is desolvation, or the removal of the solvent fromthe droplets, resulting in microscopic solid particulates,or a dry aerosol. The second step is vaporization,or the decomposition of the particles into gaseous-state molecules. The third step is atomization, or thebreaking of the gaseous molecules into atoms. Thesesteps occur predominantly in the preheating zone (PHZ).Finally, excitation and ionization of the atoms occur,followed by the emission of radiation from these excited
species. These excitation and ionization processes occurpredominantly in the initial radiation zone (IRZ), andthe normal analytical zone (NAZ) from which analyticalemission is usually collected..1/
2.2 Inductively Coupled Plasma Characteristics
The main analytical advantages of the ICP over other exci-tation sources originate from its capability for efficient andreproducible vaporization, atomization, excitation, andionization for a wide range of elements in various samplematrices. This is mainly due to the high temperature,6000–7000 K, in the observation zones of the ICP. Thistemperature is much higher than the maximum tempera-ture of flames or furnaces (3300 K). The high temperatureof the ICP also makes it capable of exciting refractoryelements, and renders it less prone to matrix interfer-ences. Other electrical-discharge-based sources, such asalternating current and direct current arcs and sparks, andthe MIP, also have high temperatures for excitation andionization, but the ICP is typically less noisy and betterable to handle liquid samples. In addition, the ICP is anelectrodeless source, so there is no contamination fromthe impurities present in an electrode material. Further-more, it is relatively easy to build an ICP assembly and itis inexpensive, compared to some other sources, such as aLIP. The following is a list of some of the most beneficialcharacteristics of the ICP source.
ž high temperature (7000–8000 K)ž high electron density (1014 –1016 cm�3)ž appreciable degree of ionization for many elementsž simultaneous multielement capability (over 70 ele-
ments including P and S)ž low background emission, and relatively low chemical
interferencež high stability leading to excellent accuracy and
precisionž excellent detection limits for most elements (0.1–
100 ng mL�1)ž wide linear dynamic range (LDR) (four to six orders
of magnitude)ž applicable to the refractory elementsž cost-effective analyses.
3 SAMPLE INTRODUCTION
A sample introduction system is used to transport asample into the central channel of the ICP as either agas, vapor, aerosol of fine droplets, or solid particles. Thegeneral requirements for an ideal sample introductionsystem include amenity to samples in all phases (solid,liquid, or gas), tolerance to complex matrices, the ability
4 ATOMIC SPECTROSCOPY
to analyze very small amount of samples (<1 mL or<50 mg), excellent stability and reproducibility, hightransport efficiency, simplicity, and low cost..2/ A widevariety of sample introduction methods have beendeveloped, such as nebulization, hydride generation(HG), electrothermal vaporization (ETV), and laserablation..1,8,9/
3.1 Nebulizers
Nebulizers are the most commonly used devices forsolution sample introduction in ICP/OES. With anebulizer, the sample liquid is converted into an aerosoland transported to the plasma. Both pneumatic and ultra-sonic nebulizers (USNs) have been successfully used inICP/OES. Pneumatic nebulizers make use of high-speedgas flows to create an aerosol, while the USN breaksliquid samples into a fine aerosol by the ultrasonic oscilla-tions of a piezoelectric crystal. The formation of aerosolby the USN is therefore independent of the gas flowrate.
Only very fine droplets (about 8 µm in diameter) inthe aerosol are suitable for injection into the plasma. Aspray chamber is placed between the nebulizer and theICP torch to remove large droplets from the aerosol andto dampen pulses that may occur during nebulization.Thermally stabilized spray chambers are sometimesadopted to decrease the amount of liquid introducedinto the plasma, thus providing stability especially whenorganic solvents are involved. Pneumatic nebulizationis very inefficient, however, because only a very smallfraction (less than 5%) of the aspirated sample solutionactually reaches the plasma. Most of the liquid is lost downthe drain in the spray chamber. However, the pneumaticnebulizer retains its popularity owing to its convenience,reasonable stability, and ease of use. Efficiency mayonly be a concern when sample volumes are limited, ormeasurements must be performed at or near the detectionlimit.
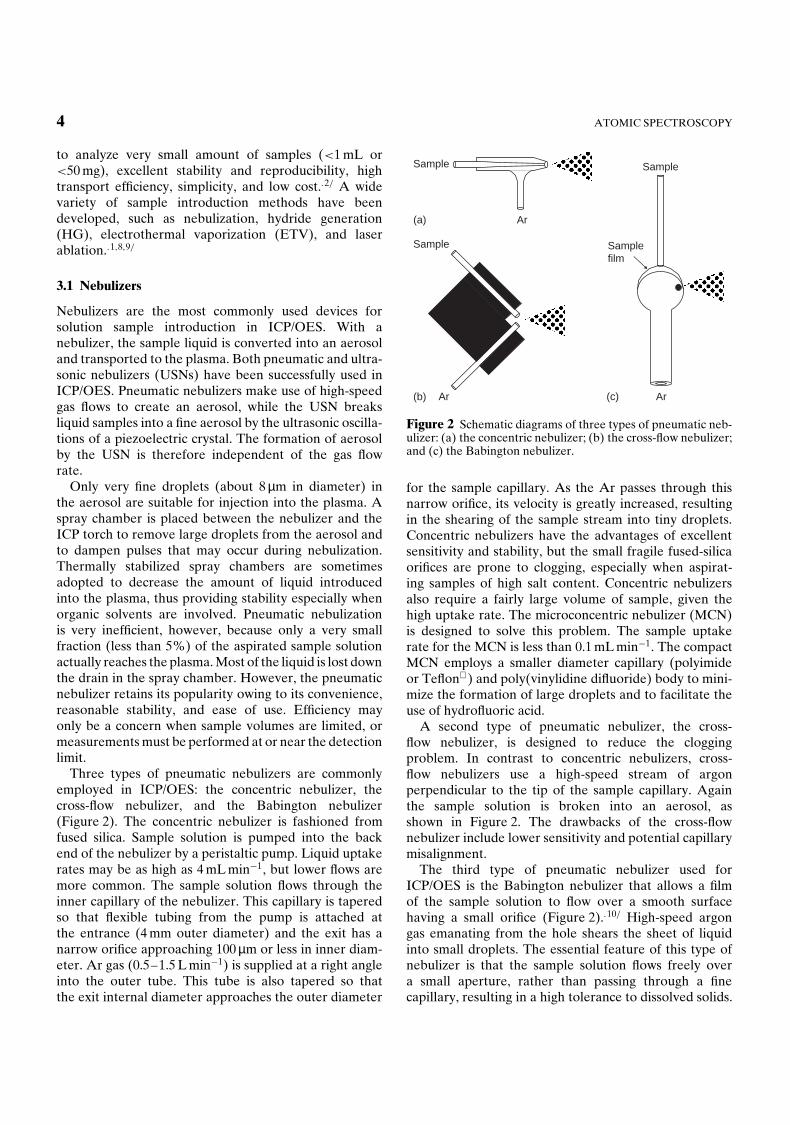
Three types of pneumatic nebulizers are commonlyemployed in ICP/OES: the concentric nebulizer, thecross-flow nebulizer, and the Babington nebulizer(Figure 2). The concentric nebulizer is fashioned fromfused silica. Sample solution is pumped into the backend of the nebulizer by a peristaltic pump. Liquid uptakerates may be as high as 4 mL min�1, but lower flows aremore common. The sample solution flows through theinner capillary of the nebulizer. This capillary is taperedso that flexible tubing from the pump is attached atthe entrance (4 mm outer diameter) and the exit has anarrow orifice approaching 100 µm or less in inner diam-eter. Ar gas (0.5–1.5 L min�1) is supplied at a right angleinto the outer tube. This tube is also tapered so thatthe exit internal diameter approaches the outer diameter
Ar
Sample
Ar
Sample
Ar
Sample
Samplefilm
(a)
(b) (c)
Figure 2 Schematic diagrams of three types of pneumatic neb-ulizer: (a) the concentric nebulizer; (b) the cross-flow nebulizer;and (c) the Babington nebulizer.
for the sample capillary. As the Ar passes through thisnarrow orifice, its velocity is greatly increased, resultingin the shearing of the sample stream into tiny droplets.Concentric nebulizers have the advantages of excellentsensitivity and stability, but the small fragile fused-silicaorifices are prone to clogging, especially when aspirat-ing samples of high salt content. Concentric nebulizersalso require a fairly large volume of sample, given thehigh uptake rate. The microconcentric nebulizer (MCN)is designed to solve this problem. The sample uptakerate for the MCN is less than 0.1 mL min�1. The compactMCN employs a smaller diameter capillary (polyimideor Teflon) and poly(vinylidine difluoride) body to mini-mize the formation of large droplets and to facilitate theuse of hydrofluoric acid.
A second type of pneumatic nebulizer, the cross-flow nebulizer, is designed to reduce the cloggingproblem. In contrast to concentric nebulizers, cross-flow nebulizers use a high-speed stream of argonperpendicular to the tip of the sample capillary. Againthe sample solution is broken into an aerosol, asshown in Figure 2. The drawbacks of the cross-flownebulizer include lower sensitivity and potential capillarymisalignment.
The third type of pneumatic nebulizer used forICP/OES is the Babington nebulizer that allows a filmof the sample solution to flow over a smooth surfacehaving a small orifice (Figure 2)..10/ High-speed argongas emanating from the hole shears the sheet of liquidinto small droplets. The essential feature of this type ofnebulizer is that the sample solution flows freely overa small aperture, rather than passing through a finecapillary, resulting in a high tolerance to dissolved solids.
INDUCTIVELY COUPLED PLASMA/OPTICAL EMISSION SPECTROMETRY 5
Ar
Samplechannel
Pt grids
CircularV-groove
Sapphirecrystal
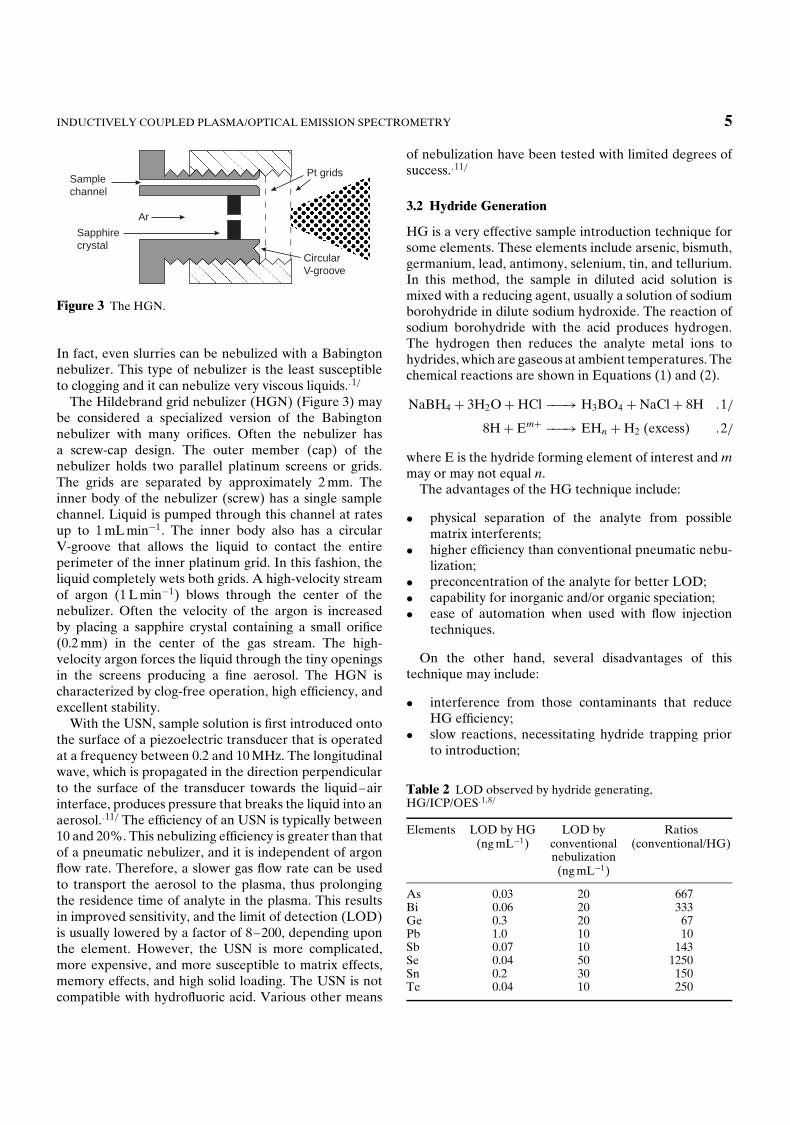
Figure 3 The HGN.
In fact, even slurries can be nebulized with a Babingtonnebulizer. This type of nebulizer is the least susceptibleto clogging and it can nebulize very viscous liquids..1/
The Hildebrand grid nebulizer (HGN) (Figure 3) maybe considered a specialized version of the Babingtonnebulizer with many orifices. Often the nebulizer hasa screw-cap design. The outer member (cap) of thenebulizer holds two parallel platinum screens or grids.The grids are separated by approximately 2 mm. Theinner body of the nebulizer (screw) has a single samplechannel. Liquid is pumped through this channel at ratesup to 1 mL min�1. The inner body also has a circularV-groove that allows the liquid to contact the entireperimeter of the inner platinum grid. In this fashion, theliquid completely wets both grids. A high-velocity streamof argon (1 L min�1) blows through the center of thenebulizer. Often the velocity of the argon is increasedby placing a sapphire crystal containing a small orifice(0.2 mm) in the center of the gas stream. The high-velocity argon forces the liquid through the tiny openingsin the screens producing a fine aerosol. The HGN ischaracterized by clog-free operation, high efficiency, andexcellent stability.
With the USN, sample solution is first introduced ontothe surface of a piezoelectric transducer that is operatedat a frequency between 0.2 and 10 MHz. The longitudinalwave, which is propagated in the direction perpendicularto the surface of the transducer towards the liquid–airinterface, produces pressure that breaks the liquid into anaerosol..11/ The efficiency of an USN is typically between10 and 20%. This nebulizing efficiency is greater than thatof a pneumatic nebulizer, and it is independent of argonflow rate. Therefore, a slower gas flow rate can be usedto transport the aerosol to the plasma, thus prolongingthe residence time of analyte in the plasma. This resultsin improved sensitivity, and the limit of detection (LOD)is usually lowered by a factor of 8–200, depending uponthe element. However, the USN is more complicated,more expensive, and more susceptible to matrix effects,memory effects, and high solid loading. The USN is notcompatible with hydrofluoric acid. Various other means
of nebulization have been tested with limited degrees ofsuccess..11/
3.2 Hydride Generation
HG is a very effective sample introduction technique forsome elements. These elements include arsenic, bismuth,germanium, lead, antimony, selenium, tin, and tellurium.In this method, the sample in diluted acid solution ismixed with a reducing agent, usually a solution of sodiumborohydride in dilute sodium hydroxide. The reaction ofsodium borohydride with the acid produces hydrogen.The hydrogen then reduces the analyte metal ions tohydrides, which are gaseous at ambient temperatures. Thechemical reactions are shown in Equations (1) and (2).
NaBH4 C 3H2OCHCl ���! H3BO4 CNaClC 8H .1/
8HC EmC ���! EHn CH2 (excess) .2/
where E is the hydride forming element of interest and mmay or may not equal n.
The advantages of the HG technique include:
ž physical separation of the analyte from possiblematrix interferents;
ž higher efficiency than conventional pneumatic nebu-lization;
ž preconcentration of the analyte for better LOD;ž capability for inorganic and/or organic speciation;ž ease of automation when used with flow injection
techniques.
On the other hand, several disadvantages of thistechnique may include:
ž interference from those contaminants that reduceHG efficiency;
ž slow reactions, necessitating hydride trapping priorto introduction;
Table 2 LOD observed by hydride generating,HG/ICP/OES.1,8/
Elements LOD by HG LOD by Ratios(ng mL�1) conventional (conventional/HG)
nebulization(ng mL�1)
As 0.03 20 667Bi 0.06 20 333Ge 0.3 20 67Pb 1.0 10 10Sb 0.07 10 143Se 0.04 50 1250Sn 0.2 30 150Te 0.04 10 250
6 ATOMIC SPECTROSCOPY
ž critical control of experimental conditions such as pHand reagent concentrations;
ž extra influential factors, such as the oxidation state ofthe analyte of interest.
LODs for the hydride generating elements are listed inTable 2, together with those observed for conventionalnebulization techniques. The LODs of HG/ICP/OESin Table 2 are the best LOD cited in Nakahara’sreview paper..8/ Compared with conventional pneumaticnebulization techniques, LODs achieved by the HGtechnique are enhanced by a factor between 10 and 1000,depending upon the element.
3.3 Electrothermal Vaporization
ETV has also been used to solve problems associatedwith pneumatic nebulization. Graphite furnaces or otherelectrothermal devices, such as carbon rods, carboncups, graphite boats, graphite tubes, tungsten wire, andother metal filaments, have been used in research lab-oratories to electrothermally vaporize a liquid or solidsample for introduction into the ICP..12/ Other vaporiza-tion methods, such as arc/spark vaporization and laserablation/vaporization, have also been used as means forsample introduction in ICP/OES. Even the ICP itself hasbeen used to vaporize samples into a second ICP for ana-lytical measurements..13/ In a typical experiment, a lowcurrent is applied to the ETV to remove the sample sol-vent. A small portion of the sample is then vaporized bythe device through the application of a high current. Anoptional ‘‘ash’’ step may be used to remove some of thematrix prior to the analyte vaporization step. The result-ing dense cloud of the analyte vapor is then efficientlyswept into the center of the plasma by a flow of argon gas.
A commercial graphite furnace designed for AAS ismost frequently used in ETV/ICP/OES. The major advan-tage of ETV as a means of sample introduction is that thetransportation efficiency is dramatically improved overa pneumatic nebulizer, from less than 5% to over 60%.Consequently, the LODs are improved by at least anorder of magnitude. Some difficult to analyze samples,those with high total dissolved solids (TDS) for example,can be introduced by the ETV. However, since thesedevices are generally not of a continuous-flow nature, theICP instrument has to be capable of recording transientsignals. Also, the simultaneous multielement capability ofthe system could be limited due to this transient nature ofsignals. Furthermore, when graphite material is used forthe ETV, carbide formation could be a problem for someelements, resulting in lowered sensitivity and memoryeffects for refractory elements.
In an attempt to eliminate the problems associatedwith graphite, metal filaments have been employed for
ETV/ICP/OES. For example, a tungsten coil from acommercial slide projector bulb can be used to vaporizeliquid samples prior to their introduction into the ICP..12/
A small volume, typically 20 µL, of sample solution isdelivered to the tungsten coil and dried at low current.Then, a higher current is applied to atomize the samplefrom the coil. The vapor is then rapidly introduced intothe plasma as a dense plug by a flow of argon/hydrogengas. The LOD is typically improved by 100–1500 timescompared with pneumatic nebulization. These LODs arecomparable to those obtained by GFAAS, but with thecapability of simultaneous multielement measurement,and at a low cost. A tungsten loop has also been usedas an in-torch vaporization (ITV) means for sampleintroduction to the ICP, and the operation can possiblybe automated..14/ These approaches still share some ofthe other disadvantages associated with graphite furnaceETV, and commercial systems have not yet appeared.
3.4 Chromatographic Couplers
The combination of the separation power of chro-matography and the detection power of atomic emissionspectroscopy results in many advantages. One of the pri-mary advantages of chromatography over conventionalsample introduction is the ability to obtain speciationinformation..15/ When used as a detector for chro-matographic methods, the ICP offers good sensitivity,wide LDR and multielement detection capability. Themultielement capability of ICP, in turn, enhances theperformance of chromatographic methods. Both gaschromatography (GC) and high-performance liquid chro-matography (HPLC) can be coupled with ICP/OES..16/
Compared with HPLC, however, the GC/ICP couplingis less common because the analytical performance ofICP/OES for nonmetals is often not adequate. Undoubt-edly, GC/ICP/OES is still useful in the analyses of volatileorganometallics, as demonstrated in the determination ofmethylmercury species..17/ The successful combination ofthese two techniques is realized through the use of chro-matographic couplers. Fortunately, most of the interfacesystems currently in use are relatively inexpensive andeasy to construct, and they require few, if any, modifica-tions to commercial ICP/OES instruments.
Direct connections between the end of the HPLCcolumn and the nebulizer suffer from poor transportefficiency and low tolerance to many of the organicsolvents commonly employed in mobile phases for HPLC,particularly when a pneumatic nebulizer is used. Toimprove the transport efficiency and to minimize theinfluence of organic solvents on the stability of the ICP,USNs, water-cooled thermospray chambers, and glass-frit nebulizers have been utilized for sample introductionin HPLC/ICP/OES. The solvent load on the plasma can
INDUCTIVELY COUPLED PLASMA/OPTICAL EMISSION SPECTROMETRY 7
also be decreased by aerosol thermostating, increasingthe incident RF power, application of a condenser, or byuse of a micro-HPLC column.
Other major sample introduction methods, such asthermospray, direct sample insertion, and laser ablation,have also been used for ICP/OES..18 – 20/ Each of thesehas its advantages and disadvantages. For example, laserablation can be used to vaporize any solid samples intothe ICP, but generally it has poor reproducibility andhigh cost.
4 TORCH CONFIGURATION
The atomic emission from the NAZ, as shown inFigure 1, is sampled for spectrometric measurements.Two configurations may be employed for observingemission from the ICP. One is referred to as a radial orside-on viewing of the plasma, and the other is known asan axial or end-on viewing of the plasma. A third viewingmode is the combination of these two basic modes, and isknown as dual view. These are all commercially available,and each of them has advantages and disadvantages.
4.1 Radial View
The radial view is the classical operation mode forICP/OES. With radial viewing, the plasma is operated ina vertical orientation, and the analytical zone is observedfrom the side of the plasma. Radial viewing constrainsthe observation volume in the NAZ, and thus limits theeffect of potential spectral and background interferences.
4.2 Axial View
With the axial view, the plasma is rotated to a horizontalposition and the NAZ of the ICP is observed fromthe end of the plasma. The axial view provides betterLODs than radial view..21/ This may be attributed tothe longer viewing path available down the axis ofthe plasma. Thus, a better sensitivity and a 5- to 10-fold improvement in the LOD can be achieved. Thedisadvantages of the axial view include the increasedpotential for spectral interference and matrix-inducedinterferences. Moreover, self-absorption effects can bequite severe because the observations are made throughthe much cooler tail plume of the plasma. These effectscan be significantly reduced by use of a shear gas..22/
The shear gas displaces the tail plume from the opticalpath, and thus reduces the self-absorption. Spectralinterferences may be either corrected or minimizedby improving spectral resolution, using an alternateanalytical line with less or no interference, or by applyingan interelement correction (IEC) factor..1/
4.3 Dual View
In cases of very complicated sample matrices having awide range of elemental concentrations, the axial viewmay be inappropriate. Recent commercial instrumentscombine the axial view and radial view configurations intoa single unit, known as dual view. This dual view systemallows the user to optimize the appropriate configurationfor the type of sample without the expense of two separateICP/OES systems..1/
5 DETECTION OF EMISSION
5.1 Gratings
ICP/OES is characterized by remarkably rich spectra. Forexample, the 70 elements most commonly determined bythe technique give rise to at least 70 000 total emissionlines in the 200–600 nm wavelength range. A consequenceof this high density of spectral information is the needfor high resolving power. The low-resolution dispersivesystems typically employed with atomic absorptionspectrometers will not suffice. Spectral interferences willoccur in this case if only a small number of elements arepresent at moderate concentrations in the sample. Muchhigher resolution is desirable in ICP/OES, with spectralbandpass (ls) 0.01 nm or lower if possible. Traditionally,this degree of resolution has been accomplished usingplane grating monochromators with large focal lengths(f D 0.5 m or more).
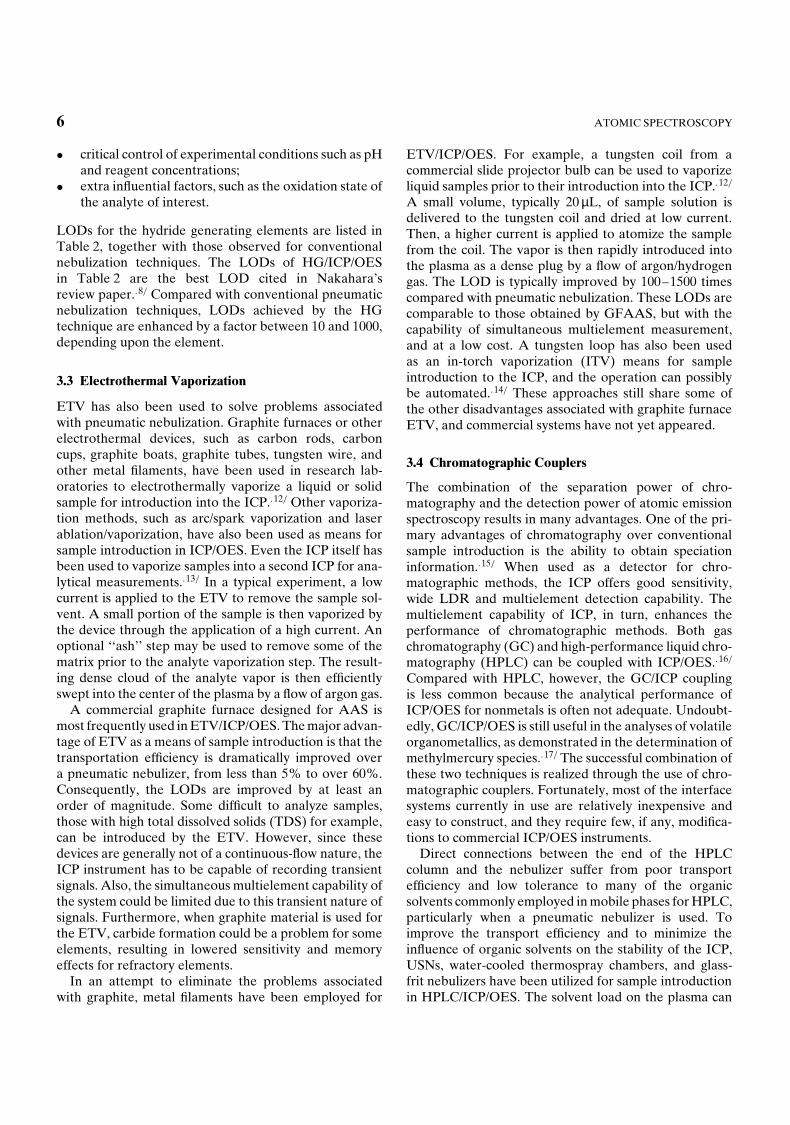
Figure 4 depicts a plane ruled grating. The normal tothe grating surface (N) is shown as a dashed line. Alight ray incident to the grating approaches at angle ameasured with respect to N. The diffracted ray leavesthe grating surface at angle b. Parallel rays striking thegrating on different adjacent groove facets will travel
αβ
d
N
Figure 4 Diagram of the plane-ruled grating. N is the normalto the grating surface, a is the angle of incidence measured withrespect to N, and b is the angle of diffraction measured withrespect to N. d is the width of a single groove.
8 ATOMIC SPECTROSCOPY
a different distance before reaching a common positionbeyond the grating. If the difference in distance traveled isa multiple of the wavelength of the light incident upon thegrating surface, then the rays will undergo constructiveinterference. Otherwise, destructive interference willoccur. Relatively simple geometrical considerations resultin the grating formula shown in Equation (3):
d.sinaC sinb/ D ml .3/
This equation shows the relationship between a, b, thegroove spacing (d), the wavelength of light (l) and theorder of diffraction (m). The order of diffraction maytake any integer value including zero. At zero order,all wavelengths undergo constructive interference at thesame diffraction angle. In the first order, one particularwavelength will undergo constructive interference at theangle b that corresponds to the specular reflection anglefor rays incident at angle a. This wavelength is called theblaze wavelength for the grating, and it is determinedby the angle at which the grooves are cut with respectto the surface of the grating. A grating is most efficientat its blaze wavelength. Typically a grating may have anefficiency as high as 70% at its blaze wavelength, so theintensity measured at the blaze wavelength will be 70%of the intensity that would be measured at the specularreflectance angle for a polished mirror of the same coatingand material as the grating.
Normally, when a plane grating is employed, the angleof incidence is nearly 0, so sina approaches 0. In this case,the grating formula may be further reduced, as shown inEquation (4):
sinb D ml
d.4/
The angular dispersion of the grating (db/dl) may befound, as shown in Equations (5) and (6), by takingthe derivative of both sides of the above equation withrespect to l:
.cosb/dbdlD m
d.5/
dbdlD m
d cosb.6/
The angular dispersion therefore increases with largerorder, smaller groove spacing, or larger b. Angulardispersion may be converted to linear dispersion alongthe exit focal plane of the monochromator by simplymultiplying by the focal length (f ) of the monochromator.The spectral bandpass (ls) in wavelength units isthen determined by dividing the slit width of themonochromator by the linear dispersion. So ls getssmaller (higher resolution) for larger f , larger order,larger b, smaller d, and smaller slit width. A typical
plane grating is operated in the first order. The groovedensity of the grating might be as high as 3600 groovesper millimeter, so the groove spacing (d) might be assmall as 0.0003 mm. Therefore, assuming b is 45° and theslit width is 25 µm, a monochromator with a focal lengthof 500 mm will provide a spectral bandpass of 0.01 nm.Such a system will effectively isolate most ICP emissionlines. Simultaneous multielement determinations arenot performed effectively with such a system however.The focal plane for this type of monochromator is5 cm long at best, so the entire spectral window willbe approximately 20 nm in width. Unless the analytesof interest exhibit emission lines within 20 nm of oneanother, the wavelength must be scanned to detectmultiple elements. So two other optical approaches havebecome more popular for simultaneous determinations:the concave grating placed on a Rowland circle, and theechelle grating coupled with a prism order-sorting device.
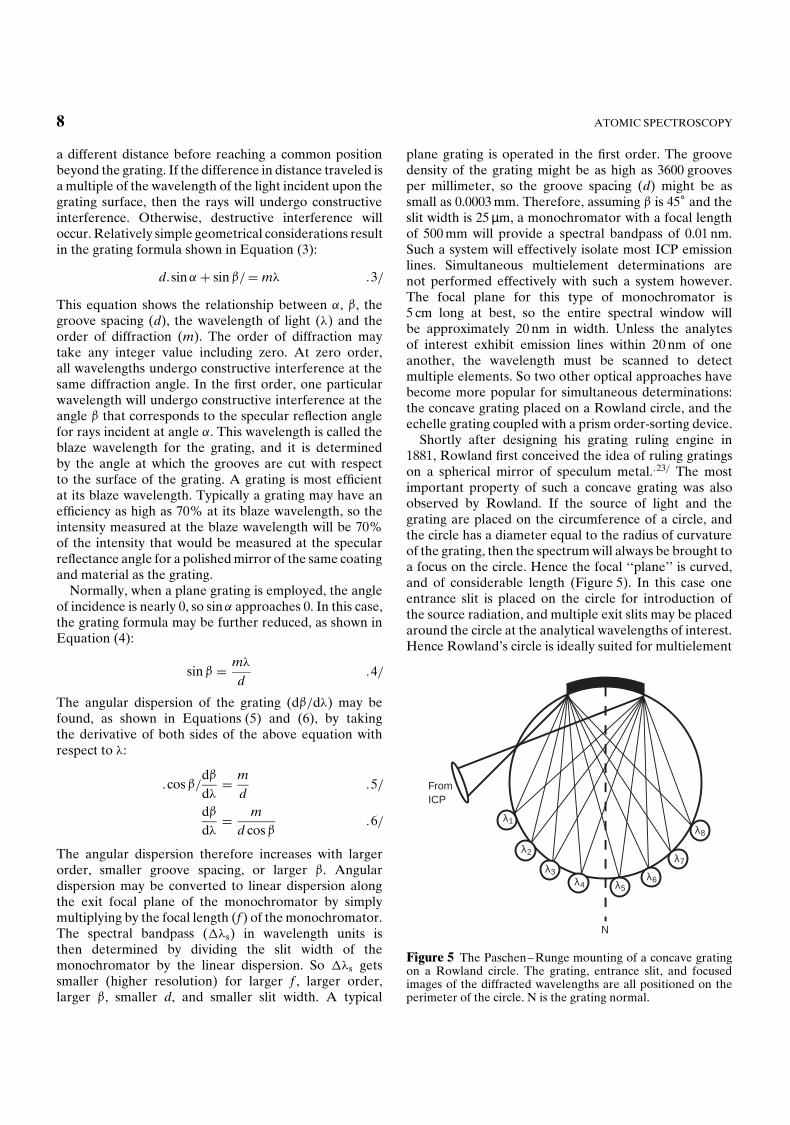
Shortly after designing his grating ruling engine in1881, Rowland first conceived the idea of ruling gratingson a spherical mirror of speculum metal..23/ The mostimportant property of such a concave grating was alsoobserved by Rowland. If the source of light and thegrating are placed on the circumference of a circle, andthe circle has a diameter equal to the radius of curvatureof the grating, then the spectrum will always be brought toa focus on the circle. Hence the focal ‘‘plane’’ is curved,and of considerable length (Figure 5). In this case oneentrance slit is placed on the circle for introduction ofthe source radiation, and multiple exit slits may be placedaround the circle at the analytical wavelengths of interest.Hence Rowland’s circle is ideally suited for multielement
N
λ2
λ3λ4 λ5
λ6
λ7
λ8
λ1
FromICP
Figure 5 The Paschen–Runge mounting of a concave gratingon a Rowland circle. The grating, entrance slit, and focusedimages of the diffracted wavelengths are all positioned on theperimeter of the circle. N is the grating normal.
INDUCTIVELY COUPLED PLASMA/OPTICAL EMISSION SPECTROMETRY 9
ICP emission spectrometry. A further advantage of theRowland geometry is the elimination of the need forany collimating or focusing lenses or mirrors. A Rowlandcircle spectrometer with same groove density, slit width,and focal length as the plane grating system describedabove will provide similar spectral bandpass but with amuch larger spectral window.
The echelle grating is a coarsely ruled grating, typicallyhaving a groove density of 70 grooves per millimeter, sod D 0.014 mm. The increase in spectral bandpass due tothe increase in d is overcome by operating the gratingin higher orders (m D 25 to 125), and by using steeperangles of diffraction (b > 45°). Figure 6 demonstrateshow the steeper side of the groove facets are used withthe echelle grating. If the steep sides of the grooves areblazed such that specular reflectance occurs when a D 60°and b D 50°, then each wavelength will exhibit a peak ingrating efficiency at a particular order as determined bythe grating formula. For example, for the 70 groovesper millimeter grating described above, the order ofmaximum efficiency (mmax) occurs as shown in Table 3.The efficiency of the grating for a given wavelength atits optimum order can be as high as 65%. This levelof efficiency is typically attained across the free spectralrange for a given order. The free spectral range (lf) isdefined as the range of wavelengths over which no overlapfrom adjacent orders occurs, and is given by Equation (7):
lf D l
mC 1.7/
As indicated in Table 3, lf is very small for large valuesof m. Obviously, then, severe spectral overlap occurswith an echelle grating. The overlap does not simply
αβ
d
N
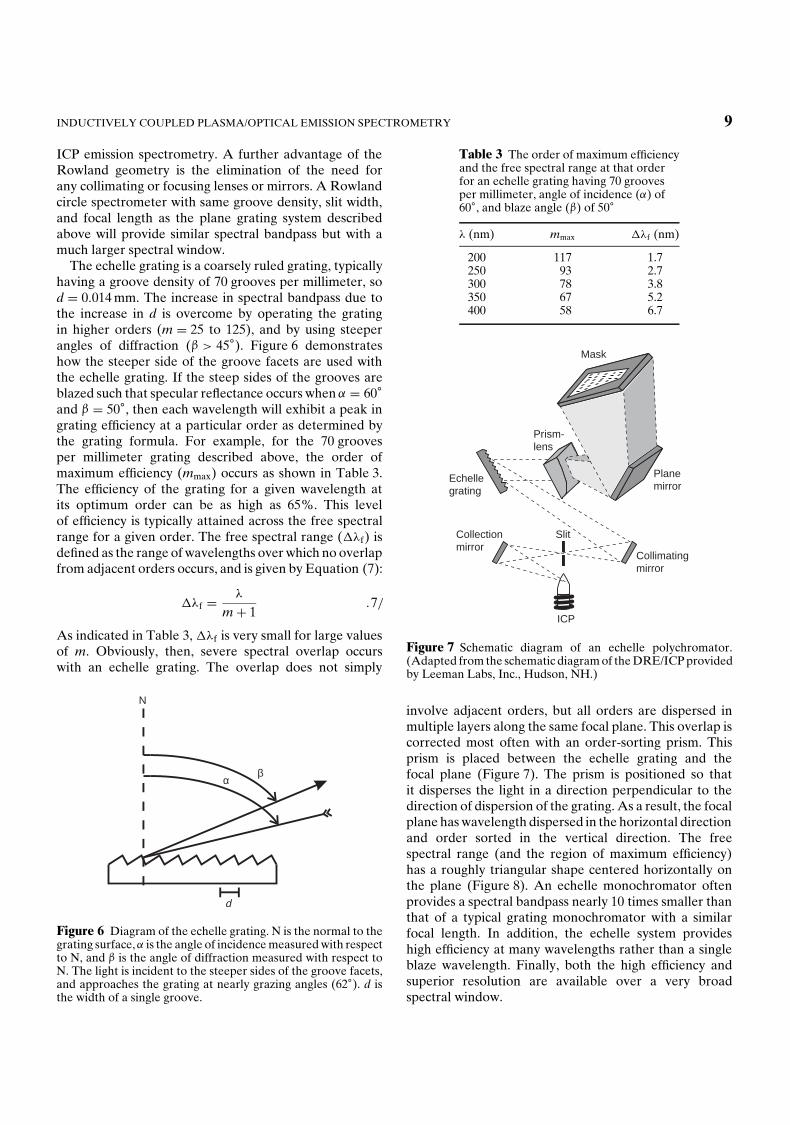
Figure 6 Diagram of the echelle grating. N is the normal to thegrating surface,a is the angle of incidence measured with respectto N, and b is the angle of diffraction measured with respect toN. The light is incident to the steeper sides of the groove facets,and approaches the grating at nearly grazing angles (62°). d isthe width of a single groove.
Table 3 The order of maximum efficiencyand the free spectral range at that orderfor an echelle grating having 70 groovesper millimeter, angle of incidence (a) of60°, and blaze angle (b) of 50°
l (nm) mmax lf (nm)
200 117 1.7250 93 2.7300 78 3.8350 67 5.2400 58 6.7
Planemirror
Collimatingmirror
ICP
Collectionmirror
Slit
Echellegrating
Prism-lens
Mask
Figure 7 Schematic diagram of an echelle polychromator.(Adapted from the schematic diagram of the DRE/ICP providedby Leeman Labs, Inc., Hudson, NH.)
involve adjacent orders, but all orders are dispersed inmultiple layers along the same focal plane. This overlap iscorrected most often with an order-sorting prism. Thisprism is placed between the echelle grating and thefocal plane (Figure 7). The prism is positioned so thatit disperses the light in a direction perpendicular to thedirection of dispersion of the grating. As a result, the focalplane has wavelength dispersed in the horizontal directionand order sorted in the vertical direction. The freespectral range (and the region of maximum efficiency)has a roughly triangular shape centered horizontally onthe plane (Figure 8). An echelle monochromator oftenprovides a spectral bandpass nearly 10 times smaller thanthat of a typical grating monochromator with a similarfocal length. In addition, the echelle system provideshigh efficiency at many wavelengths rather than a singleblaze wavelength. Finally, both the high efficiency andsuperior resolution are available over a very broadspectral window.
10 ATOMIC SPECTROSCOPY
25
35
45
55
65
75
85
95
105
115
125
Order(m)
899
642
499
409
346
300
264
237
214
195
180
λ1 (nm)λ2 (nm)
963
688
535
438
370
321
283
253
229
209
193
Free spectral range
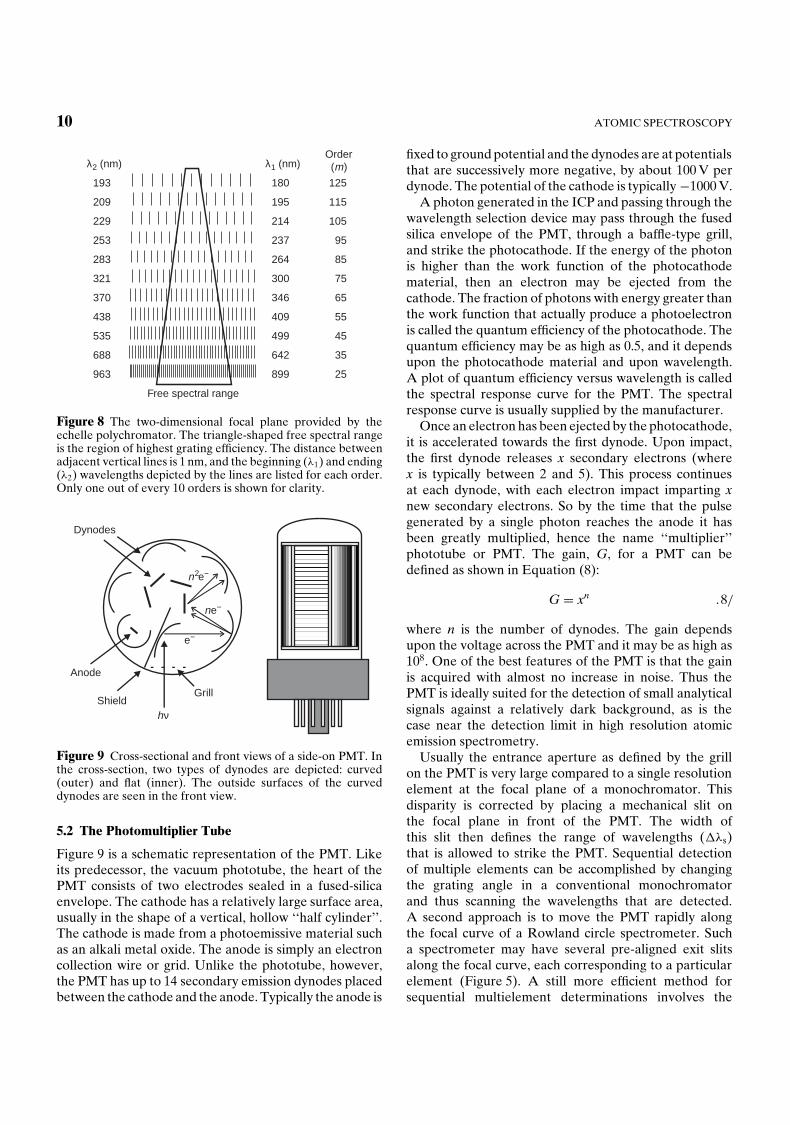
Figure 8 The two-dimensional focal plane provided by theechelle polychromator. The triangle-shaped free spectral rangeis the region of highest grating efficiency. The distance betweenadjacent vertical lines is 1 nm, and the beginning (l1) and ending(l2) wavelengths depicted by the lines are listed for each order.Only one out of every 10 orders is shown for clarity.
e−
ne−
n e−2
Dynodes
Anode
Shieldhν
Grill
Figure 9 Cross-sectional and front views of a side-on PMT. Inthe cross-section, two types of dynodes are depicted: curved(outer) and flat (inner). The outside surfaces of the curveddynodes are seen in the front view.
5.2 The Photomultiplier Tube
Figure 9 is a schematic representation of the PMT. Likeits predecessor, the vacuum phototube, the heart of thePMT consists of two electrodes sealed in a fused-silicaenvelope. The cathode has a relatively large surface area,usually in the shape of a vertical, hollow ‘‘half cylinder’’.The cathode is made from a photoemissive material suchas an alkali metal oxide. The anode is simply an electroncollection wire or grid. Unlike the phototube, however,the PMT has up to 14 secondary emission dynodes placedbetween the cathode and the anode. Typically the anode is
fixed to ground potential and the dynodes are at potentialsthat are successively more negative, by about 100 V perdynode. The potential of the cathode is typically �1000 V.
A photon generated in the ICP and passing through thewavelength selection device may pass through the fusedsilica envelope of the PMT, through a baffle-type grill,and strike the photocathode. If the energy of the photonis higher than the work function of the photocathodematerial, then an electron may be ejected from thecathode. The fraction of photons with energy greater thanthe work function that actually produce a photoelectronis called the quantum efficiency of the photocathode. Thequantum efficiency may be as high as 0.5, and it dependsupon the photocathode material and upon wavelength.A plot of quantum efficiency versus wavelength is calledthe spectral response curve for the PMT. The spectralresponse curve is usually supplied by the manufacturer.
Once an electron has been ejected by the photocathode,it is accelerated towards the first dynode. Upon impact,the first dynode releases x secondary electrons (wherex is typically between 2 and 5). This process continuesat each dynode, with each electron impact imparting xnew secondary electrons. So by the time that the pulsegenerated by a single photon reaches the anode it hasbeen greatly multiplied, hence the name ‘‘multiplier’’phototube or PMT. The gain, G, for a PMT can bedefined as shown in Equation (8):
G D xn .8/
where n is the number of dynodes. The gain dependsupon the voltage across the PMT and it may be as high as108. One of the best features of the PMT is that the gainis acquired with almost no increase in noise. Thus thePMT is ideally suited for the detection of small analyticalsignals against a relatively dark background, as is thecase near the detection limit in high resolution atomicemission spectrometry.
Usually the entrance aperture as defined by the grillon the PMT is very large compared to a single resolutionelement at the focal plane of a monochromator. Thisdisparity is corrected by placing a mechanical slit onthe focal plane in front of the PMT. The width ofthis slit then defines the range of wavelengths (ls)that is allowed to strike the PMT. Sequential detectionof multiple elements can be accomplished by changingthe grating angle in a conventional monochromatorand thus scanning the wavelengths that are detected.A second approach is to move the PMT rapidly alongthe focal curve of a Rowland circle spectrometer. Sucha spectrometer may have several pre-aligned exit slitsalong the focal curve, each corresponding to a particularelement (Figure 5). A still more efficient method forsequential multielement determinations involves the
INDUCTIVELY COUPLED PLASMA/OPTICAL EMISSION SPECTROMETRY 11
echelle polychromator (Figure 7). A mask with manyslits, each corresponding to a different element, is placedupon the two-dimensional focal plane. The PMT is heldin a mechanical arm that quickly positions the detectorat the appropriate x–y coordinates for a given element.This design allows very fast sequential determinationsby ‘‘wavelength hopping’’ or direct reading rather thanscanning linearly through all wavelengths to reach a selectfew. One commercial instrument using this design is calleda Direct Reading Echelle (DRE) ICP instrument.
Simultaneous multielement determinations may beperformed with multiple PMTs, but such designs quicklybecome limited by the size of the PMTs and thegeometry of the polychromator. Multiple PMTs may bepositioned either along the focal curve of a Rowlandcircle spectrometer or along the exit plane of an echellepolychromator. Solid-state detectors, with their relativelysmall size and their intrinsic multielement nature, areusually more effective for simultaneous determinations.
5.3 Array Detectors
Charge transfer devices (CTDs) include a broad range ofsolid-state silicon-based array detectors..24/ They includethe charge injection device (CID) and the charge-coupleddevice (CCD). The CCD has found extensive use innonspectroscopic devices such as video cameras, bar codescanners, and photocopiers. With the CTDs, photonsfalling on a silicon substrate produce electron–hole pairs.The positive electron holes migrate freely through the p-type silicon semiconductor material, while the electronsare collected and stored temporarily by an array of metaloxide semiconductor (MOS) capacitors (Figure 10). EachMOS capacitor is composed of a small metal electrodeand a thin layer of insulating SiO2 material on top of thep-type silicon substrate. A positive potential is appliedto the metal electrode, so the electrons generated in agiven region are trapped just below the insulating layer.Each MOS capacitor (or pixel) has a width in the 5-to 50-µm range, and a height that may be as large
- - - - - - - -Insulating layer(SiO2)
p-type silicon
Electrons
Metal electrodes
hν
Figure 10 Cross-sectional diagram of two adjacent pixels in aCCD detector.
as 200 µm. A two-dimensional array of pixels is easilyprepared by proper placement of the metal electrodes.Such arrays may vary in size up to 4096 pixels on an edge.The CCD differs from the CID mainly in the readoutscheme. The CCD is read out in a sequential chargeshifting manner towards the output amplifier. The CIDon the other hand may be read out in a nondestructivemanner by shifting charge between adjacent electrodes,and then shifting it back again. The CID thus benefitsfrom quick random access, even during long integrationperiods.
Spectroscopic applications of CTDs has been hamperedby the physical mismatch between the relatively smallsurface area of the detector and the large sometimes two-dimensional focal plane associated with polychromators.This mismatch may be overcome, however, and onecommercial ICP spectrometer employs a CID detectorhaving more than 250 000 pixels positioned upon anechelle focal plane.
Alternative approaches have been successful with theCCD detector. In one case, a group of several CCDarrays are arranged around a Circular Optical System(CIROS) based upon a Rowland circle design. Ratherthan monitoring discrete wavelengths as is the case withthe multiple PMT Rowland circle systems, the CIROSsystem provides total wavelength coverage from 120 to800 nm, with resolution on the order of 0.009 nm.
A second multiple CCD array detector has become verypopular commercially. This detector, called a segmentedarray charge-coupled device detector (SCD), employsover 200 small subarrays of 20–80 pixels each..24/ Thesubarrays are positioned along the two-dimensional focalplane of an echelle polychromator. The position of eachsubarray corresponds to one of the 236 most prominentICP emission lines of the most commonly determined 70ICP elements. This design allows for discrete wavelengthdeterminations as seen with the multiple PMT designs, butit also provides additional spectral information aroundthe vicinity of each emission line without exhaustivelyrecording data at all wavelengths.
Another approach to correcting the mismatch betweenconventional imaging CCD arrays and the focal planeof an echelle spectrometer, is to specifically design aCCD array to exactly match the spectrometer image..25/
This process, called image-mapping the detector, hasrecently been accomplished and is available commerciallyin the form of the VistaChip. The VistaChip consistsof a series of 70 diagonalized linear arrays (DLAs) ofpixels that are designed to exactly match the individualdiffraction orders present in the focal plane of the echellespectrometer. The 70 DLAs correspond to orders 19–88,and the length of an individual DLA is set to matchthe free spectral range for the corresponding order. Inthis fashion, continuous wavelength coverage is provided
12 ATOMIC SPECTROSCOPY
across the range 167–363 nm, and selected coverage isprovided in the range 363–784 nm where the diffractionorders are wider than the selected width of the detector(although no atomic emission lines of relevance miss thedetector). The overall dimensions of the VistaChip are 15by 19 mm, and a total of 70 908 pixels are packed insidethe 70 DLAs.
5.4 Simultaneous Versus Sequential Detection
In the final analysis, the detection system most appro-priate for an ICP emission system depends upon theapplication. In cases where only one or two elementswill be determined routinely, the traditional scanningsequential detection system may be sufficient. The highsensitivity provided by a PMT coupled with the flexibilityof interrogating any wavelength region may outweigh theneed for rapid determinations. On the other hand, if theapplication may vary between the determination of a fewelements to the determination of many, the reasonablecost and high sensitivity of the PMT-based direct readingsystems may be attractive. Finally, if a large suite of ele-ments must be determined on a routine basis, one of thearray-based detection systems might be most suitable.
6 ANALYTICAL PERFORMANCE
6.1 Analytical Wavelength
The ultraviolet and visible regions (160–800 nm) ofthe electromagnetic spectrum are most commonly usedfor analytical atomic spectrometry. In ICP/OES, thenumber of elements that can be determined is relatedto the wavelength window that can be covered byboth the collimating and the dispersive optical system.Wavelengths above 500 nm should be used when alkalimetals need to be determined, whereas wavelengthsbelow 190 nm or even below 160 nm should be usedwhen elements such as chlorine, bromine, nitrogen,arsenic must be determined. Spectral overlap mustalso be kept in mind in the selection of analyticallines. There are several criteria for selecting analyticallines. First, the wavelengths must be accessible by boththe dispersive system and the detector. Second, thewavelengths must exhibit signal levels appropriate for the
concentrations of the respective elements in the sample.Third, the wavelengths selected must be free from spectralinterferences. When this is not possible, emission lineswhose intensities can be corrected to account for spectralinterferences should be chosen. Fourth, if an internalstandard scheme is used, it may be preferable to matchthe analyte ion lines with an internal standard ion line,and analyte neutral atom lines with an internal standardneutral atom line.
6.2 Analytical Figures of Merit
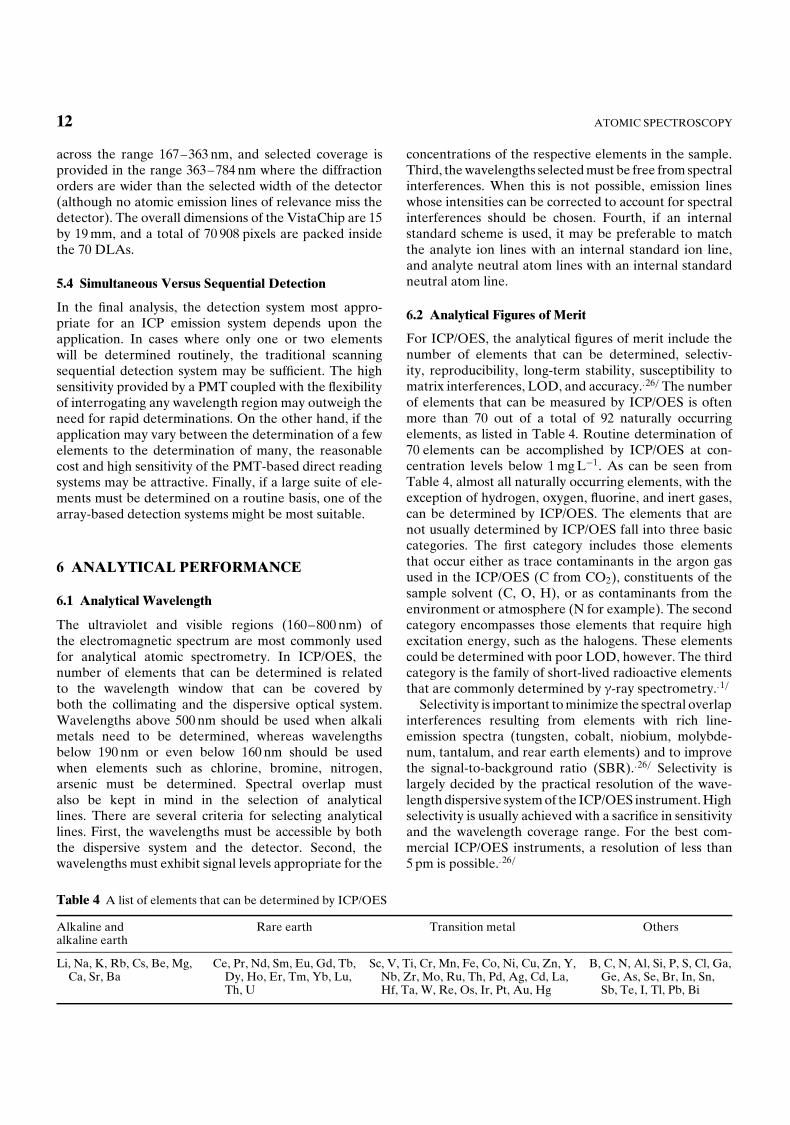
For ICP/OES, the analytical figures of merit include thenumber of elements that can be determined, selectiv-ity, reproducibility, long-term stability, susceptibility tomatrix interferences, LOD, and accuracy..26/ The numberof elements that can be measured by ICP/OES is oftenmore than 70 out of a total of 92 naturally occurringelements, as listed in Table 4. Routine determination of70 elements can be accomplished by ICP/OES at con-centration levels below 1 mg L�1. As can be seen fromTable 4, almost all naturally occurring elements, with theexception of hydrogen, oxygen, fluorine, and inert gases,can be determined by ICP/OES. The elements that arenot usually determined by ICP/OES fall into three basiccategories. The first category includes those elementsthat occur either as trace contaminants in the argon gasused in the ICP/OES (C from CO2), constituents of thesample solvent (C, O, H), or as contaminants from theenvironment or atmosphere (N for example). The secondcategory encompasses those elements that require highexcitation energy, such as the halogens. These elementscould be determined with poor LOD, however. The thirdcategory is the family of short-lived radioactive elementsthat are commonly determined by g-ray spectrometry..1/
Selectivity is important to minimize the spectral overlapinterferences resulting from elements with rich line-emission spectra (tungsten, cobalt, niobium, molybde-num, tantalum, and rear earth elements) and to improvethe signal-to-background ratio (SBR)..26/ Selectivity islargely decided by the practical resolution of the wave-length dispersive system of the ICP/OES instrument. Highselectivity is usually achieved with a sacrifice in sensitivityand the wavelength coverage range. For the best com-mercial ICP/OES instruments, a resolution of less than5 pm is possible..26/
Table 4 A list of elements that can be determined by ICP/OES
Alkaline and Rare earth Transition metal Othersalkaline earth
Li, Na, K, Rb, Cs, Be, Mg,Ca, Sr, Ba
Ce, Pr, Nd, Sm, Eu, Gd, Tb,Dy, Ho, Er, Tm, Yb, Lu,Th, U
Sc, V, Ti, Cr, Mn, Fe, Co, Ni, Cu, Zn, Y,Nb, Zr, Mo, Ru, Th, Pd, Ag, Cd, La,Hf, Ta, W, Re, Os, Ir, Pt, Au, Hg
B, C, N, Al, Si, P, S, Cl, Ga,Ge, As, Se, Br, In, Sn,Sb, Te, I, Tl, Pb, Bi
INDUCTIVELY COUPLED PLASMA/OPTICAL EMISSION SPECTROMETRY 13
The LODs of ICP/OES are generally in the nanogramper milliliter range. The LOD is usually defined as theanalyte concentration that produces an analytical signalequivalent to three times the standard deviation observedfor 16 measurements of a blank solution..27/ Anotherdefinition for the LOD of ICP/OES is related to the SBRof the analyte line at a given concentration, c, and therelative standard deviation (RSD) of the background,RSDB as shown in Equation (9):.28/
LOD D 3ð cðRSDB
SBR.9/
The LOD is determined, therefore, by the sensitivityof the measurement and the noise level, or stability, ofthe ICP/OES instrument. The high degree of stabilityof an ICP was identified when Greenfield et al..5/ firstused an ICP for analytical atomic spectrometry. Forthe best ICP/OES instruments, a long-term stability ofless than 1% RSD has been achieved..26/ The atomicemission signals from the ICP are larger than those fromother sources, such as a flame. This occurs because thehigh-temperature and inert-argon environment of the
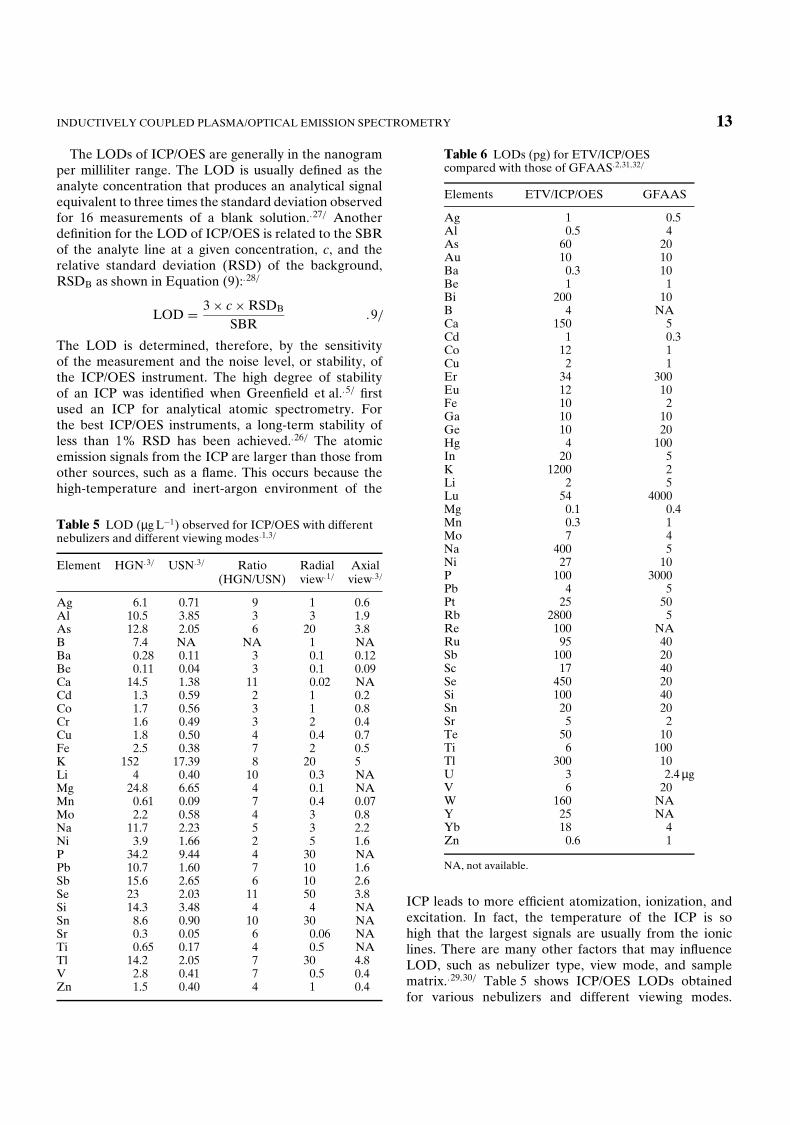
Table 5 LOD (µg L�1) observed for ICP/OES with differentnebulizers and different viewing modes.1,3/
Element HGN.3/ USN.3/ Ratio Radial Axial(HGN/USN) view.1/ view.3/
Ag 6.1 0.71 9 1 0.6Al 10.5 3.85 3 3 1.9As 12.8 2.05 6 20 3.8B 7.4 NA NA 1 NABa 0.28 0.11 3 0.1 0.12Be 0.11 0.04 3 0.1 0.09Ca 14.5 1.38 11 0.02 NACd 1.3 0.59 2 1 0.2Co 1.7 0.56 3 1 0.8Cr 1.6 0.49 3 2 0.4Cu 1.8 0.50 4 0.4 0.7Fe 2.5 0.38 7 2 0.5K 152 17.39 8 20 5Li 4 0.40 10 0.3 NAMg 24.8 6.65 4 0.1 NAMn 0.61 0.09 7 0.4 0.07Mo 2.2 0.58 4 3 0.8Na 11.7 2.23 5 3 2.2Ni 3.9 1.66 2 5 1.6P 34.2 9.44 4 30 NAPb 10.7 1.60 7 10 1.6Sb 15.6 2.65 6 10 2.6Se 23 2.03 11 50 3.8Si 14.3 3.48 4 4 NASn 8.6 0.90 10 30 NASr 0.3 0.05 6 0.06 NATi 0.65 0.17 4 0.5 NATl 14.2 2.05 7 30 4.8V 2.8 0.41 7 0.5 0.4Zn 1.5 0.40 4 1 0.4
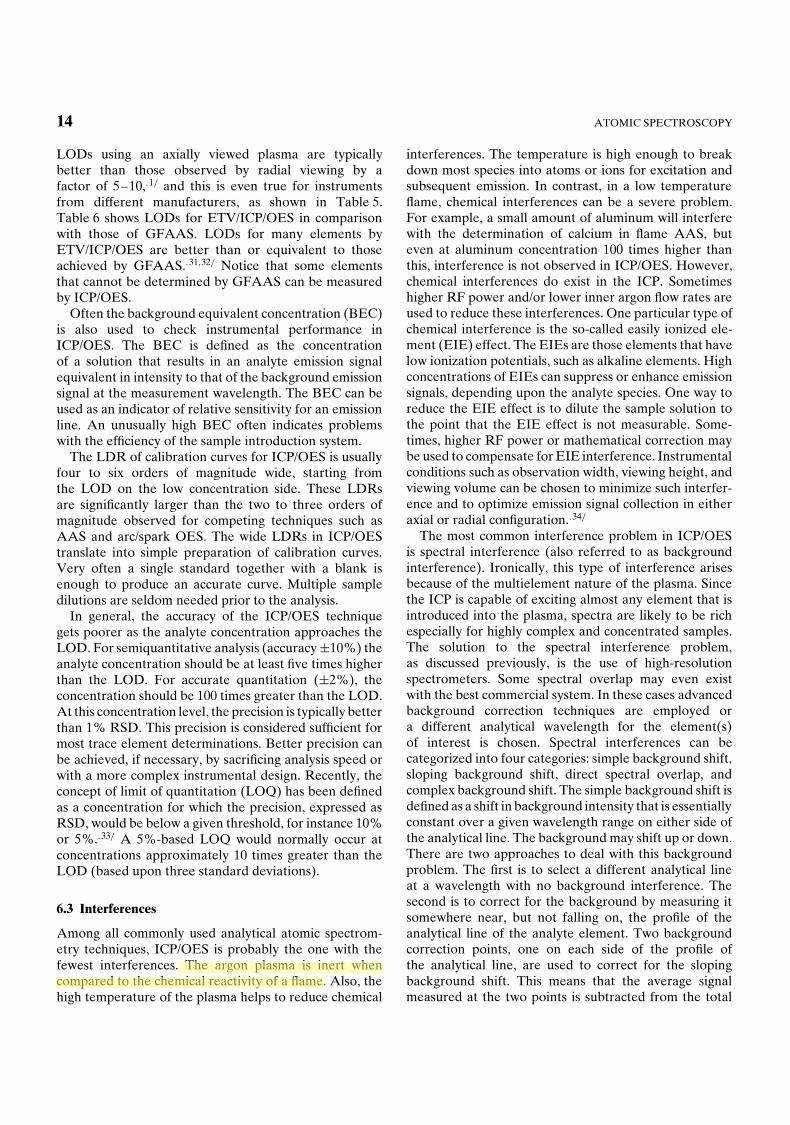
Table 6 LODs (pg) for ETV/ICP/OEScompared with those of GFAAS.2,31,32/
Elements ETV/ICP/OES GFAAS
Ag 1 0.5Al 0.5 4As 60 20Au 10 10Ba 0.3 10Be 1 1Bi 200 10B 4 NACa 150 5Cd 1 0.3Co 12 1Cu 2 1Er 34 300Eu 12 10Fe 10 2Ga 10 10Ge 10 20Hg 4 100In 20 5K 1200 2Li 2 5Lu 54 4000Mg 0.1 0.4Mn 0.3 1Mo 7 4Na 400 5Ni 27 10P 100 3000Pb 4 5Pt 25 50Rb 2800 5Re 100 NARu 95 40Sb 100 20Sc 17 40Se 450 20Si 100 40Sn 20 20Sr 5 2Te 50 10Ti 6 100Tl 300 10U 3 2.4 µgV 6 20W 160 NAY 25 NAYb 18 4Zn 0.6 1
NA, not available.
ICP leads to more efficient atomization, ionization, andexcitation. In fact, the temperature of the ICP is sohigh that the largest signals are usually from the ioniclines. There are many other factors that may influenceLOD, such as nebulizer type, view mode, and samplematrix..29,30/ Table 5 shows ICP/OES LODs obtainedfor various nebulizers and different viewing modes.
14 ATOMIC SPECTROSCOPY
LODs using an axially viewed plasma are typicallybetter than those observed by radial viewing by afactor of 5–10,.1/ and this is even true for instrumentsfrom different manufacturers, as shown in Table 5.Table 6 shows LODs for ETV/ICP/OES in comparisonwith those of GFAAS. LODs for many elements byETV/ICP/OES are better than or equivalent to thoseachieved by GFAAS..31,32/ Notice that some elementsthat cannot be determined by GFAAS can be measuredby ICP/OES.
Often the background equivalent concentration (BEC)is also used to check instrumental performance inICP/OES. The BEC is defined as the concentrationof a solution that results in an analyte emission signalequivalent in intensity to that of the background emissionsignal at the measurement wavelength. The BEC can beused as an indicator of relative sensitivity for an emissionline. An unusually high BEC often indicates problemswith the efficiency of the sample introduction system.
The LDR of calibration curves for ICP/OES is usuallyfour to six orders of magnitude wide, starting fromthe LOD on the low concentration side. These LDRsare significantly larger than the two to three orders ofmagnitude observed for competing techniques such asAAS and arc/spark OES. The wide LDRs in ICP/OEStranslate into simple preparation of calibration curves.Very often a single standard together with a blank isenough to produce an accurate curve. Multiple sampledilutions are seldom needed prior to the analysis.
In general, the accuracy of the ICP/OES techniquegets poorer as the analyte concentration approaches theLOD. For semiquantitative analysis (accuracyš10%) theanalyte concentration should be at least five times higherthan the LOD. For accurate quantitation (š2%), theconcentration should be 100 times greater than the LOD.At this concentration level, the precision is typically betterthan 1% RSD. This precision is considered sufficient formost trace element determinations. Better precision canbe achieved, if necessary, by sacrificing analysis speed orwith a more complex instrumental design. Recently, theconcept of limit of quantitation (LOQ) has been definedas a concentration for which the precision, expressed asRSD, would be below a given threshold, for instance 10%or 5%..33/ A 5%-based LOQ would normally occur atconcentrations approximately 10 times greater than theLOD (based upon three standard deviations).
6.3 Interferences
Among all commonly used analytical atomic spectrom-etry techniques, ICP/OES is probably the one with thefewest interferences. The argon plasma is inert whencompared to the chemical reactivity of a flame. Also, thehigh temperature of the plasma helps to reduce chemical
interferences. The temperature is high enough to breakdown most species into atoms or ions for excitation andsubsequent emission. In contrast, in a low temperatureflame, chemical interferences can be a severe problem.For example, a small amount of aluminum will interferewith the determination of calcium in flame AAS, buteven at aluminum concentration 100 times higher thanthis, interference is not observed in ICP/OES. However,chemical interferences do exist in the ICP. Sometimeshigher RF power and/or lower inner argon flow rates areused to reduce these interferences. One particular type ofchemical interference is the so-called easily ionized ele-ment (EIE) effect. The EIEs are those elements that havelow ionization potentials, such as alkaline elements. Highconcentrations of EIEs can suppress or enhance emissionsignals, depending upon the analyte species. One way toreduce the EIE effect is to dilute the sample solution tothe point that the EIE effect is not measurable. Some-times, higher RF power or mathematical correction maybe used to compensate for EIE interference. Instrumentalconditions such as observation width, viewing height, andviewing volume can be chosen to minimize such interfer-ence and to optimize emission signal collection in eitheraxial or radial configuration..34/
The most common interference problem in ICP/OESis spectral interference (also referred to as backgroundinterference). Ironically, this type of interference arisesbecause of the multielement nature of the plasma. Sincethe ICP is capable of exciting almost any element that isintroduced into the plasma, spectra are likely to be richespecially for highly complex and concentrated samples.The solution to the spectral interference problem,as discussed previously, is the use of high-resolutionspectrometers. Some spectral overlap may even existwith the best commercial system. In these cases advancedbackground correction techniques are employed ora different analytical wavelength for the element(s)of interest is chosen. Spectral interferences can becategorized into four categories: simple background shift,sloping background shift, direct spectral overlap, andcomplex background shift. The simple background shift isdefined as a shift in background intensity that is essentiallyconstant over a given wavelength range on either side ofthe analytical line. The background may shift up or down.There are two approaches to deal with this backgroundproblem. The first is to select a different analytical lineat a wavelength with no background interference. Thesecond is to correct for the background by measuring itsomewhere near, but not falling on, the profile of theanalytical line of the analyte element. Two backgroundcorrection points, one on each side of the profile ofthe analytical line, are used to correct for the slopingbackground shift. This means that the average signalmeasured at the two points is subtracted from the total

INDUCTIVELY COUPLED PLASMA/OPTICAL EMISSION SPECTROMETRY 15
signal measured at the analytical line. In the worst case,direct spectral overlap occurs. This can be correctedif the magnitude of the interference is known as afunction of the concentration of the interfering element.A correction factor can be calculated and used to correctthe signal measured at the analyte wavelength. This canbe best achieved by making simultaneous measurementsof both the signal at the analyte wavelength and at adifferent wavelength for the interfering element. Thismethod is referred to as the concentration ratio methodor IEC. The basic requirement is that the concentrationof the interfering element can be accurately measured atanother wavelength. With advanced detector systems, allspectral lines are present, so IEC is possible. A complexbackground shift is a shift in a background intensity thatvaries significantly on both sides of the analytical line.This is usually caused by the occurrence of a number ofintense, closely spaced emission lines nearby, and perhapsdirectly overlapping the analyte wavelength. In this case,a different analytical wavelength should be chosen ifpossible..1/
ACKNOWLEDGMENTS
The authors acknowledge that the preparation of themanuscript was partially done in Professor RobertG. Michel’s research laboratory, and are grateful foraccess to all the facilities for the writing of this article.This work was funded in part by a grant from the NationalScience Foundation GOALI program (CHE-9710218).
ABBREVIATIONS AND ACRONYMS
AAS Atomic Absorption SpectrometryBEC Background Equivalent ConcentrationCCD Charge-coupled DeviceCID Charge Injection DeviceCIROS Circular Optical SystemCTD Charge Transfer DeviceDCP Direct Current PlasmaDLA Diagonalized Linear ArrayDRE Direct Reading EchelleEIE Easily Ionized ElementETV Electrothermal VaporizationGC Gas ChromatographyGFAAS Graphite Furnace Atomic Absorption
SpectrometryHG Hydride GenerationHGN Hildebrand Grid NebulizerHPLC High-performance Liquid
Chromatography
ICP Inductively Coupled PlasmaICPMS Inductively Coupled Plasma Mass
SpectrometryICP/OES Inductively Coupled Plasma/Optical
Emission SpectrometryIEC Interelement CorrectionIR Induction RegionIRZ Initial Radiation ZoneITV In-torch VaporizationLDR Linear Dynamic RangeLIP Laser-induced PlasmaLOD Limit of DetectionLOQ Limit of QuantitationMCN Microconcentric NebulizerMIP Microwave-induced PlasmaMOS Metal Oxide SemiconductorNAZ Normal Analytical ZoneOES Optical Emission SpectrometryPHZ Preheating ZonePMT Photomultiplier TubeRF RadiofrequencyRSD Relative Standard DeviationSBR Signal-to-background RatioSCD Segmented Array Charge-coupled Device
DetectorTDS Total Dissolved SolidsUSN Ultrasonic Nebulizer
RELATED ARTICLES
Clinical Chemistry (Volume 2)Atomic Spectrometry in Clinical Chemistry
Coatings (Volume 2)Atomic Spectroscopy in Coatings Analysis
Environment: Trace Gas Monitoring (Volume 3)Laser-induced Breakdown Spectroscopy, ElementalAnalysis
Environment: Water and Waste (Volume 3)Environmental Analysis of Water and Waste: Introduc-tion ž Atomic Fluorescence in Environmental Analysisž Capillary Electrophoresis Coupled to Inductively Cou-pled Plasma-Mass Spectrometry for Elemental SpeciationAnalysis ž Flame and Graphite Furnace Atomic Absorp-tion Spectrometry in Environmental Analysis ž GasChromatography with Atomic Emission Detection inEnvironmental Analysis ž Heavy Metals Analysis inSeawater and Brines žHydride Generation Sample Intro-duction for Spectroscopic Analysis in EnvironmentalSamples ž Inductively Coupled Plasma Mass Spectrome-try in Environmental Analysis

16 ATOMIC SPECTROSCOPY
Environment: Water and Waste cont’d (Volume 4)Laser Ablation Inductively Coupled Plasma Spectrom-etry in Environmental Analysis ž Microwave-assistedTechniques for Sample Preparation in Organic Environ-mental Analysis ž Optical Emission Inductively CoupledPlasma in Environmental Analysis ž Sample Prepara-tion for Elemental Analysis of Biological Samples inthe Environment ž Sample Preparation for Environmen-tal Analysis in Solids (Soils, Sediments, and Sludges) žSample Preparation Techniques for Elemental Analy-sis in Aqueous Matrices ž Sampling Considerations forBiomonitoring
Food (Volume 5)Atomic Spectroscopy in Food Analysis
Forensic Science (Volume 5)Atomic Spectroscopy for Forensic Applications
Industrial Hygiene (Volume 6)Metals in Blood and Urine: Biological Monitoring forWorker Exposure ž Surface and Dermal Monitoring
Petroleum and Liquid Fossil Fuels Analysis (Volume 8)Metals, Nitrogen and Sulfur in Petroleum Residue,Analysis of
Steel and Related Materials (Volume 10)Atomic Absorption and Emission Spectrometry, Solu-tion-based in Iron and Steel Analysis ž Metal Analysis,Sampling and Sample Preparation in
Atomic Spectroscopy (Volume 11)Atomic Spectroscopy: Introduction
REFERENCES
1. C.B. Boss, K.J. Fredeen, Concept, Instrumentation andTechniques in Inductively Coupled Plasma Optical Emis-sion Spectrometry, 2nd edition, Perkin-Elmer, Norwalk,CT, 1997.
2. J.M. Carey, J.A. Caruso, ‘Electrothermal Vaporizationfor Sample Introduction in Plasma Source Spectrometry’,Crit. Rev. Anal. Chem., 23(5), 397–439 (1992).
3. Leeman Labs, Inc., Hudson, NH, 1999.4. R.H. Wendt, V.A. Fassel, ‘Induction-coupled Plasma
Spectrometric Excitation Source’, Anal. Chem., 37(7),920–922 (1965).
5. S. Greenfield, I.L. Jones, C.T. Berry, ‘High-pressurePlasma as Spectroscopic Emission Sources’, Analyst,89(11), 713–720 (1964).
6. V.A. Fassel, ‘Analytical Inductively Coupled PlasmaSpectroscopies – Past, Present, and Future’, Fresenius Z.Anal. Chem., 324(6), 511–518 (1986).
7. S.R. Koirtyohann, J.S. Jones, C.P. Jester, D.A. Yates,‘Use of Spatial Emission Profiles and a NomenclatureSystem as Acids in Interpreting Matrix Effects in the Low-power Argon Inductively Coupled Plasma’, Spectrochim.Acta, 36B(1), 49–59 (1981).
8. T. Nakahara, ‘Hydride Generation Techniques and TheirApplications in Inductively Coupled Plasma–AtomicEmission Spectrometry’, Spectrochim. Acta Rev., 14(1/2),95–109 (1991).
9. R.E. Russo, ‘Laser Ablation’, Appl. Spectrosc., 49(9),14A–28A (1995).
10. R.S. Babington, ‘It’s Superspray’, Popular Science, May,102–104 (1973).
11. J.G. Williams, ‘Instrument Options’, in Inductively Cou-pled Plasma Mass Spectrometry, eds. K.E. Jarvis, A.L.Gray, R.S. Houk, Blackie, New York, 58–80, 1992.
12. K. Levine, K.A. Wagner, B.T. Jones, ‘Low-cost, ModularElectrothermal Vaporization System for InductivelyCoupled Plasma Atomic Emission Spectrometry’, Appl.Spectrosc., 52(9), 1165–1171 (1998).
13. G.M. Allen, D.M. Coleman, ‘Segregated Sampling andExcitation with a Dual Inductively Coupled Plasma’,Anal. Chem., 56(14), 2981–2983 (1984).
14. V. Karanassios, K.P. Bateman, ‘Electrically Heated Wire-loop, In-torch Vaporization Sample Introduction Systemfor Inductively Coupled Plasma Atomic Emission Spec-trometry with Photodiode Array Detection’, Spectrochim.Acta, 49B(9), 847–865 (1994).
15. R. Lobinski, F.C. Adams, ‘Speciation Analysis by Gas Ch-romatography with Plasma Source Spectrometric Detec-tion’, Spectrochim. Acta, 52B(13), 1865–1903 (1997).
16. S.J. Hill, M.J. Bloxham, P.J. Worsfold, ‘ChromatographyCoupled with Inductively Coupled Plasma Atomic Emis-sion Spectrometry and Inductively Coupled Plasma MassSpectrometry’, J. Anal. At. Spectrom., 8(6), 499–515(193).
17. T. Kato, T. Uehiro, A. Yasuhara, M. Morita, ‘Determina-tion of Methylmercury Species by Capillary Column GasChromatography with Axially Viewed Inductively Cou-pled Plasma Atomic Emission Spectrometric Detection’,J. Anal. At. Spectrom., 7(2), 15–18 (1992).
18. T.S. Conver, J. Yang, J.A. Koropchak, ‘New Develop-ments in Thermospray Sample Introduction for AtomicSpectrometry’, Spectrochim. Acta, 52B(8), 1087–1104(1997).
19. V. Karanassios, G. Holick, ‘Direct Sample InsertionDevices for Inductively Coupled Plasma Spectrometry’,Spectrochim. Acta Rev., 13(2), 89–166 (1990).
20. L. Moenke-Blankenburg, ‘Laser-ICP-spectrometry’,Spectrochim. Acta Rev., 15(1), 1–38 (1993).
21. F.E. Lichte, S.R. Koirtyohann, ‘Induction CoupledPlasma Emission from a Different Angle’, Paper 26,Federation of Analytical Chemistry and SpectroscopySociety, Philadelphia, PA, 1976.
22. D.R. Demers, ‘Evaluation of the Axially Viewed (End-on) Inductively Coupled Argon Plasma Source for
INDUCTIVELY COUPLED PLASMA/OPTICAL EMISSION SPECTROMETRY 17
Atomic Emission Spectrometry’, Appl. Spectrosc., 33(6),584–591 (1979).
23. E.C.C. Bailey, Spectroscopy, Longman, Green and Co.,London, Chapter 1, 1905.
24. C.W. Earle, M.E. Baker, M. Bonner Denton, R.S.Pomeroy, ‘Imaging Applications for Chemical AnalysisUtilizing Charge Coupled Device Array Detectors’,Trends Anal. Chem., 12(10), 395–403 (1993).
25. A.T. Zander, R.L. Chien, C.B. Cooper, P.V. Wilson, ‘AnImage Mapped Detector for Simultaneous ICP-AES’,Anal. Chem., 71(16), 3332–3340 (1999).
26. J.M. Mermet, E. Poussel, ‘ICP Emission Spectrometers:1995 Analytical Figures of Merit’, Appl. Spectrosc., 49(10),12A–18A (1995).
27. G.L. Long, J.D. Winefordner, ‘Limit of Detection: ACloser Look at the IUPAC Definition’, Anal. Chem.,55(7), 712A–724A (1983).
28. P.W.J.M. Boumans, ‘Detection Limits and Spectral Inter-ferences in Atomic Emission Spectrometry’, Anal. Chem.,66(8), 459A–467A (1994).
29. M. Thompson, R.M. Barnes, ‘Analytical Performanceof Inductively Coupled Plasma–Atomic Emission
Spectrometry’, in Inductively Coupled Plasma in Analyt-ical Atomic Spectrometry, 2nd edition, eds. A. Montaser,D.W. Golightly, VCH Publishers, New York, 249–297,1992.
30. T.C. Johnson, R.S. Perry, L.J. Fick, H.B. Fannin, ‘AnExamination of Relative Trends of Atomic DetectionLimits in the Inductively Coupled Plasma’, Spectrochim.Acta, 52B(1), 125–129 (1997).
31. The Guide to Techniques and Applications for AtomicSpectroscopy, Perkin-Elmer, Norwalk, CT, 1990.
32. W. Slavin (ed.), Graphite Furnace AAS: A Source Book,Perkin-Elmer, Ridgefield, CT, 1984.
33. M. Carre, S. Excoffier, J.M. Mermet, ‘A Study of theRelation between the Limit of Detection and the Limitof Quantitation in Inductively Coupled Plasma Spec-trochemistry’, Spectrochim. Acta, 52B(14), 2043–2049(1997).
34. P.J. Galley, G.M. Hieftje, ‘Easily Ionizable Element(EIE) Interference in Inductively Coupled PlasmaAtomic Emission Spectrometry-II. Minimization of EIEEffects by Choice of Observation Volume’, Spectrochim.Acta, 49B(7), 703–724 (1994).

![[SHIMADZU] 島津製作所 · cc-ms cv-aas, cv-afs, icp-oes, icp-ms, aas pbb/pbde cr(vl) pb/cd icp-oes. icp-ms icp-oes. icp-ms, icp-oes, icp-ms, cc-ms aas cv-aas aas : aas . - icp-oes](https://img.pdfslide.net/doc/110x75/602bef1d6551697710154f3f/shimadzu-eoe-cc-ms-cv-aas-cv-afs-icp-oes-icp-ms-aas-pbbpbde-crvl.jpg)