Embed Size (px)
Citation preview
IAREG – Intangible Assets
and Regional Economic Growth Working Paper 2009/4.3c
ICT and labour productivity:
evidence for the Italian regions
Simona Iammarino*, Cecilia Jona-Lasinio**
*SPRU, University of Sussex, UK
**Italian National Institute of Statistics (ISTAT) and LUISS University, Italy.
WP4
Version July 2009
Preliminary draft, do not quote without authors’ permission
Working Paper IAREG 2009/4.3c
The research leading to these results has received funding from the
European Community's Seventh Framework Programme
(FP7/2007-2013) under grant agreement n° 216813
IAREG – Intangible Assets
and Regional Economic Growth Working Paper 2009/4.3c
2
ICT and labour productivity: evidence for the Italian regions
Simona Iammarino*, Cecilia Jona-Lasinio**
*SPRU, University of Sussex, UK
**Italian National Institute of Statistics (ISTAT) and LUISS University, Italy
ABSTRACT
The requirements of the current knowledge-based economy and the contribution of
Information and Communication Technology (ICT) to socio-economic change are likely to
have a significant impact upon regional differentials in the European Union. So far, however,
the literature on the implications of the ICT paradigm for labour productivity has almost
entirely neglected the sub-national (regional) dimension. Using experimental micro-data, this
paper firstly provides a picture of the regional and sectoral contributions to labour
productivity growth in Italy in the period 2001-05. Secondly, it explores the relationship
between ICT-producing industries and regional labour productivity in the same reference
period. In line with previous studies at the country level, our findings highlight a positive
relationship between ICT-producing industries and regional productivity; additionally, some
interesting trends emerge for what concerns the traditional North-South Italian divide.
1. Introduction
Since the mid-1990s Italy has experienced a pronounced labour productivity slowdown: the
causes of this prolonged deceleration have not yet been clearly identified (Daveri and Jona-
Lasinio, 2005). This issue, coupled with the historical geographical polarisation and the
strong territorial imbalances observed among the Italian regions, has provided the underlying
motivation of this work, which looks simultaneously at regional and national labour
productivity growth.
The pervasiveness of general purpose Information and Communication Technologies (ICTs)
and the contribution of intangible assets to socio-economic growth are among the main
underlying explanations of regional growth differentials within the European Union. Yet, it is
rather unclear whether the ICT paradigm is spurring greater socio-economic cohesion or, on
the contrary, stronger territorial polarisation of wealth. The literature on new technologies
and productivity levels and growth rates has substantially neglected the sub-national
(regional) dimension, due mainly to the lack of adequate data allowing for dynamic territorial
analyses.
In this paper we provide preliminary evidence on the relationship between ICT-producing
industries and regional labour productivity in Italy in the period 2001-2005 – a period of
particularly severe slowdown in the Italian economy – to have some insights about the
possible determinants of the disappointing Italian productivity developments. The main
research questions addressed in this work are the following: 1) What was the contribution of
individual regions and industries to the Italian labour productivity growth in the first half of
IAREG – Intangible Assets
and Regional Economic Growth Working Paper 2009/4.3c
3
the 2000s? 2) Is there a relationship between ICT-producing industries and regional labour
productivity? An ancillary question in the Italian case is obviously related to the extent to
which the traditional dualism North-South is reflected in such labour productivity trends.
The experimental micro data used in this work are gathered from the Provisional Estimate of
Value Added of Enterprises and the System of Accounts of Business Units (SABU), covering
exhaustively all Italian firms with 100 or more employees. The analysis is conducted in two
steps. The first one consists of decomposing labour productivity growth, measured at the firm
level, by region and by sector within each region in order to obtain a picture of the relative
contributions to the overall Italian productivity growth in the period considered. In the
second step we explore whether a statistical relationship is found between ICT-producing
industries and regional labour productivity. Our results indicate that, although the (rather
feeble) national productivity growth between 2001 and 2005 has been mostly driven by the
“usual suspects” – the technological regional cores in the North of the country – signs of
convergence emerge, at least for some parts of the Italian Mezzogiorno. Furthermore, in line
with most studies at the country level, ICT-producing industries overall show a strongly
positive relationship with regional labour productivity levels in the observed period,
displaying also some interesting interregional differences.
The paper is structured into six sections. The next section briefly summarises some of the
literature background on new technologies and labour productivity levels and growth, with
particular reference to its spatial dimension. Section 3 introduces the data, whilst Section 4
provides the picture obtained by decomposing the Italian labour productivity growth in the
period 2001-05 by region and by sector within each region. Section 5 firstly describes the
methodology applied to explore the relationship between ICT-producing industries and
regional labour productivity; the results from our panel of firms are then discussed. Section 6
concludes indicating the next steps in our research.
2. The background: a synopsis
Productivity is both an outcome and a crucial measure of the contribution of technological
progress to economic growth.1 Yet, the relationship between technological paradigms and
productivity has been extensively discussed, both theoretically and empirically, but only
partially understood.2 If, on the one hand, investment in innovation and technological
progress are universally acknowledged as the major determinants of productivity, economic
theories differ substantially in their respective interpretation of what technology and
knowledge are, to what extent they influence productivity levels and growth, and how such
relationships evolve over time. The copious empirical literature offers a myriad of examples
– mostly at the aggregate level of countries and industries – which however are hardly
conclusive due to the diversity of theoretical standpoints, methodologies and databases.
1 Though labour productivity and total factor productivity (TFP) differ to some extent, they are commonly used
interchangeably as measures of technological level and change (see Daveri and Silva, 2004). In this work, the
empirical investigation is carried out specifically on labour productivity levels and growth rates, as such an
indicator seems more apt to reflect economic differences among regions in the same country. 2 It is beyond the scope of this paper to provide a survey of the huge body of theoretical and empirical literature
on ICTs and productivity growth at the firm level. Some seminal references are Bresnahan and Trajtenberg
(1995), Olley and Pakes (1996), Brynjolfsson and Hitt (2003), Crespi et al. (2007).
IAREG – Intangible Assets
and Regional Economic Growth Working Paper 2009/4.3c
4
Though, conclusive evidence on the link between technological progress – and in particular
the ICT paradigm – and productivity is likely to remain a chimera as long as its determinants
become more numerous and difficult to capture. The addition of explanatory variables other
than traditional innovation input (e.g. R&D) and output (e.g. patents) indicators – such as
capabilities, organisational change, investment in intangibles, just to mention a few – do
provide an increasingly accurate picture of the relation between new technologies and
productivity, at the same time introducing further complexity and creating major challenges
for policy design. As rightly put by Bartelsman and De Groot (2004, 8-9) “a plethora of
proxies for „anything that can matter‟ has been tried”, making increasingly tricky to build an
integrated analytical framework able to provide guidelines for both empirical and policy
analysis.
The difficulties in understanding such a multifaceted link lie in the multi-level and long-term
adaptation process of industrial societies to the current technological paradigm, that is the
„information age‟ (e.g. Brynjolfsson, 1993; Jorgenson, 1995; Castells, 2000; Amendola et al.,
2005). Indeed, analogies have been made to the electrification age, or even to the industrial
revolution, in terms of magnitude of the impact and enduring gestation. The possibility of
„extended learning curves‟ implies that, for new investments in knowledge and technologies
to fully deploy their benefits, it is necessary to develop complementary and related
innovations – technical, organisational, social and institutional – which might require
exceptionally long evolutionary processes of learning and adjustment (see, for example,
Freeman and Soete, 1994; Wilson, 1995; David, 1990, 2000; Gordon, 2000; Pérez, 2002).
Another controversial point in the literature regards the distinction between ICT production
and ICT adoption and use. Although both capital-deepening effects (i.e. the accumulation of
ICT capital such as hardware, software and communication equipment) and acceleration
effects (i.e. technical change brought about by the new technological paradigm) in principle
apply to both ICT production and use and have been recognised as critical in the literature on
productivity growth, divergence exists over the relative importance of ICT production versus
ICT use (Daveri and Silva, 2004). On the one hand, some scholars have argued that
productivity gains are mostly driven by industries classified as ICT-intensive – and in
particular some business service sectors with high degrees of ICT adoption (e.g. Stiroh, 2002;
Van Ark et al., 2002). On the other hand, other experts have claimed that the bulk of the
benefits of the ICT paradigm in terms of productivity have to be ascribed to ICT productions
(e.g. Gordon, 2003; Daveri and Silva, 2004).
Indeed, the range and weight of service activities are central when looking at productivity.
Empirical studies (e.g. Guerrieri and Meliciani, 2005, Broadberry and Ghosal, 2005) show
remarkable variation in terms of productivity levels and growth between traditional and
highly regulated services (e.g. retail and wholesale trade, transports, telecommunications)
and knowledge-intensive service activities (e.g. IT services or financial and insurance
services). Some of these service industries are in fact ICT-producers (e.g. IT and software),
though at the same time intensive users of the new technologies. The ICT industry as a whole
requires comparatively wider access to specialised goods and services, which include
laboratories, university research, legal and financial services among others (Barrios et al.
2008).
Again, on this user-producer controversy there is no conclusive evidence. It may be argued
that the hypothesis of ICT-adoption-led-growth, and its emphasis on technological diffusion,
cannot be so easily disentangled from that of ICT-production-led-growth. Most likely,
IAREG – Intangible Assets
and Regional Economic Growth Working Paper 2009/4.3c
5
productivity gains are achieved by the combination of the capacity to generate new goods
and services and the capacity to transmit and diffuse new knowledge, which in turn are
contingent on highly situated social and institutional structures and their response to change.
In other words, more than mutually exclusive categories, ICT production and ICT adoption
should be seen as complementary forces influencing productivity. As shown by Daveri and
Silva (2004), productivity effects can actually differ not only between ICT-producing and
ICT-using industries, but also within each of these two industry groups. The degree of
interdependence and relatedness of knowledge, competences and capabilities in industrial
and technological structures are all critical factors underlying productivity trends, accounting
for the huge difficulties in reaching adamantine conclusions on productivity paradoxes and
illogicalities.
Yet, contextualisation seems to undoubtedly matter, even though productivity is principally
the outcome of micro-level decisions related to the choice of inputs to obtain a certain output.
The basic unit of analysis is the firm, as the main economic agent, whose behaviour and
productivity outcome is however strongly influenced by different external factors, such as
geographical location and sectoral affiliation. High firm heterogeneity in productivity levels
and growth translate, in the aggregate, into sharp and persistent differences in productivity
across countries (e.g. Ahn, 2001; Barnes at al., 2001; Bartelsman et al., 2003) and industries
(e.g. Bartelsman and Doms, 2000; Bottazzi et al., 2002), as well as across regions within the
same national borders (e.g. Cingano and Schivardi, 2004; Di Giacinto and Nuzzo, 2006;
Dettori et al., 2008).
Looking more specifically at the spatial dimension, technological gap approaches indicate
social capability and technological congruence as main underlying factors of productivity
differentials across space (see, among others, Ohkawa and Rosovsky, 1973; Abramovitz,
1986; Fagerberg, 1987, 1994; Fagerberg et al., 1994). While social capability refers to the
overall ability of the region to engage in innovative processes and in the consequent
institutional change, technological congruence points to the distance of the region from the
technological frontier or, in other words, its capacity to implement the technical properties
connected to the new technologies (Fagerberg et al., 1994). The first concept thus refers to
the path-dependent evolution of the region as a socio-economic „whole‟ or system, whilst the
second concept points mainly to the regional industrial structure and the scope for
convergence between old and new technologies (von Tunzelmann, 2009). Technological gap
models stress the ambiguous effect of two different forces, both carrying strong spatial
implications: on the one hand, the capacity to generate innovation, which tends to widen
productivity differentials; on the other, the capacity to diffuse innovation, which tends to
narrow them. Incidentally, such observations seem to point to some degree of
complementarity between production and adoption of new technologies, particularly when
looking at regional and local imbalances.
Following technological gap views, regions with a knowledge and production base more apt
to adjust to technological change tend to attract the production of those goods and services
that have higher inputs of knowledge and intangibles (for example human capital) along their
value chain. Such regions are thus those likely to experience comparatively higher levels and
growth rates of productivity, along with higher labour unit costs.3 These regions are better
equipped to exploit new opportunities, to adapt existing activities to changing business
3 On the relationship between the evolution of cost advantages – and particularly labour unit costs – technology
and productivity see for example Fagerberg (1988) and, more recently, Acemoglu and Shimer (2000).
IAREG – Intangible Assets
and Regional Economic Growth Working Paper 2009/4.3c
6
models, and to learn faster how to build cutting-edge advantages. New and non-standardised
types of goods and services are also prevalently produced, at least initially, in more
diversified and open regions, which serve as hubs and often show the required magnitude,
diversity and sophistication of both supply and demand to support the growth of new markets
(e.g. Cheshire and Carbonaro, 1995; Dunford and Smith, 2000; van Winden and van der
Meer, 2003; Duranton and Puga, 2004).
Productivity gaps among regions may thus be explained both by the local capacity to invest
in innovation and to carry out the connected organisational and institutional changes, and by
the attractiveness towards industries with a clear technological advantage, such as ICT-
producing industries (Daveri, 2004; Barrios et al., 2008). ICT firms may favour regional
locations that offer greater opportunities of developing new knowledge combinations and
applications with other industries, facilitating inter-industry resource reallocation and, at the
same time, innovation diffusion and cumulative causation mechanisms (see also Weterings
and Boschma, 2009).
In conclusion, aggregate productivity is ultimately determined by innovation and
technological progress, and its evolution affected by resource assets and allocation decisions
of micro-actors, particularly firms, whose behaviour is shaped by external environment
conditions. Relevant and persistent differences – in terms of both social capabilities and
technological congruence – among regions and industries within a national economy may be
expected to translate into differences in productivity levels and growth rates.
In what follows we carry out a first attempt to look at one side of the complex set of
relationships discussed above, i.e. the relationship between ICT-producing industries and
regional labour productivity. Before doing so we decompose labour productivity growth in
sectoral contributions to the regional performance and regional contributions to the national
one. This is deemed important in order to provide a picture of reference of the heterogeneity
of regional structures and performances within the Italian economy.
3. The data
Difficulties in measurement have been at the core of explanations for the “productivity
paradox”.4 Because information and knowledge are intangible, any increase of their content
in goods and services is likely to be underestimated compared to any increase of traditional
inputs (Brynjolfsson, 1993). Indeed, both ICT-producing and ICT-intensive industries face
serious problems in accounting for changes in quality and variety. Nonetheless, progress has
been made since the adoption, at the EU level, of the System of National Accounts (ESA95),
allowing for the ease of some of the problems faced in the estimation of intangible activities,
among which the reclassification of software as a capital good.
In regional analyses, the general problems of measuring ICT-related activities couple with
those connected to the estimation of regional aggregates. In this respect, one of the most
serious bias in territorial investigations concerns firm multilocation, as in most surveys the
variables are estimated assuming that the firm is located in only one (headquarters) region,
thus rendering impossible to control for multilocated (and multisectoral) firms. In what
4 This refers to the famous claim by Nobel laureate Robert Solow: “we see computers everywhere except in the
productivity statistics”.
IAREG – Intangible Assets
and Regional Economic Growth Working Paper 2009/4.3c
7
follows, this limitation is overcome, as aggregates on production activities are allocated to
the region where the unit carrying out the relevant transactions (local kind-of-activity unit,
i.e. KAU) is resident (Eurostat, 1996).
The data used in this work come from the Provisional Estimate of Value Added of
Enterprises and the System of Accounts of Business Units (SABU), covering the whole
population of Italian firms with 100 or more employees and providing the possibility for
dynamic analyses. The Italian National Institute of Statistics (ISTAT) is among the few
European statistical offices that release information about ICT capital goods at both sectoral
and geographical level. In order to identify ICT firms at the regional level, micro data
classified by economic activity (ATECO91, based on NACE Rev.1) are employed,5 allowing
for a detailed sectoral analysis, where production processes can be considered less
heterogeneous and thus productivity changes may be more representative of underlying
technological change. In accordance with the OECD definition (OECD, 2000) – compatible
with ATECO91 – ICT-producing industries comprise three sectors: hardware, software and
communication equipment.
The analysis is carried out with reference to the period 2001-2005 and the sub-national
breakdown refers to the NUTS 2 level, corresponding to the 20 Italian administrative regions
(see Appendix A.1). The variables covered in the dataset are the following: value added,
investment, employment, employment class, sectoral code, regional code, multiregional
code, labour costs. The number of firms included in the panel is 7,200 firms, representing the
universe of Italian firms above 99 employees.
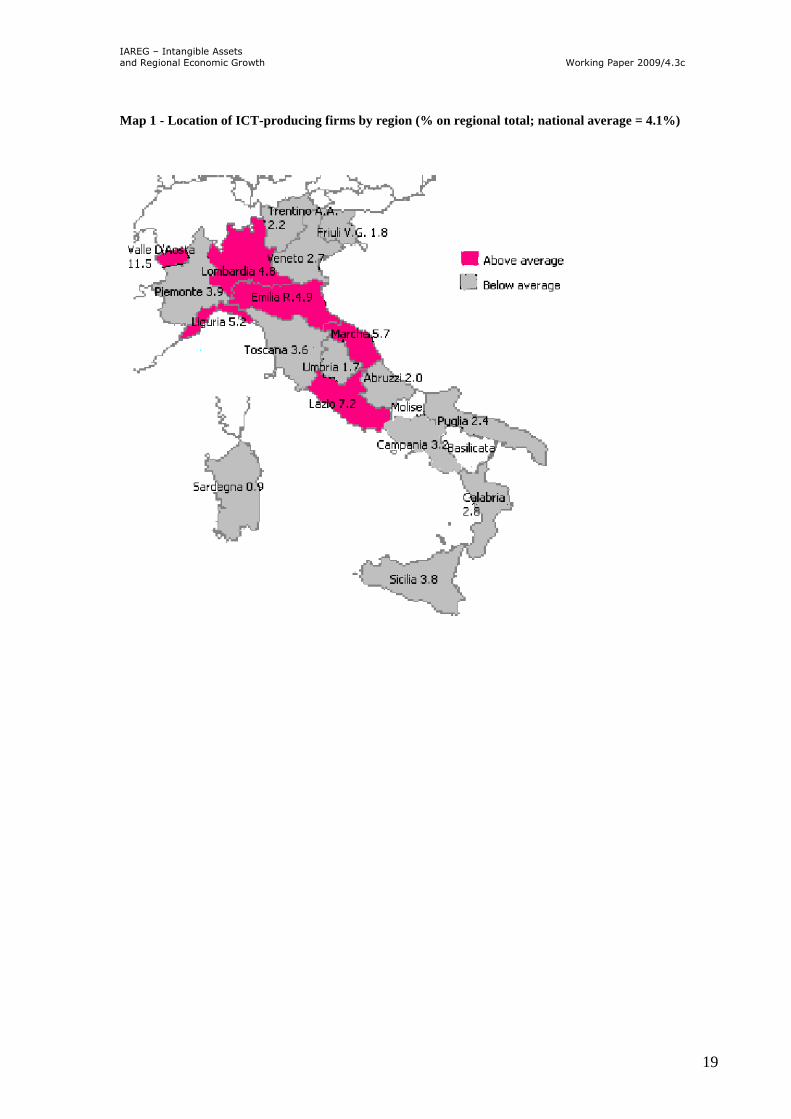
In line with the discussion in Section 2 above, the contribution of ICT-producing industries is
likely to be greater the higher their relative weight in the regional economy. Map 1 provides
an overview of the location of ICT-producing firms expressed in terms of their percentage
share on the total number of firms by region in the period 2001-2005.
[Map 1 about here]
The following Section 4 illustrates the exercise of decomposing the Italian labour
productivity growth by region and by sector within each region.
4. Decomposing labour productivity growth: regional and sectoral contributions
4.1. The decomposition method
The analysis of the contribution of Italian regions to national productivity growth is done by
means of the aggregate productivity decomposition approach firstly devised by Oulton
(1998), and subsequently applied to different units of analysis (i.e. firms, industries,
countries) by Baily et al. (1996), OECD (2001, 2003), Bartelsman and De Groot (2004),
Gozzi et al. (2005).6 In our case here we apply such a decomposition approach to subnational
units of analysis, i.e. the Italian 20 regions. We look both at regional contributions to national
productivity growth and at sectoral contributions to each region‟s productivity growth.
5 The economic activity classification (ATECO 91) follows the Nace Rev.1 up to the fourth digit level, while
the fifth level, which is used in the present analysis, is a further breakdown of the fourth. 6 For a slightly different approach to the decomposition of labour productivity growth in the case of the Dutch
regions see Oosterhaven and Broersma (2007).
IAREG – Intangible Assets
and Regional Economic Growth Working Paper 2009/4.3c
8
Aggregate productivity growth can be decomposed into the contribution of each region
taking into account three different effects: within-region, level reallocation and growth
reallocation. The effect on the aggregate productivity growth within each particular region
depends in turn on the relative size of sectors making up the regional industrial structure.
Thus, regional productivity is decomposed into the contribution of industrial sectors, i.e.
looking at the same three components within-sector, level and growth reallocation.7
Throughout this paper, our measure of labour productivity8 for each firm i at time t is as
follows:
it
itit
EMP
VALP i = 1, 2,..., 7200
Labour productivity of each sector j in each region k is given by:9
jkt
jkt
jktEMP
VALP j = 1, 2,…..n k = 1, 2,….., 21 t = 0,…T
Thus, the aggregate regional productivity is:
jkt
j
jkt
j
ktEMP
VA
LP
As stated above, the contribution of each sector to the aggregate regional productivity growth
depends on the relative size of that sector within the region, which is measured in terms of
employment share. Thus, in each region k, the size of each sector is:
j
tjtjt EMPEMPw / where 1 jtw
The proportional growth of labour productivity in sector j between time 0 and T in each
region k is given by:
00000 // jjjjTjTjjjT LPLPwLPwLPLPLP
This can be decomposed in the three different effects highlighted above:
7 This is the same method applied by Gozzi et al. (2005), which differs slightly in the third term of the
decomposition from that of Baily et al. (1996), without however affecting the total sum of the three effects (see
Gozzi et al., 2005, 17). 8 For the advantages (and disadvantages) of using labour productivity computed on value added see Gozzi et al.
(2005). 9 The regions here considered are 21, instead of 20, because the two autonomous provinces (Trento and
Bolzano) that constitute the region of Trentino Alto-Adige are reported separately.
IAREG – Intangible Assets
and Regional Economic Growth Working Paper 2009/4.3c
9
0
000
0
000
0
00
00 /
k
kkTjjTjjT
k
kjjjT
k
jjTj
jjjT
LP
LPLPLPLPww
LP
LPLPww
LP
LPLPwLPLPLP
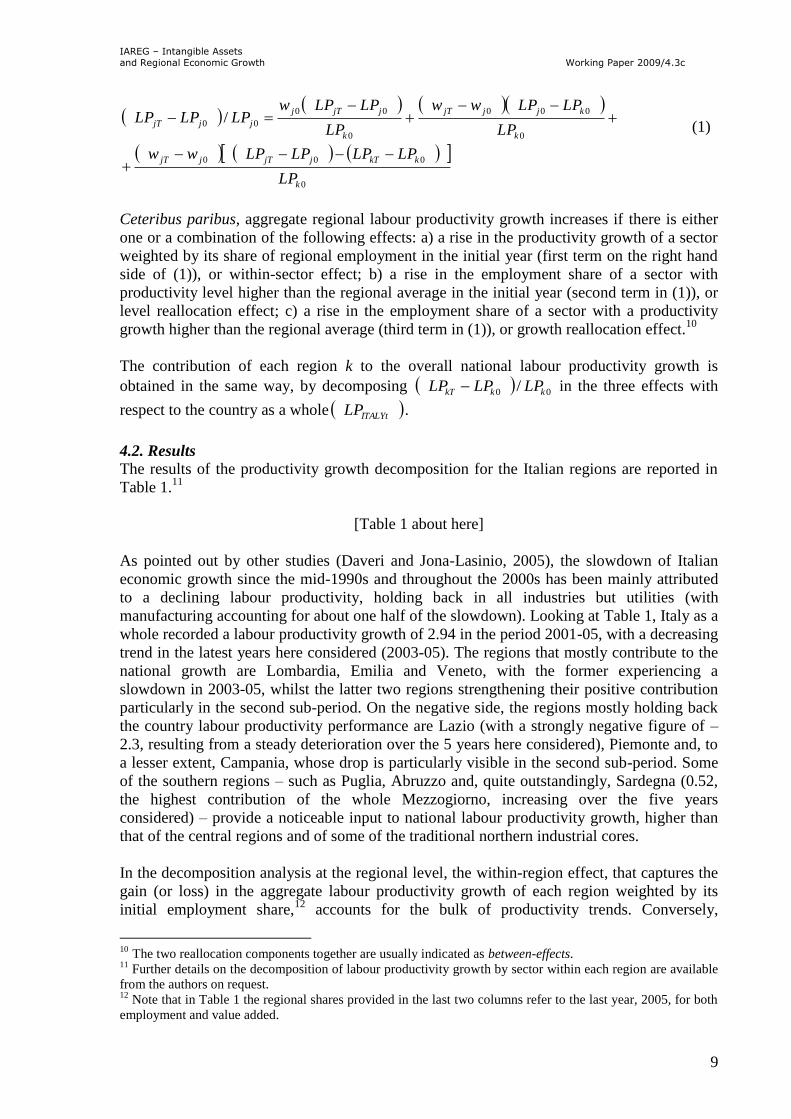
Ceteribus paribus, aggregate regional labour productivity growth increases if there is either
one or a combination of the following effects: a) a rise in the productivity growth of a sector
weighted by its share of regional employment in the initial year (first term on the right hand
side of (1)), or within-sector effect; b) a rise in the employment share of a sector with
productivity level higher than the regional average in the initial year (second term in (1)), or
level reallocation effect; c) a rise in the employment share of a sector with a productivity
growth higher than the regional average (third term in (1)), or growth reallocation effect.10
The contribution of each region k to the overall national labour productivity growth is
obtained in the same way, by decomposing 00 / kkkT LPLPLP in the three effects with
respect to the country as a whole ITALYtLP .
4.2. Results
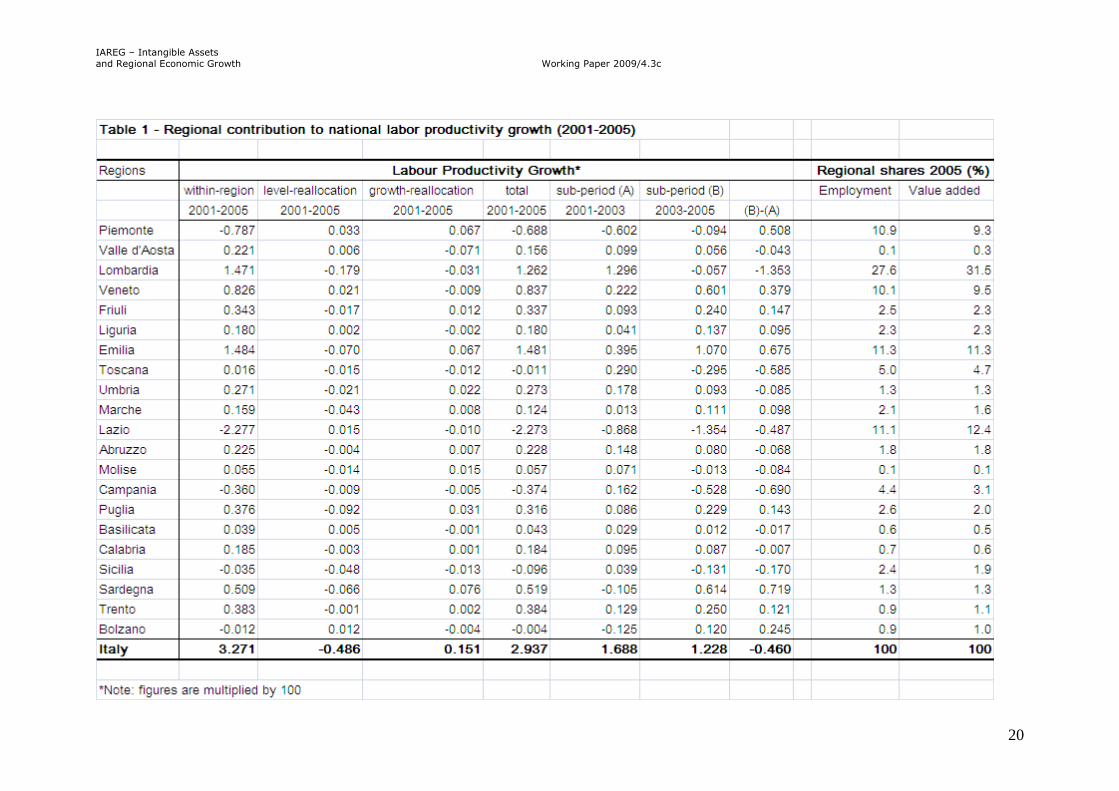
The results of the productivity growth decomposition for the Italian regions are reported in
Table 1.11
[Table 1 about here]
As pointed out by other studies (Daveri and Jona-Lasinio, 2005), the slowdown of Italian
economic growth since the mid-1990s and throughout the 2000s has been mainly attributed
to a declining labour productivity, holding back in all industries but utilities (with
manufacturing accounting for about one half of the slowdown). Looking at Table 1, Italy as a
whole recorded a labour productivity growth of 2.94 in the period 2001-05, with a decreasing
trend in the latest years here considered (2003-05). The regions that mostly contribute to the
national growth are Lombardia, Emilia and Veneto, with the former experiencing a
slowdown in 2003-05, whilst the latter two regions strengthening their positive contribution
particularly in the second sub-period. On the negative side, the regions mostly holding back
the country labour productivity performance are Lazio (with a strongly negative figure of –
2.3, resulting from a steady deterioration over the 5 years here considered), Piemonte and, to
a lesser extent, Campania, whose drop is particularly visible in the second sub-period. Some
of the southern regions – such as Puglia, Abruzzo and, quite outstandingly, Sardegna (0.52,
the highest contribution of the whole Mezzogiorno, increasing over the five years
considered) – provide a noticeable input to national labour productivity growth, higher than
that of the central regions and of some of the traditional northern industrial cores.
In the decomposition analysis at the regional level, the within-region effect, that captures the
gain (or loss) in the aggregate labour productivity growth of each region weighted by its
initial employment share,12
accounts for the bulk of productivity trends. Conversely,
10 The two reallocation components together are usually indicated as between-effects. 11
Further details on the decomposition of labour productivity growth by sector within each region are available
from the authors on request. 12
Note that in Table 1 the regional shares provided in the last two columns refer to the last year, 2005, for both
employment and value added.
(1)
IAREG – Intangible Assets
and Regional Economic Growth Working Paper 2009/4.3c
10
reallocation effects are rather week, overall displaying a small negative level reallocation and
a negligible positive growth reallocation. As stated above, reallocation (or between-regions)
effects grasp the gain (or loss) in aggregate labour productivity stemming from a rise (or fall)
in the employment share of a region with productivity levels/growth rates higher (lower) than
the national average. This seems to indicate that, in the period considered, there was no
substantial shift of employment away from higher productivity/faster growing regions to
other less productive areas.
Turning to the decomposition by sector within each region, it is interesting to report a few
observations for those regions that register the strongest (either positive or negative)
productivity variation over the five years. The highest contribution to Lombardia‟s labour
productivity growth comes from Other services (2.5), Metals (0.9) and Electrics (0.6), all
showing a strongly positive within-sector effect, with only the former industry experiencing a
small negative level reallocation effect.13
Noteworthy, the contribution of the ICT-producing
industry is positive for all three sectors, particularly for software and telecommunication (0.4
in both). In Veneto, the two most dynamic sectors in terms of labour productivity growth are
Other manufacturing (4.4) and Wholesale and retailing trade (3.1), both registering a high
within-sector effect, accompanied by relatively pronounced positive between-sector effects:
in this region, therefore, some shift of employment to above-average productivity industries
occurred over the period considered. In Emilia, remarkable within-sector effects characterise
the positive contribution of Other manufacturing (4.0), Metals (3.5) and Wholesale and
retailing trade (3.2): the ICT sector as a whole, and software in particular, also provide a
positive contribution to the regional labour productivity performance.
The negative productivity growth recorded in Piemonte – not surprisingly given the crisis of
FIAT during the period considered – is almost entirely attributable to Means of transport (-
12.5), showing an exceptionally negative within-sector effect, yet accompanied by overall
positive (though small) between-sectors effects. Lazio‟s drastic and persistent fall in
productivity is concentrated in Wholesale and retailing trade (-19.1) and it is entirely of a
within-type, whilst Campania follows Piemonte‟s fate in the sharp decline of labour
productivity in Means of transport (-13.5), with similar (though higher) between-sector
effects. Interestingly, in all these low-performing regions, the role of ICT, and particularly
software, is anyway substantial and positive.
This first description of Italian labour productivity growth across regions and sectors within
regions sheds light on two main facts. First, the (weak) growth of Italian labour productivity
in the first half of the 2000s, although regionally polarised in some of the strongest regional
innovation systems such as Lombardia, Emilia and Veneto, does not reflect a sharp North-
South gap. Rather, the fall of some traditional industrial cores such as Piemonte, is
counterbalanced by a small but positive contribution of most southern regions. The bulk of
the total national growth over the period 2001-05 is due to the within-region type of effect.
Secondly, the sectoral decomposition analysis within each region indicates some differences
in the importance of within and between effects across industries, signalling that some
reallocation components are at work. As also noted by Daveri and Jona-Lasinio (2005), this
evidence seems to be somehow at odds with the common assumption of the rigidity of the
Italian labour markets, and should be investigated further by taking into account specificities
in regional factor markets.
13
The reallocation here is exclusively the shift of employment between sectors. By construction, the within-
industry reallocation between firms – clearly the most sizable inter-firm labour flow - is not considered here
(see Bartelsman et al. (2002) on between-firm reallocation).
IAREG – Intangible Assets
and Regional Economic Growth Working Paper 2009/4.3c
11
5. ICT and regional productivity in Italy: statistical evidence
In this section we firstly describe the conceptual framework and the empirical strategy
underlying our analysis, and then present our main results on the relation between ICT-
producing industries and regional labour productivity in Italy.
5.1 The production function framework
The firm‟s production function framework is here taken as a benchmark. Empirical research
in the last fifteen years or so has made it clear that there is no such a thing as a
“representative firm” in any given industry. As discussed in Section 2 above, industries and
regions are made up of very heterogeneous individual firms, showing large and persisting
differences in productivity performance. Moreover, large-scale reallocation of outputs and
inputs between producers occurs over time, also and perhaps mostly within industries, and
such a reallocation from less productive to more productive businesses has been shown to
contribute significantly to aggregate productivity growth in a variety of OECD countries.
Furthermore, most of the literature on ICT and productivity concludes that disaggregated
data are needed to tie productivity performance to business practices (e.g. Greenspan, 2000;
Stiroh, 2002). These considerations underlie the choice to implement our analysis firstly at
the firm level and then replicating it at a more aggregate level by fitting the productivity
model (eq. 2) to observations on the average productivity for each region.14
For notational
convenience, we embody in our specification the assumption of constant returns to scale (see
Daveri and Jona-Lasinio, 2008).
We consider a value added production function, instead of an output-based one. The full-
fledged production function underlying equation (2) would have (real) output on the left–
hand side and capital, labour, intermediate materials and services on the right-hand side. Yet
this more complete formulation would be subject to a well known empirical specification
problem, i.e. the endogeneity of input demands. Namely, the optimal quantity of inputs
demanded by the firm depends on the unobserved Solow residual that features as the error
term in the output equation, thereby inducing a correlation between the error term and the
explanatory variables of the regression. Yet, under the assumption of separability between
the value added and the intermediates functions, the dependent variable may be (real) value
added, that is real output minus (real) materials and services. This does not eliminate the
endogenous input choice problem (capital and labour are still on the right-hand side), but
makes it easier to handle. Subject to these preliminary remarks, in each period t, the constant
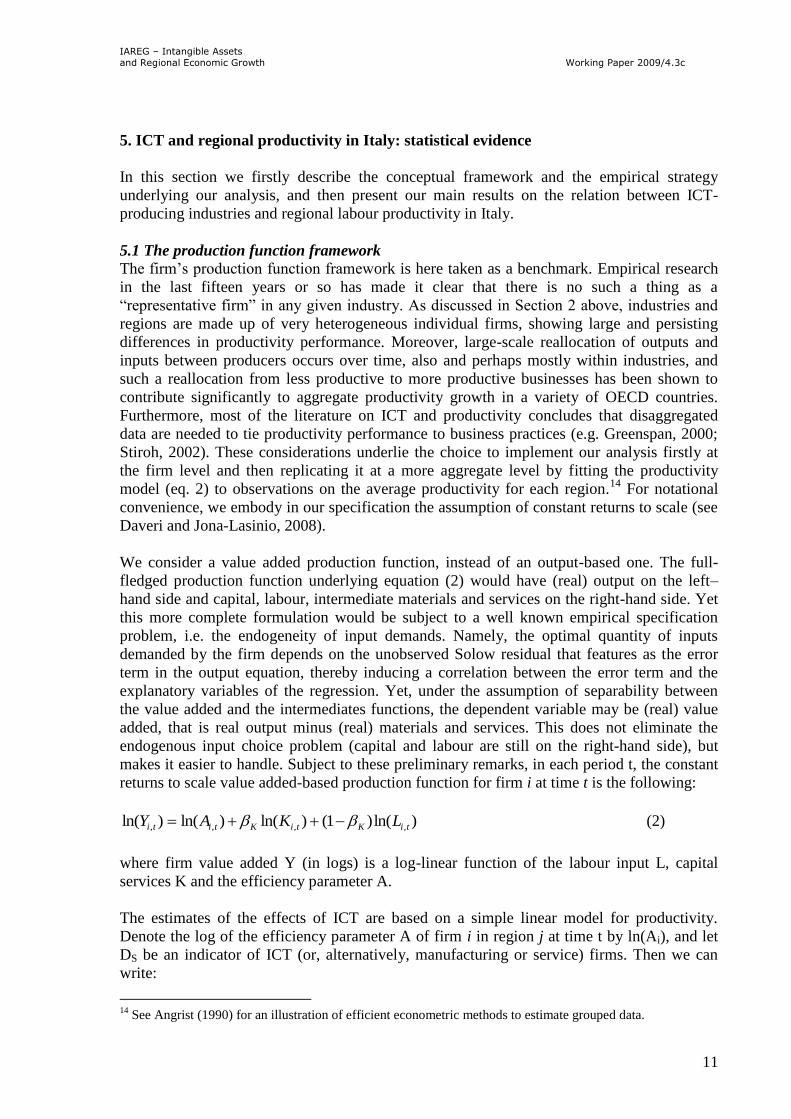
returns to scale value added-based production function for firm i at time t is the following:
)ln()1()ln()ln()ln( ,,,, tiKtiKtiti LKAY (2)
where firm value added Y (in logs) is a log-linear function of the labour input L, capital
services K and the efficiency parameter A.
The estimates of the effects of ICT are based on a simple linear model for productivity.
Denote the log of the efficiency parameter A of firm i in region j at time t by ln(Ai), and let
DS be an indicator of ICT (or, alternatively, manufacturing or service) firms. Then we can
write:
14
See Angrist (1990) for an illustration of efficient econometric methods to estimate grouped data.
IAREG – Intangible Assets
and Regional Economic Growth Working Paper 2009/4.3c
12
uD ittssiAiA ,)ln( (3)
where iA, is a firm effect, the coefficient s is the effect of ICT (manufacturing, services)
on labour productivity, DS identifies ICT (or, respectively, manufacturing and services), t is
a period effect common to all firms and uit is a residual.
5.2 Empirical strategy
In our empirical analysis we exploit a balanced panel for the Italian large firms over the
period 2001-2005. As explained in Section 3 above, our database covers 7200 firms with
more than 99 employees classified by industry and by region, so that we are able to identify
and to localise ICT-producing firms.
To evaluate the relationship between ICT production and productivity we relate labour
productivity to per-capita investment (taken as a proxy for capital stock at the firm level) and
to our main variables of interest: sectoral dummies representing respectively ICT,
manufacturing and service firms (see Appendix A.2 and Table A.1 for variable description
and summary statistics). We carry out this exercise both at the firm level for each region as
well as for regional average values.
Our intended goal here is to identify some partial correlation between sectoral structures –
with particular attention to ICT-producing sectors – and firm/regional productivity by
estimating the coefficients of the dummy variables in equation (2). To obtain an empirically
usable equation for estimating such a relation we substitute the expression for the log of A
from equation (3) into equation (2), and subtract the labour input on both sides. Such a
simple transformation provides an expression that relates labour productivity to both the
capital-labour ratio and the sectoral dummies.
We estimate a panel regression that relate the value added per employee in each firm i
(region j) at time t (LPit; with i=1,..7200, and t=2001, ..,2005) to the firm capital labour
ratios (KLit) as well as the set of our industry (Ds) and (Dt) time dummies.
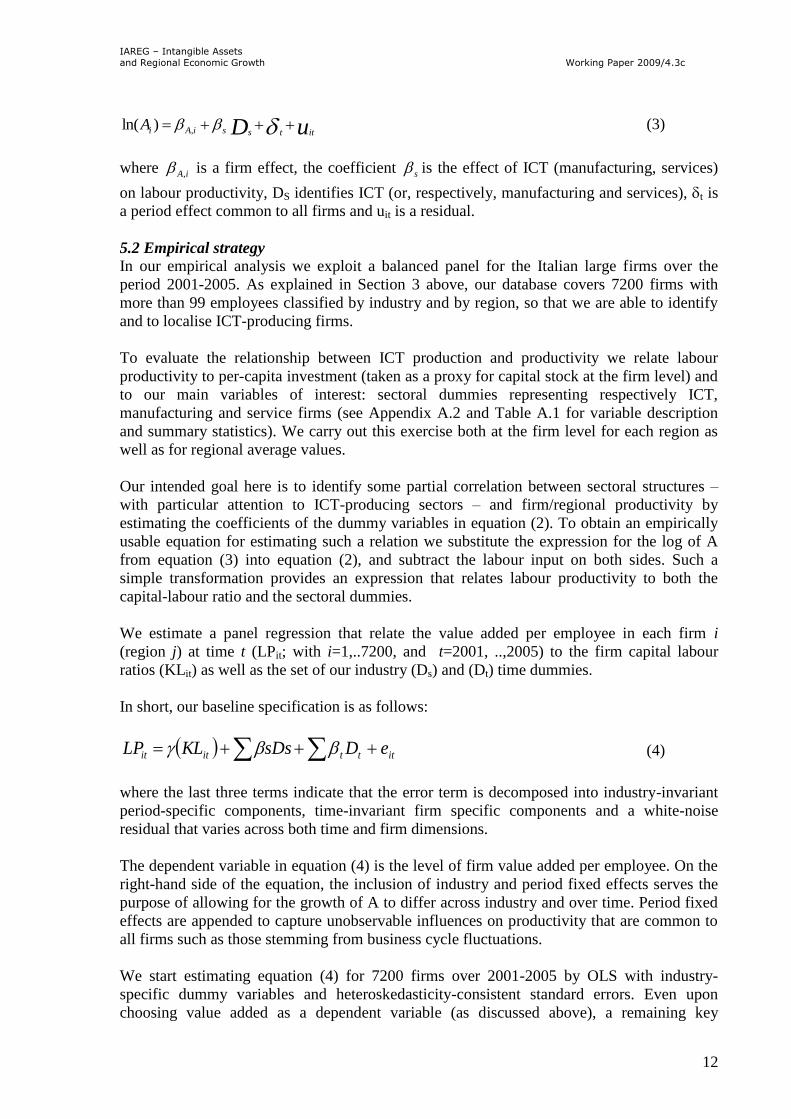
In short, our baseline specification is as follows:
itttitit eDsDsKLLP (4)
where the last three terms indicate that the error term is decomposed into industry-invariant
period-specific components, time-invariant firm specific components and a white-noise
residual that varies across both time and firm dimensions.
The dependent variable in equation (4) is the level of firm value added per employee. On the
right-hand side of the equation, the inclusion of industry and period fixed effects serves the
purpose of allowing for the growth of A to differ across industry and over time. Period fixed
effects are appended to capture unobservable influences on productivity that are common to
all firms such as those stemming from business cycle fluctuations.
We start estimating equation (4) for 7200 firms over 2001-2005 by OLS with industry-
specific dummy variables and heteroskedasticity-consistent standard errors. Even upon
choosing value added as a dependent variable (as discussed above), a remaining key
IAREG – Intangible Assets
and Regional Economic Growth Working Paper 2009/4.3c
13
estimation issue of equation (2) is the possible endogeneity of right-hand side variables,
namely the capital-labour ratio. As first pointed out by Hulten (1979), the demand of capital
services depends on TFP, which is partly captured by the error term in equation (2). This
induces a correlation between the error term and one of the regressors which makes the OLS
estimates of the capital-labour coefficient potentially biased upwards.
To deal with the potentially endogenous variable on the right-hand side of our regressions,
i.e. the capital-labour ratio, we resort to instrumental variables estimates. A good potential
instrument is one that only affects productivity through the instrumented variable and, at the
same time, is highly correlated with the variable to instrument. For this purpose our
instruments for the capital-labour ratio are the log-levels of the same variable lagged twice,
and our set of industry dummy variables.
For diagnostic purposes, we use the p-values of the Sargan-Hansen test to evaluate the
validity of our instruments and the values of the Shea partial R-squared of each endogenous
regressor to evaluate their relevance.
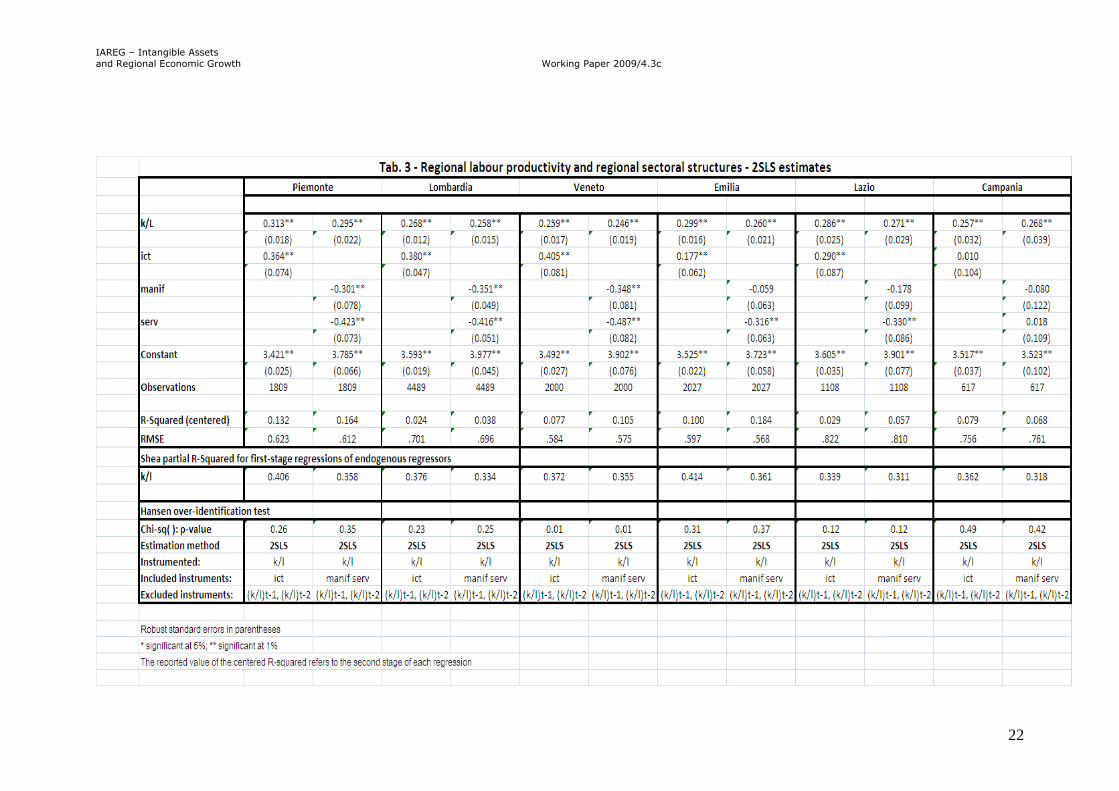
5.3 Results
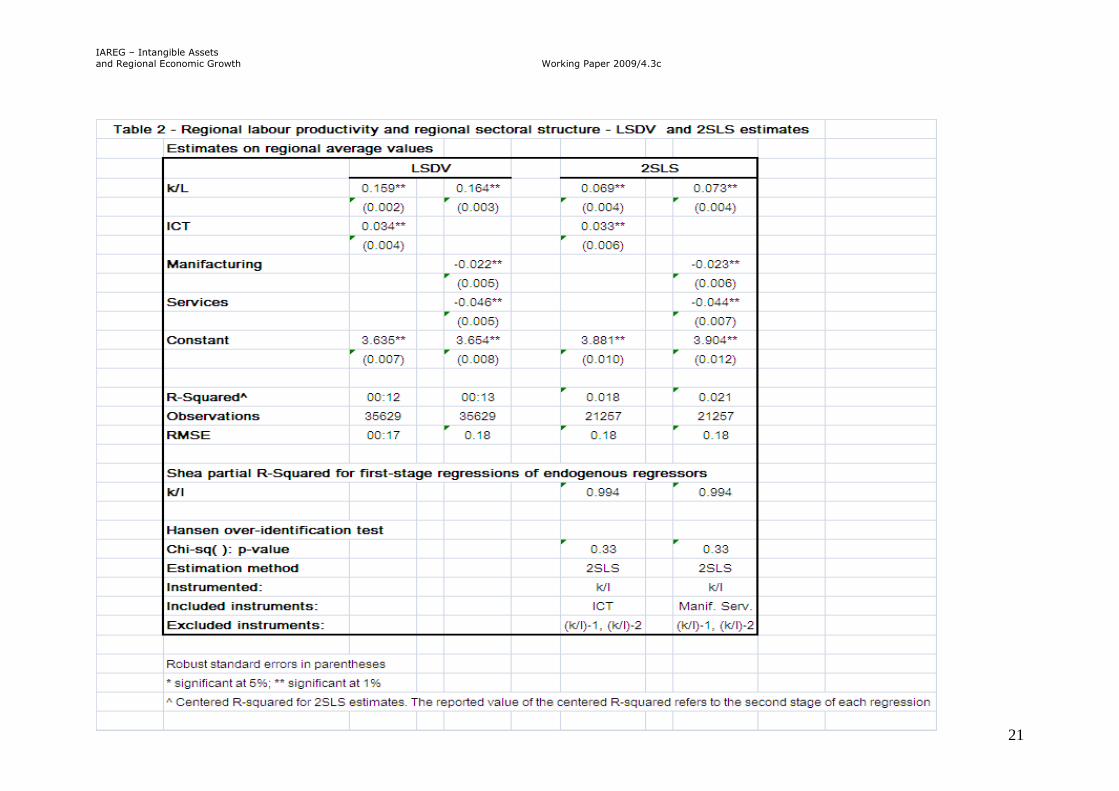
Table 2 presents the results on regional average values from the OLS estimates with industry-
specific dummy variables and from the 2-stages Least Square estimates.
[Table 2 about here]
As expected, our proxy for capital stock exerts a highly positive and significant impact on
productivity in all the specifications of the model. More importantly for our purpose here, a
strongly positive and significant relationship emerges between ICT-producing industries and
labour productivity for the estimates on the regional means. Indeed, this result holds as well
for both the LSDV and 2SLS estimates at the firm level for each region, whose results are
reported in Table 3 only for those regions which contributed the most (i.e. Lombardia, Emilia
and Veneto) or the least (i.e. Piemonte, Lazio and Campania) to the national productivity
growth in 2001-05.
[Table 3 about here]
The results show in fact a highly significant (1% level) and positive association between ICT
and productivity in nine Italian regions out of eighteen (as from Map 1, Molise and Basilicata
were excluded because of the lack of ICT-producing large firms). In the remaining regions
(Valle D‟Aosta, Trentino Alto-Adige, Friuli Venezia-Giulia, Liguria, Marche, Abruzzo,
Campania and Puglia), the coefficient is always positive but not significant. The only
exception, showing a negative (though not significant) relationship between the ICT indicator
and labour productivity, is Sicilia. Conversely, the variables for Manufacturing and Services
display a strongly negative association with labour productivity levels, both for the
regressions on the regional means and for those of individual regions. Indeed, in the latter
case, although the negative coefficients are not always significant (see the case of
Manufacturing in Emilia, Lazio and Campania in Table 3), the regions that display positive
coefficients (never significant tough) are only Valle D‟Aosta, Trentino Alto-Adige and
Sicilia in the case of manufacturing, and Campania and Sicilia in the case of services.
6. Conclusions and research extensions (incomplete)
IAREG – Intangible Assets
and Regional Economic Growth Working Paper 2009/4.3c
14
In this paper we have investigated some of the possible reasons underlying the slowdown of
the Italian labour productivity since the mid-1990s by taking into account the relationship
between ICT, productivity and regional performances. The first step of our analysis has
shown that the weak growth of the Italian productivity in the first half of the 2000s, although
still supported by some of the industrial cores of the country, namely Lombardia, Emilia and
Veneto, reveals some positive role of the southern regions that, however, is not enough to
counterbalance the rather poor performance of the rest of the country. To be noticed in
particular the pronounced fall of the Centre (especially Lazio) and of regional industrial
hearts such as Piemonte. Secondly, the sectoral decomposition analysis within each region
indicates some differences in the importance of within and between effects across industries,
signalling that some reallocation components are at work. The sectoral decomposition of
regional productivity growth has also highlighted a positive contribution of ICT industries –
and software in particular – in most of the Italian regions.
The preliminary analysis here presented is currently being developed in several directions.
Firstly, estimates on regional productivity growth rates are in progress, as well as estimates
on total factor productivity. Secondly, a further investigation of the role of ICT production is
carried out by looking at the statistical relation between labour costs, labour productivity and
ICT. The aim in this case is to check if the cross-effect between labour productivity and ICT
on regional labour costs is significant. Thirdly, both firm dynamics in the five years observed
(in this preliminary draft we have considered the balanced panel of Italian firms with more
than 99 employees) and the role played by multi-located firms could shed further light on our
understanding of regional productivity patterns and trends.
The analysis carried out in this paper presents some limitations. As discussed in Section 2,
spillovers can be a side-product of technical progress in the ICT-producing sectors, but they
also stem from complementarities with innovations generated in other sectors. On the one
hand, the relationship between new technologies and productivity can be only partially
captured by considering ICT-producing industries, as a major role is played by ICT-using
sectors, for which we do not have regional data. The demand side of the relationship between
new technologies and productivity is crucial and, at least at the aggregate level, some recent
studies have shown that the Italian case is closer to a “falling behind” than to a “catching up”
example (Daveri, 2008).
The exercise presented can nonetheless provide some insights for public policy. On the other
hand, in fact, our results here have shown that new technology creation and diffusion cannot
be easily disentangled and that adoption, diffusion and use – and the somewhat bigger
emphasis put on the latter from some policy environments – may only partially display their
benefits without a production base of some kind rooted in the regional/national industrial
structure. Not all firms and regions are expected to be on the frontier of the prevailing
technological paradigm, but some degree of production capacity may anyway be critical –
particularly in supposedly advanced economies – to build the competence to participate in it
and take advantage of its increasing social and economic rewards (Steinmueller, 2001).
IAREG – Intangible Assets
and Regional Economic Growth Working Paper 2009/4.3c
15
References
Abramovitz M. (1986), “Catching up, forging ahead, and falling behind”, Journal of
Economic History, 46, 385-406.
Acemoglu, D. and R. Shimer (2000) “Wage and Technology Dispersion”, The Review of
Economic Studies, Vol. 67, No. 4, 585-607.
Ahn, S. (2001), “Firm dynamics and productivity growth: a review of micro evidence from
OECD countries”, OECD Economics Department Working Paper No. 297, Paris
Amendola M., Gaffard J.L. and Saraceno F. (2005), Technical progress, accumulation and
financial constraints: is the productivity paradox really a paradox?, Structural Change and
Economic Dynamics, 16, 243-261.
Angrist, J.D., (1990), “Lifetime Earnings and the Vietnam Era Draft Lottery: Evidence from
Social Security Administrative Records”, American Economic Review, June 1990.
Ark, B. van, J.Melka, N.Mulder, M.Timmer and G. Ypma (2002), “ICT investment and
growth accounts for the European Union, 1980-2000”, Report to the European Commission,
DG Economics and Finance, September
Baily, M. N., Bartelsman, E. J., and Haltiwanger, J., (1996), “Downsizing and productivity
growth: myth or reality?”, in Mayes, D. G., (ed.), Sources of Productivity Growth,
Cambridge, Cambridge University Press.
Barnes, M., Haskel, J. and M. Maliranta (2001), “The Sources of Productivity Growth:
Microlevel Evidence for the OECD”, mimeo.
Barrios S., Mas M., Navajas E. and Quesada J. (2008), Mapping the ICT in EU Regions:
Location, Employment, Factors of Attractiveness and Economic Impact, Institute for
Prospective Technological Studies, Joint Research Centre, European Commission, MPRA
Paper No. 6998: http://mpra.ub.uni-muenchen.de/6998/
Bartelsman E., Scarpetta S. & Schivardi F. (2003), "Comparative Analysis of Firm
Demographics and Survival: Micro-Level Evidence for the OECD Countries" OECD
Economics Department Working Papers 348, OECD, Economics Department.
Bartelsman E.J and De Groot H.L.F. (2004), Integrating evidence on the determinants of
productivity, in: G. Gelauff, L. Klomp, S. Raes and T. Roelandt (eds.), Fostering
Productivity – Patterns, Determinants and Policy Implications, Elseviers, Chapter 9, 159-
183.
Bartelsman E.J. and Doms M., (2000), Understanding Productivity: Lessons from
Longitudinal Microdata", Journal of Economic Literature, 38(3): 569-594.
Bottazzi G., E. Cefis E., Dosi G.,(2002) Corporate Growth and Industrial Structure. Some
Evidence from the Italian Manufacturing Industry", Industrial and Corporate Change, 11, 4,
705-23.
Bresnahan T.F. and Trajtenberg (1995), General Purpose Technologies: Engines of Growth?,
Journal of Econometrics, 65, 83-108.
Broadberry S. and Goshal S. (2005), Technology, organisation and productivity performance
in services: lessons from Britain and the United States since 1870, Structural Change and
Economic Dynamics. 16(4), 437-466.
IAREG – Intangible Assets
and Regional Economic Growth Working Paper 2009/4.3c
16
Brynjolfsson E. And Hitt L.M. (2003), Computing productivity: firm level evidence, The
Review of Economics and Statistics, 85, 4, 793-808.
Brynjolfsson E., (1993), “The productivity paradox of information technology”,
Communications of the ACM, 36, 2, 67-77.
Castells M. (2000), The Information Age: Economy, Society and Culture, 2nd
ed., Blackwell,
Oxford.
Cheshire P.C. and Carbonaro G., 1995, “Urban economic growth in Europe: Testing theory
and policy prescriptions”, Urban Studies, 33, 1111-1128.
Cingano F. and Schivardi F. (2004), "Identifying the Sources of Local Productivity Growth,"
Journal of the European Economic Association, MIT Press, 2(4), 720-742.
Crespi G., Criscuolo C. and Haskel J. (2007), Information technology, organisational change
and productivity growth, CEPR Discussion Paper 6105.
Daveri F. and Silva O. (2004), Not only Nokia: what Finland tells us about new economy
growth. Economic Policy, 19 (38), 117-163.
Daveri F., C.Jona-Lasinio, (2008), “Off-shoring and Productivity Growth in the Italian
Manufacturing Industries”, in CESifo Economic Studies; vol. 3/08.
Daveri F., C.Jona-Lasinio, (2005), “Italy‟s decline: getting the facts right”, in Giornale degli
economisti e annali di economia, Vol.64, n.4.
Daveri, F. (2004), "Delayed IT usage: is it really the drag on European productivity?",
CESifo Studies, 397-421
David, P.A. (2000), "Understanding Digital Technology's Evolution and the Path of
Measured Productivity Growth: Present and Future in the Mirror of the Past," Papers 99-011,
United Nations World Employment Programme.
Dettori B., Marrocu E. and Paci R. (2008), Total factor productivity, intangible assets and
spatial dependence in the European regions, Working Paper CRENoS 2008/23.
Di Giacinto and Nuzzo (2006); Explaining labour productivity differentials across Italian
regions: the role of socio-economic structure and factor endowments, Papers in Regional
Science, Volume 85 Issue 2, 299 – 320.
Dunford M. and Smith A. (2000), “Catching up or falling behind? Economic performance
and regional trajectories in the new Europe”, Economic Geography, 76, 2, 169-195.
Duranton G. and Puga D. (2004), “Microeconomic Foundations of Urban Increasing
Returns”, in J.V. Henderson and J.F. Thisse (eds), Handbook of Regional and Urban
Economics, North Holland, Amsterdam.
Eurostat, 1996, Sistema europeo dei conti 1995 – SEC95, Luxembourg.
Fagerberg J. (1987), “A technology gap approach to why growth rates differ”, Research
Policy, 16, 2-4, 87-99.
Fagerberg J. (1994), “Technology and international differences in growth rates”, Journal of
Economic Literature, 32, 1147-1175.
Fagerberg J., Verspagen B. and von Tunzelmann N. (eds) (1994), The Dynamics of
Technology, Trade and Growth, Edward Elgar, Aldershot.
Freeman C. and Soete L., 1994, Work for All or Mass Unemployment: Computerised
Technical Change into the 21st Century, Pinter, London.
IAREG – Intangible Assets
and Regional Economic Growth Working Paper 2009/4.3c
17
Gordon, R.J (2000), “Does the “new economy” measure up to the great inventions of the
past?”, Journal of Economic Perspectives, 49-74
Gordon, R.J. (2003), “Hi-tech innovation and productivity growth: does supply create its own
demand?”, NBER Working paper #9437, January.
Gozzi, G., L. Grossi, P. Ganugi C. Gagliardi (2005), Size, growth and productivity dynamics
in Italian mechanical firms, mimeo, presented at the 2005 Conference “Monitoring Italy”,
Rome, ISAE, June 7
Greenspan, A. (2000), "Business Data Analysis." Re-marks before the New York
Association of Business Economics, New York, NY, June 13.
Guerrieri P. and Meliciani V. (2005), Technology and international competitiveness: The
interdependence between manufacturing and producer services, Structural Change and
Economic Dynamics, Vol. 16, No. 4, 489-502.
Hulten, Charles R. (2000), "Total Factor Productivity: A Short Biography." National Bureau
of Economic Research (Cambridge, MA) Working Paper No. 7471, January 2000;
Stiroh J. (2002), “Information Technology and the U.S. Productivity Revival: What Do the
Industry Data Say?”, The American Economic Review, Vol. 92, No. 5, 1559-1576;
Jorgenson D. (1995), Productivity, MIT Press.
OECD (2000), Information Technology Outlook. ICTs, E-commerce and the Information
Economy, OECD, Paris.
OECD (2001a), 2001 Communication Outlook, Paris
OECD (2001b), The OECD Productivity Manual: A Guide to the Measurement of Industry-
Level and Aggregate Productivity Growth, OECD Statistics Directorate, Paris
OECD (2003), ICT and economic growth: evidence from OECD countries, sectors and firms,
Paris.
OECD (2005), Going for growth, Paris.
Ohkawa K. and Rosovsky H. (1973), Japanese Economic Growth: Trend Acceleration in the
Twentieth Century, Stanford University Press, Stanford, CA.
Olley G.S. and Pakes A. (1996), The dynamics of productivity in telecommunication
equipment industry, Econometrica, 64, 6, 1263-1297.
Oosterhaven J. and Broersma L. (2007), Sector structure and cluster economies: a
decomposition of regional labour productivity, Regional Studies, 41, 639-659.
Oulton, N., (1998), “Competition and the Dispersion of Labour Productivity”, Oxford
Economic Papers, 50, pp 39-62.
Paul A. David (1990), The Dynamo and the Computer: An Historical Perspective on the
Modern Productivity Paradox, The American Economic Review, 80, 2, 355-361.
Pérez C. (2002), Technological Revolutions and Financial Capital, Edward Elgar.
Steinmueller W.E., 2001, “Seven Foundations of the Information Society: A social science
perspective”, Journal of Science Policy and Research Management, 16, 1/2, 4-19.
van Winden W., & van der Meer, A. (2003). The ICT sector: growth engine for urban
regions?. In F. Helten & B. Fischer (Eds.), Envisioning Telecity: Towards the urbanisation of
ICT. Frankfurt a/M: Peter Lang, 85-107.

IAREG – Intangible Assets
and Regional Economic Growth Working Paper 2009/4.3c
18
von Tunzelmann, N. (2009a), “Regional Capabilities and Industrial Regeneration”, in
Farshchi, M., Janne, O. and McCann, P. (Eds), Technological Change and Mature Industrial
Regions: Firms, Knowledge and Policy, Edward Elgar, Cheltenham, 11-28.
Weterings, A.B.R. and R.A. Boschma (2009), Does spatial proximity to customers matter for
innovative performance? Evidence from the Dutch software sector, Research Policy, 38, 746-
755.
Wilson D. (1995), “IT investment and its productivity effects: an organizational sociologist‟s
perspective on directions for future research”, Economics of Innovation and New
Technology, Special Issue, 3, 235-251.
IAREG – Intangible Assets
and Regional Economic Growth Working Paper 2009/4.3c
19
Map 1 - Location of ICT-producing firms by region (% on regional total; national average = 4.1%)
IAREG – Intangible Assets
and Regional Economic Growth Working Paper 2009/4.3c
20
IAREG – Intangible Assets
and Regional Economic Growth Working Paper 2009/4.3c
21
IAREG – Intangible Assets
and Regional Economic Growth Working Paper 2009/4.3c
22

IAREG – Intangible Assets
and Regional Economic Growth Working Paper 2009/4.3c
23
APPENDIX A.1
THE ITALIAN REGIONS
MACROREGION REGION (NUTS 2)
NORTH-WEST PIEMONTE
VALLE D'AOSTA
LOMBARDIA
LIGURIA
NORTH-EAST TRENTINO ALTO ADIGE (TRENTO
+ BOLZANO)
FRIULI VENEZIA GIULIA
VENETO
EMILIA ROMAGNA
CENTRE TOSCANA
LAZIO
UMBRIA
MARCHE
SOUTH (MEZZOGIORNO) ABRUZZI
MOLISE
CAMPANIA
PUGLIA
BASILICATA
CALABRIA
SICILIA
SARDEGNA

IAREG – Intangible Assets
and Regional Economic Growth Working Paper 2009/4.3c
24
Table A.1 (TO BE ADDED)
APPENDIX A.2
Dependent Variable
Labour productivity Value added per employee
Independent variables
Regions See Appendix A.1
Sectors
ICT
Hardware Manufacture of office machinery and computers
Software IT, computer and related service activities
Communication equip. Manufacture of radio, television and communication equipment and
apparatus
MANUFACTURING
Food and beverages Manufacture of food products, beverages and tobacco
Textiles Manufacture of textiles and textile products
Leather Manufacture of leather and leather products
Wooden products Manufacture of wood and wooden products
Paper, Pulp and Printing
Electrics and electronics
Manufacture of electrical machinery and apparatus n.e.c. -
Manufacture of industrial process control equipment - Manufacture
of optical instruments and photographic equipment - Manufacture of
watches and clocks
Chemicals Manufacture of chemicals, chemical products and man-made fibres
Refined petroleum Manufacture of coke, refined petroleum products and nuclear fuel
Plastic Manufacture of rubber and plastic products
Metal Manufacture of other non-metallic mineral products, Manufacture of
basic metals and fabricated metal products
Transport equipment Manufacture of transport equipment
Machinery Manufacture of machinery and equipment n.e.c.
Other manufacturing Other manufacture n.e.c.
SERVICES
Constructions
Trade Wholesale and retail trade; Repair of motor vehicles, motorcycles
and personal and household goods; Hotels and restaurants;
Transport, storage and communication
Financial intermed. Financial intermediation, Real estate activities, Renting of
machinery and equipment without operator and of personal and
household goods
Other services Research and development, Other business activities, Education,
Health and social work, Other community, social and personal
service activities
Investment Log (investment per employee)
Labour cost Log (wages per employee)

IAREG – Intangible Assets
and Regional Economic Growth Working Paper 2009/4.3c
25