Embed Size (px)
Citation preview

ICT Sector Performance Review
For the Philippines
14 May 2011
Erwin A. Alampay, PhD
This research was carried out with the aid of a grant from the International Development Research Center (Canada) and the Department for International Development (United Kingdom).
The report is part of LIRNEasia’s Sector Performance Review (SPR)/Telecom Regulatory Environment (TRE) research project. The 2008 and 2006 TRE country reports are available at www.lirneasia.net
The author would like to thank Ms. Olivia Khane S. Raza for helping in the actual administration of the survey. All opinions expressed herein are those of the author’s.

Table of Contents
1. Executive Summary ............................................................................................................................... 5
2. Country Overview ................................................................................................................................. 5
The Role of ICT in the economy ............................................................................................................ 6
3. Market Structure and Market Dynamics .............................................................................................. 7
5. Applications and Services ...................................................................................................................... 9
Applications and Services ..................................................................................................................... 9
Human Resources and Innovation ...................................................................................................... 10
6. Institutions and the Policy & Regulatory Environment ....................................................................... 11
7. Effectiveness of the Telecom Policy and Regulatory environment .................................................... 14
7.1 Market Entry ................................................................................................................................ 16
7.2 Access to Scarce Resources ........................................................................................................... 18
7.3 Interconnection ............................................................................................................................. 19
7.4 Tariff Regulation ............................................................................................................................ 21
7.5 Regulation of Anti‐competitive practices ..................................................................................... 22
7.6 Universal Service Obligations ........................................................................................................ 23
7.7 Quality of Service .......................................................................................................................... 26
Summary/Conclusions ............................................................................................................................ 28
Annex 1: TRE Survey Methodology ......................................................................................................... 29
The three sectors .................................................................................................................................... 29
The seven dimensions ............................................................................................................................. 30
The Likert Scale ....................................................................................................................................... 31
The Respondents: Categories, Weights, Minimum Numbers ................................................................. 31
Categories ......................................................................................................................................... 31
Weights .............................................................................................................................................. 32

Minimum number of respondents .................................................................................................. 32
Annex 2: Summary of Regulatory and Policy Events for the Philippines January 2010‐January 2011 ... 34
References .............................................................................................................................................. 38
List of Tables
Table 1: Respondent Breakdown
Table 2: Summary of Fiber Infrastructure and Mobile Broadband services
Table 3: Provinces without Fiber connectivity
List of Figures
Figure 1: Philippine TRE 2008 vs. 2011
Figure 2: ICT Investments in Billions (Php)
Figure 3: Fixed, Mobile and Internet Subscription, 1992‐2008
Figure 4: Employment from ICT Investments, 2006‐2010
Figure 5: Philippine Telecommunications Industry (pre‐CICT)
Figure 6: TRE Scores for Market Entry
Figure 7: TRE Scores for Access to Scarce Resources
Figure 8: TRE Scores for Interconnection
Figure 9: TRE Scores for Tariff Regulation
Figure 10: TRE Scores for Anti‐Competitive Practices
Figure 11: TRE Scores for Universal Service Obligation
Figure 12: TRE Scores for Quality of Service

List of Abbreviations
CICT – Commission on Information and Communication Technologies
DOTC – Department of Transportation and Communications
EO – Executive Order
ICT‐ Information and Communication technologies
LGU – Local Government Unit
NEDA – National Economic Development Authority
NCC‐ National Computer Center
NTC – National Telecommunications Commission
PLDT – Philippines Long Distance Telephone Company
SAS – Service Area Scheme
TELOF – Telecommunications Office
TRE – Telecommunications Regulatory Environment

1. Execu
Between regulatory2010, BenPresidentCommissi
PresidentappointinAquino al
Results ofdeclined ospecificallsurvey coin the brosee as theincreasingnot yet cafrequenci
2. Coun
The RepuEast Asia. divided inVisayas, acountry regovernanare then scomponebarangayspolitical uadministr1,495 mu
The PhilipPhilippine
utive Summ
February 201y environmennigno Aquino could appoinon on Inform
Aquino chosg a new Chaiso asked Con
f the TRE Survoverall, and inly, only markenducted in 20oadband sectoeir primary grgly becoming aught up withes, establishi
ntry Overvi
blic of the Ph It is an archipnto three majand Mindanaoetains a threece. At the firssubdivided innt cities, withs, which comunit. All in all, ative regionsnicipalities an
ppines has a pes has averag
2
2.3
2.4
2.5
2.6
2.7
2.8
2.9
mary
10 and Januarnt in the PhiliIII became thnt new officiamation and Co
se to retain thrman to the Cngress to prio
vey for 2011 sn every segmet entry and i008. The segor. This is indrowth area. Tmore concer
h the issues asng standards
Fig
ew
hilippines is lopelago of 7,1or island grouo. Administrae‐tiered strucst level are prto municipalih each furtheprise the couthe Philippin, 81 provincend 42,008 bar
population of ed 4.5% per y
2.81
2.62
Fixed
ry 2011, the mppines was thhe President oals to the Natiommunication
he NTC CommCICT, Atty. Ivaritize the pas
shows that stent (Fixed, Minterconnectigment with thicative of theThis is also therned with. As ssociated wits for service q
gure 1: Philip
ocated in Sout07 islands anups: Luzon, tively, the cture for localrovinces. Theities and r subdivided ntry’s smallees has 17 es, 136 cities, rangays (DILG
approximateyear since 200
2.86
2.77
Mobile
most significahe political chof the republional Telecomn Technology
missioner froman Uy. In his fsage of an an
takeholders pMobile and Broion for Mobilhe biggest dee area where e service thatan emergingh the technouality, and th
ppine TRE 200
th d is
l ese
into st
G 2009).
ely 102 million01. In 2010, t
2.77
2.54
Broadband
nt event in thhange in the nic. The changmmunications.
m the previoufirst State of tnti‐trust bill.
perceive the Toadband) (sees had a bettcline, and witmost of the tt a growing seg field, it is alslogy. Emerginhe perennial q
08 vs. 2011
n in 2011. Ecothe National
2.81
2.64
overall ave
he telecommnation’s leadege of leadershs Commission
us administratthe Nation ad
TRE in the Phie Fig. 1 belower score comth the lowestelecommunicegment of theso the area wng concerns inquestion of u
onomic growtEconomic De
2008 sc
2011 sc
unications ership. On Mhip meant than (NTC) and th
tion, while alsddress, Presid
ilippines to haw). More pared to the t overall scorecation provide market is here policy hnclude accessniversal acce
th in the evelopment
core
core
May at the he
so dent
ave
last e was ers
as s to ss.

Authorityimprovem
The RoleThe goverdriver towrelated inforeigners
ICT‐relateeven then2009. In 2and Filipinor 97.4 pe
3. Marke
For most Philippinepenetratio
(NEDA) repoment from the
e of ICT in thrnment consiwards nationadustries in ths (see Fig. 2).
ed investmentn, with reduce2010, with thno nationals iercent came f
et Structur
of the 20th cee Long Distanon rates and
Source: NCS
0
10
20
30
40
50
60
70
orted that coue 1.1% in GDP
e economy ders the infoal developmehe Philippines
F
ts declined ined investmenhe global econncreased almfrom foreign
re and Mar
entury, the Phce Co. (PLDT)by the long w
SB
24.2
11.295
2006
untry’s GDP gP and 4.0% in
rmation and nt. From 200s. More than
Figure 2: ICT I
n 2008 and 20nts, revenues nomy slowly rmost four‐foldinvestors.
rket Dynam
hilippine telec). Over this pewaiting time t
32.2
1
2.47
1
2007 2
rew by 7.3%,GNP growth
communicati06 to 2010, m88% of this IC
Investments
009 due to thein the industrecovering, ind to PhP 57.5
mics
communicatioeriod, the secto own a telep
12.56 13
1.848 1.
2008 20
while its GNs posted in 20
ion technologore than PhpCT‐related inv
in Billions (Pe
e global econry continuednvestments inbillion. Out o
ons industry wctor was charaphone. Due to
3.26
5
513
1.
009 20
P grew by 7.2009.
gy (ICT) secto156 Billion wvestments we
esos)
nomic depressto rise, earnin the sector mof this amoun
was a privateacterized by lo underinves
6
.5
10
Fi
Fo
2%. This was a
r as an imporwas invested inere invested
sion. Howeveing US$7.2B imade by foret, PhP 56.0 bi
e monopoly olow telephontment in the
lipino
oreign
a big
rtant n ICT‐by
er, n ign illion
f the e

sector, a huge telephone backlog existed, telephone service was generally unavailable and where it was, the service was unreliable (Aldaba 2011)1. Over the years it consolidated its monopoly on the industry while having little incentive to expand its network and improve services. During those years, however, it was complemented by a government backbone that provided limited services to underserved regions in the country. During this ‘monopolistic period’, the country’s telecommunications sector was characterized by very low telephone density and inefficient management, with waiting times for telephone installations measured in years (Townsend & Alampay 2011).
In 1990, the government’s National Telecommunications Development Plan (1990‐2010) sought to divest the state of its role in the delivery of telecommunications services through privatization and to encourage growth through more competition. At the same time, however, the plan was for government to continue facilitating official development assistance (ODA) for telecom projects in underserved and economically unviable areas.
While there were liberalization initiatives for the sector in the 1980s, only in 1993, with the issuance of Executive Orders (EO) 59 and 109, did real competition emerge. The former required mandatory interconnection among telecommunication providers, while the latter introduced service obligations among international gateway facility (IGF) providers and cellular mobile telephone service (CMTS) providers through a “service area scheme” (SAS). Under the SAS, new telecommunications franchises that were granted had an obligation to construct 300,000 to 400,000 fixed lines at a ratio of one line in a rural area for every ten in an urban area.
These policies to liberalize the provision of basic telecommunication services, brought with it the entry of new players. This led to a much faster growth in the industry as foreign investment increased and new services emerged. This though would not have happened had not technological advances in mobile technology made real competition in the sector possible (See Figure 3).
1 http://www.bworldonline.com/content.php?section=Opinion&title=PLDT‐Sun‐acquisition&id=29109

However,dominatetotal numinterconn
EventuallyexponentPacific groPLDT and operationthe total nor about 4
After the in the cousame pricentered tmessagingpassing ofphone owline, if not
F
despite the ee the industrymber of fixed lnection and fo
y, as mobile tially faster thoup, which owconsolidated
ns of PLDT andnumber of ce48% of all pho
consolidationuntry. Compeces for their sehe market. A g. It can be nf credit) stemwnership event get a second
Figure 3: Fixe
entry of new having owneines. With thor revenue‐sh
technologies han the fixed wned SMARTd its position id Smart. Comellular mobile one subscribe
n, PLDT‐Smartition was limervices. For incouple of yea
noted in the Fmmed the appn further as md line.
ed, Mobile an
players (ie Baed the backbois, it was ableharing arrange
improved, thline business.T, became thein the Philipp
mbined with Ptelephone suers (mobiles a
t and Globe, mited as the twnstance, text ars thereafteFigure above tparent plateaumore and mor
nd Internet Su
ayantel, Globone network e to influenceements (Alda
e mobile pho. This transfoe leader in thepine telecommPLDT’s Piltel, iubscribers anand fixed com
emerged as two telecommmessages cor, Sun startethat this offeuing of subcrire people at t
ubscription 1
be, Digitel, SMand accountie the speed, taba 2011a).
one industry trmed the lane cellular marmunications int also then had 43% of the mbined).
the top two temunications gst P1 each. Ind offering 24/ring, along wibership and the bottom of
992‐2008
MART), PLDT cng for the larerms, conditi
then started tdscape in therket. It then bndustry by syad a combinetotal numbe
elecommuniciants offered n 2003, Sun C/7 unlimited ith the Pasalohelped push f the market g
continued to rgest share inions for
to grow e sector. The bought controynthesizing thed share of 68r of installed
cations compbasically theellular of Digcall and text oad (peer‐to‐access/mobilgained access
the
First ol of he 8% of lines,
anies itel
peer le s to a

With Sun introducing bucket pricing, SMART and Globe accused Sun of ‘predatory pricing’ and petitioned the National Telecommunications Commission (NTC) to stop Sun’s service offers, fix call rates at P5.50 per minute and bar Sun from charging lower rates (Aldaba 2011a). However, the NTC ruled in Sun’s favor, and both SMART and Globe also eventually began to offer fixed rate or "bucket" plans for voice and text services.
With the increase in competition in the sector, the telcos’ profit margins have come under pressure even as demand for more network services increased. Competition is also coming from various fronts, with Internet services such as Skype focing companies to keep prices low (Montecillo 2011).
While daily outbound text messages increased from 800‐900 million text messages to 1.2 billion, yields declined from 18 centavos to 13 centavos/text. In 2010, revenues from cellular data/text dropped 13% to P31 billion despite a 25% increase in text volume (Reyes, 2010). Globe’s postpaid average revenue per unit (ARPU) fell to P1,168 while Smart’s postpaid ARPU remained steady at P1,257 (Business Monitor 2010). This trend has continued on to the first quarter of 2011. PLDT reported that its ARPU, had dropped 13 percent year on year, leading to net profit slipping 6 percent to P10.7 billion in the first quarter. In a separate statement, Globe Telecom Inc. on the other hand said its net profit rose 1 percent in the January‐to‐March period. This, however, was their first increase in quarterly profit since the start of last year (Montecillo 2011).
As of the end of 2010, the three main telecommunications providers in the Philippines were PLDT/SMART, Digitel, and Globe Telecommunications, Inc. They all provide mobile, fixed line as well as Internet and broadband services. A fourth operator, Bayantel, as well as several smaller operators such as members of the PAPTELCO, are also active in the market.
Given the decreasing revenue from mobiles, telcos are looking for other revenue streams, and foremost among their strategic plans for expansion is broadband. Likewise, there’s also a trend towards consolidation, as evidenced by PLDT’s acquisition first of CURE and more recently of Digitel, thereby fueling discussions of an emerging duopoly between PLDT and Globe.
5. Applications and Services
Applications and Services The Philippines has been at the forefront of many innovative mobile applications, especially in the area of SMS and m‐commerce (Mendes, et.al 2007).
Among the reasons for these are the following: Filipinos are highly literate, and short messaging system (SMS) use was a driver to the early growth of the mobile industry in the mid‐1990s. Eventually, SMS was embraced to the point that the Philippines was among the first countries to directly make use of it for services like complaints and feedback (see Lallana 2004, CSC 2003) , and exchanging load credits for payment which would become a precursor to mobile money. Innovation is being driven by a large and

well‐educated pool of ICT software development specialists, with each major telecom company having their own dedicated units for developing new mobile applications (Intelecon 2010b). However, innovative use for m‐services is not purely commercial driven, as some innovation is also developed by the country’s extensive base of government agencies and non‐governmental organizations. Examples of these include a Farmer’s texting service (Pascua et.al. 2010) a police reporting system (Alampay 2003) and complaints about government services (CSC 2003).
The Philippine telecommunication operators were one of the first developers of mobile currencies, particularly with SMART‐Money, and then later, G‐Cash (Alampay & Bala 2010). Currently a third offering has been introduced, Sun‐Cash. These different platforms, allow competition, even in the m‐money field, that also allows for innovation in how they can be applied. Some of these innovations, especially in transactional use online, are driven by users themselves (Alampay 2008b). At present, the three different m‐currencies are not directly interchangeable. One of the primary applications of mobile money in the Philippines is in the area of money‐transfers and remittances. This is because the Philippines has a large internal and external migrant workforce. This has lead to the need for greater use of ICTs to communicate between families that have been separated, and the need to coordinate financial transactions. This, in turn, has helped not only in the innovation in the area of financial transfers using mobile phones, but also make it more feasible given the large numbers of transactions being made. The need for this alternative is also coupled with the poor banking penetration in the countryside that is hampered by the archipelagic nature of the country having more than 7000 islands (Alampay & Bala 2010). The Philippine Central Bank has also been quick in recognizing the importance of e‐money and have already made policy circulars that defines what e‐money is, and have regulatory authority over e‐money issuers, including those that provide m‐money services (BSP 2009). Hence, this helps address some of the financial issues that telecommunication regulators do not normally address.
Human Resources and Innovation
The Philippines is one of the top off‐shoring and outsourcing destinations in the world, with a 5% market share at the end of 2006, By then, it was already contributing roughly 2% of the country’s GDP. The country’s inherent advantage is its highly educated work‐force, with a good command of the English Language, and low‐cost base (BPAP 2007). In its 2010 roadmap, the country targeted to grow this market share to 10%.
The thrust to develop this sector further is reflected in the sustained growth in number of jobs created since. Currently, employment in the ICT‐sector is largely services‐based. Approximately 47,500 new jobs in the ICT‐services sector have been created annually from 2006‐2010. This represents 84% of all jobs created in the ICT sector for the period (see Fig. 4).

So
6. Instit
The main telecomm
ource: NCSB
utions and
government munications se
0
10000
20000
30000
40000
50000
60000
70000
80000
Figure
d the Policy
players that ector over mo
55411
620819
2006
e 4: Employm
y & Regula
have been reost of the pas
45847
11361
14479
2007
IT services
ment from ICT
atory Envir
esponsible forst few decade
433
208
20
Manufact
T Investments
ronment
r the evolutioes are illustrat
356
264
08
turing Tele
s, 2006‐10
on of the Philited in Figure
53663
176
2009
ecom
ppines 5 below.
39427
9806
78
2010

DOTC
TELOF NTC
CongressOther
Government Agencies
IndustryAssociationsPublic NetworksPrivate
Networks
RadioBroadcasting
Networks
EquipmentManufacturers
& Suppliers
Local exchange carriers
Inter-exchange carriers
International carriers
Mobile radio services
Radio paging services
Value-added services
DOTC
TELOF NTC
CongressOther
Government Agencies
IndustryAssociationsPublic NetworksPrivate
Networks
RadioBroadcasting
Networks
EquipmentManufacturers
& Suppliers
Local exchange carriers
Inter-exchange carriers
International carriers
Mobile radio services
Radio paging services
Value-added services
Figure 5: Philippine Telecommunications Industry (pre-CICT) Source: DOTC (from Minges, et.al. 2002)
.
Congress has an important role in the policy environment, foremost because of market entry. In order to operate in the country, a telecommunication company must first secure a congressional franchise as provided for in the Constitution. This franchise must get the approval of both houses of Congress (Salazar 2007).
On the other hand, while the Philippine Congress also develops broad legislation that can impact on telecommunication laws, the Department of Transportation and Communications (DOTC) is the Executive branch’s policy‐making body for telecommunications. The Administrative Code of the Philippines provides that DOTC’s mandate is to be “the primary policy, planning, programming, coordinating, implementing, regulating and administrative body of the Executive Branch… in the promotion, development, and regulation of dependable and coordinated networks of … communication systems as well as in the fast, safe, efficient and reliable… communication services” (Sec. 2, Title XV). The DOTC also works with the National Economic Development Authority (NEDA) to set the country's telecommunication development goals and strategies.
The industry’s regulator is the National Telecommunications Commission (NTC), created in July 1979 by Executive Order 546. It was created as an attached agency of the DOTC with quasi‐judicial powers, and

responsibilities for developing tariff regulations, licensing conditions, technical regulation, competition and interconnection requirements, and similar regulatory measures. With the creation of the Commission on Information and Communication Technologies (CICT), the NTC is now an attached agency of the Commission. Commissioners to the NTC is appointed by the President of the Philippines and it draws its funds from the general appropriations of the government. As such, it is easily influenced by the incumbent administration, and Congress which deliberates on the budget.
The Telecommunications Office (TELOF), a sectoral agency that used to be under the DOTC, is now also under the CICT. TELOF is the only publically operated telecommunications service provider and is responsible for providing telephone and telegraph services in regions in the country that are unserved or underserved by commercial providers. Some of these services have been converted to provide Internet services as well.
Aside from the national agencies, local government units (LGUs) have also been provided by the Republic Act 7160, also known as the Local Government Code of 1992, to “exercise powers and discharge such other functions and responsibilities as are necessary, appropriate, or incidental to efficient and effective provision of the basic services and facilities enumerated herein… (which) include, but are not limited to, the following:… (3) For a Province: (XI) Inter‐municipal telecommunications services, subject to national policy guidelines…. (4) For a City: adequate communication and transportation facilities.” (Philippine Congress 1992: Sec. 17).
The consensus is that the role of the government is “1) to provide the correct policy environment to private investments in ICT development; and 2) to be a lead user of info‐communications services, and as such, to stimulate economic activities” (DOTC 2000b:9). By becoming less of a provider, the government’s work now involves maintaining more inter‐organizational relations to ensure the delivery of services by the private sector, and to create incentives for universal access without direct operational or funding involvement.
Commission on Information and Communication Technology (CICT)
The Commission on ICT (CICT) was created under Executive Order 269 in January 2004 to serve as the primary policy, planning, coordinating, implementing, regulating and administrative entity of the executive branch of the Government with respect to the ICT sector. It was tasked to promote, develop, and regulate integrated and strategic ICT systems and reliable and cost‐efficient communication facilities and services. The National Computer Center (NCC), Telecommunications Office (TELOF) and the Communications component of the Department of Transportation and Communications (DOTC) were integrated to form parts of the CICT, with the National Telecommunications (NTC) and the Philippine Postal Corporation (PPC) as attached agencies.
Organization of the CICT
The CICT is headed by a Cabinet‐level ranking Chairman. He is assisted by the Director General of the NCC and the Chief of the TELOF, who, in addition to their current responsibilities also concurrently serve as Commissioners. Aside from them, there are two (2) additional Commissioners who shall assist the Chairman, who are appointed by the President at the recommendation of the Chairman. At present the Commissioners are in charge of four key pillars in the CICT. The Head of the NCC is in charge of the E‐government development group, the Chief of the TELOF is in‐charge of Infrastructure Development Programs, one Commissioner is responsible for developing Cyber Services and Business, and another Commissioner is in charge of the Human Capacity and Development Group (HCDG). The HCDG also includes the training institute of government employees or the National Computer Institute (NCI).
Furthermore, previously existing units in the DOTC that directly support communications, including the Telecommunication Policy and Planning Office, were directly consolidated under the Office of the Chairman. Under EO 269 the NTC receives policy guidelines from the Commission “provided that the Commission shall not exercise any power which will tend to influence or effect a review or a notification of the NTC’s quasi judicial functions.” (EO 260, Sec. 5).
EO 269 also mentions the transitory nature of the CICT. At present, there is a pending legislation being proposed in Congress for the creation of a Department of ICT (DICT). As the development champion of the Cyber Corridor Super region, the CICT has been directed to oversee all programs and projects related to activities being implemented in the Corridor. Aligned with this, CICT is tasked to ensure the competitiveness of the ICT industry, develop human capital, advocacy for universal access/service, and promote the use of ICT in government. However, the creation of the proposed new Department of ICT remains uncertain as newly elected President Aquino has expressed the belief that another department is unnecessary given the existing size of the bureaucracy. Also, after a year in office, the President has yet to complete the appointment of new Commissioners in the CICT.
7. Effectiveness of the Telecom Policy and Regulatory environment The TRE survey is a tool to measure and compare regulatory risk due to policy maker’s and regulator's actions. The 2011 survey was administered in the Philippines from February to March 15, 2011.
The survey was a part of a regional study (also conducted simultaneously in India, Pakistan, Sri Lanka, Bhutan, Maldives, Afghanistan, Bangladesh, Indonesia, and Thailand) in order to understand how key stakeholders in the sector viewed the regulatory and policy environment in the Philippines.
Known as the TRE Survey (or the Telecom Regulatory Environment survey), it asked senior stakeholders to evaluate the effectiveness of the regulatory and policy environment in three telecom subsectors (fixed, mobile and broadband) along seven dimensions: market entry, access to scarce resources, interconnection, tariff regulation, anti‐competitive practices, universal service obligation (USO), and quality of service (QoS) for the past year (January, 2010‐ January, 2011).

The surve
Category operators
Category consultan
Category academia
All in all, t
Most of thmanually.
In the couacquisitiooperator analysis, e
In genera
ey respondent
1: Stakeholdes, industry ass
2: Stakeholdents, equity res
3: Stakeholde, research org
there were 59
CategorCategoryCategoryCategoryTOTAL
he responden.
urse of writingn by the leadin the countreven as the p
l, the results
2
2.3
2.4
2.5
2.6
2.7
2.8
2.9
ts were group
ers directly insociations, eq
ers who analysearch analys
ers with an inganizations, j
9 respondent
y y 1 y 2 y 3
nts for the su
g the TRE resding telecommy. Some of theriod in whic
of the TRE Su
2.81
2.62
Fixed
F
ped into thre
nvolved and cquipment sup
yse the sectots, etc.
nterest in impournalists, civ
ts broken dow
Table 1: Res
rvey answere
ults, an impomunications che commentsch the forum w
urvey for 2011
2.86
2.77
Mobile
Fig. 1: Philippi
e categories:
can be affecteppliers, etc.
r with broade
proving the sevil society org
wn into the fo
spondent Bre
No. of19 11 29 59
ed online. On
ortant policy iscompany, PLD by stakeholdwas held, was
1 shows that
2.77
2.54
Broadband
ine TRE 2008
ed by telecom
er interest, su
ector to help tganizations, e
ollowing per C
akdown
f Respondent
ly eleven (11)
ssue came abDT of Digitel‐Sders in that fos a couple of
stakeholders
2.81
2.64
overall ave
8 vs 2011
m sector regul
uch as lawyer
the public, suetc.
Category:
ts
) people answ
bout pertaininSun, which is orum is includweeks after t
s perceive the
2008 sc
2011 sc
lation, such a
rs, telecom se
uch as people
wered the sur
ng to the the third largded in this the actual sur
e TRE in the
core
core
as
ector
e from
rvey
gest
rvey.

Philippines to have declined in overall average, and in every segment (Fixed, Mobile and Broadband) (see Fig. 1 below). More specifically, only market entry and interconnection for Mobiles had a better score compared to the last survey conducted in 2008.
The segment with the biggest decline, and with the lowest overall score was in the broadband sector. This is indicative of the area where most of the telecommunication providers see as their primary growth area. This is also the service that a growing segment of the market is increasingly becoming more concerned with. Telecommunication companies recognize the need to invest in broadband in order to remain competitive.
As an emerging field, it is also the area where policy needs to keep pace with many issues associated with the technology. Convergence, for one, means competition is no longer between fixed operators, or between mobile operators, as some stakeholders mention Skype as now being the largest carrier of international voice traffic. Emerging concerns include access to frequencies, establishing standards for service quality, and the perennial question of universal access.
7.1 Market Entry
Market entry into the telecommunications industry in the Philippines is heavily regulated and involves two important processes. First, a company that wants to operate in the sector is required to secure a congressional franchise as provided for in the Constitution. This franchise must get the approval of both houses of Congress (Salazar 2007). The Constitution also limits foreign ownership of a telecommunication company to 40 percent with the life of a franchise not more than 50 years. This explains why all the major telephone companies are owned by commercially powerful and politically influential families, and have strong partnerships with overseas investors (e.g. NTT Docomo, Singapore Telecom, Deutsche Telecom) (Ure, 2004). As such, it is difficult and costly to enter the industry due to these barriers.
After securing a franchise, a company also has to apply to the National Telecommunications Commission (NTC) for a Certificate of Public Convenience and Necessity (CPCN) for the type of service that it wants to offer. Through the CPCN, the NTC assigns the area of operation, determines the allowable rate that could be charged for a service, and manages the allocation of radio spectrum or frequency.
Moreover, access to radio spectrum is another constraint that new entrants have to consider, especially if this is concentrated in the hands of only one player. Until these entry barriers are addressed, competition will be limited and the industry would continue to reap oligopoly rents (Aldaba 2011b).
Figure 6: TRE Scores for Market Entry

Figure 6 scontinuedcompetiti
Market enthe broadbecause tmarket sinnumber o2000 whilthe brandwireless bTelecom amobile anCMTS franoperate aand AlamNTC.
The broadwith percboth mobadded ser
hows that thd its decline fon has mainl
ntry in the modband sector. there have bence 2000. Hoof consolidatiole Globe Teled name, Sun Cbrand, Red Mand bought innd broadbandnchise. It filednd maintain pay 2011). A
dband sector eived marketbile and broadrvice, is easie
3
0
0.5
1
1.5
2
2.5
3
3.5
4
e perceived rrom 2006 andy been on the
obile sector isAlso, it is one
een a numberowever, it shoons, over the com acquiredCellular. In 20obile. Duringnterests in Libd businesses. d an applicatia nationwideAt present, the
is rated highet potential, asdband. Also, r because it d
3.3
3.7
2006
regulatory end 2008. No ne mobile and
s perceived me of the few Tr of new playeould also be n same periodd Islacom. In 2008, SMART p the same yeberty TelecomIn 2009, Schuon with the Ne 3G mobile tee recent acqu
er than the fis growth in thproviding brodoes not requ
2.93.2 3.1
2008
vironment fonew players hbroadband f
much better tTRE scores thers (e.g. Sun, noted that the. PLDT acqui2003, Digitel urchased CUar, San Miguem Holdings, Inutzengel TeleNTC for a provelecommunicuisition by PLD
xed line sectohe fixed sectooadband Inteuire a legislati
2.8
3.31
201
or market entave entered tfront.
han the fixedat improved Cure, San Mie mobile sectred and consformally launRE and subseel Corporationc., and annocom, Inc. wasvisional authocations systemDT of DIGITEL
or. These diffor has been rernet access, wive franchise.
33.1
1
F
M
B
ry for the fixethe fixed line
d line sector, afrom 2008. Piguel) who hator has also exsolidated SMAnched its mobequently launn partnered wunced plans ts granted a coority (PA) to cm in FebruaryL/Sun is being
ferences mayelatively flat, which is class This howeve
F1 ‐ FIXED
M1 ‐MOBILE
B1 ‐ BROADBA
ed sector has market, as
and better thPerhaps this iave entered thxperienced a ART and Piltebile service unched anotherwith Qatar to enter the ongressional construct, insy 2010 (Towng reviewed by
y also have toin comparisoified as a valuer is different
AND
an s he
l in nder r
stall, send y the
o do n to ue
when concompanie
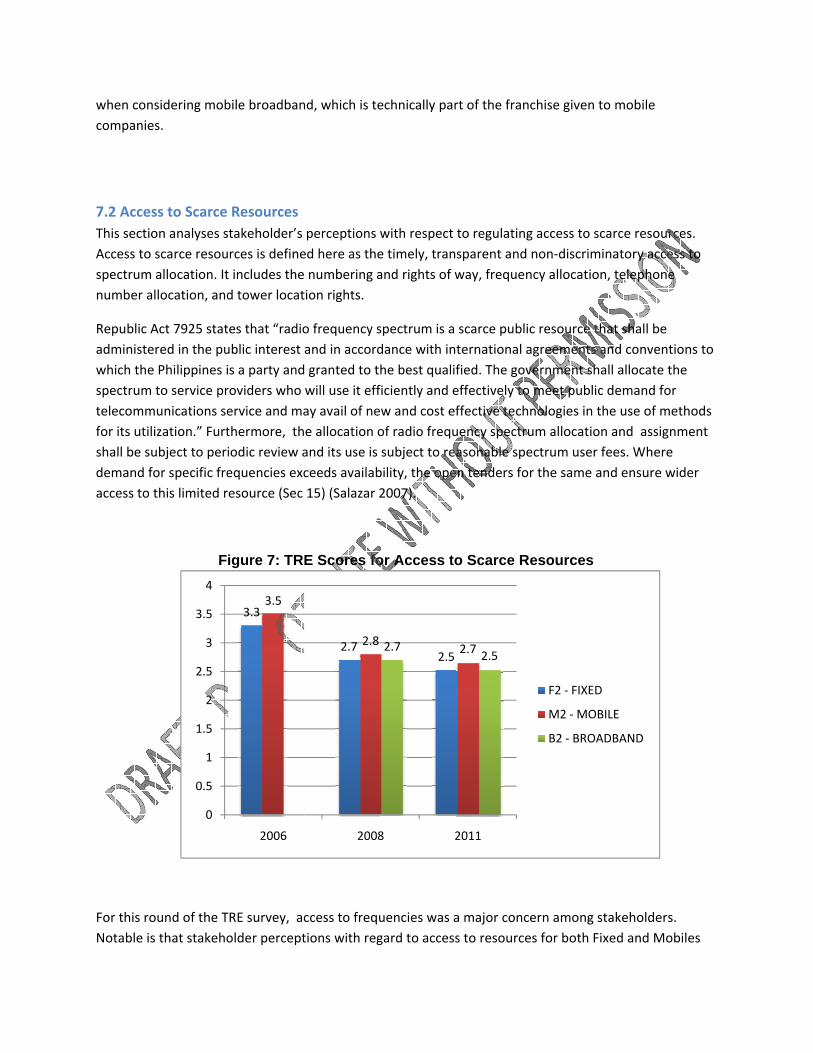
7.2 AccesThis sectioAccess to spectrum number a
Republic Aadministewhich thespectrum telecommfor its utilshall be sudemand faccess to
For this roNotable is
nsidering mobes.
ss to Scarce on analyses sscarce resouallocation. It
allocation, and
Act 7925 statered in the pue Philippines ito service pr
munications seization.” Furtubject to perifor specific frethis limited r
F
ound of the Ts that stakeho
0
0.5
1
1.5
2
2.5
3
3.5
4
bile broadban
Resources takeholder’s rces is definet includes thed tower locat
es that “radioublic interest s a party androviders who ervice and mathermore, thiodic review aequencies excesource (Sec
igure 7: TR
TRE survey, acolder percept
3.33.5
2006
nd, which is te
perceptions wed here as the numbering ation rights.
o frequency sand in accord granted to twill use it effay avail of nee allocation oand its use is ceeds availab15) (Salazar 2
E Scores fo
ccess to frequtions with reg
2.7 2.8
2008
echnically par
with respect e timely, tranand rights of w
spectrum is a dance with inhe best qualifficiently and ew and cost efof radio frequsubject to reability, the ope2007).
or Access to
uencies was agard to access
2.52.7
8 2
rt of the franc
to regulatingsparent and nway, frequen
scarce publicternational afied. The goveffectively to ffective technuency spectruasonable spen tenders for
o Scarce Re
a major conces to resources
2.7 2.5
2011
chise given to
g access to scanon‐discrimincy allocation,
c resource thagreements anernment shalmeet public dnologies in thum allocation ctrum user fer the same an
esources
ern among stas for both Fix
F2 ‐ FIXED
M2 ‐MOBI
B2 ‐ BROAD
o mobile
arce resourcenatory access, telephone
at shall be nd conventioll allocate thedemand for e use of methand assignmees. Where nd ensure wid
akeholders. xed and Mobi
LE
DBAND
es. s to
ns to e
hods ment
der
les

(for all actually) has been trending downwards for the past 3 TRE surveys. One of the main issues is spectrum. The dominant player remains PLDT/SMART. PLDT, now owning Smart, Talk & Text, Cure Mobile and if this pushes through by getting the NTC’s and Congress’s approval ‐ Digitel & Sun ‐ they will have control over a larger portion of the wireless spectrum compared to other entities. (Insert Aldaba table here)
In the mobile sector, the biggest concern is that PLDT/SMART has gained control over more frequencies than its primary competitors. A more recent development that occurred after the survey, was in fact PLDT gaining control over Digitel/Sun, which not only gave it a bigger size of the pie in terms of subscribers, but also more control over the national backbone, and frequencies.
Compared to other parts of the world like Europe, the Philippines, according to some stakeholders is not a spectrum‐scarce environment. However, the reason for the hype and spectrum‐grabbing is to stymie new telco players who may wish to enter the market, or even existing players (e.g. Globe) who may wish to expand relatively cheaply. Currently, the PLDT group controls a disproportionately large chunk of the currently available 3G/4G frequencies. This was the case when they had acquired CURE, and became even more pronounced a few weeks after the TRE survey when they gained majority control over DIGITEL/Sun. Some see this as effectively being “in restraint of trade” in the telecommunications market. Its primary competitor, Globe is now asking the NTC to "level the playing field" by looking into the possibility of redistributing communications frequencies evenly among competing telecommunications companies2. They pointed out that the ratio of the spectrum holdings of Globe and PLDT on the 3G 2100 MHz spectrum now stands at 1:3.5 in favor of the latter given its acquisition of Digitel‐Sun. Further, with PLDT controlling more than thrice as many 3G frequencies than Globe — it would be difficult for the latter to improve its services because of limited resources.
7.3 Interconnection
This section looks at how interconnection issues are addressed by the regulator. Respondents were
asked to rate whether interconnection with major operators is adequately ensured at any technically
feasible point in the network. They were asked to consider whether there are reasonable rates for
interconnection, there is unbundling of interconnection, and if these are offered without delay. Other
interconnection issues that they were asked to consider include the sharing of incoming and outgoing
IDD revenue, the payment for cost of interconnection links and switch interface and penalties for cost of
technical disruption of interconnection.
2 http://ph.news.yahoo.com/globe-ntc-redistribute-pldt-digitels-frequencies-201420341.html

In practiceAlthough interveneTelecommdiscrimina
One of thInterconnupcomingissues am
Perceptio
A larger dInternet Ewas launcPhilippineprimary csecond teTelecommand securtwo, netwCORE (CoIt had a lo
2.4
2.5
2.6
2.7
2.8
2.9
3
3.1
e, interconnethe governm
e extensively bmunications Aation clause i
e few areas wnection. In 20g third player,mong them ha
on with landlin
decline, howeExchanges in oched in July 1e Long Distanonnection to elco‐run exchamunications Prity and are alwork congestimmon Routinower level of s
2.9
2.6
4
5
6
7
8
9
3
1
2006
Figure
ection rates ament can impobecause of thAct. Hence, inn RA 7925 (A
where percep006, when the, Sun Cellulars been resolv
ne interconne
ver, was seenoperation. Th997. It is an ince Telephonethe global Inange is the MPhilippines (ETlso peered toon has been ng Exchange) service, altho
2.9
2
e 8: TRE Sc
re mutually nose rate ceilinhe provisions terconnectiolampay 2008
ption has trene major conce. With betterved.
ection, has de
n in the broadhe first is PhIXnterconnectioe Co. (PLDT) tternet, to acc
Manila InterneTPI) (Paraz & ogether. Althoa problem in which was o
ough it was co
22.8
2.9
2008
ores for Int
negotiated bengs, as in the cof RA 7925 an rates are m).
ded upwardsern was interr TRE scores t
eclined slight
dband busineX which standon or a netwohat allows loccess and exchet Exchange (MYu 2002). Boough this shothe past (Alaperated by thompletely fre
2.8
3.0
2.7
2011
terconnectio
etween telecocase of SMS balso known asmore or less se
s in the past tconnection ishis is reflectiv
ly in the fixed
ess. In the Phids for the Philork access pocal Internet Shange local InMIX), which isoth exchangeould make forampay 2008).he Philippine e of charge.
F3 ‐ FIXE
M3 ‐MO
B3 ‐ BRO
on
ommunicationbetween opes the Public et because of
three TREs hassues with theve of how Int
d line busines
lippines, therlippine Internoint establisheService Providnternet transas operated bys offer networ faster trafficA third exchaInternet FounIt was also ac
ED
OBILE
OADBAND
n operators. rators, it cann
f the non‐
s been in Moe then new aerconnection
s.
re are a numbnet eXchange,ed by the ders (ISPs), wiactions. The y the Eastern ork monitorinc between thange was callndation (PHNctually the ve
not
obile nd n
ber of , and
th a
ng e ed
Net). ry

first ISP innetwork wresearch aPhilippineit is maintinstitutionproject is without d2008).
Given thaA stakehoHe said: Bthere is a data fromcan look bbarely pla
7.4 Tariff
3 taken from
n the Philippinwas made thrand developme Open Interntained by a cons. Launched that Philippin
depending on
t there are a older illustrateBayantel is loslack of local d
m Bayantel mback to the Phay with someo
f Regulation
m e-group exch
2.3
2.4
2.5
2.6
2.7
2.8
2.9
3
nes, having strough the initment arm of tnet exchange onsortium of in January 20ne‐based Intetheir telecom
number of exed the problesing customerdata exchangust first leavehilippines andone who's on
n Figure
hanges.
2.9 2.9
2006
tarted in 1994tiative of the the Departme(PHOPENIX). commercial, 007, and operernet service mmunications
xchanges, proem it creates rs to PLDT bege PLDT & Baye the countryd talk to PLDTn PLDT becaus
9: TRE Sco
2.9 2.9
2008
4 (Paraz & YuApplied Scienent of Science It was meannon‐governmrated in April providers wils providers, e
oblems of inte with respectecause most oyantel (mean and pass thrT's servers). Ese of the high
ores for Tar
2.7
2.8
8 2
2002). The mnce and Techne and Technont to be operament, academof the same l be able to respecially dur
erconnectiont to the gaminof the playersning they donough internaEffect: when yh lag/latency.3
riff Regulati
2.8
2.5
2011
most recent anology Institulogy (DOST) tated as a neutmic and goveryear. The sigoute their traing major dis
n among themng industry ins are on PLDT n't talk to eachtional serversyou're on Bay3
ion
F4 ‐ FIXED
M4 ‐MOBI
B4 ‐ BROAD
addition to thute (ASTI), theto operate thtral institutionment nificance of taffic locally asters (Alamp
m is still apparn Internet cafeand becauseh other straigs and beforeyantel, you ca
LE
DBAND
he e e n, as
he
pay,
rent. es. e ght ‐ they an

Overall, coservices bdevices, acompetitodeals thatto fight foaggressive
While tradalready onwhose priP50 a dayUSB or moBroadbansimilar off
While all twas the laand pricesperceptio
7.5 Regu
PerceptioBroadbanthe Mobil
4 http://stop
year-for-pr 5 Ex.: Glob(P0.10/SMone day. Ssubscriber,Unlimited networks.
ompetition inbecome a matalmost all of tors. Customet are often infor market shae bucket offe
ditional revenn a decline, dices have alsoy, a Globe subobile phone fnd has its unlifering (one da
three sectorsargest declines in internet cons of value (e
lation of An
ons regarding nd. There wasle segment it
F
pthecap.com/2
rofits/
be’s Super All MS). Globe’s U
Smart Buddy’, 10 texts to othas free 30 m
Sun’s TextALL2.25
2.3
2.35
2.4
2.45
2.5
2.55
2.6
2.65
2.7
2.75
n cellular mobture market—he marketingers threateninfinitely renewre, particularrs5.
nue sources ldemand has bo been declinbscriber is givefor one day. Smited Interneay unlimited
s registered loe. This is ironicafes have alse.g. price vis‐à
nti‐competit
Anti‐compets also a signifiretained the
Figure 10: T
2011/01/10/the-
Txt 20 which,Unli Txt All Da’s AllTxt Comther networks, minutes of moL at P15 a day
2.5
2.4
5
3
5
4
5
5
5
6
5
7
5
2006
bile service in— with more tg from existinng to switch, fwable. 4 The trly in the mob
ike internatiobeen strong foing due to unen unlimited Smart also offet access profor P50) (Alda
ower TRE scoric, since the mso dropped, bà‐vis the qual
ive practice
itive practicecant drop in same low ov
RE Scores
-real-reasons-f
, for P20 a dayay allows one
mbo Plus at Pplus five min
obile Internetenables a subs
2.7
2
20
ntensified witthan 80 perceg providers taforce provideelecommunicbile sector lar
onal and natioor new revennlimited plansaccess to thefers unlimitedmo at P200 foaba, 2011).
res comparedmajor playersbut perhaps plity and speed
s
s were very lobother Fixed verall mark of
for Anti-Co
for-the-philippi
y allows a substo send unlim
P25 gives a sunutes of calling
on top of unscriber to send
2
2.5
2.7
008
h the entry oent of consumargets customers to offer stcations comprgely focused
onal long distue sources, bs and bucket e Internet usind mobile surfor five days. S
d to 2008, it w have also staperception of d of connectio
ow in all threand Broadbaf 2.5 (see Figu
ompetitive P
ines-Internet-o
scriber to send mited text mess
ubscriber 100 g. Sun Cellularnlimited Sun-to
150 text mess
.4
2.52.4
2011
f Sun Cellularmers already mers of their eeply discounanies (telcos)on unlimited
ance (IDD anbroadband Intofferings (Aldng a Globe Taing for P50 peSun Broadban
was in broadbarted to offertariffs is alsoons).
ee areas, Fixedand from 2008ure 10).
Practices
vercharging-20
200 text messsages to Globe
text messager’s P25 Superloo-Sun calls anages to any net
F5 ‐ FIXED
M5 ‐MOB
B5 ‐ BROA
r. But, as mobusing wireles
nted retentio) have contind plans and
d NDD) are ternet servicedaba, 2011). Fattoo Broadbaer day while Snd prepaid ha
band where thr bucket priceo connected t
d, Mobile and8 scores, whi
010-was-a-rou
sages to any nee/TM subscribees to another oaded Call and
nd 10 texts totwork.
D
BILE
ADBAND
bile s
n ued
es For and Smart as a
here es, o
d le in
gh-
etwork ers for Smart
d Text other

The PhilipState of th
At presenTelecommCongress lawmakeracquisitio
7.6 Unive
This sectiodiscriminauniversal service, b
The Philipaffordableto have benational d
ppines currenhe Nation Ad
nted, the key imunications Cis also becomrs argue that n.
ersal Service
on evaluates atory and comservice definut that of uni
Fi
ppine governme telecommueen left intendevelopments
0
0.5
1
1.5
2
2.5
3
tly does not hdress to Cong
institution invCommission. ming a key actthe franchise
e Obligation
whether the mpetitively need by the poliversal access
gure 11: TR
ment defines nications servntionally broas. Based on n
2.3
2.6
2006
have any antigress, this wa
volved in resoHowever, givtor, given thae Congress giv
ns
administratioeutral and is nlicymakers. Ins.
RE Scores f
universal accvices in all urad/vague to anationally set
2.7 2.62.
2008
‐trust legislatas one of the
olving disputeven the growit it is Congresves one comp
on of the univnot more burn the Philippin
for Universa
cess as the avban and rurallow for targe indicators (M
2.42..5
20
tion. Hence, legislations h
es remain to bing trend of mss that grantspany can not
versal servicerdensome thanes, the polic
al Service O
vailability of al areas (DOTCets to be adjuMTPDP, ICT St
.5
2.2
11
in President Ae wanted to
be the Nationmergers and as franchises abe simply tra
e program is tan necessary cy is not that o
Obligation
a minimum seC 2000). This usted with tectrategic Road
F6 ‐ FIXED
M6 ‐MOBILE
B6 ‐ BROADBA
Aquino’s firstprioritize.
nal acquisitions, nd some nsferred thro
transparent, nfor the kind oof universal
et of reliable adefinition seechnological anmap of CICT)
AND
t
ough
non‐of
and ems nd ,

with a wide set of access types and services. Further, the purpose for access is defined as access to “basic government services”, information, and quality education through ICTs”. However, it is not very clear what constitutes the basic services and information that the government aims to provide (Lallana and Soriano 2007).
The TRE scores for universal access all declined for the three sectors. The score for Fixed services has significantly declined. This could be because since the SAS, in 1993, there has really been no new policy for universal access to the fixed phones, and this issue has already been superseded by the dramatic increase in access to mobile phones.
The score for Mobiles is the highest among the three, and also showed the slightest decline from 2008. In fact, for the past three TREs, the score for mobiles has remained practically the same. This could be because there are no policies that call for universal access to mobiles, given that even in the absence of such a policy, there has been a high penetration rate with respect to access to mobiles and access continues to rise (see Figure 3).
It is universal access to broadband services that had the lowest score. This is indicative of the challenges and real state to broadband in the country today. Access to broadband services is dependent on the fiber infrastructure and mobile broadband services in the country. Access to the backbone infrastructure of these networks is crucial for connecting to the last mile. Table 2 summarizes the availability of broadband infrastructure in Philippine provinces. It shows that more than a fifth of provinces in the country do not have a fiber infrastructure for Broadband services, and a third (33%) do not have access to 3G/HSPA Mobile services.
Table 2: Summary of Fiber Infrastructure and Mobile Broadband services Provinces w/ Fiber Infrastructure Provinces w/ 3G/HSPA Mobile Services
At least one operator
None 2 or more operators
At least one operator
None 2 or more operators
63 17 38 54 26 18
79% 21% 48% 68% 33% 23%
Source: Intelecon 2010
Highlighted in the next table (see Table 3) are the demographic conditions of those provinces that still do not yet have fiber connectivity. As would be expected, these tend to be among the lowest income and lowest population density locations in the country. The absence of connectivity in these Regions are reflected in the problems faced by some projects and programs, such as connecting schools and in the government’s Community e‐Center (CEC) program (Townsend and Alampay 2011).

According to CICT Commissioner Frank Perez the government is currently in the process of drawing up a telecoms/broadband roadmap. He says that this process will be more transparent and will be done with the open consultations with the public.6
Table 3: Provinces without Fiber connectivity
Region Provinces Per cap income (Php) (National average:
Php 27,442)
Population
II Cagayan Valley Batanes, Quirino
29000‐33000 180,000
III Central Luzon Bataan 31000 662,000
IV‐B MIMAROPA Palawan, Marinduque, Oriental Mindoro
17000‐20000 1,858,000
V Bicol Catanduanes 18000 233,000
VII Central Visayas Siquijor 24000 88,000
VIII Eastern Visayas Eastern Samar 16000 405,000
XI Davao Davao Oriental 18000 405,000
XII SOCSARGEN Sarangani 16000 475,000
CARAGA Surigao del Norte, Surigao del Sur, DInagat Islands
18000‐19000 1,072,000
ARMM Basilan, Tawi‐tawi, Sulu
6000‐12000 1,708,000
Source: Intelecon 2010
6 Commissioner Perez said this in the Forum about the PLDT‐Digital Deal and Beyond: Public Interest Implications and Alternatives, held on 11 April 2011, at the National College of Public Administration and Governance, U.P. Diliman, Quezon City

7.7 Quali
Quality ofsecond timhas declin
One probeither notbetween tnational eelectoral that was n
respect toneed to lobrought afrequency
7 http://stop
year-for-pr
0
1
2
3
ity of Servic
f Service was me the metricned, with very
lem with Mot been set, orthe two are aelections, for results, the Cneeded for th
o mobiles, theook into: “theabout by the uy of dropped
pthecap.com/2
rofits/
2.9
0
0.5
1
1.5
2
2.5
3
3.5
F7 ‐
e
a recent metc has been asy large drops
bile and Broar has not beenalso blurring ainstance, wh
COMELEC notehe transmissio
Figure 1
e current CICTe deterioratinunlimited placalls, delayed
2011/01/10/the-
2.7
FIXED
tric that was asked. In all thin the scores
adband sectorn measured oas mobile broere access toed that 30% oon of results.
12: TRE Sco
T Chairman, Ag service avans. Customerd SMS, and lin
-real-reasons-f
3.2
2.7
M7 ‐MOBI
added to the hree categories for mobile a
r is that clear or reported woadband beco mobile serviof the country
ores for Qu
Atty. Ivan Uy ilability or acr dissatisfactione unavailabi
for-the-philippi
27
LE B7 ‐ B
TRE survey ines, perceptiond broadban
standards fowith regularityomes more ances was cruciy did not hav
ality of Serv
has been quocessibility duon has been rlity.”7 As suc
ines-Internet-o
2.7
2.3
BROADBAND
n 2008. Hencens regarding d service qua
or measuring ty. Likewise, thnd more popuial in the trane any reliable
vice
oted as sayinge to networkrising becaush, while acce
vercharging-20
2008
2011
e, this is only quality of serality.
their quality hhe distinctionular. In the rensmission of e cellular sign
g that there isk congestion e of higher ss to mobiles
010-was-a-rou
the rvice
has s ecent
nal
With
s a
s has
gh-

improved significantly, network congestion and bucket offerings may have started to affect the quality of services.
For broadband, recent tests on the quality of broadband access in the Philippines are also indicative of poor quality of services. LirneAsia, in its latest Quality of Service Experience (QoSE) report), compared download speeds, Round Trip Time (RTT, or the time delays in data transfer), Jitter (the variation in time between the arrival of data packets) and Packet Loss (the percentage of data packets that did not reach its destination) of broadband packages in 11 cities across 7 countries in South and Southeast Asia. In this test, Smart’s 2 Mbps package in Manila failed to deliver the download speed advertised. Also, from a regional perspective, the BayanDSL package failed to impress with a maximum of just 35 Kbps per US$. This is consistent with Internet world statistics that find that in terms of average Internet broadband download speed alone, the Philippines lags behind roughly two‐thirds of the world. The country is bested not just by world superpowers such as China and the U.S., it is also surpassed by small countries such as Lithuania and Kenya, and ranks 139 out of 185 countries.8
Further, with respect to broadband, there have been a series of consultations from late 2010 to early 2011 about service standards (See Annex on Key regulatory events). In December 2010, the NTC drafted a Memorandum Order on the Minimum Speed of Broadband Connections. In this draft order, it was proposed that broadband service providers shall specify the minimum broadband/Internet connection speed and service reliability and the service rates in their offers to consumers/subscribers/users in their advertisements, flyers, brochures and service agreements and service level agreements. The minimum service reliability shall be 80%. It also said that service providers may offer broadband/Internet connection on a “best efforts” basis. What became controversial, was the provision that said service providers “may set the maximum volume of data allowed per subscriber/user per day.” However, on January 12, 2011, with mounting public pressure, the NTC removed the Internet Data Cap provision from the proposed memorandum circular on minimum speed of broadband connections saying it is counter‐productive to increasing the Internet usage in the country.
Given that these issues were being discussed only a few weeks before the TRE, respondents may have retained stronger sentiments about it. As such, this explains the very large drops in perception for both mobile and broadband Quality of Service. A few months after the TRE, given the absence of a law that actually prohibitted them from doing so, Ayala‐led Globe Telecoms still pushed ahead with data capping by invoking a “fair use" doctrine in imposing a data limit on the Internet subscription of its customers as a supposed way to curb unrestrained use of just a few broadband users.9
That said, it is interesting that not only does the Philippines lag behind most countries in terms of Internet speed but now some telecom companies are limiting downloads. Some stakeholders view these daily download caps to be due to deficient infrastructure or over‐subscription. This kind of strategy is a
8 http://www.gmanews.tv/story/210108/infographic‐the‐state‐of‐broadband‐Internet‐in‐the‐philippines‐and‐the‐world 9 http://www.gmanews.tv/story/216965/technology/globe‐moves‐to‐cap‐Internet‐data‐volume

stop‐gap that does not cost the telcos while temporarily improving Quality of Service for subscribers. Some see it as another mechanism to protect companies from investing in costly upgrades in its infrastructure.10
Summary/Conclusions
For this TRE, broadband seems to be the major concerns among all stakeholders. Business sees this as the next growth areas, while consumers are demanding and becoming more discriminating about the quality and cost of this service. Further, as what has happened in voice, access to broadband in a archipelago of many islands such as the Philippines, would most likely spread faster through wireless technologies. Hence, in some cases, distinction between mobile and broadband issues emerge.
Recent developments, particularly the acquisition of PLDT/SMART of Digitel, a few weeks after the TRE also raise important concerns about the telecommunications regulatory environment. Foremost among these are issues about access to scarce resources, particularly control over 3G frequencies. This issue then connects to other issues LirneAsia is concerned about in the TRE: such as fair competition, whether it would actually improve the quality of services, whether it leads to lower costs, and in the long run, whether it leads to the country getting universal access to broadband in a faster and more efficient manner.
Definitely, given the trend towards mergers and acquisition in the telecommunications industry, not only in the Philippines, but in other places as well, the landscape is changing and how the NTC, and to some extent Congress, handles it and developments thereafter would be worth watching. This is also why, the President’s push for anti‐trust legislation is also important in the long‐run.
10 http://stopthecap.com/2011/01/10/the-real-reasons-for-the-philippines-Internet-overcharging-2010-was-a-rough-
year-for-profits/

Annex 1: TRE Survey Methodology The TRE asks senior level stakeholders to assess the Telecom Regulatory Environment in a country across a number of dimensions (listed below).
It makes considerable effort to keep to a small number of questions because the ideal respondents are senior managers, including CEOs of operators. A lengthy questionnaire runs the risk of being ignored or passed to more junior staff to complete.
The respondents are asked to rate the quality of the regulatory environment for each dimension on a scale ranging from 1 (highly ineffective) to 5 (highly effective). So the respondent has to select a score (1, 2, 3, 4 or 5) and simply circle it (or click, in the case of a web-based survey). Posing questions in this format ensures that responses can be easily analysed without losing any qualitative information as often occurs when using open-ended questions.
The TRE survey is administered at the same time in multiple countries (nine in the 2008 survey, six in the 2006 cycle) by a team of researchers. The survey questionnaire is sent out with a cover letter stating that participation is voluntary and that respondent’s confidentiality is guaranteed.
Each survey questionnaire is accompanied by a short narrative statement describing each of the dimensions, using language from the accompanying Reference Paper as much as possible. A brief summary of significant telecom policy and regulatory actions that were taken within the previous 12 months is also included.
Questionnaires are sent to large number respondents representing agreed-upon sector categories. Follow-up emails and phone calls are made to ensure a high response rate.
While the TRE Scores are the most direct output of a TRE study, more meaningful analysis is done by analysing the TRE scores in light of actual sector performance indicators for a particular country.
The three sectors From 2008 onwards, TRE surveys are designed to address three sectors – fixed, mobile and broadband (prior to 2008, only the mobile and fixed sectors were surveyed).
It has been argued that with increased fixed-mobile convergence, the separation between the fixed and mobile sectors is irrelevant. While this was apparent in the 2008 survey findings, regulation of fixed sectors still remains different to the regulation of the mobile sector in several countries. Therefore analyzing them separately may be quite important. Indeed, the convergence of fixed and mobile TRE scores will be one of the best pieces of evidence on actual (as opposed to wishful) fixed-mobile convergence. On the other hand, India has now converged regulation of the two sectors; so, for this country, the two sectors are treated as one and it may be appropriate to send out a joint “fixed + mobile” questionnaire instead of two separate questionnaires.
As previously mentioned, in addition to the fixed and mobile sectors, the broadband sector was added to the 2008 survey. In the developing world, broadband access is emerging as a new

ground for policy making and private sector service provision. Unlike the developed world, broadband may not mean the traditional fat pipe is reaching homes. Instead, most access may come from mobile broadband. Therefore, the term broadband refers to multiple modes of accessing the higher speed Internet – be it through mobile phones, other mobile devices, Internet kiosks or home PCs. Given that the survey is predominantly conducted in emerging economies, we take the lowest (slowest) commonly accepted definition of Broadband, which defines it as “an ‘always on’ Internet connection with a minimum download/upload speed of 256kbps” (OECD 2007).
As noted above, all three sectors may not be applicable to all countries. Furthermore, other minor definitional changes may also need to be made. These country-specific variations to the methodology should be discussed with LIRNEasia/RIA!/DIRSI or the relevant coordinator and agreed upon prior to conducting the survey.
The seven dimensions For each of the three sectors mentioned above, the respondent will assess (i.e. provide a score on a scale of 1 – 5 for) each of the following seven dimensions:
1. Market entry
2. Allocation of scarce resources
3. Interconnection
4. Regulation of anti-competitive practices
5. Universal service obligation
6. Tariff regulation
7. Quality of Service
Of these, the first five dimensions are based on the Reference Paper of the Fourth Protocol of the General Agreement on Trade in Services and reflect the broadest international consensus of the most important aspects of telecom regulation.11
Tariff Regulation was added following pilot studies and input from researchers.
Based on early 2008 discussions at LIRNEasia, it was agreed that Quality of Service (QoS) is increasingly important. While the traditional (incumbent-led) fixed sector always had basic QoS measurements, increasingly QoS for mobile is becoming important – for example, completing a financial transaction via the various m-payment methods is only feasible if the mobile signal does not drop half-way through the transaction. Similarly, depending on the application being used, Broadband QoS becomes increasingly important (e.g. simply browsing can tolerate higher levels of latency that VoIP applications simply cannot). At the moment, objective measures for 11 The WTO Reference Paper also contains a dimension for independence of the regulator. However because it is seen as a process variable different from the other outcome variables, it is not included in the TRE dimensions.

measuring Broadband and Mobile QoS are neither common nor standardised. However, meaningful perception measures about regulation relating to QoS can go a long way in putting QoS on the regulatory and policy agendas.
The Likert Scale Using the Likert Scale, each of the seven dimensions is scored on a scale of 1 to 5, where 1 is Highly Ineffective and 5 is Highly Effective. The Likert Scale is a well-known psychometric response scale often used in questionnaires.
The raw data collected for the survey using the Likert Scale is ordinal data and, therefore, the distinction between neighbouring points on the scale is not necessarily always the same. For instance, the difference in effectiveness expressed by giving a score of 4 rather than 3 might be much less than the difference in effectiveness expressed by giving a score of 5 rather than 4.
Since the data collected is summarised in the final TRE scores, it is possible to transform the 1 to 5 scale to a different scale like -2 to 2 which makes it easier to interpret. However, there is a possibility that a transformed scale portrays a different level of perception to the respondent. For example, giving a score of 3 in a 1 to 5 scale and giving a score of 0 in a -2 to 2 scale might not appear the same for some respondents. Therefore it is recommended that the 1 to 5 scale be kept constant in doing the TRE survey.
Clearly, the Likert Scale may be subject to distortion. Respondents may avoid extreme scores (central tendency bias); or may try to portray themselves or their organisation in a more favourable light (social desirability bias).
The Respondents: Categories, Weights, Minimum Numbers
Categories The different stakeholders that are involved in the TRE have been grouped into three categories according to their common interests.
• Category 1: Stakeholders directly affected by telecom sector regulation
o E.g. Operators, Industry associations, Equipment suppliers, Investors
• Category 2: Stakeholders who analyse the sector with broader interest
o E.g. Financial institutions, Equity Research Analysts, Credit Rating Agencies, Telecom consultants, Law firms
• Category 3: Stakeholders with an interest in improving the sector to help the public
o E.g. Academics, Research organisations, Journalists, Telecom user groups, Civil society, Former members of regulatory and other government agencies, Donors, Current government employees from organizations related to the telecom sector EXCLUDING those in the telecom regulatory & policy hierarchy (i.e. excludes anyone from the regulatory agency, policy making body (often Ministry of Post and Telecom or similar), the Minister in charge of Telecommunications etc.)

Note that certain Financial Institutions (listed in category 2) may take an equity stake in an operator and, thereby, may also be an Investor (category 1). It could also be that within the same financial institution, respondents from one unit (say, the Equity Research division) falls into Category 2 (since they analyse the sector as a whole) while another unit (say, the Investment/Asset Management division that owns shares of the operator) falls into Category 1. In such instances the researcher must deal with the categorisation of respondents on a case-by-case basis.
Weights Contributions from each category are of identical importance to the final TRE scores. Therefore, if there are an equal number of respondents for each category, the TRE Assessment will reflect the views of the respondents of each category in an equal manner.
However, if response rates differ and the sample selection procedure does not produce an equal numbers of respondents from each category, then an overrepresentation of some categories and underrepresentation of others will result. This will cause problems in comparison.
Ideally, each category should make the same contribution to the final result. In order to achieve this balanced representation, overrepresented categories are given a weight of less than one and underrepresented categories are given a weight of greater than one, in such a way that all three categories equally contribute to the final score.
Minimum number of respondents Even though weighting deals with numerical imbalance, it is important to have a sufficient number of respondents for all three categories because the sample size determines the precision with which population values can be estimated; i.e. the larger the sample, the more precise the estimate. As a practical matter, sample size is often the dominant factor in determining the precision because very few respondents from a particular category will make the final TRE score highly sensitive to each respondent’s input in that category.
Having taken the above factors in to account, as well as the practical constraints associated with the survey, it is necessary to have a minimum of 15 respondents from each category in any country (for a minimum of 45 total respondents). Only in micro-states (e.g. Bhutan, Maldives and countries with populations of under or around 1 million), a minimum of 5 respondents from each category is accepted (for a minimum of 15 total respondents).
Having a larger number of respondents per category also allows more sophisticated analysis without compromising the respondent’s anonymity. For example, category 1 represents players who are already in the market. Certain regulatory regimes may unduly favour those who have already passed (by whatever means) the barrier to entry. For these respondents, overly cumbersome market entry procedures may indeed serve as a positive and keep new entrants out. However to analyse at the level of respondent categories, a larger data set is required.
All in all, there were 59 respondents broken down into the following per Category:

Table _: Respondent Breakdown
Category No. of Respondents Category 1 19 Category 2 11 Category 3 29 TOTAL 59
Most of the respondents for the survey answered online. Only eleven (11) people answered the survey manually.

Annex 2: Summary of Regulatory and Policy Events for the Philippines January 2010-January 2011
Date Subject
26 Jan 2011 An Act Providing for the Establishment of the No Calls and No Text Registration System was filed in the Lower house.
26 Jan 2011 Some groups debate prepaid SIM registration amidst terrorist bombing of a public bus in Manila.
21 Jan 2011 President Aquino is reported to have retained NTC Commissioner Gamaliel Cordoba as Head of the NTC.
Also, Carlo Jose A. Martinez was named deputy commissioner while Delilah F. Deles was appointed as acting commissioner for the NTC.
12 Jan 2011 The NTC removes the Internet Data Cap provision from the proposed memorandum circular on minimum speed of broadband connections saying it is counter‐productive to increasing the Internet usage in the country.
12 Jan 2011 A House Resolution was filed ‘Urging the NTC to Scrap Its Proposed Imposition of a Ceiling on Internet Speed and on the Amount of Data Broadband Users Can Download Per Day’.
11 Jan 2011 NTC continues public consultation regarding the minimum speed of broadband connections
21 Dec 2010 NTC holds public consultation regarding the minimum speed of broadband connections
December 2010
NTC proposes to cap broadband data (see below) Draft memo: MEMORANDUM ORDER on the MINIMUM SPEED OF BROADBAND CONNECTIONS 1. Broadband service providers shall specify the minimum
broadband/Internet connection speed and service reliability and the service rates in their offers to consumers/subscribers/users in their advertisements, flyers, brochures and service agreements and service level agreements. The minimum service reliability shall

be 80%. Service Reliability is measured over a period of one (1) month and calculated as :
(Hours in a day x Days in a month) – (Time Internet connection speed is below minimum) (Hours in a day x Days in a month)
The service offers shall specify the service rates for a minimum broadband/Internet connection speed and the service reliability, e.g., PhP900.00/month for 512Kbps minimum connection speed and 80% service reliability, PhP1,000.00/month for 512Kbps minimum connection speed and 85% service reliability, etc.
2. Service providers may offer broadband/Internet connection on a “best efforts” basis.
3. The subscribers/consumers shall be properly informed of the broadband/Internet connection service being offered to them.
4. Service providers offering committed information rate (CIR) shall comply with NTC MC No. 12‐19‐2004.
5. Service providers may set the maximum volume of data allowed per subscriber/user per day.
26 August 2010
House Bill 02858/An Act Abolishing the Interconnection Charges Imposed by Telecommunications Companies, Amending for the Purpose RA No. 7925, Otherwise Known as the ‘Public Telecommunications Policy of the Philippines’, was filed.
10 August 2010
House Bill 02380/An Act to Prohibit Cell Phone Network Companies from Sending Unsolicited Material to their Subscribers via Text or Short Message Service (SMS), was filed.
09 August 2010
House Bill 02253/An Act Mandating the NTC to Install a Regulatory Metering Device to Interlink with the Telecommunications Industry Players as an Enhancement to Its Supervisory Functions, and for Other Purposes, was filed.
August 2010 Lawmaker proposes to regulate Facebook and Twitter use in government agencies
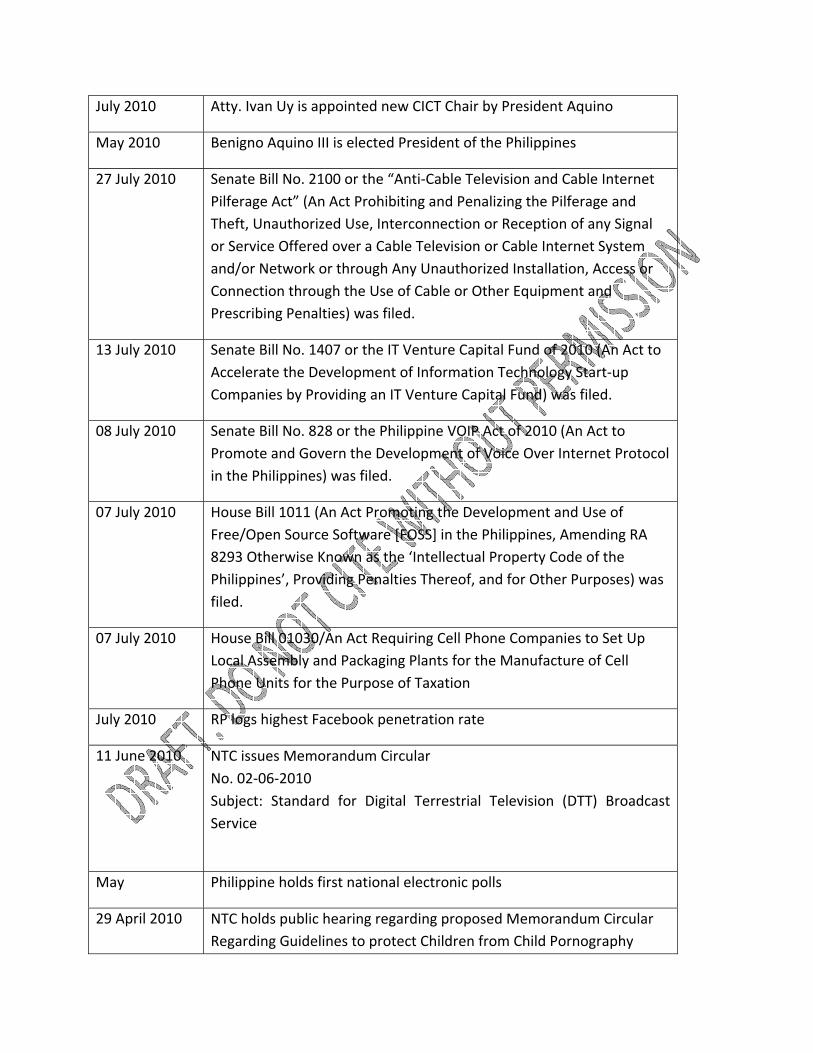
July 2010 Atty. Ivan Uy is appointed new CICT Chair by President Aquino
May 2010 Benigno Aquino III is elected President of the Philippines
27 July 2010 Senate Bill No. 2100 or the “Anti‐Cable Television and Cable InternetPilferage Act” (An Act Prohibiting and Penalizing the Pilferage and Theft, Unauthorized Use, Interconnection or Reception of any Signal or Service Offered over a Cable Television or Cable Internet System and/or Network or through Any Unauthorized Installation, Access or Connection through the Use of Cable or Other Equipment and Prescribing Penalties) was filed.
13 July 2010 Senate Bill No. 1407 or the IT Venture Capital Fund of 2010 (An Act to Accelerate the Development of Information Technology Start‐up Companies by Providing an IT Venture Capital Fund) was filed.
08 July 2010 Senate Bill No. 828 or the Philippine VOIP Act of 2010 (An Act to Promote and Govern the Development of Voice Over Internet Protocol in the Philippines) was filed.
07 July 2010 House Bill 1011 (An Act Promoting the Development and Use of Free/Open Source Software [FOSS] in the Philippines, Amending RA 8293 Otherwise Known as the ‘Intellectual Property Code of the Philippines’, Providing Penalties Thereof, and for Other Purposes) was filed.
07 July 2010 House Bill 01030/An Act Requiring Cell Phone Companies to Set Up Local Assembly and Packaging Plants for the Manufacture of Cell Phone Units for the Purpose of Taxation
July 2010 RP logs highest Facebook penetration rate
11 June 2010 NTC issues Memorandum Circular No. 02‐06‐2010 Subject: Standard for Digital Terrestrial Television (DTT) Broadcast Service
May Philippine holds first national electronic polls
29 April 2010 NTC holds public hearing regarding proposed Memorandum Circular Regarding Guidelines to protect Children from Child Pornography

7 April 2010 NTC issues Draft Guidelines to protect Children from Child Pornography
Feb 2010 COMELEC reports 30% of RP has no reliable cell signal
19 Feb 2010 NTC issues updates on Memorandum Circular regarding Rules on the Assignment of the remaining allocated 3G radio Frequency Band
18 Feb 2010 The NTC conducts public hearing regarding Rules on the Assignment of the remaining allocated 3G radio Frequency Band
4 February 2010
The NTC issues Memorandum Order 001‐02‐2010 on the
Prohibition of Cellular Phone Jamming Devices

References Alampay, E. (2003) “Text 2920/117: Reporting Police Wrongdoing via SMS in the Philippines” eGovernment for
Development eTransparency Case Study No.12, http://www.e‐devexchange.org/eGov/text2920.htm
Alampay, E. (2008) Telecom Regulatory and Policy Environment in the Philippines: Results and Analysis of the 2008 TRE Survey, LirneAsia
Alampay, E. (2008b) Filipino entrepreneurs on the Internet: when social networking websites meet mobile commerce. Presented at the National University of Singapore, April 24, 2008.
Alampay, E. and G. Bala (2010) Mobile 2.0: M‐Money for the BOP in the Philippines, Information Technologies & International Development, Volume 6, Number 4, Winter 2010, 77–92
Aldaba, F. (2011). PLDT‐Sun Acquisition (Part 1 of 2), Action for Economic reforms (April 4, 2011), Business World accessed April 21, 2011: http://aer.ph/?p=4029.
Aldaba, F. (2011b). PLDT‐Sun Acquisition: Good or Bad? (Part 2 of 2), Action for Economic reforms (April 11, 2011), Business World, accessed April 21, 2011: http://aer.ph/?p=4029.
Bangko Sentral ng Pilipinas (BSP). (2009). Guidelines governing the issuance of electronic money and the operations of electronic money issuers. Circular No. 649, series of 2009. Manila: BSP
Business Processing Association of the Philippines (BPAP) (2007) Philippines Offshoring & Outsourcing Roadmap 2010, BPAP.
CSC (2003) Improved Service Delivery through Short Messaging System (SMS): The Philippine Experience. Paper presented during the meeting of the ASEAN Conference on Civil Service Matters held Oct 29‐Nov. 2 in Ho Chi Minh City, Vietnam. CSC Executive Letter Vol. 13, No.1
Intelecon (2010) Final report to simulate ICT Universal Service, report submitted by Intelecon to CICT (January 2010)
Intelecon (2010b) The Philippines: Case Study Report ‐ Mobile Applications for Rural Development , submitted to the World Bank
Lallana, E.C. (2004) SMS in Business and Government in the Philippines. ICT4D Monograph Series No. 1. ICT4D.ph, Department of Science and Technology.
Mendes, S; E. Alampay, E. Soriano and C. Soriano (2007) The innovative use of mobile applications in the Philippines‐ lesson for Africa. Department for Infrastructure and Economic Development. SIDA.
Montecillo, P. (2011). Traditional telco revenue sources declining: PLDT net profit down 6% in Q1; Globe’s up 1 Posted: 10 May 2011, accessed on May 11, 2011 at http://business.inquirer.net/money/topstories/view/20110510‐335765/Traditional‐telco‐revenue‐sources‐declining
Pascua, S.N. S., Zagado, R. G., Asis, O.R. M., Domingo, O. C., and Maloles, J. S. (2010) Enhancing Knowledge Networking through Short Messaging Service: The Farmers’ Text Center Experience, Philippine Rice Research Institute.

Reyes, M. "A year of changing dynamics."Philippine Star, Dec. 30, 2010. Accessible online at: http://www.abs‐cbnnews.com/business/12/29/10/2010‐year‐changing‐telecommunications‐market‐dynamics (accessed May 13, 2011)
Townsend, D and E. Alampay (2011) Rural ICT Policy Advocacy, Knowledge Sharing, and Capacity Building: Country Case Study‐ Philippines Final Report (March 2011), Asian Development Bank.