Embed Size (px)
Citation preview

ICT USAGE BY ENTERPRISES AND
HOUSEHOLDS 2010
National Statistics Office, Malta 2011

Published by the
National Statistics Office Lascaris
Valletta, VLT2000 Malta
Tel.: (+356) 25997000 Fax: (+356) 25997205 e-mail: [email protected]
http://www.nso.gov.mt
CIP Data ICT usage by enterprises and households 2010. – Valletta: National Statistics Office, 2011 x, 54p. ISBN: 978-99957-29-12-7 (print) 978-99957-29-13-4 (online) For further information, please contact: Unit C3: Information Society and Tourism Statistics Directorate C: Social Statistics and Information Society National Statistics Office Lascaris Valletta VLT2000 Malta Tel: (+356) 25997529 NSO publications are available from: Unit D2: External Cooperation and Communication Directorate D: Resources and Support Services National Statistics Office Lascaris Valletta VLT2000 Malta Tel: (+356) 25997219 Fax: (+356) 25997205 ______________________________________
Printed at the Government Printing Press

Foreword
Information and Communication Technology (ICT) is a rapidly evolving sector, for which statistical standards and definitions need to be revised and adapted continuously. As the official data collector on ICT, the National Statistics Office prides itself in keeping abreast of the latest developments in ICT, and presenting these to the user in a meaningful way.
For the first time ever, therefore, the NSO is publishing a set of key ICT indicators following separate surveys conducted in 2010 on the usage of such technology in households, by individuals, and by enterprises. The collection of data on the information society corresponds to the framework Regulation (EC) 808/2004, which ensures that the data are harmonised across all EU Member States.
Variables found in this publication include the number of households with access to a home computer and to internet, internet penetration, internet selling and purchasing by industry, and business use of broadband technology, to name but a few. The data aspects collated correspond with the main aims of i2010, a European Information Society strategy for growth and employment, a key element of the so-called renewed Lisbon Strategy.
I take this opportunity to thank Ms SueAnn Scott and Mr Matthew Zerafa for compiling this interesting and useful publication.
Michael Pace Ross Director General May 2011
iii

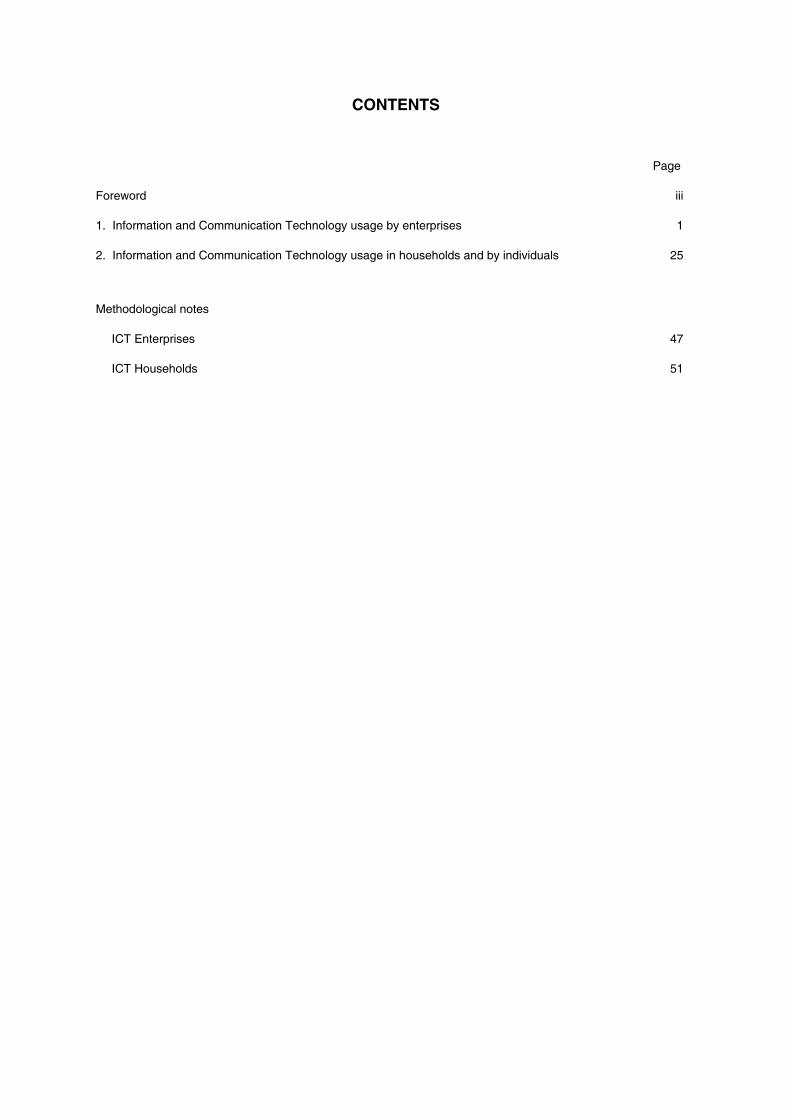
CONTENTS Page
Foreword iii
1. Information and Communication Technology usage by enterprises 1
2. Information and Communication Technology usage in households and by individuals 25
Methodological notes
ICT Enterprises 47
ICT Households 51


TABLES AND CHARTS
Page
1. Information and Communication Technology usage by Enterprises 1
Introduction 3
Computer use 5
T1.1 Computer use by enterprises 5
T1.2 Computer use by enterprises with 10-49 employees - FTE 6
T1.3 Employees using the computer at work 6
T1.4 Employees using the computer at work (enterprises with 10-49 employees – FTE) 7
T1.5 Availability of Local Area Network (LAN) 7
T1.6 Availability of wireless LAN 8
T1.7 Availability of an intranet 8
T1.8 Availability of an extranet 9
T1.9 Use of third party free or open source operating systems 9
Internet use 10
T1.10 Internet use by enterprises 10
T1.11 Internet use for enterprises employing 10 to 49 persons: FTE 11
C1.1 Types of Internet connection: January 2010 11
C1.2 Types of Internet connection: January 2009 11
T1.12 Employees using Internet at work 12
T1.13 Use of the Internet by enterprises for banking and financial services purposes 12
T1.14 Use of the Internet by enterprises for training and education purposes 13
T1.15 Percentage use of e-Government services by enterprises 13
T1.16 E-Government usage by type of service 14
T1.17 Enterprises with a website or home page 14
T1.18 Facilities present on enterprises’ Website or Home Page 15
T1.19 Enterprises using digital signatures in outgoing messages 15

Page
Electronic share of information 16
T1.20 Electronic transmission of data between enterprises 16
T1.21 Type of information received electronically 17
T1.22 Electronic share of information with enterprise suppliers and customers: January 2010 17
T1.23 Electronic information share 18
T1.24 Method used to share information electronically: January 2010 18
T1.25 Automatic share of information within the enterprise by reason for use 18
T1.26 Availability of Enterprise Resource Planning (ERP) software 19
T1.27 Availability of Customer Relationship Management (CRM) software 19
C1.3 CRM features 20
E-Commerce 20
T1.28 Enterprises conducting sales via e-Commerce 20
T1.29 Turnover from e-Commerce Sales 21
T1.30 Percentage of e-Commerce sales 21
T1.31 Enterprise conducting purchases via e-Commerce 22
T1.32 E-Commerce Purchases 22
Internet security 23
T1.33 Enterprises with an ICT policy: 2010 23
T1.34 Risks addressed in ICT policy: 2010 24
T1.35 Enterprises’ efforts to instil ICT security among staff members: 2010 24
T1.36 ICT security-related incidents in enterprises: 2010 24
T1.37 Use of internal ICT security facilities or procedures: 2010 24

Page
2. Information and Communication Technology usage in households and by individuals 25
Introduction 27
Households: Computer and Internet access in households 29
T2.1 Households with access to a computer at home 29
T2.2 Households with access to the Internet at home 30
C2.1 Devices used to access the Internet form home: 2010 30
T2.3 Type of Internet connection in the household 31
C2.2 Type of broadband connection: 2010 31
C2.3 Reasons for not having access to the Internet at home: 2010 31
Computer use by individuals 32
T2.4 Profile of individuals having computer access at home: 2010 32
T2.5 Length of time since last use of a computer 33
T2.6 Profile of computer users 33
T2.7 Computer users by user frequency 34
C2.4 Places where individuals used computers during the first quarter 34
Internet use by individuals 35
E-Government 35
T2.8 Profile of Individuals with access to the Internet at home: 2010 36
T2.9 Length of time since last use of the Internet 37
T2.10 Profile of Internet users 37
T2.11 Frequency of Internet use 38
C2.5 Places where individuals used the Internet during quarter 1 38
T2.12 Activities for which the Internet was used: 2010 39
T2.13 Use of e-Government service 39
T2.14 Profile of e-Government users 40

Page
E-Commerce 41
T2.15 Profile of e-Commerce users 41
T2.16 Type of goods or services bought or ordered over the Internet 42
T2.17 Type of goods downloaded over the Internet 42
T2.18 Origin of goods or services purchased over the Internet 43
C2.6 Percentage of online gaming 43
E-Skills and Internet security 44
T2.19 Assessment of individual e-Skills: 2010 44
T2.20 Participation in formal computer training lasting at least 3 hours: 2010 44
T2.21 Recipients of computer training in the last three years 45
T2.22 Individuals’ concern with Internet related problems: 2010 46
T2.23 Security related problems experienced by individuals through Internet use: 2010 46
T2.24 Security concerns hindering the performance of particular online activities: 2010 46

1. Information and Communication Technology usage by Enterprises
2010


Introduction The survey on information and communication technology (ICT) usage by enterprises,conducted during the first quarter of 2010, targeted enterprises employing a minimum of 10persons, based on full-time equivalents (FTE). A list of the NACE categories targeted in thisstudy is available in the methodological notes. The aim of this research was to analyse theextent to which enterprises rely on the use of ICT in the running of their day-to-day businessactivities.
Results for January 2010 showed that 96 per cent of enterprises had access to a computer while94 per cent also had access to the Internet.
3


Table 1.1. Computer use by enterprises
Absolute2010 2009 2010
Total 1,249 95.8 95.7 -0.1
Size class:
10-49 995 94.8 94.6 -0.2
50-249 210 100.0 100.0 0.0
250+ 44 100.0 100.0 0.0
Main economic activity:
Manufacturing 245 92.9 96.1 3.2
Construction 116 92.8 87.6 -5.2
Wholesale and retail trade 412 98.6 99.0 0.4
Transportation and storage 77 98.0 98.3 0.3
Accommodation and food service activities 133 92.9 87.4 -5.5
Information and communication 60 97.3 100.0 2.7
Professional, scientific and technical activities 114 100.0 98.6 -1.4
Administrative and support service activities 71 95.2 95.1 -0.1
Other u 21 95.7 100.0 4.3
% total Percentage change
Computer use During the reference period, 96 per cent of enterprises had access to a computer, at par with theestimate for 2009. From a size class point of view, all medium and large enterprises (those with atleast 50 employees) made use of computers, as in the previous year. On the other hand, a minordrop was recorded in the case of small enterprises (Table 2). At the same time, 48 per cent ofemployees (based on FTE) made use of a computer at work, an increase of 3 percentage pointswhen compared to January 2009 (Table 3).
Enterprises having a third party free or open source operating system were estimated at 12 per cent,a slight increase when compared to the corresponding period in 2009 (Table 4). Furthermore,enterprises using a local area network (LAN) stood at 84 per cent, while enterprises using a wirelessLAN reached 46 per cent during January 2010 (Tables 5 and 6). Increases were recorded in the useof both computer network technologies. The survey showed that 29 per cent of enterprises had aninternal home page facility, known as an Intranet, while a further 29 per cent were able to offerExtranet facilities, that is, a website or Intranet extension allowing exclusive access to businesspartners (Table 8).
5
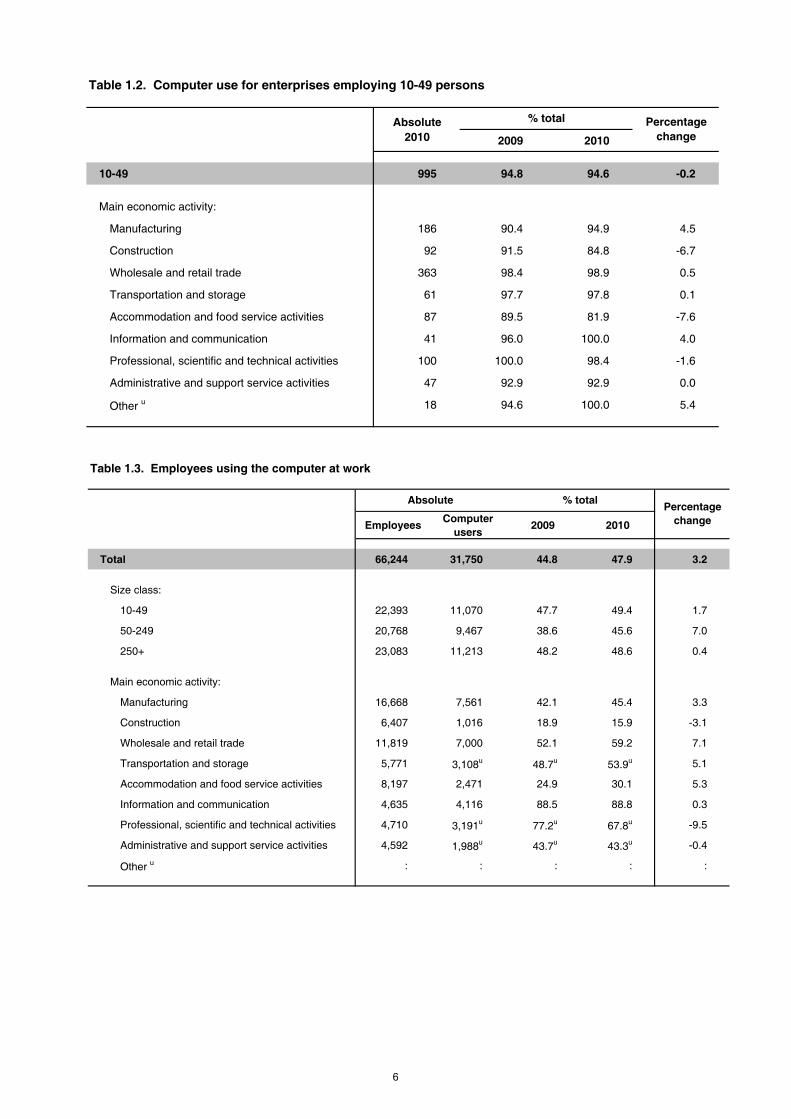
Table 1.2. Computer use for enterprises employing 10-49 persons
Absolute2010 2009 2010
10-49 995 94.8 94.6 -0.2
Main economic activity:
Manufacturing 186 90.4 94.9 4.5
Construction 92 91.5 84.8 -6.7
Wholesale and retail trade 363 98.4 98.9 0.5
Transportation and storage 61 97.7 97.8 0.1
Accommodation and food service activities 87 89.5 81.9 -7.6
Information and communication 41 96.0 100.0 4.0
Professional, scientific and technical activities 100 100.0 98.4 -1.6
Administrative and support service activities 47 92.9 92.9 0.0
Other u 18 94.6 100.0 5.4
% total Percentage change
Table 1.3. Employees using the computer at work
EmployeesComputer
users2009 2010
Total 66,244 31,750 44.8 47.9 3.2
Size class:
10-49 22,393 11,070 47.7 49.4 1.7
50-249 20,768 9,467 38.6 45.6 7.0
250+ 23,083 11,213 48.2 48.6 0.4
Main economic activity:
Manufacturing 16,668 7,561 42.1 45.4 3.3
Construction 6,407 1,016 18.9 15.9 -3.1
Wholesale and retail trade 11,819 7,000 52.1 59.2 7.1
Transportation and storage 5,771 3,108u 48.7u 53.9u 5.1
Accommodation and food service activities 8,197 2,471 24.9 30.1 5.3
Information and communication 4,635 4,116 88.5 88.8 0.3
Professional, scientific and technical activities 4,710 3,191u 77.2u 67.8u -9.5
Administrative and support service activities 4,592 1,988u 43.7u 43.3u -0.4
Other u : : : : :
Percentage change
% totalAbsolute
6

Table 1.4. Employees using the computer at work (enterprises employing 10-49 persons)
EmployeesComputer
users2009 2010
Total 22,393 11,070 47.7 49.4 1.7
Main economic activity:
Manufacturing 4,433 1,324 29.3 29.9 0.6
Construction 2,218 418 19.9 18.8 -1.1
Wholesale and retail trade 7,410 4,253 56.5 57.4 0.9
Transportation and storage 1,320 740 53.5 56.1 2.6
Accommodation and food service activities 2,258 652 28.5 28.9 0.4
Information and communication 1,056 877 83.4 83.0 -0.4
Professional, scientific and technical activities 2,269 1,881 89.8 82.9 -6.9
Administrative and support service activities 1,048 652 62.6 62.2 -0.4
Other u : : : : :
Absolute % totalPercentage
change
Table 1.5. Availability of Local Area Network (LAN)
Absolute2010 2009 2010
Total 1,097 81.7 84.1 2.4
Size class:
10-49 857 78.6 81.6 3.0
50-249 199 93.7 94.8 1.1
250+ 41 96.7 92.0 -4.7
Main economic activity:
Manufacturing 213 73.5 83.5 10.0
Construction 82 63.8 61.7 -2.1
Wholesale and retail trade 375 91.3 90.3 -1.0
Transportation and storage 69 82.2 88.0 5.8
Accommodation and food service activities 114 71.2 75.3 4.1
Information and communication 57 92.9 95.1 2.2
Professional, scientific and technical activities 103 94.8 88.8 -6.0
Administrative and support service activities 63 88.7 84.6 -4.1
Other u 21 83.3 100.0 16.7
% total Percentage change
7

Table 1.6. Availability of wireless LAN
Absolute2010 2009 2010
Total 599 40.7 45.9 5.2
Size class:
10-49 445 37.6 42.3 4.7
50-249 126 49.9 60.2 10.3
250+ 28 72.3 64.2 -8.1
Main economic activity:
Manufacturing 107 27.8 41.8 14.0
Construction 36 22.8 27.1 4.3
Wholesale and retail trade 196 48.0 47.5 -0.5
Transportation and storage 37 40.9 47.2 6.3
Accommodation and food service activities 59 36.7 38.7 2.0
Information and communication 42 76.0 69.8 -6.2
Professional, scientific and technical activities 69 53.1 59.5 6.4
Administrative and support service activities 38 42.1 50.1 8.0
Other u 15 49.6 72.4 22.8
Table 1.7. Availability of an Intranet
Absolute2010 2009 2010
Total 379 28.9 29.1 0.2
Size class:
10-49 257 23.7 24.6 0.9
50-249 89 44.7 42.3 -2.4
250+ 33 78.2 73.9 -4.3
Main economic activity:
Manufacturing 72 24.9 28.2 3.3
Construction 16 10.9 12.3 1.4
Wholesale and retail trade 110 26.4 26.5 0.1
Transportation and storage 30 24.3 38.1 13.8
Accommodation and food service activities 34 33.8 22.3 -11.5
Information and communication 42 70.0 70.3 0.3
Professional, scientific and technical activities 33 34.2 28.4 -5.8
Administrative and support service activities 33 43.5 44.3 0.8
Other u : : : :
% total Percentage change
% total Percentage change
8

Table 1.8. Availability of an Extranet
Absolute2010 2009 2010
Total 378 29.4 29.0 -0.4
Size class:
10-49 274 27.1 26.0 -1.1
50-249 79 35.4 37.8 2.4
250+ 25 55.4 56.8 1.4
Main economic activity:
Manufacturing 73 20.9 28.6 7.7
Construction 19 13.3 14.1 0.8
Wholesale and retail trade 92 27.6 22.3 -5.3
Transportation and storage 30 34.2 38.0 3.8
Accommodation and food service activities 33 34.6 21.6 -13.0
Information and communication 40 59.0 67.0 8.0
Professional, scientific and technical activities 52 47.1 44.6 -2.5
Administrative and support service activities 30 43.8 40.4 -3.4
Other u : : : :
Table 1.9. Use of third party free or open source operating systems
Absolute2010 2009 2010
Total 151 10.8 11.5 0.7
Size class:
10-49 95 9.2 9.0 -0.2
50-249 43 13.3 20.6 7.3
250+ 13 40.5 28.4 -12.1
Main economic activity:
Manufacturing 21 5.9 8.1 2.2
Construction 3u 2.3u 2.1u -0.2
Wholesale and retail trade 47 11.2 11.2 0.0
Transportation and storage 11 8.7 14.7 6.0
Accommodation and food service activities 9u 10.1u 5.8u -4.3
Information and communication 31 57.4 51.9 -5.5
Professional, scientific and technical activities 14u 10.9u 12.1u 1.2
Administrative and support service activities 11u 9.6u 14.5u 4.9
Other u : : : :
% total Percentage change
% total Percentage change
9

Table 1.10. Internet use by enterprises
Absolute2010 2009 2010
Total 1,224 94.3 93.8 -0.5
Size class:
10-49 975 92.9 92.7 -0.2
50-249 205 100.0 97.8 -2.2
250+ 44 100.0 100.0 0.0
Main economic activity:
Manufacturing 239 89.5 93.7 4.2
Construction 115 90.3 86.5 -3.8
Wholesale and retail trade 406 97.6 97.7 0.1
Transportation and storage 75 94.1 96.5 2.4
Accommodation and food service activities 125 92.9 82.3 -10.6
Information and communication 60 97.3 100.0 2.7
Professional, scientific and technical activities 113 100.0 97.3 -2.7
Administrative and support service activities 70 95.2 93.6 -1.6
Other u 21 95.7 100.0 4.3
% total Percentage change
Internet use Results show that during the reference period, 94 per cent of enterprises had access to the Internet – anestimate at par with that for 2009 (Table 10). Findings concerning the type of Internet connection show thatthe use of dial-up connections declined from 11 per cent in 2009 to 3 per cent of enterprises in 2010. Onthe other hand, DSL technology emerges as the most popular choice among local enterprises, with anestimated 85 per cent of users (Chart 1). Table 12 shows that 35 per cent of employees used Internet atwork during January 2010, a 2 percentage point increase when compared to the corresponding period ayear before.
The use of e-Government service has proven to be very popular among Maltese enterprises, as resultsshowed that 86 per cent of companies with at least 10 employees (FTE) made use of e-Governmentservices during 2010 (Table 15). E-Government is most commonly used for obtaining information – 98 percent of enterprises – and for downloading forms such as tax forms – 93 per cent of enterprises (Table 16).
Concurrently, Table 17 shows that during the reference period, 70 per cent of enterprises making use of theInternet also had a website or home page at their disposal. The most common facilities provided on thewebsite were product catalogues or price lists, and a privacy policy statement or certification related towebsite safety. These were present in 59 and 53 per cent of cases respectively (Table 18).
10

Table 1.11. Internet use for enterprises employing 10-49 persons: FTE
Absolute2010 2009 2010
10-49 975 92.9 92.7 -0.2
Main economic activity:
Manufacturing 180 85.9 91.8 5.9
Construction 91 88.7 83.5 -5.2
Wholesale and retail trade 358 97.2 97.4 0.2
Transportation and storage 59 93.0 95.7 2.7
Accommodation and food service activities 82 89.5 77.8 -11.7
Information and communication 41 96.0 100.0 4.0
Professional, scientific and technical activities 99 100.0 96.9 -3.1
Administrative and support service activities 47 92.9 92.9 0.0
Other u 18 94.6 100.0 5.4
Chart 1.1. Types of Internet connection: January 2010
Chart 1.2. Types of Internet connection: January 2009
% total Percentage change
2010
0
20
40
60
80
100
dial-up 2.6 2.6 1.8 5.1
DSL 85.3 86.3 83.9 69.9
other (e.g. cable) 29.4 26.3 36.6 64.8
mobile connection 30.1 26.2 42.0 61.9
Total 10-49 50-249 250+
2009
0
20
40
60
80
100
dial-up 11.3 10.8 12.5 16.8
DSL 84.6 85.2 85.1 66.5
other (e.g. cable) 23.0 20.2 27.8 66.7
mobile connection 22.4 18.8 32.5 54.7
Total 10-49 50-249 250+
11

Table 1.12. Employees using Internet at work
Absolute2010 2009 2010
Total 66,244 32.8 34.9 2.1
Size class:
10-49 22,393 39.3 42.1 2.8
50-249 20,768 29.6 34.4 4.8
250+ 23,083 29.2 28.5 -0.7
Main economic activity:
Manufacturing 16,668 20.8 23.5 2.7
Construction 6,407 14.4 11.4 -3.0
Wholesale and retail trade 11,819 38.7 42.8 4.1
Transportation and storage 5,771u 41.6u 49.7u 8.1
Accommodation and food service activities 8,197 18.0 21.8 3.8
Information and communication 4,635u 81.8u 87.1u 5.3
Professional, scientific and technical activities 4,710u 69.7u 60.6u -9.1
Administrative and support service activities 4,592u 42.2u 29.5u -12.7
Other u : : : :
Table 1.13. Use of the Internet by enterprises for banking and financial services purposes
Absolute2010 2009 2010
Total 1,050 86.4 85.9 -0.5
Size class:
10-49 826 84.5 84.8 0.3
50-249 184 93.0 89.8 -3.2
250+ 40 95.6 90.9 -4.7
Main economic activity:
Manufacturing 200 83.3 83.9 0.6
Construction 90 80.0 79.0 -1.0
Wholesale and retail trade 356 91.8 87.8 -4.0
Transportation and storage 73 92.7 96.4 3.7
Accommodation and food service activities 105 79.7 84.1 4.4
Information and communication 54 89.9 90.2 0.3
Professional, scientific and technical activities 96 84.9 85.0 0.1
Administrative and support service activities 63 91.7 89.7 -2.0
Other 13u 72.3u 60.0u -12.3
*Enterprises availing of Internet
% total Percentage change
% total * Percentage change
12

Table 1.14. Use of the Internet by enterprises for training and education purposes
Absolute2010 2009 2010
Total 463 31.6 37.9 6.3
Size class:
10-49 330 29.4 33.9 4.5
50-249 105 37.4 50.9 13.5
250+ 28 52.5 64.2 11.7
Main economic activity:
Manufacturing 50 25.8 20.8 -5.0
Construction 24 19.9 20.7 0.8
Wholesale and retail trade 158 34.1 38.9 4.8
Transportation and storage 35 31.3 46.6 15.3
Accommodation and food service activities 57 34.0 45.7 11.7
Information and communication 34 46.0 57.2 11.2
Professional, scientific and technical activities 58 42.6 51.1 8.5
Administrative and support service activities 33 24.1 47.5 23.4
Other 14 35.6 67.6 32.0
Table 1.15. Percentage use of e-Government services by enterprises
Absolute2010 2009 2010
Total 1,009 81.2 82.4 1.2
Size class:
10-49 777 79.7 79.8 0.1
50-249 191 85.4 93.0 7.6
250+ 41 93.1 92.0 -1.1
Main economic activity:
Manufacturing 187 78.9 78.3 -0.6
Construction 95 69.4 83.2 13.8
Wholesale and retail trade 331 83.0 81.4 -1.6
Transportation and storage 61 86.4 80.6 -5.8
Accommodation and food service activities 104 73.1 83.1 10.0
Information and communication 51 82.6 85.4 2.8
Professional, scientific and technical activities 98 98.3 87.3 -11.0
Administrative and support service activities 61 84.2 86.2 2.0
Other 21 89.4 100.0 10.6
*Enterprises availing of Internet
% total * Percentage change
% total * Percentage change
13

Table 1.16. E-Government usage by type of service
Absolute2010 2009 2010
For obtaining information 985 98.0 97.7 -0.3
For obtaining forms e.g. tax forms 938 91.8 93.0 1.2
For returning filled-in forms1 691 65.8 68.5 2.7
For treating an administrative procedure completely electronically2
650 56.1 64.4 8.3
e-Procurement 174 14.3 17.3 3.0
1 for example: provision of statistical information to public authorities
2 examples of administrative procedures include declaration, registration, authorisation request, etc.
Table 1.17. Enterprises with a website or home page
Absolute2010 2009 2010
Total 856 64.9 69.9 5.0
Size class:
10-49 643 64.9 65.9 1.0
50-249 171 82.3 83.3 1.0
250+ 42 93.1 94.9 1.8
Main economic activity:
Manufacturing 163 64.2 68.4 4.2
Construction 56 45.2 48.6 3.4
Wholesale and retail trade 262 65.2 64.5 -0.7
Transportation and storage 58 69.5 76.7 7.2
Accommodation and food service activities 102 76.2 81.5 5.3
Information and communication 54 91.6 90.2 -1.4
Professional, scientific and technical activities 84 80.8 74.1 -6.7
Administrative and support service activities 61 87.4 87.0 -0.4
Other 16 83.3 76.7 -6.6
*Enterprises availing of Internet
% using e-Government Percentage change
% total * Percentage change
14

Table 1.18. Facilities present on enterprises' Website or Home Page
Absolute2010 2009 2010
A privacy statement or certification related to website safety 450 49.6 52.6 3.0
Product catalogues or price lists 501 69.6 58.5 -11.1
Possibility for visitors to customise or design the products 92 9.6 10.7 1.1
Online ordering, reservation or booking e.g. shopping cart 268 28.5 31.3 2.8
Online order tracking 82 11.1 9.6 -1.5
Personalised content in the website for regular/ repeated visitors 98 9.3 11.5 2.2
Advertisement of open job positions or online job application 245 26.5 28.6 2.1
Table 1.19. Enterprises using digital signatures in outgoing messages
Absolute2010 2009 2010
Total 220 15.6 17.9 2.3
Size class:
10-49 155 14.3 15.9 1.6
50-249 56 19.4 27.4 8.0
250+ 9 25.7 19.3 -6.4
Main economic activity:
Manufacturing 33 12.1 13.9 1.8
Construction 7u 7.9u 6.1u -1.8
Wholesale and retail trade 66 15.1 16.1 1.0
Transportation and storage 22 21.8 29.0 7.2
Accommodation and food service activities 31 16.7 24.4 7.7
Information and communication 16 23.1 26.2 3.1
Professional, scientific and technical activities 26 25.0 23.4 -1.6
Administrative and support service activities 17u 15.1u 24.1u 9.0
Other : : : :
*Enterprises availing of Internet
% enterprises with a website or home page Percentage
change
% total * Percentage change
15

Table 1.20. Electronic transmission of data between enterprises
Absolute2010 2009 2010
Total 646 37.2 49.5 12.3
Size class:
10-49 487 36.6 46.4 9.8
50-249 128 38.1 60.8 22.7
250+ 31 50.2 69.3 19.1
Main economic activity:
Manufacturing 115 32.9 44.9 12
Construction 43 25.3 32.7 7.4
Wholesale and retail trade 226 47.2 54.6 7.4
Transportation and storage 46 44.9 59.6 14.7
Accommodation and food service activities 73 29.3 48.1 18.8
Information and communication 35 41.6 57.5 15.9
Professional, scientific and technical activities 59 29.2 50.5 21.3
Administrative and support service activities 38 30.4 50.8 20.4
Other u : : : :
% total * Percentage change
Electronic share of information Tables 20 and 21 assess the electronic transmission of information between enterprises. Such systemsallow users to send and/or receive messages (e.g. orders, invoices, payment transactions) via computernetworks without the individual messages having to be typed manually. During January 2010, electronictransmission of information between enterprises was used by 50 per cent of enterprises, a 12 percentagepoint increase when compared to January 2009. On the other hand, the practice of sharing information overa “supply chain management” system was utilised by 23 per cent of enterprises (Table 22). This was mostoften carried out via a website – 67 per cent of enterprises adopted this method (Table 24).
Automatic share of information within the enterprise was very popular, with 51 per cent sharing informationconcerning sales orders automatically. Furthermore, 44 per cent of enterprises have shared purchase ordersat an internal level. When asked about the availability of Enterprise Resource Planning (ERP) andCustomers Relationship Management (CRM) software, 18 and 24 per cent of enterprises answeredpositively to the availability and use of this kind of technology.
16

Table 1.21. Type of information received electronically
Absolute2010 2009 2010
Sending payment instructions to financial institutions 490 76.0 75.7 -0.3
Sending orders to suppliers 471 68.2 73.0 4.8
Receiving e-invoices 453 66.7 70.1 3.4
Receiving orders from customers 391 56.9 60.4 3.5
Sending e-invoices 332 42.9 51.3 8.4
Sending or receiving product information 491 77.0 76.0 -1.0
Sending or receiving transport documents 383 55.7 59.3 3.6
Sending or receiving data to/from public authorities 469 67.8 72.6 4.8
Table 1.22. Electronic share of information with enterprise suppliers and customers: January 2010
Absolute2010 2009 2010
Total 296 17.5 22.7 5.2
Size class:
10-49 217 16.6 20.8 4.2
50-249 66 20.6 31.3 10.7
250+ 13 25.2 28.4 3.2
Main economic activity:
Manufacturing 48 19.0 18.9 -0.1
Construction 18 10.9 13.5 2.6
Wholesale and retail trade 121 25.5 29.0 3.5
Transportation and storage 25 15.6 31.8 16.2
Accommodation and food service activities 20u 15.8u 13.3u -2.5u
Information and communication 16 12.0 27.0 15.0
Professional, scientific and technical activities 29 8.1 25.0 16.9
Administrative and support service activities 12u 4.8u 16.1u 11.3u
Other u : : : :
% total Percentage change
% enterprises transmitting data electronically Percentage
change
17

Table 1.23. Electronic information share
Absolute2010 2009 2010
Customers 222 79.0 74.8 -4.2
Suppliers 177 46.8 59.7 12.9
Table 1.24. Method used to share information electronically: January 2010
Absolute2010 2009 2010
Websites 198 64.9 66.7 1.8
Table 1.25. Automatic share of information within the enterprise by reason for use
Absolute2010 2009 2010
Sales orders received: 660 52.7 50.6 -2.1
Management of inventory levels 466 35.4 35.7 0.3
Accounting 582 47.1 44.6 -2.5
Production or services management 397 30.0 30.5 0.5
Distribution management 375 27.0 28.7 1.7
Purchase order sent: 570 42.2 43.7 1.5
Management of inventory levels 439 31.1 33.6 2.5
Accounting 518 38.5 39.7 1.2
% enterprises sharing information electronically Percentage
change
Electronic transmissions allowing automatic processing methods 7.836.228.4107
% enterprises sharing information electronically Percentage
change
% total Percentage change
18

Table 1.26. Availability of Enterprise Resource Planning (ERP) software
Absolute2010 2009 2010
Total 234 18.7 17.9 -0.8
Size class:
10-49 146 14.9 14.0 -0.9
50-249 64 29.1 30.3 1.2
250+ 24 61.4 53.4 -8.0
Main economic activity:
Manufacturing 68 23.4 26.8 3.4
Construction 5u 2.4u 3.9u 1.5u
Wholesale and retail trade 86 25.6 20.3 -5.3
Transportation and storage 16u 12.6u 20.0u 7.4u
Accommodation and food service activities 19u 9.5u 12.7u 3.2u
Information and communication 16 31.7 27.3 -4.4
Professional, scientific and technical activities 11 14.4 9.6 -4.8
Administrative and support service activities 11u 16.1u 15.3u -0.8u
Other u : : : :
Table 1.27. Availability of Customer Relationship Management (CRM) software
Absolute2010 2009 2010
Total 315 24.1 24.2 0.1
Size class:
10-49 226 20.2 21.5 1.3
50-249 71 38.3 34 -4.3
250+ 18 50.7 40.3 -10.4
Main economic activity:
Manufacturing 48 19.1 19 -0.1
Construction 8 9.7 6.3 -3.4
Wholesale and retail trade 131 30.1 31.4 1.3
Transportation and storage 26 19.4 32.7 13.3
Accommodation and food service activities 29 20.4 19.1 -1.3
Information and communication 31 49.7 52.1 2.4
Professional, scientific and technical activities 22 23.3 19.1 -4.2
Administrative and support service activities 11 28.4 14.5 -13.9
Other u : : : :
% total Percentage change
% total Percentage change
19

Chart 1.3. CRM features
Table 1.28. Enterprises conducting sales via e-Commerce
Absolute2010 2009 2010
Total 225 13.0 18.4 5.4
Size class:
10-49 158 11.5 16.3 4.8
50-249 55 15.2 26.6 11.4
250+ 12 38.5 27.8 -10.7
Main economic activity:
Manufacturing 32 12.7 13.2 0.5
Construction 3u 5.3u 2.4u -2.9u
Wholesale and retail trade 68 8.4 16.9 8.5
Transportation and storage : : : :
Accommodation and food service activities 55 25.3 43.9 18.6
Information and communication 18 23.1 30.0 6.9
Professional, scientific and technical activities 9u 11.0u 8.4u -2.6u
Administrative and support service activities : : : :
Other u : : : :
*Enterprises availing of Internet
% total * Percentage change
0
20
40
60
80
100
2009 78.4 80.2
2010 81.5 83.0
capture and store info about clients analyse information about client for marketing purposes
e-Commerce During 2010, 18 per cent of enterprises with at least 10 employees (FTE) received orders via computernetworks, an increase of 5 percentage points when compared to the previous year. This amounted to over€1.3 billion in e-Commerce sales, accounting for 21 per cent of total turnover (total turnover of enterprisesavailing themselves of Internet). In addition, Table 30 shows that 85 percent of orders were received viaelectronic transmission, thereby allowing automatic processing methods, with the remaining 15 per centreceived via website.
In addition, 25 per cent of surveyed enterprises had placed orders via computer networks during 2010. Inmonetary terms, this accounted for more than €1.1 billion, or 24 per cent of total purchases (of enterprisesavailing of Internet).
20

Table 1.29. Turnover from e-Commerce sales€ million
Total
Size class:
10-49
50-249
250+
Main economic activity:
Manufacturing
Construction
Wholesale and retail trade
Transportation and storage
Accommodation and food service activities
Information and communication
Professional, scientific and technical activities
Administrative and support service activities
Other u
*E-commerce as a percentage of total turnover (from enterprises availing of Internet)
Table 1.30. Percentage of e-Commerce sales
WebsitesElectronic data
interchange*Websites
Electronic data interchange*
Total 23.4 76.6 14.8 85.2
Size class:
10-49 90.1 9.9 31.5 68.5
50-249 74.6 25.4 54.4 45.6
250+ 3.4 96.6 10.0 90.0
Main economic activity:
Manufacturing : 99.3 : 96.6
Construction : : : :
Wholesale and retail trade 43.5u 56.5 11.7u 88.3
Transportation and storage : 77.6 : 75.2
Accommodation and food service activities 97.6 2.4u 84.9 15.1u
Information and communication 80.5 : 86.3 :
Professional, scientific and technical activities : 84.5 : 88.2
Administrative and support service activities 83.4 : 64.0 :
Other u : : : :
*Electronic transmission allowing automatic information processing
20.9
2009 (Row %) 2010 (Row %)
11.2
42.2
4.2
0.1
18.9u
:
3.2
10.945
9
33u
:
0
88
286
36
7.3
3.5
47.6
875 44.3
e-Commerce turnover2010
% total turnover*2010
1,374
189
58
1,127
21

Table 1.31. Enterprises conducting purchases via e-Commerce
Absolute2010 2009 2010
Total 300 20.1 24.5 4.4
Size class:
10-49 208 17.9 21.3 3.4
50-249 78 28.0 38.1 10.1
250+ 14 27.9 30.7 2.8
Main economic activity:
Manufacturing 40u 9.4u 16.5u 7.1u
Construction 15 20.0 13.4 -6.6
Wholesale and retail trade 127 28.2 31.0 2.8
Transportation and storage : : : :
Accommodation and food service activities 25u 14.0u 19.9u 5.9u
Information and communication 30 30.9 49.7 18.8
Professional, scientific and technical activities 33 25.7 29.3 3.6
Administrative and support service activities 16u 24.1u 23.2u -0.9u
Other u : : : :
*Enterprises availing of Internet
Table 1.32. e-Commerce purchases€ million
Total
Size class:
10-49
50-249
250+
Main economic activity:
Manufacturing
Construction
Wholesale and retail trade
Transportation and storage
Accommodation and food service activities
Information and communication
Professional, scientific and technical activities
Administrative and support service activities
Other u
*E-commerce as a percentage of total purchases (from enterprises availing of Internet)
: :
: :
11u 10.1u
10 5.6
25 9.6
250 15.0
236 42.9
547 40.8
7 2.9
168 16.0
744 47.2
1,106 24.2
194 10.0
e-Commerce purchases % total purchases*2010 2010
% total Percentage change
22

Table 1.33. Enterprises with an ICT policy: 2010
Absolute% enterprises with
computers
Total 391 31.3
Size class:
10-49 266 26.8
50-249 89 42.5
250+ 36 80.7
Main economic activity:
Manufacturing 71 29.0
Construction 19 16.1
Wholesale and retail trade 119 29.2
Transportation and storage 26 33.4
Accommodation and food service activities 34 25.4
Information and communication 38 62.7
Professional, scientific and technical activities 46 39.8
Administrative and support service activities 28u 39.8u
Other u : :
Internet security When asked about the availability of a formally defined ICT policy, 31 per cent of enterprises admitted tohaving this kind of policy in place. This figure increases substantially in the case of the largest enterprises(employing 250 persons or more FTE), with positive responses standing at 81 per cent.
Table 35 measures the extent to which staff were made aware of their obligations vis-à-vis ICT-relatedmatters. Results show that 32 per cent of enterprises resorted to voluntary training or generally availableinformation (e.g. on the Intranet, newsletters or paper documents) to deliver their vision on the subject.
When analysing the types of ICT security incidents that affected enterprises during 2010, the likeliestresults were the unavailability of ICT services, followed by the destruction or corruption of data due tohardware or software failures – 15 per cent of enterprises. This was followed by destruction or corruptionof information due to infection of malicious software or unauthorised access – 8 per cent of enterprises(Table 36). The most common methods used to counteract ICT-related incidents were: strong passwordauthentication, offsite data backup and logging activities for analysis of security incidents with 52, 48 and40 per cent of enterprises respectively.
23
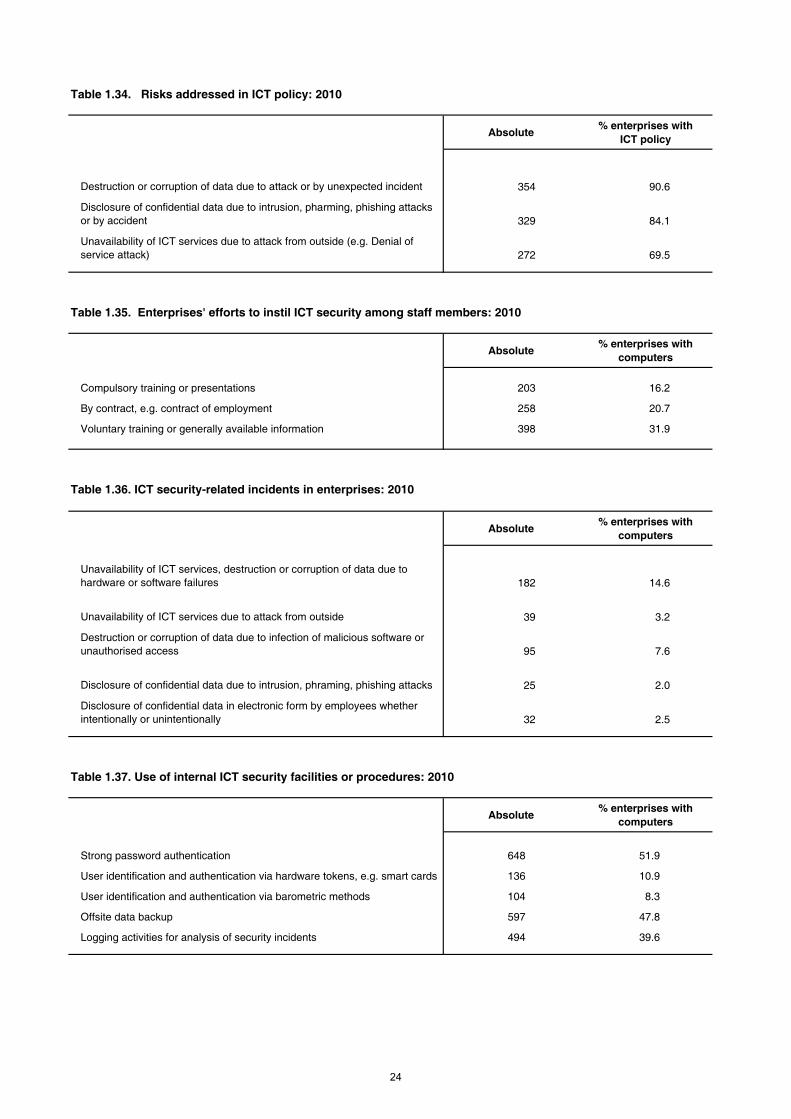
Table 1.34. Risks addressed in ICT policy: 2010
Absolute% enterprises with
ICT policy
Destruction or corruption of data due to attack or by unexpected incident 354 90.6
Disclosure of confidential data due to intrusion, pharming, phishing attacks or by accident 329 84.1
Unavailability of ICT services due to attack from outside (e.g. Denial of service attack) 272 69.5
Table 1.35. Enterprises' efforts to instil ICT security among staff members: 2010
Absolute% enterprises with
computers
Compulsory training or presentations 203 16.2
By contract, e.g. contract of employment 258 20.7
Voluntary training or generally available information 398 31.9
Table 1.36. ICT security-related incidents in enterprises: 2010
Absolute% enterprises with
computers
Unavailability of ICT services, destruction or corruption of data due to hardware or software failures 182 14.6
Unavailability of ICT services due to attack from outside 39 3.2
Destruction or corruption of data due to infection of malicious software or unauthorised access 95 7.6
Disclosure of confidential data due to intrusion, phraming, phishing attacks 25 2.0
Disclosure of confidential data in electronic form by employees whether intentionally or unintentionally 32 2.5
Table 1.37. Use of internal ICT security facilities or procedures: 2010
Absolute% enterprises with
computers
Strong password authentication 648 51.9
User identification and authentication via hardware tokens, e.g. smart cards 136 10.9
User identification and authentication via barometric methods 104 8.3
Offsite data backup 597 47.8
Logging activities for analysis of security incidents 494 39.6
24

2. Information and Communication Technology usage in households
and by individuals
2010


Introduction The survey on information and communication technology (ICT) usage in households and byindividuals, carried out in the second quarter of 2010, analysed the extent to which individualsaged between 16 and 74 made use of computers and the Internet.
The survey revealed that 73 per cent of households had access to a computer, while 70 per centwere able to access the Internet. Furthermore, when considering individuals in the 16-74 agecategory, 81 per cent had a computer at home while 78 per cent benefitted from access to theInternet.
27


Table 2.1. Households with access to a computer at home
2009 2010 2009 2010
Total 67.4 73.1 90,415 95,734 5,319 5.9
Household composition:
One adult without children 30.3 41.5 6,345 7,529 1,184 18.7
One adult with children : : : : : :
Two adults without children 48.3 47.8 16,497 16,081 -416 -2.5
Two adults with children 87.7 96.4 16,145 18,649 2,504 15.5
Three or more adults without children 81.6 87.7 37,998 40,770 2,772 7.3
Three or more adults with children 95.0 96.5 12,862 12,208 -654 -5.1
Household income: (€)
Less than 10,000 39.5 39.6 17,851 16,150 -1,701 -9.5
10,001 - 15,000 69.1 75.5 17,895 17,872 -23 -0.1
15,001 - 25,000 80.9 91.5 30,600 43,496 12,896 42.1
25,001 or more 95.5 96.2 24,069 18,216 -5,853 -24.3
: Data not reliable due to small sample representation
Percentage change
% household population Absolute Absolute change
Households
Computer and Internet access in households Results revealed that during 2010, 73 per cent of households had access to a computer from home. Thiswas 6 percentage points higher than the 2009 estimate, indicating the ever increasing popularity ofcomputer systems for personal use. This estimate falls to 42 per cent in the case of single personhouseholds, where an increase of 12 percentage points was noted when compared to the previous year.This disparity may be attributed to the fact that many households in this category are composed of elderlypeople, who, in general, may tend to be less conversant with ICT. At the other end of the spectrum, 96 percent of households with two adults and children had computer access from home. This rate increased by 8percentage points when compared to 2009.
Findings concerning Internet access in households followed the same trends as those outlined above forcomputer access. In 2010, 70 per cent of households had Internet access, compared to 64 per cent in2009. Furthermore 96 per cent of households comprising two adults and children benefitted from Internetfacilities within the home. In this regard an increase of 12 percentage points was registered whencompared to 2009.
Broadband technology emerged as the main means by which households accessed the Internet, with anestimated 98 per cent of the total number of households having Internet access at home. This resultreflects the current national situation, in which traditional dial-up systems have become increasinglyunpopular.
In concluding this household profile, the main reason given by households without Internet access at homewas lack of skill (Chart 3). This reason was common in 58 per cent of cases, and was followed by anestimated 32 per cent of households stating that they do not need the Internet.
29

Table 2.2. Households with access to the Internet at home
2009 2010 2009 2010
Total 64.4 70.4 86,455 92,218 5,763 6.7
Household composition:
One adult without children 30.3 39.3 6,345 7,123 778 12.3
One adult with children : : : : : :
Two adults without children 43.6 43.7 14,884 14,673 -211 -1.4
Two adults with children 84.4 96.0 15,534 18,560 3,026 19.5
Three or more adults without children 78.3 85.1 36,467 39,541 3,074 8.4
Three or more adults with children 94.2 94.8 12,745 11,993 -752 -5.9
Household income: (€)
Less than 10,000 36.4 32.9 16,438 13,407 -3,031 -18.4
10,001 - 15,000 66.4 74.5 17,194 17,632 438 2.5
15,001 - 25,000 77.9 90.5 29,473 43,039 13,566 46.0
25,001 or more 92.6 95.8 23,350 18,140 -5,210 -22.3
: Data not reliable due to small sample representation
Chart 2.1. Devices used to access the Internet from home: 2010
% household population Absolute Absolute change
Percentage change
5
8
46
84
2
1
60
2
5
77
0 20 40 60 80 100
games console
TV set with specific internetdevice
other mobile devices
portable computer
desktop computer
% households
2009 2010
30

Table 2.3. Type of Internet connection in the household
2009 2010 2009 2010
Total households with Internet access 100.0 100.0 84,428 90,710 6,282 7.4
Narrowband 2.3 1.6 2,027u 1,508u -519 -25.6
Broadband* 97.7 98.4 84,428 90,710 6,282 7.4
*Includes DSL, wired fixed, fixed wireless and mobile wireless connection (Methodological notes)
Chart 2.2. Type of broadband connection: 2010
(1) wired fixed includes cable, fiber, Ethernet, PLS, etc…
(2) fixed wireless includes satellite, WiFi, WiMax
(3) mobile wireless connection includes 3G/UMTS, USB key, laptop card etc…
Note: Households may have more than one connection.
Chart 2.3. Reasons for not having access to the Internet at home: 2010
% total Absolute Absolute change
Percentage change
1
1
4
4
6
6
11
32
58
0 20 40 60 80 100
other reasons
physical disability
privacy or security concerns
lack of skills
access costs too high
equipment too expensive
don't need Internet
don't want Internet
have access to Internet elsewhere
% households
55
32
115
0
20
40
60
80
100
wired fixed (1) fixed wireless (2) mobile wireless connection(3)
DSL other broadband connection
% -
Hou
seho
lds
31

Table 2.4. Profile of individuals having computer access at home: 2010
Total Males Females Total Males Females
Total 80.8 81.9 79.7 252,940 128,544 124,396
Age group:
16-24 97.1 95.5 98.7 51,646 26,213 25,433
25-34 88.3 91.8 84.5 52,164 27,988 24,176
35-44 92.7 90.7 94.7 46,323 22,935 23,388
45-54 81.2 81.9 80.6 49,347 25,080 24,267
55-64 72.2 73.5 71.0 40,341 19,876 20,465
65-74 38.4 40.0 37.0 13,119 6,452 6,667
District:
Southern Harbour 78.5 79.5 77.5 46,654 23,880 22,774
Northern Harbour 78.1 78.5 77.6 72,593 36,911 35,682
South Eastern 79.9 80.4 79.4 36,922 18,643 18,279
Western 86.6 90.6 82.4 37,451 19,897 17,554
Northern 88.8 87.5 89.9 42,877 20,596 22,281
Gozo and Comino 72.0 76.3 67.8 16,443 8,617 7,826
Education Level:
No Schooling / Primary 50.1 47.2 52.3 28,507 11,843 16,664
Secondary 80.9 80.5 81.3 109,978 53,478 56,500
Post-Secondary 93.3 95.2 91.0 73,191 41,247 31,944
Tertiary 99.0 99.2 98.8 41,264 21,976 19,288
Employment Situation:
Employed / Self-employed 89.7 90.1 89.0 151,813 98,321 53,492
Unemployed 69.6 71.0 67.0 7,629 5,038u 2,591u
Student 100.0 100.0 100.0 22,967 10,411 12,556
Retired 47.1 48.9 39.6 16,110 13,423 2,687
Inactive 71.9 45.7 73.0 54,421 1,351u 53,070
% population Absolute
Computer use by individuals The ICT survey showed that 81 per cent of individuals had access to a computer at home in 2010 (Table 4).Computer usage is most common among the younger generation. In fact 97 per cent of individuals in the 16-24age bracket had computer access from home. In addition, nearly all these persons also enjoyed Internet accesswithin the household. On the other hand, individuals in the 65-74 age bracket are the least likely to own acomputer, with computer availability estimated at 38 per cent.
Figures in Table 5 and Table 6 demonstrate that 64 per cent of the target population made use of a computerduring the three-month reference period, an increase of 7 per cent when compared to 2009. The majority ofindividuals using a computer were males, while increases in computer usage by individuals were noted in all agegroups, except in the 65-74 category. The percentage of students using a computer went up from 96.6 per cent in2009 to 100 per cent in 2010, making this group the most avid computer users.
Among the respondents who made use of a computer during the three-month reference period, 79 per cent didso every day or almost every day, while a further 16 per cent used a computer at least once a week. The locationfrom which individuals made use of a computer was most often found to be the home; this was true for 94 percent of computer users. The work place comes in second with a share of 42 per cent of computer users (Chart 4).
32

Table 2.5. Length of time since last use of a computer
2009 2010 2009 2010
Total 100.0 100.0 313,670 313,053 -617 -0.2
Three months prior to survey* 59.6 63.9 186,987 200,081 13,094 7.0
3 - 12 months before survey 1.4 0.7 4,243 2,134u -2,109 -49.7
More than one year before survey 2.1 2.0 6,566 6,242 -324 -4.9
Never used a computer 36.9 33.4 115,874 104,596 -11,278 -9.7
*This is equal to quarter one of the reference year
Table 2.6. Profile of computer users*
2009 2010 2009 2010
Total 59.6 63.9 186,987 200,081 13,094 7.0
Sex:
Male 61.3 68.2 96,627 107,119 10,492 10.9
Female 57.9 59.6 90,360 92,962 2,602 2.9
Age group:
16-24 94.2 99.2 49,433 52,795 3,362 6.8
25-34 76.8 87.1 46,914 51,486 4,572 9.7
35-44 69.9 78.6 35,612 39,277 3,665 10.3
45-54 51.9 54.1 30,693 32,872 2,179 7.1
55-64 27.4 33.7 15,936 18,823 2,887 18.1
65-74 26.4 14.1 8,399 4,828u -3,571 -42.5
District:
Southern Harbour 59.1 62.2 36,173 36,954 781 2.2
Northern Harbour 63.4 61.5 59,131 57,171 -1,960 -3.3
South Eastern 49.9 57.7 23,155 26,646 3,491 15.1
Western 68.9 69.8 29,855 30,214 359 1.2
Northern 64.5 76.2 29,290 36,829 7,539 25.7
Gozo and Comino 39.1 53.7 9,383 12,267 2,884 30.7
Education level:
No Schooling / Primary 6.6 10.5 3,339u 5,962 2,623 78.6
Secondary 53.1 58.6 78,730 79,710 980 1.2
Post-Secondary 88.5 94.1 63,662 73,816 10,154 15.9
Tertiary 95.8 97.4 41,256 40,593 -663 -1.6
Employment situation:
Employed / Self-employed 73.6 82.7 123,367 140,044 16,677 13.5
Unemployed 65.2 59.5 9,755 6,526 -3,229 -33.1
Student 96.6 100.0 18,555 22,967 4,412 23.8
Inactive 31.6 27.8 35,310 30,544 -4,766 -13.5
* includes only persons who used a computer during Q1 of the reference year
% population Absolute Absolute change
Percentage change
% population Absolute Absolute change
Percentage change
33

Table 2.7. Computer users by user frequency*
2009 2010 2009 2010
Total 59.6 63.9 186,987 200,081 13,094 7.0
Every day or almost every day 78.3 79.2 146,350 158,522 12,172 8.3
At least once a week (but not every day) 17.5 16.5 32,689 32,988 299 0.9
At least once a month (but not every week) 3.4 3.5 6,287 6,983 696 11.1
Less than once a month 0.9 0.8 1,661u 1,588u -73 -4.4
* includes only persons who used a computer during Q1 of the reference year
Chart 2.4. Places where individuals used computers during the first quarter
*Includes other places such as public libraries, hotels, airport, internet cafe, etc.Multiple response was permitted in this question
% population Absolute Absolute change
Percentage change
0 20 40 60 80 100
at home
at place of work
at place of education
at another person's home
other*
% - Individuals
2010 94.1 41.8 8.8 9.3 6.5
2009 93.5 41.3 8.1 8.8 6.4
at home at place of workat place of education
at another person's home
other*
34

Internet use by individuals Results showed that 78 per cent of individuals aged between 16 and 74 had access to the Internet fromhome during the survey reference period. Internet access was most common among individuals agedbetween 16 and 24, followed by those falling in the 35-44 age bracket. Internet was least commonamong older persons, with only 30 per cent of individuals aged between 65 and 74 having access to theInternet at home (Table 8).
Table 9 and Table 10 show that 62 per cent of individuals used the Internet during the first quarter of2010, with frequent Internet users increasing by 5 percentage points when compared to thecorresponding period in 2009. As shown in Table 10, Internet popularity decreases with age andincreases with the level of education.
When analysing the frequency of Internet use (Table 11), among individuals stating that they used theInternet during the first quarter of the reference year, 79 per cent used Internet every day or almostevery day, while 17 per cent used the Internet at least once a week (but not every day). A majority of 95per cent of Internet users said that they used the Internet at home. Just over a third of these Internetusers also accessed the Internet at the place of work (Chart 5).
During the first quarter of 2010, the most common activities for which the Internet was used weresending and receiving emails and searching for information about goods and services, with 88 per centand 83 per cent respectively (Table 12).
e-Government
The use of e-Government services has maintained its steady upward trend with an estimated 60 percent of the target population stating that they made use of these services (Table 14). The use of theInternet to search for information concerning public authorities was estimated at 56 per cent, while thepractice of downloading official forms stood at 45 per cent. The use of the Internet to submit filled-informs (not via email) fell slightly behind other uses, with an estimated 24 per cent of Internet userssaying that they did so during the three-month survey reference period (Table 13).
The distribution of e-Government users by age group was found to be very well equilibrated; the largestproportion of users (65 per cent) was recorded in the 45-54 age bracket, closely followed by the 34-44age group (64 per cent). In both cases increases were recorded when compared to 2009. On the otherhand Internet users aged between 65 and 74 were the least likely to make use of e-Governmentservices (49 per cent). This study also revealed that out of the total number of persons who used theInternet during the first quarter of 2010, 63 per cent of employed persons and 54 per cent of studentsmade use of e-Government services.
35

Table 2.8. Profile of individuals with access to the Internet at home: 2010
Total Males Females Total Males Females
Total 78.4 79.9 76.9 245,480 125,504 119,976
Age Group:
16-24 96.6 95.5 97.8 51,411 26,213 25,198
25-34 86.7 88.7 84.5 51,247 27,071 24,176
35-44 92.2 89.7 94.7 46,072 22,684 23,388
45-54 79.4 82.1 76.7 48,263 25,165 23,098
55-64 68.0 69.7 66.3 37,959 18,857 19,102
65-74 30.8 34.2 27.8 10,528 5,514u 5,014u
District:
Southern Harbour 74.3 76.9 71.6 44,158 23,095 21,063
Northern Harbour 76.5 77.5 75.5 71,173 36,456 34,717
South Eastern 76.8 76.1 77.5 35,492 17,641 17,851
Western 86.3 91.1 81.3 37,338 20,017 17,321
Northern 86.0 85.4 86.5 41,528 20,101 21,427
Gozo and Comino 69.1 72.5 65.8 15,791 8,194 7,597
Education Level:
No Schooling / Primary 43.4 40.3 45.8 24,690 10,095 14,595
Secondary 78.4 78.9 77.9 106,585 52,436 54,149
Post-Secondary 93.0 94.6 91.0 72,941 40,997 31,944
Tertiary 99.0 99.2 98.8 41,264 21,976 19,288
Employment Situation:
Employed / Self-employed 88.8 89.0 88.5 150,312 97,103 53,209
Unemployed 66.9 66.8 67.0 7,331 4,740u 2,591u
Student 99.0 100.0 98.1 22,732 10,411 12,321
Retired 42.6 43.4 39.6 14,587 11,900 2,687u
Inactive 66.8 45.7 67.6 50,518 1,350u 49,168
% population Absolute
36

Table 2.9. Length of time since last use of the Internet
2009 2010 2009 2010
Total 100.0 100.0 313,670 313,053 -617 -0.2
Three months prior to survey* 57.6 62.1 180,986 194,218 13,232 7.3
3 - 12 months before survey 1.2 1.0 3,636u 3,247u -389 -10.7
More than one year before survey 1.5 1.0 4,594u 3,163u -1,431 -31.1
Never used a computer 39.7 35.9 124,454 112,425 -12,029 -9.7
*This is equal to quarter one of the reference year
Table 2.10. Profile of Internet users*
2009 2010 2009 2010
Total 57.7 62.0 180,985 194,218 13,233 7.3
Sex:
Males 59.7 66.2 94,200 103,938 9,738 10.3
Females 55.6 57.9 86,785 90,280 3,495 4.0
Age Group:
16-24 93.6 98.8 49,120 52,560 3,440 7.0
25-34 73.5 85.2 44,928 50,341 5,413 12.0
35-44 68.1 76.3 34,719 38,158 3,439 9.9
45-54 50.4 51.2 29,755 31,116 1,361 4.6
55-64 24.5 31.7 14,266 17,725 3,459 24.2
65-74 25.7 12.6 8,197 4,318u -3,879 -47.3
District:
Southern Harbour 57.0 57.9 34,929 34,405 -524 -1.5
Northern Harbour 61.4 60.9 57,321 56,638 -683 -1.2
South Eastern 47.6 57.2 22,098 26,416 4,318 19.5
Western 65.5 67.1 28,373 29,021 648 2.3
Northern 63.6 75.2 28,881 36,320 7,439 25.8
Gozo and Comino 39.1 50.0 9,383 11,418 2,035 21.7
Education Level:
No Schooling / Primary 5.9 8.3 2,985 4,709u 1,724 57.7
Secondary 50.4 56.8 74,737 77,207 2,470 3.3
Post-Secondary 86.2 91.7 62,007 71,953 9,946 16.0
Tertiary 95.8 96.8 41,256 40,349 -907 -2.2
Employment Situation:
Employed / Self-employed 71.6 80.6 120,068 136,360 16,292 13.6
Unemployed 61.7 54.5 9,240 5,980 -3,260 -35.3
Student 96.6 99.0 18,555 22,732 4,177 22.5
Inactive ** 29.6 26.5 33,121 29,146 -3,975 -12.0
* includes only persons who used a computer during Q1 of the reference year
** includes persons which are retired
% population Absolute Absolute change
Percentage change
% population Absolute Absolute change
Percentage change
37

Table 2.11. Frequency of Internet use*
2009 2010 2009 2010
Total 57.7 62.0 180,985 194,218 13,233 7.3
Every day or almost every day 78.6 79.5 142,247 154,379 12,132 7.9
At least once a week (but not every day) 17.2 16.9 31,155 32,897 1,742 5.3
At least once a month (but not every week) 3.2 3.0 5,882 5,796u -86 -1.5
Less than once a month 0.9 0.6 1,701u 1,146u -555 -48.4
* includes only persons who used a computer during Q1 of reference year
Chart 2.5. Places where individuals used the Internet during quarter 1
*Includes other places such as public libraries, hotels, airport, internet cafe, etc.Multiple response was permitted in this question
% population Absolute Absolute change
Percentage change
0 20 40 60 80 100 120
at home
at place of work
at place of education
at another person's home
other*
% - Individuals
2010 95.4 36.1 9.4 8.9 6.4
2009 93.7 35.3 6.1 7.9 4.1
at home at place of workat place of education
at another person's home
other*
38

Table 2.12. Activities for which the Internet was used: 2010*
Total Males Females Total Males Females
Communication: 90.2 88.6 92.1 175,223 92,107 83,116
Sending and receiving emails 87.6 86.4 89.1 170,230 89,783 80,447
Telephoning over the Internet 26.3 28.4 23.8 51,078 29,553 21,525
Posting messages to chat sites, social networks, etc… 49.2 41.9 57.5 95,542 43,590 51,952
Information search and online services: 95.3 95.3 95.4 185,179 99,024 86,155
Finding information about goods and services 83.2 82.1 84.5 161,650 85,351 76,299
Using services related to travel and accommodation 55.8 56.9 54.4 108,306 59,179 49,127
Web radios/ web televisions 40.9 40.1 41.9 79,492 41,689 37,803
Uploading self-created content to websites 18.7 18.0 19.6 36,399 18,729 17,670
Downloading software (excluding games) 31.9 33.9 29.5 61,877 35,209 26,668
Playing or downloading games, films, music 43.8 44.5 42.9 85,066 46,293 38,773
Reading or downloading online newspapers/magazines 64.2 65.8 62.4 124,701 68,349 56,352
Looking for a job/ sending a job application 23.5 20.4 27.2 45,707 21,178 24,529
Seeking health-related information 54.4 48.0 61.6 105,582 49,942 55,640
Banking and selling of goods and services: 65.6 70.1 60.4 127,343 72,812 54,531
Internet banking 60.7 65.9 54.8 117,949 68,472 49,477
Selling goods or services e.g. via auction 21.4 25.4 16.7 41,470 26,367 15,103
Training and education: 69.8 66.9 73.1 135,531 69,493 66,038
Looking for info about education, training or course offers 51.3 47.8 55.2 99,591 49,731 49,860
Doing an online course 8.7 9.6 7.6 16,851 9,946 6,905
Consulting the Internet for learning purposes 60.8 57.3 64.8 118,124 59,584 58,540
Table 2.13. Use of e-Government services*
Total Males Females Total Males Females
Obtaining information from public authorities' website 55.7 54.4 57.2 108,175 56,535 51,640
Downloading official forms 45.2 42.6 48.1 87,702 44,291 43,411
Sending filled-in forms 24.3 23.5 25.2 47,136 24,399 22,737
* Includes only persons who used the internet during Q1 of the reference year
*Multiple response was permitted in these questions
% Internet users Absolute
% Internet users Absolute
39

Table 2.14. Profile of e-Government users*
2009 2010 2009 2010
Total 58.6 60.0 105,967 116,608 10,641 10.0
Sex:
Males 61.4 57.7 57,796 59,921 2,125 3.7
Females 55.5 62.8 48,171 56,687 8,516 17.7
Age Group:
16-24 50.9 55.4 25,023 29,120 4,098 16.4
25-34 64.5 61.2 28,977 30,821 1,844 6.4
35-44 63.3 64.2 21,986 24,487 2,501 11.4
45-54 55.5 64.5 16,503 20,080 3,577 21.7
55-64 57.4 56.5 8,186 10,007 1,821 22.2
65-74 64.6 48.5 5,293u 2,094u -3,199 -60.4
District:
Southern Harbour 41.9 62.3 14,642 21,448 6,806 46.5
Northern Harbour 65.9 57.0 37,773 32,294 -5,479 -14.5
South Eastern 61.7 60.4 13,634 15,967 2,333 17.1
Western 65.7 63.4 18,632 18,410 -222 -1.2
Northern 61.7 69.5 17,830 25,224 7,395 41.5
Gozo and Comino 36.8 28.6 3,456u 3,265u -191 -5.5
Education Level:
No Schooling / Primary 17.4 32.8 520u 1,546u 1,026 197.4
Secondary 46.6 44.4 34,795 34,303 -492 -1.4
Post-Secondary 60.6 67.4 37,601 48,531 10,930 29.1
Tertiary 80.1 79.9 33,051 32,228 -823 -2.5
Employment Situation:
Employed / Self-employed 61.6 63.1 73,991 85,998 12,007 16.2
Unemployed 44.1 32.3 4,075u 1,934u -2,141 -52.5
Student 66.6 54.2 12,350 12,327 -23 -0.2
Inactive ** 47.0 56.1 15,550 16,349 798 5.1
* Includes only persons who used the internet during Q1 of the reference year
** Includes persons who are retired
% Internet users Absolute Absolute change
Percentage change
40

Table 2.15. Profile of e-Commerce users*
2009 2010 2009 2010
Total 58.6 60.5 105,977 117,597 11,620 11.0
Sex:
Males 64.4 63.0 60,671 65,476 4,805 7.9
Females 52.2 57.7 45,306 52,121 6,815 15.0
Age Group:
16-24 65.2 67.8 32,046 35,640 3,594 11.2
25-34 72.4 69.0 32,522 34,722 2,200 6.8
35-44 61.4 58.8 21,324 22,445 1,121 5.3
45-54 44.9 51.9 13,368 16,158 2,790 20.9
55-64 32.0 40.1 4,566u 7,115 2,549 55.8
65-74 26.2 35.1 2,151u 1,517u -634 -29.5
District:
Southern Harbour 56.0 63.7 19,573 21,912 2,339 12.0
Northern Harbour 54.7 56.1 31,378 31,792 414 1.3
South Eastern 64.6 57.1 14,277 15,096 819 5.7
Western 64.6 53.3 18,329 15,459 -2,870 -15.7
Northern 59.9 69.5 17,301 25,232 7,931 45.8
Gozo and Comino 54.6 71.0 5,119u 8,106 2,987 58.4
Education Level:
No Schooling / Primary 31.0 43.3 925u 2,039u 1,114 120.4
Secondary 48.0 46.9 35,902 36,242 340 0.9
Post-Secondary 67.5 66.3 41,854 47,707 5,853 14.0
Tertiary 66.2 78.3 27,296 31,609 4,313 15.8
Employment Situation:
Employed / Self-employed 63.4 65.8 76,113 89,700 13,587 17.9
Unemployed 58.7 47.2 5,426u 2,820u -2,606 -48.0
Student 62.8 64.2 11,651 14,598 2,947 25.3
Inactive ** 38.6 36.0 12,787 10,479 -2,308 -18.0
* Includes only persons who used the internet during Q1 of the reference year
** Includes persons who are retired
% Internet users Absolute Absolute change
Percentage change
E-Commerce The trade of goods and services over the Internet went up from 59 per cent in 2009 to 61 per cent in 2010.Results showed that 50 per cent of respondents who conducted e-Commerce did so to purchase items ofclothing – as in 2009, these continue to be the most common items sought. Books, magazines andnewspapers recorded a demand of 37 per cent and represented the second largest group of commoditiespurchased via e-Commerce. Hotel accommodation ranked third and recorded an increase of 4 percentagepoints over 2009. These statistics also revealed that the majority of goods purchased via e-Commerce, 92per cent, originated from other EU Member States.
41
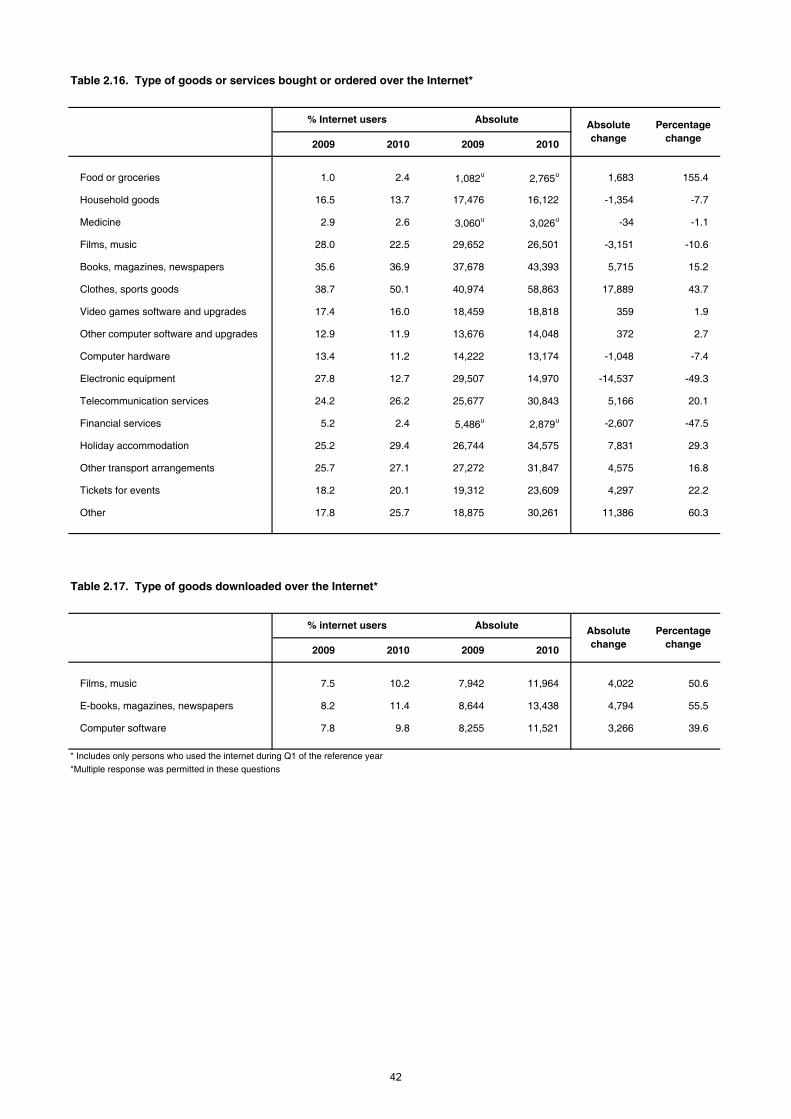
Table 2.16. Type of goods or services bought or ordered over the Internet*
2009 2010 2009 2010
Food or groceries 1.0 2.4 1,082u 2,765u 1,683 155.4
Household goods 16.5 13.7 17,476 16,122 -1,354 -7.7
Medicine 2.9 2.6 3,060u 3,026u -34 -1.1
Films, music 28.0 22.5 29,652 26,501 -3,151 -10.6
Books, magazines, newspapers 35.6 36.9 37,678 43,393 5,715 15.2
Clothes, sports goods 38.7 50.1 40,974 58,863 17,889 43.7
Video games software and upgrades 17.4 16.0 18,459 18,818 359 1.9
Other computer software and upgrades 12.9 11.9 13,676 14,048 372 2.7
Computer hardware 13.4 11.2 14,222 13,174 -1,048 -7.4
Electronic equipment 27.8 12.7 29,507 14,970 -14,537 -49.3
Telecommunication services 24.2 26.2 25,677 30,843 5,166 20.1
Financial services 5.2 2.4 5,486u 2,879u -2,607 -47.5
Holiday accommodation 25.2 29.4 26,744 34,575 7,831 29.3
Other transport arrangements 25.7 27.1 27,272 31,847 4,575 16.8
Tickets for events 18.2 20.1 19,312 23,609 4,297 22.2
Other 17.8 25.7 18,875 30,261 11,386 60.3
Table 2.17. Type of goods downloaded over the Internet*
2009 2010 2009 2010
Films, music 7.5 10.2 7,942 11,964 4,022 50.6
E-books, magazines, newspapers 8.2 11.4 8,644 13,438 4,794 55.5
Computer software 7.8 9.8 8,255 11,521 3,266 39.6
* Includes only persons who used the internet during Q1 of the reference year
*Multiple response was permitted in these questions
% internet users Absolute Absolute change
Percentage change
% Internet users Absolute Absolute change
Percentage change
42

Table 2.18. Origin of goods or services purchased over the Internet
2009 2010 2009 2010
Seller from Malta 18.6 9.8 19,726 11,475 -8,251 -41.8
Seller from other EU countries 84.0 91.6 89,063 107,672 18,609 20.9
Sellers from the rest of the world 44.5 45.7 47,146 53,726 6,580 14.0
Seller's country of origin is unknown 2.4 1.6 2,548u 1,922u -625 -24.5
*Includes only persons who used the internet during Q1 of the reference year
Chart 2.6. Percentage of online gaming*
*Includes sports betting, gambling or lotto over the Internet
% internet users Absolute Absolute change
Percentage change
2.0 4.8
0
25
50
75
100
2009 2010
Yes No
43

Table 2.19. Assessment of individual e-Skills: 2010*
Total Males Females Total Males Females
Using a search engine to find information 97.4 97.1 97.8 189,264 100,972 88,291
Sending emails with attached files 86.1 85.4 86.9 167,162 88,716 78,446
Posting messages to chatrooms, newsgroups or online discussion forums 52.1 47.5 57.5 101,260 49,386 51,874
Using the Internet to make telephone calls 29.0 30.6 27.1 56,233 31,762 24,471
Using peer-to-peer file sharing for exchanging movies, music, etc. 20.3 23.3 16.8 39,374 24,216 15,158
Creating a web page 8.8 10.5 6.9 17,084 10,885 6,199
None of the above 1.6 1.9 1.2 3,083u 1,984u 1,099
* Includes only persons who used the internet during Q1 of the reference year*Mulitiple response was permitted in this question
Table 2.20. Participation in formal computer training lasting at least three hours: 2010*
Total Males Females Total Males Females
Total 100.0 100.0 100.0 194,218 103,938 90,280
Within the past three months 10.7 10.0 11.5 20,792 10,440 10,352
Between three months and a year ago 6.4 3.9 9.3 12,481 4,096u 8,385
Between one and three years ago 16.3 14.8 17.9 31,583 15,422 16,161
More than three years ago 34.6 34.0 35.3 67,200 35,324 31,876
Never 32.0 37.2 26.0 62,162 38,656 23,506
*Includes only persons who have used a computer during Q1 of the reference year
% Internet users Absolute
% total Absolute
E-Skills and Internet security The concept of Internet security goes hand in hand with the idea of e-Commerce, as the World Wide Web is plaguedwith potential threats. In particular this study showed that 53 per cent of respondents were worried about the possibleloss of information resulting from a computer virus. A further 51 per cent were concerned about the abuse of personalinformation sent over the Internet, while 46 per cent were worried about potential financial losses. It is unfortunate tonote that half the Internet users stated that they suffered the consequences of a virus or computer infection at leastonce in their life.
This survey further set out to gauge the skills individuals possess in the field of information society and what amount oftraining they received in this regard. Results showed that 97 per cent of individuals who used the Internet during the firstquarter of 2010 were able to use a search engine, while 86 per cent were capable of sending emails with attachments.On the other hand, the ability to use peer-to-peer file sharing software was known to just 20 per cent of persons.
With regard to computer training it appeared that 34 per cent of the respondents received training over three years ago,while another third said they never received any kind of formal training. The ones that were most likely to receive thistraining were full-time students, with an estimated 63 per cent. On the other hand, only 33 per cent of persons in full-time employment received some kind of training in the last three years.
44

Table 2.21. Recipients of computer training in the last three years*
2009 2010 2009 2010
Total 36.4 33.4 65,894 64,856 -1,038 -1.6
Sex:
Males 32.0 28.8 30,121 29,958 -163 -0.5
Females 41.2 38.7 35,773 34,898 -875 -2.4
Age Group:
16-24 51.5 48.6 25,298 25,569 271 1.1
25-34 32.1 31.3 14,414 15,765 1,351 9.4
35-44 37.1 34.2 12,880 13,052 172 1.3
45-54 30.1 24.5 8,958 7,626 -1,332 -14.9
55-64 15.7 13.2 2,246u 2,332u 86 3.8
65-74 25.6 11.9 2,098u 512u -1,586 -75.6
District:
Southern Harbour 34.8 34.3 12,165 11,801 -364 -3.0
Northern Harbour 32.7 29.8 18,760 16,862 -1,898 -10.1
South Eastern 37.6 31.2 8,306 8,254 -52 -0.6
Western 30.0 35.7 8,500 10,347 1,847 21.7
Northern 42.2 36.5 12,178 13,274 1,096 9.0
Gozo and Comino 63.8 37.8 5,985 4,318u -1,667 -27.9
Education Level:
No Schooling / Primary 0.0 20.7 0u 972u - -
Secondary 31.3 21.7 23,388 16,755 -6,633 -28.4
Post-Secondary 45.5 42.9 28,224 30,888 2,664 9.4
Tertiary 34.6 40.3 14,282 16,241 1,959 13.7
Employment Situation:
Employed / Self-employed 33.1 31.4 39,715 42,786 3,071 7.7
Unemployed 34.3 28.7 3,166u 1,717u -1,449 -45.8
Student 71.4 62.5 13,244 14,211 967 7.3
Inactive ** 29.5 21.1 9,769 6,142 -3,627 -37.1
*Percentage of persons who have used a computer during Q1 of the reference year** Includes persons who are retired
% Total Absolute Absolute change
Percentage change
45

Table 2.22. Individuals' concern with Internet related problems*: 2010
Strongly Mildly Not at all
Virus or other computer infection resulting in loss of information and time 162,565 52.3 31.4 16.3
Unsolicited emails ('spam') 136,936 37.8 32.7 29.5
Abuse of personal information and/or other privacy violations 144,629 51.3 23.1 25.6
Financial loss as a result of fraudulent messages or the unauthorised disclosure of personal information 129,778 46.0 20.8 33.2
Financial loss due to fraudulent payment (credit or debit) card use 130,654 46.8 20.5 32.7
Children accessing inappropriate web-sites or connecting with potentially dangerous persons 108,548 41.2 14.7 44.1
* Includes only persons who used the internet during Q1 of the reference year
** Unconcerned individuals were omitted
% level of concernAbsolute**
Table 2.23. Security related problems experienced by individuals through Internet use: 2010*
Absolute % Total
Virus or other computer infection resulting in loss of information and time 96,645 49.8
Unsolicited emails ('spam') 113,017 58.2
Abuse of personal information sent on the Internet and/or other privacy violations 8,827 4.5
Financial loss as a result of fraudulent messages or getting redirected to fake websites asking for personal information 3,896u 2.0
Financial loss due to fraudulent payment (credit or debit) card use 7,822 4.0
Children accessing inappropriate web-sites or connecting with potentially dangerous person from a computer from within the household 3,068u 1.6
* Includes only persons who used the internet during Q1 of the reference year
Table 2.24. Security concerns hindering the performance of particular online activities: 2010*
Absolute % Total
Ordering or buying goods or services for private use 22,108 11.4
Carrying out banking activities such as account management 8,745 4.5
Providing personal information to online communities for social and professional networking 15,211 7.8
Communicating with public services or administrations 4,279u 2.2
Downloading software, music, video files, games or other data files 16,370 8.4
Using the Internet with mobile device (e.g. laptop) via website connection from places other than home 6,807 3.5
*Persons using the internet in 2010
46

ICT ENTERPRISE SURVEY: METHODOLOGICAL NOTES 1.0 SCOPE AND RELEVANCE OF THE ICT SURVEY
The Information and Communications Technology survey in enterprises (ICT-ENT) is an enterprise survey carried out under Eurostat Regulation (EC) No.808/2004. The main subjects covered in this survey include:
ICT systems and their usage in enterprises;
Use of the internet and other electronic networks by enterprises;
e-commerce and e-business processes;
ICT security.
This survey is mandatory in all the European Union (EU), thereby ensuring a harmonised approach at a European level which paves the way for effective benchmarking and data comparison among Member States.
At a local level this survey was conducted in conformity with the Malta Statistics Authority Act (XXIV of 2000). 1.1 SAMPLE SIZE AND RESPONSE 1.1.1 Population coverage For the purpose of this study, a census of companies employing a minimum of 10 employees (Full Time Equivalent) was undertaken, and the Business Register was used as the original sampling frame. Throughout this survey, an Enterprise is defined as an organisational unit which benefits from a certain degree of autonomy from its owner/s, particularly in the allocation of resources. Enterprises are subdivided into strata depending on their size class (FTE) and their economic activity (Table M1). The concept of Full Time Equivalence (FTE) used states that two part-time employees are equivalent to one full timer. For calibration purposes, enterprises were divided into three size classes, namely small (10-49 employees), medium (50-249 employees) and large enterprises (250 and more persons employed). Economic activities correspond to the NACE Revision 2 classification. The sectors covered in this publication include:
Section C: Manufacturing; Section F: Construction; Section G: Wholesale and retail trades; Section H: Transportation and storage; Section I: Accommodation and food service activities; Section J: Information and communication; Section M, Division 69-74: Professional, scientific and technical activities; Section N: Administrative and support activities; The sector ‘Other’ includes enterprises from:
o Electricity, gas and steam, water supply, sewerage and waste management (Sections D, E); o Real estate activities (Section L);
o Repair of computers (Section S, Group 95.1).
47

Table M1. Distribution of enterprises for ICT-ENT 2010
Enterprise size class Economic Activity
10-49 50-249 250+ Total
Manufacturing 196 45 14 255
Construction 108 19 5 132
Wholesale and retail trade 367 49 0 416
Transportation and storage 62 11 5 78
Accommodation and food service activities 106 41 5 152
Information and communication 41 15 4 60
Professional, scientific and technical activities 102 11 3 116
Administrative and support service activities 51 19 5 75
Other 18 0 3 21
Total 1,051 210 44 1,305
1.1.2 Data collection Questionnaires were first sent to enterprises by post and after a three-week deadline interviewers were asked to chase those enterprises which had not yet answered the questionnaire. Approximately 30 part-time interviewers were employed to conduct face-to-face interviews, with each interviewer approaching an average 35 enterprises. The content of the survey was explained to interviewers via a briefing presentation. Furthermore a centralised system was used to monitor the progress of every interviewer. Throughout the data collection process, the response for each stratum was monitored to ensure that adequate representation at all levels. Strata made up of less than 20 enterprises were closely monitored to try to achieve 100 per cent response rate. This was also the case for those enterprises employing more than 250 employees (FTE). 1.1.3 Response The response rate achieved in this survey was adequate to produce an array of reliable statistical information. The global response rate for this survey stood at 71 per cent, counting both questionnaires received by post and face-to-face interviews. Table M2 below shows the percentage response rate obtained in the ICT Enterprises survey for each stratum. Table M2. Percentage response rate
Enterprise size class Economic Activity
10-49 50-249 250+ Total
Manufacturing 69 89 100 75
Construction 73 68 100 73
Wholesale and retail trade 74 78 - 74
Transportation and storage 74 91 80 77
Accommodation and food service activities 59 76 100 65
Information and communication 68 87 100 75
Professional, scientific and technical activities 63 55 100 63
Administrative and support service activities 55 84 80 64
Other 44 - 100 52
Total 69 80 96 71
48

1.1.4 Quality control Measures undertaken to ensure the high quality of results include:
Regular data audits; Automated data validation by the data entry program; Data was re-checked manually during analysis for errors or outliers (also making use of box plots); Data checks and validation by means of software that was provided by Eurostat;
Ongoing cooperation with Eurostat to ensure that harmonised and reliable data was produced.
In the event of item non-response, the enterprises were contacted once again, and asked to supply the missing information. In cases where this could not be achieved auxiliary information was used – either from other enterprise surveys or from past ICT Enterprises questionnaires. In the absence of auxiliary information imputation techniques, the appropriate mathematical algorithms were utilised. Extreme outliers were verified telephonically with respondents – and if these could not be reached, the data was erased and imputed together with the item non-response using appropriate mathematical methods. 1.1.5 Weighting Data was weighted to adjust for unit non-response. This was based on a post stratification method according to NACE Rev 2.0 and employment group (FTE), with the gross population as the numerator and net sample as the denominator. This method assumed that unit non-response was random within strata. 1.1.6 Errors
This survey was aimed at 100 per cent coverage of the population (i.e. a full census). However, in practice, an overall response rate of 71 per cent was achieved. Added to this, returned questionnaires were at times incomplete, thus resulting in item non-response. Furthermore as a result of the weighting and imputation methods which had to be adopted, results suffer to some extent from unknown errors which are very difficult to quantify. On the other hand, other non-sampling errors may occur for reasons such as respondent error, non-response, the quality of the sampling frame, and data entry errors. While every effort was made to minimise these errors, these may still occur.
49

1.2 CONCEPTS AND DEFINITIONS
Customer Relationship Management (CRM)
A management methodology which places the customer at the centre of all business activities
Digital Signature A mathematical scheme demonstrating the authenticity of a digital message or document
Digital Subscriber Line (DSL) A family of technologies that provides digital data transmission over the wires of a local telephone network. DSL services are delivered simultaneously with regular telephone on the same telephone line as it uses a higher frequency band that is separated by filtering.
Enterprise Resource Planning (ERP)
A software application that integrate information and processes across several business functions. Typically ERP integrates planning, procurement, sales, marketing, customer relationship, finance and human resources operations.
Extranet A closed network that uses Internet protocols to securely share enterprise's information with suppliers, vendors, customers or other businesses partners.
Intranet An internal company communications network using Internet protocol allowing communications within an organisation.
Local Area Network (LAN) A network for communication between computers in close proximity to one another, permitting users to exchange data or hardware such as a printer or scanner.
Open Source Software An open-source licence is a copyright license that makes the source code available under terms which allow for modification and redistribution without owing anything to the original author.
Supply Chain Management Exchanging information with suppliers and/or customers in order to coordinate the availability and delivery of products or services to the final customer. This includes information on demand forecasts, inventories, production, distribution or product development which may be exchanged via websites or other means of electronic data transfer excluding manually typed emails.
50

ICT HOUSEHOLD SURVEY: METHODOLOGICAL NOTES 2.0 SCOPE AND RELEVANCE OF THE ICT SURVEY The Information and Communications Technology usage in households and by individuals survey (ICT-HH) is an individual survey carried out under Eurostat Regulation (EC) No.808/2004. The main subjects covered in this survey include:
Access to and use of ICT systems by individuals and/or in households; Use of the internet for different purposes by individuals and/or in households; ICT security; ICT competence; Barriers to the use of ICT and the internet.
This survey is mandatory in all the European Union (EU), and locally it was conducted in conformity with the Malta Statistics Authority Act (XXIV of 2000). 2.1 SAMPLE SIZE AND RESPONSE 2.1.1 Population coverage The target population for this survey included all households in which at least one member was between 16 and 74 years of age. Persons living in institutional households were not considered as eligible for this survey and thus were excluded from the target population. A sample of 1,500 individuals aged 16 to 74 was selected by simple random sampling from a register of persons and households maintained by NSO. Table M3 shows the household distribution used for the ICT-HH survey, as estimated from this survey, while Table M4 illustrates the distribution of individuals by age-groups.
Table M3. Household distribution for ICT-HH 2010
Household size District
1 2 3 4 5+ Total
1 4,516 6,981 5,987 4,915 3,226 25,625
2 5,926 12,787 9,183 8,068 4,021 39,985
3 2,456 3,815 4,976 4,950 2,815 19,012
4 1,878 3,538 4,192 4,759 2,598 16,965
5 1,961 4,605 5,331 5,615 1,980 19,492
6 1,405 2,448 1,905 2,973 1,092 9,823
Total 18,142 34,174 31,574 31,280 15,732 130,902
51

Table M4. Individuals distribution for ICT-HH 2010
District Age group
1 2 3 4 5 6 Total
16-24 9,843 14,927 8,049 7,329 8,889 4,173 53,210
25-34 12,827 15,779 9,605 8,302 8,939 3,654 59,106
35-44 7,542 13,476 8,456 7,655 8,799 4,058 49,986
45-54 10,027 19,054 8,652 8,697 9,595 4,727 60,752
55-64 12,298 17,811 7,236 7,083 7,988 3,437 55,853
65-74 6,887 11,952 4,208 4,203 4,096 2,800 34,146
Total 59,424 92,999 46,206 43,269 48,306 22,849 313,053
2.1.2 Data collection Data collection was carried out by face-to-face interviewing during the second quarter of 2010; however prior to this all, respondents were contacted by post thereby requesting their participation in this survey. A team of approximately 30 part-time, experienced, interviewers were entrusted with the data collection. This meant that, on average, each interviewer was assigned 50 questionnaires. All interviewers were adequately briefed on this survey before its commencement. Telephone interviews were permitted only in exceptional cases where face-to-face interviews were not possible. Respondents were contacted by phone to arrange time and place for the interview at their best convenience. A maximum of three visits were carried out before a household was considered as ‘no contact’.
2.1.3 Response rate A total of 1,128 questionnaires were received; accounting for a response rate of 75 per cent – counting both face-to-face and telephone interviews. 2.1.4 Quality control Various measures were undertaken to ensure high quality results. These included regular data audits and checks for data entry errors and outliers. In some cases, respondents were re-contacted in order to confirm some information which seemed inconsistent with the other data. Furthermore, ongoing cooperation with Eurostat ensured the production of harmonised and reliable results. In the case of item non-response, the first preference was to contact the respondents and ask for the missing information. In case where this could not be carried out, missing information was imputed using appropriate mathematical algorithms. 2.1.5 Grossing-up procedure Separate weights for households and individuals were computed to enable estimation of indicators at both household and individual level. Post-stratification weighting was used in order to construct these weights basing on district, household size, respondents’ sex and age. 2.1.6 Errors Since results from this study are being extracted from a representative random sample of the whole population, then figures produced from this survey are subject to certain degrees of sampling errors, which cause discrepancies between these estimates and the actual population values. The effect of this error is usually expressed in the form of margin of error which quantifies the uncertainty of an estimate at 95 per cent confidence levels.
52

The following table illustrates the margins of errors for different estimates of proportions for different total population counts:
eligible population ('000) Margins of error at 95% confidence
intervals
10 20 40 80 120 160 200 250 300
10 9.8 6.9 4.9 3.5 2.8 2.4 2.2 2.0 1.8
20 13.0 9.2 6.5 4.6 3.8 3.3 2.9 2.6 2.4
30 14.9 10.6 7.5 5.3 4.3 3.7 3.3 3.0 2.7
40 16.0 11.3 8.0 5.6 4.6 4.0 3.6 3.2 2.9
50 16.3 11.5 8.1 5.8 4.7 4.1 3.6 3.3 3.0
60 16.0 11.3 8.0 5.6 4.6 4.0 3.6 3.2 2.9
70 14.9 10.6 7.5 5.3 4.3 3.7 3.3 3.0 2.7
80 13.0 9.2 6.5 4.6 3.8 3.3 2.9 2.6 2.4
Est
imat
ed p
ropo
rtio
n (%
)
90 9.8 6.9 4.9 3.5 2.8 2.4 2.2 2.0 1.8
For example, an estimated proportion of 20.0 per cent calculated for a population category of 40,000 persons has an estimated margin of error of 6.5 per cent, implying that the true population value may lie between 13.5 per cent and 26.5 per cent. In the publication tables, figures are flagged with a ‘u’ in cases where margin of error lies between 30 and 40 per cent. In cases where the margin of error is greater than 40 per cent, estimates are not shown. Readers are strongly advised to interpret flagged estimates with caution. On the other hand, other non sampling errors may occur for reasons such as respondent error, non-response, the quality of the sampling frame, and data entry errors. While every effort was made to minimise these errors, these may still occur. 2.2 CONCEPTS AND DEFINITIONS
Districts were divided according to NUTS 4 classification as follows:
1. Southern Harbour; 2. Northern Harbour; 3. South Eastern; 4. Western; 5. Northern; 6. Gozo and Comino.
53


![LAW 88 ON ACCOUNTING - Economica Vietnam & REG/88...7 People doing accounting work [accounting personnel]. 8 Accountancy practitioners; and enterprises and family business households](https://img.pdfslide.net/doc/110x75/6002e670dea95c3f0521ca12/law-88-on-accounting-economica-vietnam-reg88-7-people-doing-accounting.jpg)