Embed Size (px)
Citation preview
���������������� �������
������������� ������������ ���� ���������������� ������������������������ ����������� ����������������
��� ��!∀�#∃%�&��∀������ �∋���∋�(���∋�#� ���) ∗�+�� ���� ,,+++)���∋�#� ���) ∗−� ∋��∃���
ICT use among the Students of Arts and Science Colleges in Kerala
�������������
�������
�� �
�������
�
�������
�� �
�������
�
����������������������������������������������

ICT Use among Students of Arts and Science Colleges in
Kerala
Raji and Godsy
Society for the Promotion of Alternative Computing and EmploymentThiruvananthapuram
March 2010
DOCUMENTATION PAGE
1 REPORT NUM-BER
SPACE-RR-1-2010
2 TYPE OF RE-PORT
Research Report
3 MONTH ANDYEAR OF PUB-LICATION
March 2010
4 TITLE ICT use among Students of Arts and Science Colleges in Kerala
5 AUTHORS Raji and Godsy
6 KEY WORDS students, colleges, Kerala, ICT
7 ABSTRACT Kerala was one of the first states of India to initiate free andcompulsory computer education in high schools through itsIT@School project which covers 1.6 million students every year.While higher education policy recognises the importance of im-proving pedagogy with the help of tools and methods madeavailable by Information and Communication Technology (ICT),this need has not been addressed in practice. In this milieu,SPACE conducted a study among 200 students chosen throughconvenience sampling from five districts of Kerala to understandhow undergraduate students in arts and science colleges relateto new ICTs especially the Internet. Results indicate a wide gapbetween boys and girls in their use of Internet across differentsocio-economic groups. Many colleges do not provide free Inter-net access to students. Problems in access is more acutely felt bygirls who are restricted by social norms from visiting browsingcentres. Fewer girls than boys felt confident in using Internet.The study suggests the need to create a teaching and learning en-vironment in colleges that utilises the opportunities thrown openby the World Wide Web, to equip students and teachers in itsuse and to ensure that students have an enabling access to ICTswithin their campus.
8 DISTRIBUTION Unlimited
9 COPYRIGHT c©2010 SPACE. Distributed under the Creative Commons Atribu-tion No Derivatives India 2.5 licence
10 CHIEF EDITOR Co-ordinator, SPACE
11 PUBLISHER Society for the Promotion of Alternative Computing and Employ-ment (SPACE), C11 Elankom Gardens, Vellayambalam, Thiru-vananthapuram 695010, India
Contents
Foreword v
1 Introduction 1
1.1 Limitations of the study . . . . . . . . . . . . . . . . . . . . . . . . . . . . . . . . . . . 2
2 Methods 2
3 Analysis of data 3
3.1 General Profile of Students . . . . . . . . . . . . . . . . . . . . . . . . . . . . . . . . . . 3
3.2 Academic Profile of Students . . . . . . . . . . . . . . . . . . . . . . . . . . . . . . . . 3
3.3 Exposure to Computers and Internet . . . . . . . . . . . . . . . . . . . . . . . . . . . . 3
3.4 Ability and Confidence to use Internet . . . . . . . . . . . . . . . . . . . . . . . . . . . 5
3.5 Access to Internet . . . . . . . . . . . . . . . . . . . . . . . . . . . . . . . . . . . . . . . 5
3.6 Socio-economic Status and Access to New Technologies . . . . . . . . . . . . . . . . . 7
3.7 Use of Mobile Phones . . . . . . . . . . . . . . . . . . . . . . . . . . . . . . . . . . . . . 8
4 Conclusion 8
Acknowledgements 9
References 10
Annexure: Survey Questionnaire 11

This page is deliberately left blank
Foreword
SPACE has been conducting studies on various topics related to Information and
Communication Technologies (ICT) and society for some time. The studies have been
largely used for our own purposes. This study on the access students have to ICT, to
what extent they use it and the reasons, if any, for their lack of access or limitations in
use was done in 2008 November-December. It has brought out some interesting aspects
of ICT use by students though the study was done on a small sample and traditional
academic methodologies were not strictly followed in the study.
In spite of the above limitations, we are publishing the study because no such study
has been conducted in the state earlier and the present one does throw some light on
the penetration of this technology among students of arts and science colleges in the
state. This is the first such report and more will be brought out in the future. We intend
to continue to do such studies in the state, and possibly outside, in future.
V. Sasi Kumar
Co-ordinator, SPACE

This page is deliberately left blank
ICT use among Students of Arts and Science Colleges in Kerala
1 Introduction
The combination of information and commu-
nication technologies has created ICT, possi-
bly one of the most powerful technologies de-
vised by humanity. But disparities exist in
access to, and use of ICT between countries
and between groups within countries, a phe-
nomenon popularly referred to as the digital di-
vide. The digital divide is not one dimensional
- it involves a complicated patchwork of vary-
ing levels of ICT access, basic ICT usage, and
ICT applications among countries and peoples
(bridges.org, 2001). Digital divide covers a spec-
trum of socio-economic factors within countries
and it reflects the existing inequalities in society.
Income, geographical location, education, age,
gender are some of the factors that put people
at different ends of the divide.
While the impact of ICT on sectors such
as banking, tourism, medicine, engineering etc.
have been enormous, the uptake of ICT in edu-
cation is fraught with difficulties (Oliver, 2002).
Lack of funding, training among practitioners,
motivation and perceived need among teachers
to adopt ICT as teaching tools impede the re-
quired uptake of ICT in education (Starr, 2001).
In India, the need for reforms in education
by harnessing new ICTs is increasingly being ac-
cepted as essential by universities and cultural
organisations across India. The National Policy
for ICT in Education, under formulation, high-
lights the need to integrate ICT as a subject in
the curriculum as well as to strengthen the over-
all teaching learning process. Open and dis-
tance education systems in India use EDUSAT
and other TV and radio channels for delivering
content. But ICT is yet to be used significantly
for the delivery of content.
The University Grants Commission (UGC),
the apex body responsible for maintaining
standards in higher education in India, has
acknowledged the role of ICT in improv-
ing teaching-learning paradigms, building new
knowledge, collaborating with peers and in the
governance of education in universities.
The Higher Education Council of Kerala
recognises that, in the new educational revolu-
tion across the world, the most important input
comes from ICT, and that Kerala is relatively un-
developed in this sphere. It accepts that ICT is a
tool for enhancing quality of teaching and learn-
ing at the higher education level, and for ex-
panding opportunities for distance education.
“The developments in Infor-
mation Communication Technology
(ICT) should be put into service,
both to improve the quality of learn-
ing and access to learning. The pos-
sibilities of e-learning have to be ex-
ploited to the fullest extent, even as
we continue to improve the quantity
and quality of education through
the face-to-face mode. Similarly the
traditional face-to-face mode can be
further improved by integrating ICT
into the curriculum. This would re-
quire a continual programme of in-
tensive and extensive exposure to
the new pedagogy of learning to
teachers as well as students and also
additional investment for provid-
ing new infrastructure.” (Panikker,
2007)
Estimates from the International Telecom-
munications Union (ITU) indicate that only 6
percent of the population in India accessed In-
ternet in 2007 (Veeramacheneni et al, 2008).
f2 Methods
Among all states in India, Kerala has the high-
est penetration of computers and Internet. A
prominent English newspaper, The Hindu, quot-
ing the IT Secretary of Kerala, states that com-
puter penetration in Kerala is double the na-
tional average (The Hindu, 2008). In 2007,
the Government of Kerala launched broadband
scheme for all schools in the state.
A large number of students at the higher sec-
ondary level in Kerala opt for computer science
as one of their subjects, and all engineering col-
leges have computer labs with several comput-
ers. But little is known about the extent and na-
ture of ICT exposure that arts and science grad-
uate students have. Unlike students of engi-
neering, they do not have ICT as part of their
curricula and hence the colleges are not bound
to provide facilities for using ICT.
The arts and science colleges in Kerala are
affiliated to four universities, namely, Kerala,
MG, Calicut and Kannur. Of the 186 arts and
science Colleges, 38 are government colleges
and 148 are in private aided sector. Approx-
imately 1.4 lakh students enrol in these col-
leges for their graduate education. The students
who enter arts and science colleges have basic
knowledge and skills in computing owing to
the IT training received at school through the
IT@School project.
Given the growing importance attached to
ICT at the ideological and policy levels, we
wanted to study how students of arts and sci-
ence colleges in Kerala fared in terms of ICT
awareness and skills, and assess the factors that
influenced their use of Internet. We also wanted
to understand how their attitudes to the Inter-
net are shaped in a scenario where there is no
formal systematic Internet training programme.
The study also looks into the gender differences
in their perceptions, skills and access. There
seems to be little literature on the adoption of
ICT among college students in India.
The objectives of the study were to:
1. assess the level of awareness about Inter-
net among graduate students in arts and
science colleges of Kerala
2. identify the various factors that affect the
students’ use of Internet
3. explore gender differences if any, in the
students’ awareness, perceptions and use
of the Internet and the reasons for the dif-
ference.
1.1 Limitations of the study
No similar studies have been conducted among
college students in Kerala, and, to the best of
our knowledge, even in other parts of India.
Therefore there is no benchmark for this study.
The study had a restricted sample of 200 stu-
dents. Further, the study was conducted some
time back, in 2008 November-December, and
things are bound to have changed to some ex-
tent. Hence the results generated may be taken
as indicative of Internet usage by students.
2 Methods
Five districts roughly corresponding to the
south, centre and north of Kerala – Thiruvanan-
thapuram, Ernakulam, Thrissur, Kozhikode
and Kannur – were chosen for the study. Two
colleges were chosen from each district, one col-
lege each from a Panchayat and one from a Cor-
poration/Municipal area. Twenty students in-
cluding boys and girls were chosen from each
college. Students of English Literature, Malay-
alam, Hindi, and Economics were surveyed in
the arts stream. Students of Chemistry, Zoology,
Botany, Physics, Home Science and Maths were
selected from the science stream. The colleges as
well as the students were chosen through con-
venience sampling.
2 SPACE Report: Students and ICT
f3 Analysis of data
The study included a survey held with the
help of a structured questionnaire with four
sets of questions – (i) a general profile (ii)
Educational profile (iii) Familiarity with com-
puters and the Internet and various facilitat-
ing/inhibiting factors (iv) use of mobile phones.
The questionnaire was in English with both
open ended and close ended questions.
Focus group discussions were also held with
boys and girls in each college to understand
the perceptions and experience of students with
various ICTs. In discussions of 25-30 min-
utes duration, 6-10 students participated. These
were held within classrooms or in resting places
chosen by students.
Of the 200 students who took part in the sur-
vey, 193 students answered all questions and
seven responded only partially.
3 Analysis of data
3.1 General Profile of Students
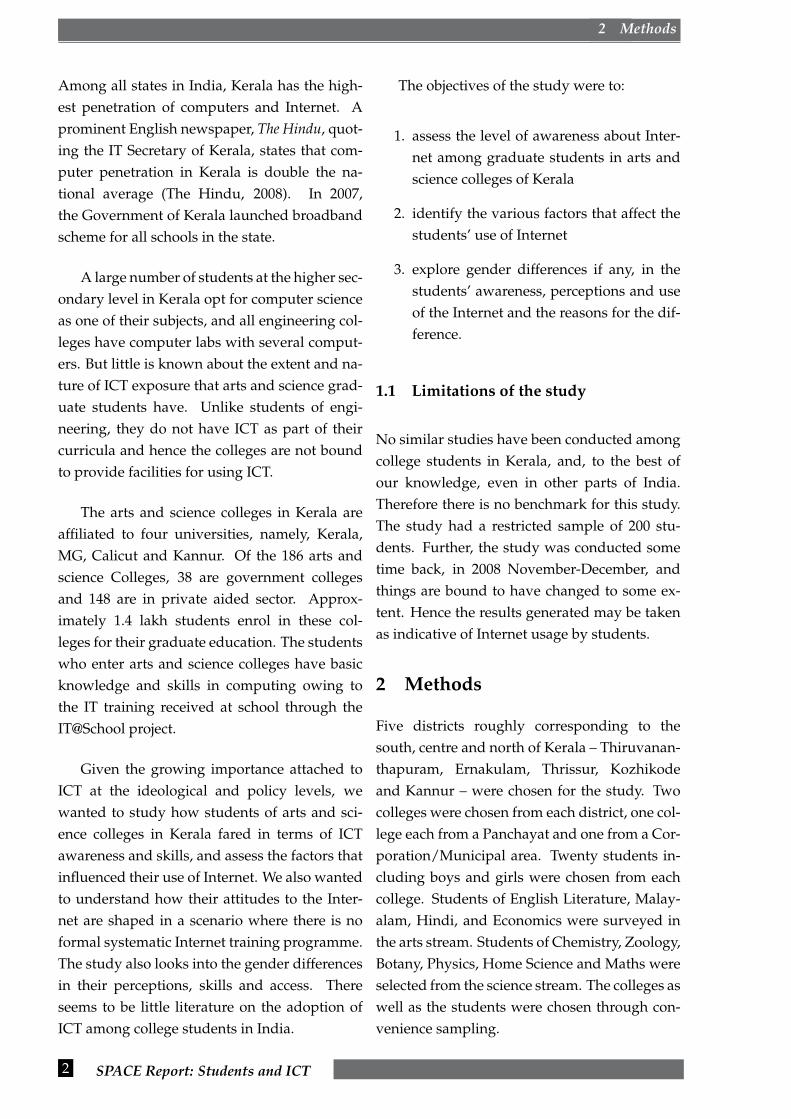
Students who participated in the study fall un-
der the age group of 18-20 years. A large ma-
jority of them (80% boys and 73% girls), live in
Panchayat area. The distribution of the monthly
parental income of the students is given in Fig.
1. We see that the monthly parental income of
34% students is below Rs. 5000 and that of 46%
students is between Rs. 5000 and Rs. 10,000.
Figure 1: Monthly parental income of the re-spondents
3.2 Academic Profile of Students
We did a profiling of the schooling and past
performance of the students who participated
in the study to find out patterns, if any, that
suggest relationships between academic perfor-
mance and adoption of ICT.
An analysis of the academic background of
students shows that:
• a majority of the students had studied in
Malayalam medium schools. Only 34%
boys and 39% girls had English as their
medium of instruction at school
• over 80% students, irrespective of their
rural urban difference, had scored marks
in the range of 50-80%. 10% students
had scored above 80% in their last pub-
lic examination. More boys than girls had
scored marks below 50% and above 80%.
• a profiling of interests and other activities
shows that, while girls attach great im-
portance to studies, boys have more var-
ied interests such as travelling, socialising,
sports etc.
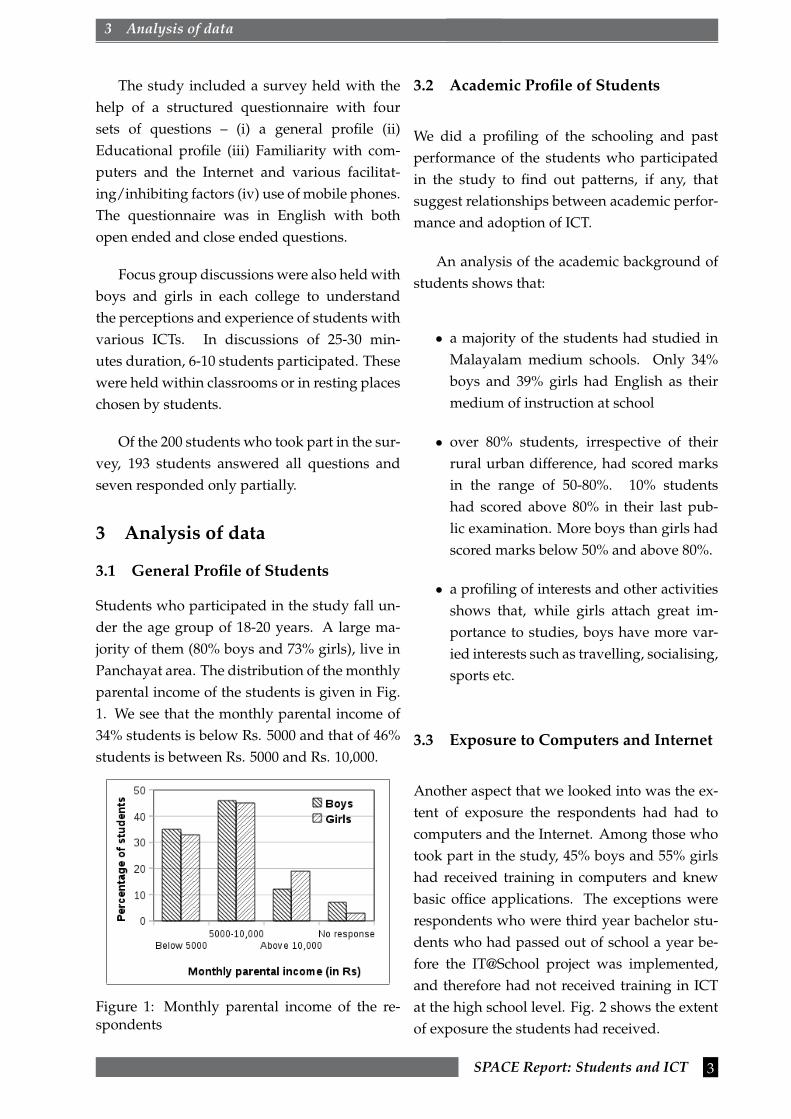
3.3 Exposure to Computers and Internet
Another aspect that we looked into was the ex-
tent of exposure the respondents had had to
computers and the Internet. Among those who
took part in the study, 45% boys and 55% girls
had received training in computers and knew
basic office applications. The exceptions were
respondents who were third year bachelor stu-
dents who had passed out of school a year be-
fore the IT@School project was implemented,
and therefore had not received training in ICT
at the high school level. Fig. 2 shows the extent
of exposure the students had received.
SPACE Report: Students and ICT 3
f3 Analysis of data
Figure 2: Exposure to computers
Apart from the computer training received
at school, many respondents had also received
specialised training from private computer cen-
tres. The specialised training consists of office
packages (MS Word, Excel), Tally, DTP, visual
basic or languages (C+, C++, COBOL, Java).
32% boys had training in programming lan-
guages compared to 19% girls.
Students attended computer courses on hol-
idays or before/after college hours. These pri-
vate institutions are seen as gateways to em-
ployment by students and their parents, much
as the typewriting institutes were regarded a
generation before. Students most commonly
use word processor (81%) to prepare project re-
ports. A few boys reported using other applica-
tions such as image manipulation software and
multimedia. None of the girls in the study were
familiar with these applications.
This gender disparity in using computer ap-
plications need not necessarily be specific to
Kerala. A survey of college students in the U.S
revealed that while gender differences are not
significant in skill levels for common applica-
tions, males reported much stronger skills for
computer maintenance and somewhat stronger
skills in using video/audio software. The few
respondents who reported to use graphics and
video/audio software reported their skill lev-
els as slightly less than “good” (Salaway, et al,
2006).
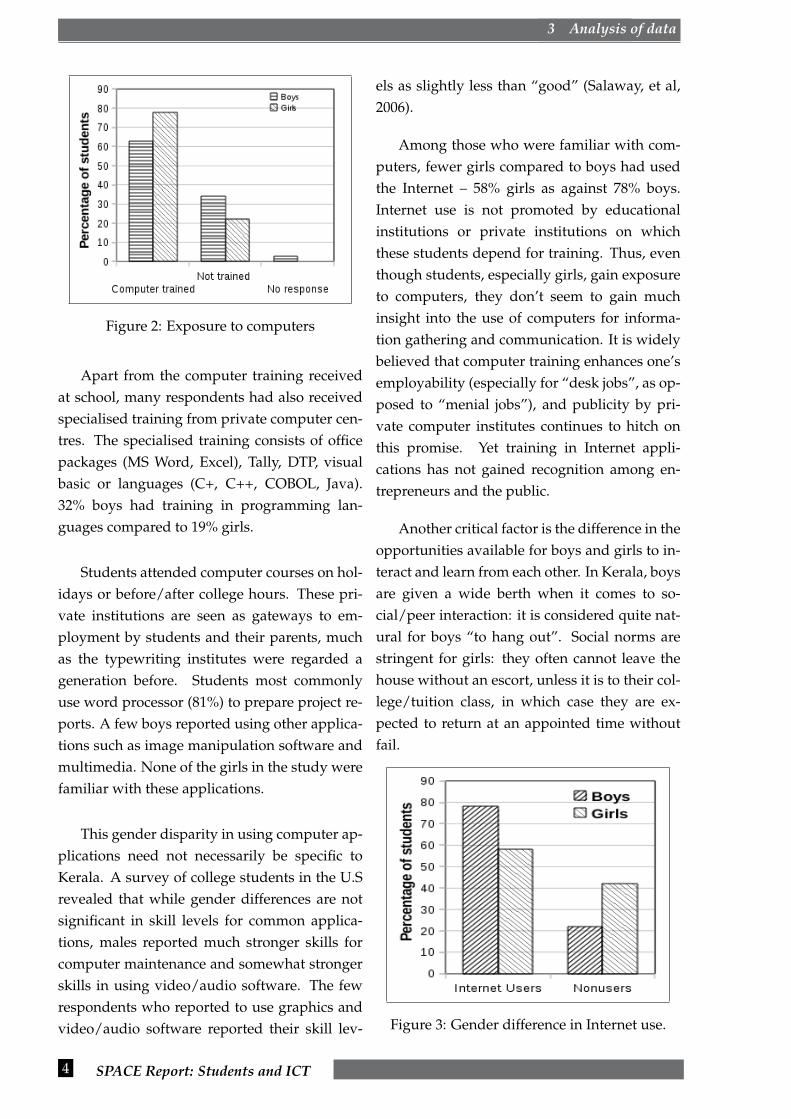
Among those who were familiar with com-
puters, fewer girls compared to boys had used
the Internet – 58% girls as against 78% boys.
Internet use is not promoted by educational
institutions or private institutions on which
these students depend for training. Thus, even
though students, especially girls, gain exposure
to computers, they don’t seem to gain much
insight into the use of computers for informa-
tion gathering and communication. It is widely
believed that computer training enhances one’s
employability (especially for “desk jobs”, as op-
posed to “menial jobs”), and publicity by pri-
vate computer institutes continues to hitch on
this promise. Yet training in Internet appli-
cations has not gained recognition among en-
trepreneurs and the public.
Another critical factor is the difference in the
opportunities available for boys and girls to in-
teract and learn from each other. In Kerala, boys
are given a wide berth when it comes to so-
cial/peer interaction: it is considered quite nat-
ural for boys “to hang out”. Social norms are
stringent for girls: they often cannot leave the
house without an escort, unless it is to their col-
lege/tuition class, in which case they are ex-
pected to return at an appointed time without
fail.
Figure 3: Gender difference in Internet use.
4 SPACE Report: Students and ICT

f3 Analysis of data
A large number of girls said that they did
not have anyone to demonstrate the use of In-
ternet applications. This is true even in the case
of girls who have a family member (usually an
older or younger brother) who accessed Inter-
net. Says a girl student from Kannur, “Internet
is very useful for education. You can’t imagine
the pain of those who can’t use the Internet”.
Similar sentiments were echoed by girls who ex-
pressed their desire to explore the net.
Not knowing how Internet could actually
“help” them was a problem for boys and girls
alike. They depended on books and notes
handed down by teachers, and accessed Inter-
net only when they had a project or assignment
due. They gathered information without any
critical awareness of the quality of content that
surfaced on a casual search of the net. When
asked about the sites they accessed, very few
students were able to give details of websites.
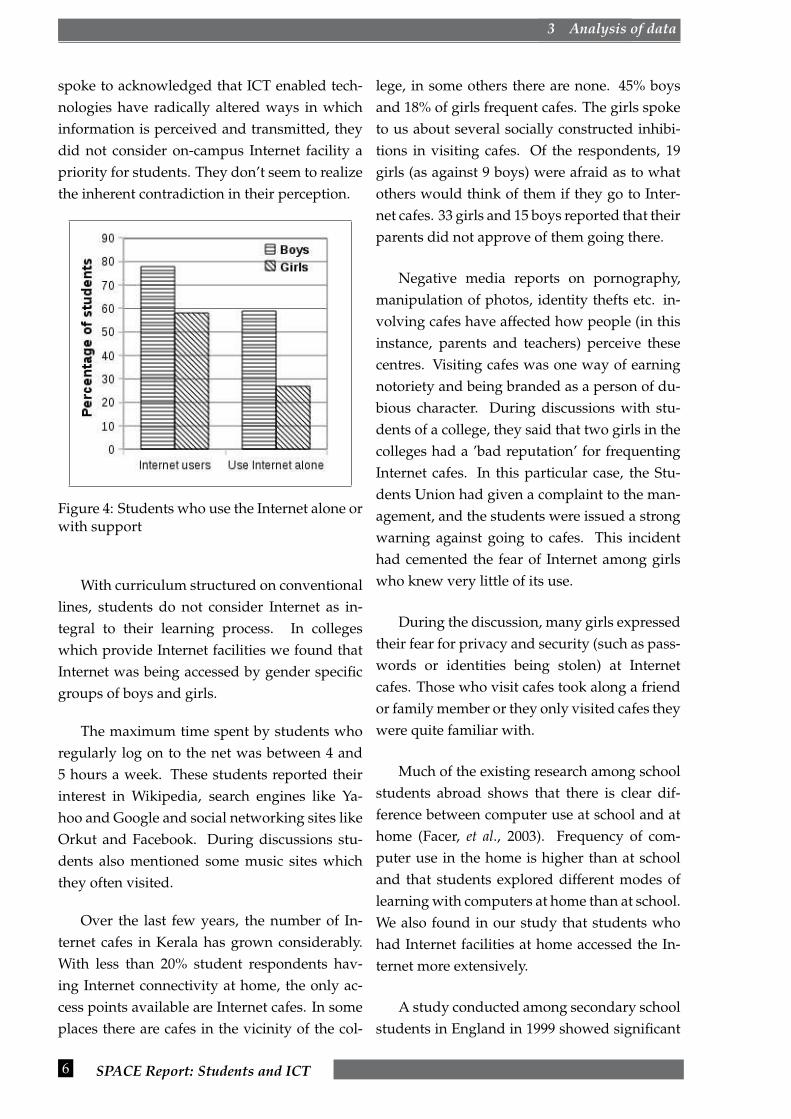
3.4 Ability and Confidence to use Inter-net
To assess ability of the students to access Inter-
net, we posed a question as to whether they
used Internet by themselves or with help of
someone. While 59% boys used Internet alone,
only 27% girls did so. In other words, more girls
than boys were using Internet with support or
by proxy. More girls (51%) coming from ur-
ban background used Internet without support
compared to girls from a panchayat area (25%).
But among boys, a large percentage (78%) from
a rural background accessed Internet by them-
selves.
During discussions with the girls, we found
that girls browsed Internet mostly to check ex-
amination results published by universities or
to collect information for their class assign-
ments. But this was most often a group activ-
ity, where one of the girls would take the lead.
These girls usually depend on net-savvy friends
or brothers to browse for exam results or to col-
lect material for their assignments. When asked
why they did so, they said they did not like
themselves to be seen ’fumbling on the com-
puter’ or they ’got lost while many sites opened
up’ and ’did not know how to return to what
they were looking for’ or ’what if they didn’t
get what they wanted’, etc.
Boys used Internet mostly for gathering in-
formation for assignments, to know exam re-
sults or notifications by university, for sending
and receiving emails, downloading music and
for chatting. Very few students were found to
be using social networking sites such as Orkut
and Facebook (only 7 students among those sur-
veyed used these sites regularly). Fig. 4 shows
the percentage of students who use the Internet.
Confidence levels among boys and girls in
accessing Internet for purposes such as for gath-
ering information is not high. (“Internet is a
good thing – but 75% of the people including
students don’t know how to use it” was the
opinion of a final year degree student). Out
of the 81 responses from a sample of 100 boys,
40 boys (roughly 50%) said they felt very confi-
dent. Only 46 girls in a sample of 100 were will-
ing to respond to the same question, of which
only 20 girls said they were confident. 8% of the
boys and 6% of the girls among the users do not
feel confident at all.
3.5 Access to Internet
Of the ten colleges covered by the study only
four provide Internet access to students. In one
of the colleges, Internet facility was withdrawn
(following complaints that students were “fool-
ing around on Orkut”) and later restored, but
administrative problems continue to dog the
smooth functioning of the computer cell. Al-
though all the college teachers/principals we
SPACE Report: Students and ICT 5
f3 Analysis of data
spoke to acknowledged that ICT enabled tech-
nologies have radically altered ways in which
information is perceived and transmitted, they
did not consider on-campus Internet facility a
priority for students. They don’t seem to realize
the inherent contradiction in their perception.
Figure 4: Students who use the Internet alone orwith support
With curriculum structured on conventional
lines, students do not consider Internet as in-
tegral to their learning process. In colleges
which provide Internet facilities we found that
Internet was being accessed by gender specific
groups of boys and girls.
The maximum time spent by students who
regularly log on to the net was between 4 and
5 hours a week. These students reported their
interest in Wikipedia, search engines like Ya-
hoo and Google and social networking sites like
Orkut and Facebook. During discussions stu-
dents also mentioned some music sites which
they often visited.
Over the last few years, the number of In-
ternet cafes in Kerala has grown considerably.
With less than 20% student respondents hav-
ing Internet connectivity at home, the only ac-
cess points available are Internet cafes. In some
places there are cafes in the vicinity of the col-
lege, in some others there are none. 45% boys
and 18% of girls frequent cafes. The girls spoke
to us about several socially constructed inhibi-
tions in visiting cafes. Of the respondents, 19
girls (as against 9 boys) were afraid as to what
others would think of them if they go to Inter-
net cafes. 33 girls and 15 boys reported that their
parents did not approve of them going there.
Negative media reports on pornography,
manipulation of photos, identity thefts etc. in-
volving cafes have affected how people (in this
instance, parents and teachers) perceive these
centres. Visiting cafes was one way of earning
notoriety and being branded as a person of du-
bious character. During discussions with stu-
dents of a college, they said that two girls in the
colleges had a ’bad reputation’ for frequenting
Internet cafes. In this particular case, the Stu-
dents Union had given a complaint to the man-
agement, and the students were issued a strong
warning against going to cafes. This incident
had cemented the fear of Internet among girls
who knew very little of its use.
During the discussion, many girls expressed
their fear for privacy and security (such as pass-
words or identities being stolen) at Internet
cafes. Those who visit cafes took along a friend
or family member or they only visited cafes they
were quite familiar with.
Much of the existing research among school
students abroad shows that there is clear dif-
ference between computer use at school and at
home (Facer, et al., 2003). Frequency of com-
puter use in the home is higher than at school
and that students explored different modes of
learning with computers at home than at school.
We also found in our study that students who
had Internet facilities at home accessed the In-
ternet more extensively.
A study conducted among secondary school
students in England in 1999 showed significant
6 SPACE Report: Students and ICT
f3 Analysis of data
gender differences in terms of access to comput-
ers at home, frequency of using computers and
the applications students spent most time using
ICT (Harris, 1999). Though our study revealed
no significant gender difference in access to In-
ternet at homes, we found that parents place re-
strictions on their daughters surfing the net.
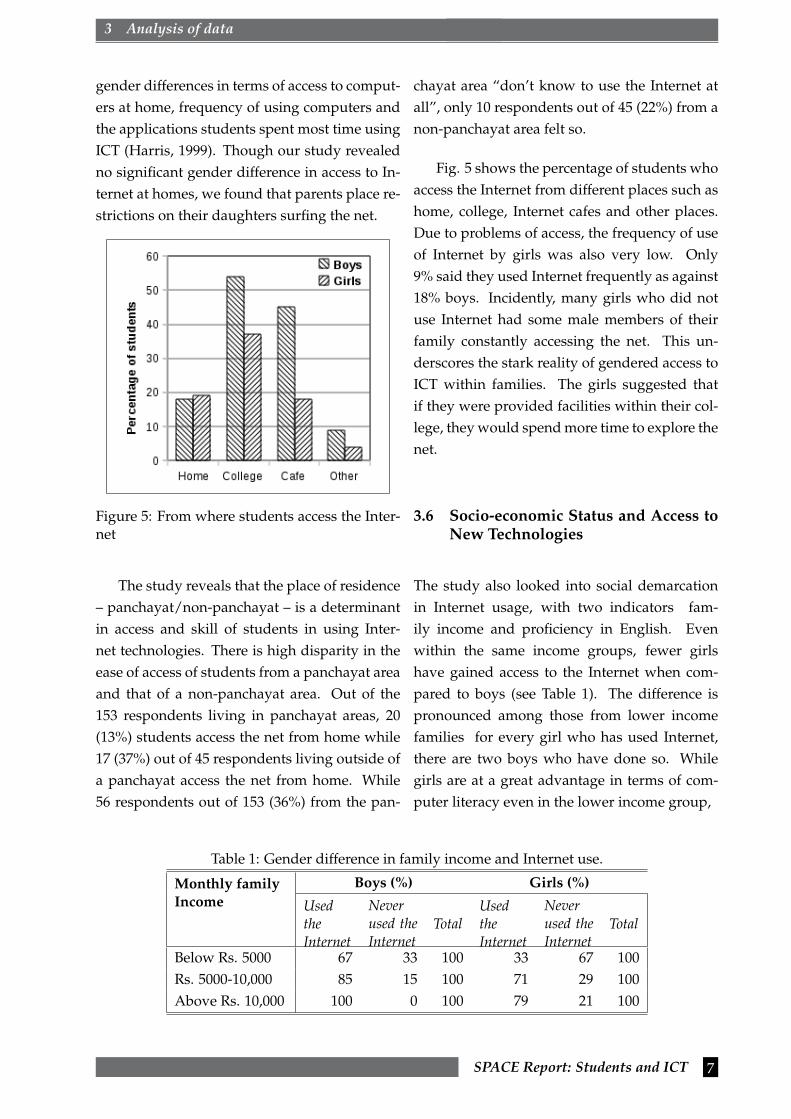
Figure 5: From where students access the Inter-net
The study reveals that the place of residence
– panchayat/non-panchayat – is a determinant
in access and skill of students in using Inter-
net technologies. There is high disparity in the
ease of access of students from a panchayat area
and that of a non-panchayat area. Out of the
153 respondents living in panchayat areas, 20
(13%) students access the net from home while
17 (37%) out of 45 respondents living outside of
a panchayat access the net from home. While
56 respondents out of 153 (36%) from the pan-
chayat area “don’t know to use the Internet at
all”, only 10 respondents out of 45 (22%) from a
non-panchayat area felt so.
Fig. 5 shows the percentage of students who
access the Internet from different places such as
home, college, Internet cafes and other places.
Due to problems of access, the frequency of use
of Internet by girls was also very low. Only
9% said they used Internet frequently as against
18% boys. Incidently, many girls who did not
use Internet had some male members of their
family constantly accessing the net. This un-
derscores the stark reality of gendered access to
ICT within families. The girls suggested that
if they were provided facilities within their col-
lege, they would spend more time to explore the
net.
3.6 Socio-economic Status and Access toNew Technologies
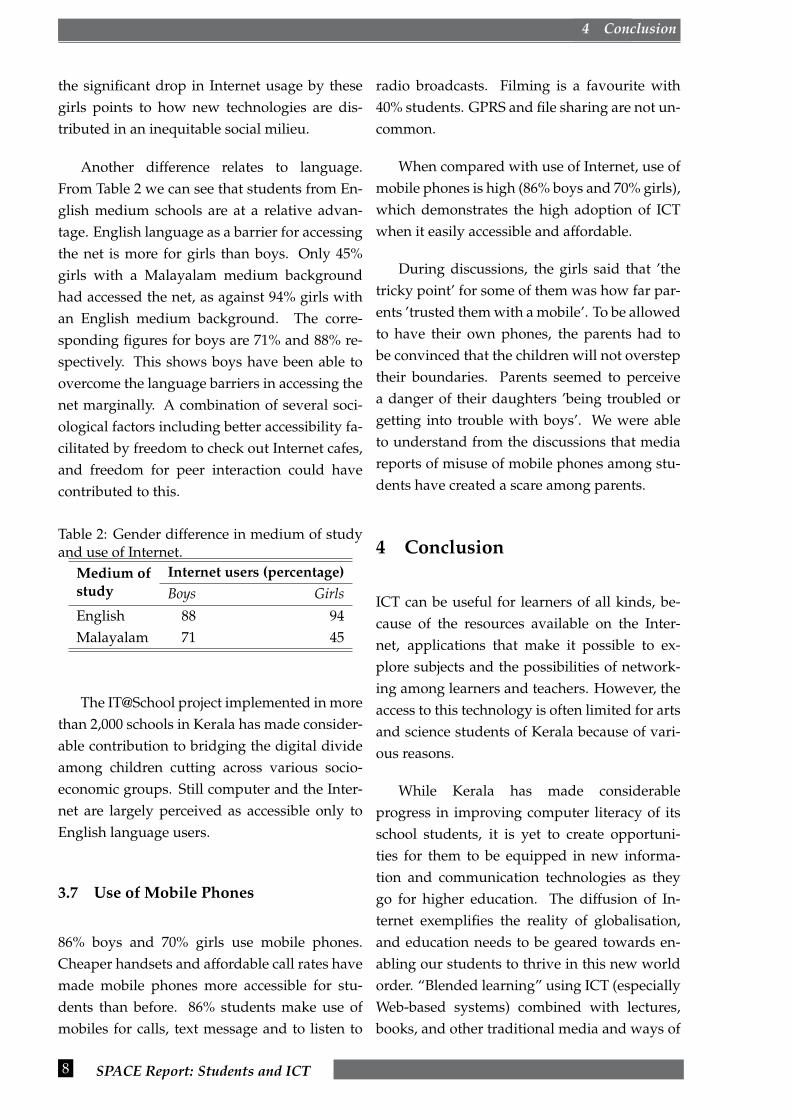
The study also looked into social demarcation
in Internet usage, with two indicators fam-
ily income and proficiency in English. Even
within the same income groups, fewer girls
have gained access to the Internet when com-
pared to boys (see Table 1). The difference is
pronounced among those from lower income
families for every girl who has used Internet,
there are two boys who have done so. While
girls are at a great advantage in terms of com-
puter literacy even in the lower income group,
Table 1: Gender difference in family income and Internet use.
Monthly family
Income
Boys (%) Girls (%)
UsedtheInternet
Neverused theInternet
TotalUsedtheInternet
Neverused theInternet
Total
Below Rs. 5000 67 33 100 33 67 100
Rs. 5000-10,000 85 15 100 71 29 100
Above Rs. 10,000 100 0 100 79 21 100
SPACE Report: Students and ICT 7
f4 Conclusion
the significant drop in Internet usage by these
girls points to how new technologies are dis-
tributed in an inequitable social milieu.
Another difference relates to language.
From Table 2 we can see that students from En-
glish medium schools are at a relative advan-
tage. English language as a barrier for accessing
the net is more for girls than boys. Only 45%
girls with a Malayalam medium background
had accessed the net, as against 94% girls with
an English medium background. The corre-
sponding figures for boys are 71% and 88% re-
spectively. This shows boys have been able to
overcome the language barriers in accessing the
net marginally. A combination of several soci-
ological factors including better accessibility fa-
cilitated by freedom to check out Internet cafes,
and freedom for peer interaction could have
contributed to this.
Table 2: Gender difference in medium of studyand use of Internet.
Medium of
study
Internet users (percentage)
Boys Girls
English 88 94
Malayalam 71 45
The IT@School project implemented in more
than 2,000 schools in Kerala has made consider-
able contribution to bridging the digital divide
among children cutting across various socio-
economic groups. Still computer and the Inter-
net are largely perceived as accessible only to
English language users.
3.7 Use of Mobile Phones
86% boys and 70% girls use mobile phones.
Cheaper handsets and affordable call rates have
made mobile phones more accessible for stu-
dents than before. 86% students make use of
mobiles for calls, text message and to listen to
radio broadcasts. Filming is a favourite with
40% students. GPRS and file sharing are not un-
common.
When compared with use of Internet, use of
mobile phones is high (86% boys and 70% girls),
which demonstrates the high adoption of ICT
when it easily accessible and affordable.
During discussions, the girls said that ’the
tricky point’ for some of them was how far par-
ents ’trusted them with a mobile’. To be allowed
to have their own phones, the parents had to
be convinced that the children will not overstep
their boundaries. Parents seemed to perceive
a danger of their daughters ’being troubled or
getting into trouble with boys’. We were able
to understand from the discussions that media
reports of misuse of mobile phones among stu-
dents have created a scare among parents.
4 Conclusion
ICT can be useful for learners of all kinds, be-
cause of the resources available on the Inter-
net, applications that make it possible to ex-
plore subjects and the possibilities of network-
ing among learners and teachers. However, the
access to this technology is often limited for arts
and science students of Kerala because of vari-
ous reasons.
While Kerala has made considerable
progress in improving computer literacy of its
school students, it is yet to create opportuni-
ties for them to be equipped in new informa-
tion and communication technologies as they
go for higher education. The diffusion of In-
ternet exemplifies the reality of globalisation,
and education needs to be geared towards en-
abling our students to thrive in this new world
order. “Blended learning” using ICT (especially
Web-based systems) combined with lectures,
books, and other traditional media and ways of
8 SPACE Report: Students and ICT
f4 Conclusion
teaching is already the norm in higher educa-
tion sector of many developed countries (Collis
& Wende, 2002).
Students of arts and science colleges, as
compared to students of professional courses,
do not receive exposure to ICTs since their
courses are largely modelled on conventional
pedagogy. The three year graduation course
does not involve any ICT related activity. There
are no ICT programmes to build on the capacity
of the students as visualised by the UGC at the
college level. Efforts in this direction are ad hoc,
and not systematised.
The present study also demonstrates the
gender divide in the access to ICT, and the social
acceptability of accessing Internet. The socio-
cultural ethos of Kerala makes Internet out of
bounds for girls, unless they are from high in-
come groups who can afford connectivity at
home. Although Internet cafes have prolifer-
ated the landscape of Kerala, these remain male
domains, denying safe and friendly access to
women.
New learning spaces need to be created to
address these concerns within institutions. Net-
worked computing facilities provided by col-
leges are inadequate. Colleges should provide
more networked computers to students, and fa-
cilitate fair and equitable access to Internet for
both boys and girls.
Training in ICT needs to be imparted to
both students and the faculty members of arts
and science colleges of Kerala. Internet liter-
acy does not imply skill sets alone. It also im-
plies knowledge about safeguards, guidelines
with which we need to arm our younger gen-
eration. Women-friendly/Women-only Internet
cafes need to be established and promoted by
organisations like SPACE, Kerala IT Mission etc.
Acknowledgements
This work was financially supported by Hivos,
the Netherlands. We thank SOMA, Thiruvanan-
thapuram, for their support. We are grateful to
the authorities of the colleges for permitting us
to conduct the surveys there and to the students
who participated in the surveys. We thank Sri
Sundar for help in editing the report and im-
proving it significantly.
SPACE Report: Students and ICT 9
fReferences
References
bridges.org. (2001), Spanning the digital divide Understanding and Tackling the Issues, Re-port, http://www.bridges.org/publications/65, [accessed 10 March 2010].
Collis B. & Wende M. (2002): Models of Technology and Change In Higher Education – Aninternational comparative survey on the current and future use of ICT in Higher EducationReport, http://doc.utwente.nl/44610/ [accessed 24 March 2010].
Facer K., Furlong J., Furlong R. & Sutherland R. (2003), ScreenPlay: Children and Comput-ing in the Home, London: Routledge.
Government of Kerala, http://www.itschool.gov.in/broadband/home.php [accessed 15March 2010]
Harris, S. (1999), Secondary school students use of computers at home, British Journal ofEducational Technology, 30(4), 331339.
Kerala State Higher Education Council, (2009), The Kerala State Policy for Higher Edu-cation, Draft for discussion, www.kerala.gov.in/education/high.htm [accessed 15December 2009].
Oliver, R. (2002), The role of ICT in higher education for the 21st century: ICT as a changeagent for education. In: HE21 Conference, Curtin University, Perth.
Panikker K.N, (2009), An Open University on the Anvil, www.digitallearning.in/interview/interview-details.asp?interviewid=701 [accessed 20 January 2010]
Salaway, G., Katz, R., & Caruso, J., (2006), The study of undergraduate students andinformation technology, EDUCAUSE Center for Applied Research, Volume 6,http://www.educause.edu/ecar/ [accessed 22 January 2010].
Staff Reporter, (2008), It is advantage Kerala, says IT Secretary, The Hindu Online, 8 January2008, http://www.hinduonnet.com/2008/01/08/stories/2008010850560200.htm[accessed 12 December 2009].
Starr, L. (2001), Same time this year, http://www.education-world.com/a tech/tech075.shtml [accessed 21 February 2010].
Veeramacheneni B., Vogel R. & Ekanayakeet E.M. (2008), “ICT in Education in India”in Richard Vogel (ed), NYSEA Papers and Proceedings, New York : New York StateEconomics Association, pp. 104-114.
10 SPACE Report: Students and ICT
fAnnexure: Questionnaire
Annexure: Survey Questionnaire
ICT Use among Students of Arts and Science Colleges in Kerala
Questionnaire
Code No.
Personal Details
Name :
1. Gender : Male Female
2. Age :
3. Marital Status : Married Unmarried
4. You live in a : Panchayat Muncipality Corporation
5. Monthly family income :
Below Rs 5,000
Rs 5,000-10,000
Above Rs 10,000
6. Religion : Hindu Christain Muslim Other
7. Which of the following activities interests you most (rank the activities below inorder of your interest, giving 1 to the one that most interests you and so on.)
Studies and related activities
Hobbies/games
Socialising with friends
Others (Please specify)..........................................................
Educational/technical background
8. The school you studied islocated in
: Panchayat Muncipality Corporation
9. Medium of instruction atschool
: Malayalam English Other
10. Academic performance inyour last exam
: Below 50% 50%-80% Above 80%
Computer, internet and You
11. Have you undergone anycomputer course?
: Yes No
12. Which of the following applications do you use in a computer?
Word processor (Word, Open Office Writer etc)
Spread sheet (Excel, Open Office Calc etc)
Image editors (Photoshop, Gimp etc..)
Others (Please specify)..........................................................
I have never used any computer applications
SPACE Report: Students and ICT 11
fAnnexure: Questionnaire
13. Have you ever used the in-ternet?
Yes No
(If No, go to Question 21)
14. If yes, rank the following internet services according to your use. (Give 1 to theservice you use the most, 2 to the service you use next and so on)
Search
Chatting
Games
Blogging (blogspot,wordpress etc)
Social Network
YouTube/Flickr
Wikepedia, MIT open course ware etc
Others (Please sphecify) ..................................................
15. Which of these statements best describes the way you feel about the internet?
I feel very confident about using the internet
I feel I can manage somewhat
I’m not confident
16. From where did you learn to use the internet?
Institution
Friends/relatives
Self-taught
Others (Please specify) ......................................
17. For how long have you been using the internet?
For less than one year
For more than one year
18. How often do you use the Internet?
Frequently
Occcasionally
Rarely
19. From where do you access the internet?
Home
College
Internet cafe
Others (Please specify).......................
20. Which are the websites you visit frequently? (Please specify 3 names)
(1).....................................................
12 SPACE Report: Students and ICT
fAnnexure: Questionnaire
(2).....................................................
(3) ....................................................
21. Which of the following factors affect your internet usage? (Please tick any 4)
I’m not interested in internet
I dont know how the internet can help me
I dont know to use the internet at all
There is no one to show me how to use the internet
My parents do not approve of me going to internet cafesI’m afraid what others will think of me when I go to aninternet cafe.I personally dont like going to internet cafes
I don’t have the money to pay at internet cafes
Others (Please specify).........................................................................
22. Does any one in your im-mediate family use the in-ternet?
Yes No
22.1 If yes, how is he/she related to you?.........................................................
23. Do you think that yourinstitution supports theuse of computer/internetamong the students?
Yes No
24. In general, you think the internet is .........................................................................
.......................................................................................................................................
25. In your opinion, how does the internet support education?.......................................
........................................................................................................................
26. In your opinion, how does the internet support employment oppurtunities?
.............................................................................................................................
..............................................................................................................................
27. Do you think college stu-dents should be providedtraining in computers andinternet?
Yes No
Mobile Phone and You
28. Do you use a mobilephone?
Yes No
( If No, go to Question 30)
29. Which are the services you use on your mobile phone? (Tick all the relevant options)
Voice Call
SMS
Multimedia Messages
GPRS/Internet
SPACE Report: Students and ICT 13
fAnnexure: Questionnaire
File sharing
FM Radio/lisetening to music
Filming (photo and video)
Others (Please specify) .........................................................
30. If you dont use a mobile, what are the reasons for not doing so? (Tick the appropriate response)
I dont like using a mobile phone
My parents dont allow me to use a mobile
I cant afford a mobile phone
Others (specify) ..................................................
14 SPACE Report: Students and ICT

���������������� ��������������������� ������������ ���� ���
������������� ������������������������ ����������� ����������������
���� !!∀∀∀#���∃�%� ���# &
∋()���∀���∗ ���������� �� �������������∗�� ∗��������������∃�����∃���������∃ ���
+� ����∀����� ������� ����∗�∗ �����∗��∀���&�#�∋()���∃���� �����∀����
����������������������∗ ��&�� ���������%&�� �������∃ � ���������∃�����∃�
��∃& �����∗ �& ���� ��� ��∃����������∃�#�∋()���∀ �������������∃ ���������∗∗� �
� ��∃��������� ��∃���∀��∃�������∃���∃���������∃���∃�����������#�������&%�� ��
&���∗�∋()��������� ����,−∋∋%��������������������∃�������������������∃���������∃���∃������������∗����������∃������
�� &���������∃���������#
, ��������∃������������.���������/���� ����/�0���� �������1��������� �������������∗�2��∃∃�����∗����� ���∃������3���������∗%∀������& �������∗ �������4�� ������ ������∀� ��∗ ������ ������������������4� �������� �∃�� � �������#�5� ��&����������6����� ���1�����������������∗ ��������� &���������∗ ��������� � �����&��������������&�∃��� ��������∃�������� �����∀ � &����������� ����&�∗ �∗ ����������� �∗ ���∃���������������� ��&������&�∗��∃������������ �%� ���∃�����&��∃������������������ �������∃���&��&�∀ ��#�1�������� ���∋()��#