Embed Size (px)
Citation preview
Page 1
QUALITY CONTROL OF CONCRETE STRUCTURES USING IR THERMOGRAPHY
Bojan Milovanović (1), Ivana Banjad Pečur (1) and Nina Štirmer (1)
(1) Department of Materials, Faculty of Civil Engineering, University of Zagreb, Croatia
Abstract The objective of condition assessment of existing reinforced concrete structures is to
provide insight into current condition of the observed structure, to predict development of deterioration, and to assess the influence of defects found on the safety and life expectancy of the structure. NDT using IR thermography generally consists of thermal stimulation of the object under examination and monitoring of its surface temperature variation during the transient heating or cooling phase. The existence of inhomogeneities in the core material affects the heat transfer and thus causes local changes of temperature distribution on the surface of the observed structure, which is then recorded using an IR camera.
In this paper, the use of active IR thermography technique for detecting defects in reinforced concrete structures will be presented. Possible use of active thermography with post processing techniques that can be applied for detecting the defects in near surface region of reinforced concrete structures will also be presented.
Step heating (SH) thermography, pulsed phase (PPT) thermography, principle component thermography (PCT) and correlation operators’ technique were used in the post-processing of thermogram sequences in order to determine the existence of defects in concrete samples.
1. INTRODUCTION
Over the past few years, many techniques have been developed in order to evaluate the state of reinforced concrete structures, to detect the location and the extent of construction defects or damaged zones in a non-destructive way [1]. Although infrared (IR) thermography has been widely used in civil engineering for the identification of heat losses in building envelopes, it has been realized its potential as one of the non-destructive thermal methods for NDT of materials and structures [2- 4]. IR thermographic investigation techniques are based on the fundamental principle that materials with subsurface anomalies in a material affect heat

Page 2
flow through that material. These changes in heat flow cause localized differences in surface temperature during the transient heating and/or cooling phase. The analysis is performed by relating to heat conduction in solids where thermal energy propagates by diffusion under the surface while an IR camera monitors the surface temperature variation [1,5,6], Figure 1. The only precondition for detection is that defects in the object under examination lead to a sufficient variation of thermal properties compared to the bulk material [7].
Figure 1: Thermal excitation of the object under examination using IR thermography
1.1 Motivation for the research IR thermography, specifically the technique of passive thermography, has been used in
Civil Engineering for the last 40 years. The method has been applied to the identification of internal voids, delaminations, and cracks in concrete structures such as bridge decks highway pavements parking garages, pipelines and other applications [4, 8, 9, 10]. ASTM D 4788 describes the use of infrared thermography for detecting delaminations in concrete bridge decks, with and without asphalt overlays. This standard defines restrictions and limitations of the method, which are mainly concerned with the problems of the emitted radiation from the surface (emissivity) caused by the residues, traces of damage etc. together with required proper environmental conditions present for testing, varying environmental conditions during testing (temperature gradient, shaded or direct sunlight, cloud cover and surface water).
a) b) c)
Figure 2: Thermogram and a photograph of defected bridge deck of Krapina bridge [3]
Authors conducted testing using IR thermography of bridge decks during condition assessment of several bridges, Figure 2. Although existing defects (cracks, inclusions) on the pavement of the bridge deck are visible from the thermograms presented in Figure 2, it is evident that there is significant impact of the emissivity change on the surface even though the

Page 3
whole surface is of the same material, Figure 2b). These problems occur due to the ruts, accumulated rubber, slight changes in the surface colour, together with road markings.
Additionally, for the defects visible in Figure 2c), only qualitative analysis is possible, while the quantitative characteristics (size and depth) cannot be determined. This leads to the practical issue that it is not possible to determine whether the defects are located in the asphalt layer (and if so, is it in the asphalt wearing of asphalt base layer, or both), concrete bridge deck, or the problem occurred on the interface of layers. Moreover, it has been proven that testing is possible only with direct sunlight on the surfaces in question; furthermore, one needs to achieve transient conditions while testing. If transient conditions are not achieved, it was proved difficult, if not impossible to determine the existence of defects in concrete [3].
As seen from above, NDT of concrete structures using IR thermography, based on passive techniques has a number of limitations and drawbacks. Therefore, active thermography techniques are more and more applied in detecting damages in materials and structures.
2. EXPERIMENTAL WORK
A literature review was used to analyze approach of individual researchers to using IR thermography for defects determination in concrete structures. Based on the results found, specimen and defect size, together with thermal excitation used by the researchers, samples used in presented paper were determined. Specimen size was defined by the need of transferring specimens (limited by the dimensions and weight) and conditioning of the specimens, while on the other hand, specimens needed to be large enough to be able to simulate real defects, without the influence of edges or the influence of defects between themselves on the temperature field. The effect of reinforcement spacing on the possibility of detection of defects was also investigated. Influences of concrete properties (density and moisture content), on the possibility to carry out measurements were also investigated.
Figure 3: Experimental setup of
the thermal excitation Figure 4: Schematics of the concrete test specimen
with polystyrene defects [3]
The research was conducted by using reflecting method, where surface temperature was monitored during 60 minute thermal excitation, together with the cooling period lasting also 60 minutes, Figure 3. Thermal excitation was performed using 1000 W halogen lamp, where heating distances were 1.5; 2.0 and 3.0 m from the surface of concrete specimens.

Page 4
A schematic drawing of the concrete test specimen is shown in Figure 4. For simulating compaction defects and voids, defects made of polystyrene foam have been incorporated. These defects vary in size (discs of 15 cm in diameter and rhombus 17×12.6 cm both with thickness of 4 cm). Within the sample, defects are positioned underneath the reinforcement with different rebar spacing. The samples were tested from both sides, while the reinforcement was placed only from one side.
To perform experiments presented in this paper, an IrNDT system, manufactured by Automation Technology GmbH was used, where halogen lamp was used as the thermal excitation source. IR camera FLIR ThermaCAM P640 was used with spectral range from 7.5 - 13 µm, thermal sensitivity (NETD) 60 mK @ 30°C. The IR camera is connected to the computer and the thermal excitation using the active thermography electronic interface.
In the post-processing of thermogram sequences after step heating (SH) thermography was used to collect sequences of thermograms, pulsed phase (PPT) thermography, principle component thermography (PCT) and correlation operators’ techniques were used in order to determine the existence of defects in concrete samples.
3. POST-PROCESSING TECHNIQUES
3.1 Pulsed phase (PPT) thermography Pulse phase thermography (PPT) is the active IR technique which enables the collected
data to be transformed from the time domain to the frequency domain using one-dimensional discrete Fourier transform (DFT) [11, 12]. PPT is well known for NDT of materials and structures. It combines features of pulse thermography (PT) and lock-in thermography (LT) techniques and thus enables an easy data acquisition and fast data analysis.
The pulsed forms (square and thermal decay) can be approximated by a sum of purely harmonic waves (sinusoids) oscillating at different frequencies, ranging from 0 to ∞, [13]. In practice, actual frequencies (minimum, maximum), as well as frequency resolution, depend on equipment limitations as well as on sampling and truncation parameters. Hence, it is possible to extract a certain number of thermal waves from a thermal pulse, each one having a different frequency, amplitude and phase delay, though a transformation algorithm such as the FT [13].
In PPT, thermal data is processed executing the FT on the collected thermogram sequence:
(1)
Where (j2=-1), “n” designates the frequency increment, “∆t” is the sampling interval, and “Re” and “Im” are the real and the imaginary parts of the transform, respectively. Real and the imaginary parts of the transform are being used for calculating the amplitude “A” and the phase delay “Ø” of the transform.
, (2)
Discrete frequencies “fn” for which phase delay (phasegrams) and amplitude (ampligrams) images can be reconstructed are given with the following equation [12]:
(3)
�� = ∆� � ��∆���−�2��� � = ��� + ����−1
=0
�� = ����2 + ���2 ∅� = tan−1 �������
!� = ��∆

Page 5
The maximum frequency is limited by the sampling rate of the thermograms; and therefore with the characteristics of the equipment used, in particular with the camera characteristics, while the minimum frequency is determined by the duration of the experiment, i.e. the number of thermograms in the sequence.
3.2 Principle component thermography (PCT) Principal Component Analysis (PCA) is a statistical analysis tool used for identifying
patterns in data and expressing the data in way to highlight the similarities and differences in the patterns. The pattern matching of the data becomes very difficult when the data dimension is very high. In such situations PCA comes in handy for analyzing and graphically representing of such data. Once the patterns in the data are found, the data is compressed by reducing the data dimensions without much loss of information [14].
PCA applied to the data in the form of thermogram sequence is called PCT. The image data captured by the IR cameras consist of undesirable signals and noise along with the IR image data. These image sequences are to be processed to eliminate the undesirable signals and enhance the useful IR information. The PCT used for processing IR sequences is based on thermal contrast evaluation in time. The PCT analysis is based on the second order statistics of IR image data. The thermal image sequence containing the information about the sample is processed using singular value decomposition (SVD) based PCT. The 3D image matrix is converted to 2D matrix as described in [3, 14]. Results of the PCT are empirical orthogonal functions (EOF) which are constructed from a set of orthogonal statistical modes that provide the strongest projection for the data.
3.3 Correlation operators technique In probability theory and statistics, the correlation coefficient indicates the strength and
direction of a linear relationship between two variables. In the IR context, the correlation coefficient refers to the strength and direction of the linear relationship between a given temperature evolution reference and all the temperature evolution of the pixels over the specimen under inspection. The correlation coefficient image is mostly sensitive to material changes, being much less sensitive to temperature non-uniformities or initial heat absorption as these are temperature offsets in terms of temperature evolution. The effect of offsets is cancelled in correlation computation as offsets do not change the linear relationship between two variables [15]. Correlograms can be constructed by comparison of temperature development of one pixel of the thermogram with the development of reference temperature of the thermogram sequence in question. Reference temperature can be set by hand or as the development of average temperature value of all thermogram pixels in time, whereby one avoids subjective influence on the test results. Choosing one pixel or another will change the correlation coefficient because of variations in non-uniform heating, emissivity variations, etc.
4. RESULTS
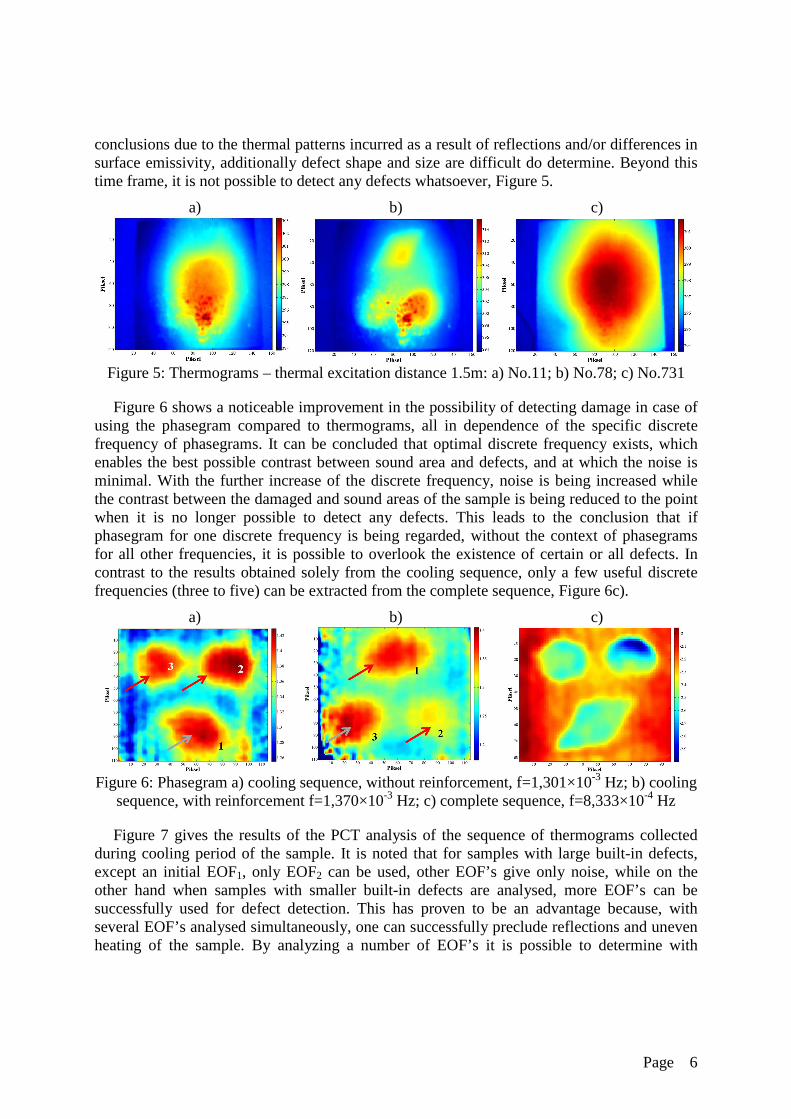
Figure 5 gives the comparison of thermograms of the complete sequence (heating and cooling period of the sample). From the thermograms presented, it can be concluded that the possibility of detecting defects in concrete samples is unsatisfactory, since it is only possible to detect defects in a short time frame in time when there are optimum conditions within the sample achieved thus giving the greatest temperature contrast on the surface. Even then it is possible to overlook some of the existing defects in concrete or to come to false positive
Page 6
conclusions due to the thermal patterns incurred as a result of reflections and/or differences in surface emissivity, additionally defect shape and size are difficult do determine. Beyond this time frame, it is not possible to detect any defects whatsoever, Figure 5.
a) b) c)
Figure 5: Thermograms – thermal excitation distance 1.5m: a) No.11; b) No.78; c) No.731
Figure 6 shows a noticeable improvement in the possibility of detecting damage in case of using the phasegram compared to thermograms, all in dependence of the specific discrete frequency of phasegrams. It can be concluded that optimal discrete frequency exists, which enables the best possible contrast between sound area and defects, and at which the noise is minimal. With the further increase of the discrete frequency, noise is being increased while the contrast between the damaged and sound areas of the sample is being reduced to the point when it is no longer possible to detect any defects. This leads to the conclusion that if phasegram for one discrete frequency is being regarded, without the context of phasegrams for all other frequencies, it is possible to overlook the existence of certain or all defects. In contrast to the results obtained solely from the cooling sequence, only a few useful discrete frequencies (three to five) can be extracted from the complete sequence, Figure 6c).
a) b) c)
Figure 6: Phasegram a) cooling sequence, without reinforcement, f=1,301×10-3 Hz; b) cooling
sequence, with reinforcement f=1,370×10-3 Hz; c) complete sequence, f=8,333×10-4 Hz
Figure 7 gives the results of the PCT analysis of the sequence of thermograms collected during cooling period of the sample. It is noted that for samples with large built-in defects, except an initial EOF1, only EOF2 can be used, other EOF’s give only noise, while on the other hand when samples with smaller built-in defects are analysed, more EOF’s can be successfully used for defect detection. This has proven to be an advantage because, with several EOF’s analysed simultaneously, one can successfully preclude reflections and uneven heating of the sample. By analyzing a number of EOF’s it is possible to determine with

Page 7
certainty the existence of damage in greater depth, and it is possible to qualitatively determine relative depth of defects and their relative thicknesses [3].
a) b) c)
Figure 7: PCT – thermal excitation distance 1.5 m: a) without reinforcement – EOF3; b) with
reinforcement between defects and surface – EOF3; c) 3D image
Figure 8 gives the correlation images (correlograms) for the cooling sequence of thermograms. The colorbar value shows the 5th root of 1-c, where c is the computed correlation coefficient. Defects viewed in correlograms manifest in the way that their edge is defined by the significant decline in the value of the correlation coefficient, while their center is defined by the high correlation coefficients, but not as high as the ones around the edges of the sample. It can generally be concluded that correlation operators’ technique can be used to detect defects of, at least, 10 cm in diameter and maximum depth of 40 mm, with the thermal excitation used in this research at the distance of 2m [3]. It would be possible to detect larger defects deeper within the concrete with this, or more powerful thermal excitation.
a) b) c)
Figure 8: Correlograms – thermal excitation distance 2 m: a) without reinforcement; b) with
reinforcement between defects and surface; c) 3D image
5. CONCLUSIONS
The purpose of this paper was to present active techniques of IR thermography that could be used for detection of near-surface inhomogeneities and common subsurface defects in concrete elements. Optimal thermograms obtained using reflective method of testing was presented; together with examples of test results processed using FFT, PCT and correlation operators’ technique. Results presented in this paper, and the conclusions derived from them were obtained using step heating technique of thermal excitation.
The results show a noticeable improvement in the possibility of detecting damage in case of using the phasegrams, EOF’s and correlograms compared to thermograms. From the presented, it is evident that the existence of reinforcement affects the possibility of detecting

Page 8
defects and its characterization (size and shape), the contrast between the defect located behind reinforcement and the sound area is smaller thus decreasing its detection possibility.
Finally, it can be concluded that the results obtained using the method of active IR thermography are such that the post-processing methods of thermogram sequences presented in this paper can be used to detect defects in reinforced concrete structures. Nevertheless, one has to be careful when interpreting results in order to avoid false positive results or overlooking of defects, it is advisable to compare results from all three techniques to come to correct conclusions. The presented research demonstrate active thermography is a very useful tool for detection of defects in concrete, 10 cm in diameter up to 4 cm in depth, while the large defects can be detected up to the depth of 10 cm.
ACKNOWLEDGEMENTS
The research was performed within the project “From Nano to Macro-structure of Concrete”, 082-0822161-2990, funded by Croatian Ministry of Science, Education and Sport.
REFERENCES
[1] Malhotra ,V. M., and Carino, N. J., 'Handbook on Nondestructive testing of Concrete', Second Edition, CRC Press, 2004.
[2] Meola, C., 'A new approach for estimation of defects detection with infrared thermography', Materials Letters, No 61, pp 747–750, 2007.
[3] Milovanović, B., 'Application of Infrared Thermography for Defect Characterization in Reinforced Concrete', University of Zagreb, Faculty of Civ. Eng., Thesis, 2013 (in Croatian)
[4] Milovanović, B. and Banjad Pečur, I., 'Determination of material homogeneity using infrared thermography', Proc. of V Conferencia Panamericana de Ensayos No Destructivos, Cancun, 2011.
[5] Meola, C. and Carlomagno, G. M., 'Recent advances in the use of infrared thermography', Measurement Science and Technology, No 15, pp R27–R58, 2004.
[6] Maierhofer, C., 'Transient thermography for structural investigation of concrete and composites in the near surface region', Infrared Physics & Technology 43 (3-5), 271-278, 2002.
[7] Maierhofer, C., Arndt, R. and Röllig, M., 'Influence of concrete properties on the detection of voids with impulse-thermography', Infrared Physics & Technology, No 49, pp 213–217, 2007.
[8] Holt, F. B. and Manning, D. G., 'Infrared Thermography for the Detection of Delaminations in Concrete Bridge Decks', Proceedings 4th Infrared Information Exchange pp. 61–71, 1978.
[9] Weil, G. J., 'Infrared Thermographic Techniques', in V. M. Malhotra & N. J. Carino (Eds.), Handbook on NDT of Concrete (pp. 305–316). Boca Raton, Florida: CRC Press, 1991.
[10] Clark, M. R., McCann, D. M. and Forde, M. C., 'Application of infrared thermography to the non-destructive testing of concrete and masonry bridge', NDT&E International, 36, 265–275, 2003.
[11] Ibarra-Castanedo, C., Genest, M., Servais, P., Maldague, X. P. V., and Bendada, A.: 'Qualitative and quantitative assessment of aerospace structures by pulsed thermography', Nondestructive Testing and Evaluation, 22(2-3), 199–215, 2007.
[12] Maldague, X. P. V., 'Theory and Practice of Infrared Technology for Nondestructive Testing', (K. Chang, Ed.) (p. 684). John Wiley & Sons, Inc., 2001.
[13] Ibarra-Castanedo, C., 'Quantitative subsurface defect evaluation by pulsed phase thermography: depth retrieval with the phase', Universite Laval Quebec, Thesis, 2005
[14] Parvataneni, R., 'Principal component thermography for steady thermal perturbation scenarios', Clemson University, Thesis, 2009.
[15] Klein, M. T., Ibarra-Castanedo, C., Bendada, A., & Maldague, X. P. V., 'Thermographic signal processing through correlation operators in pulsed thermography', in V. P. Vavilov & D. D. Burleigh (Eds.), Thermosense XXX Proc. of SPIE Vol. 6939, Orlando, FL, 2008.
![Vollverb oder Auxiliar? - slm.uni-hamburg.de · Subordination Ilʼča ima-m-tɨ qo-lä čur-a. grandfather woman-ACC-OBL.3SG sight-CVB cry-AOR[3SG] [Nord: Taz] ‘Als der Großvater](https://img.pdfslide.net/doc/110x75/5e065a56bb530f230659fd4f/vollverb-oder-auxiliar-slmuni-subordination-ila-ima-m-t-qo-l-ur-a.jpg)


![MILOVANOVI] MIROSLAV, DIPL. IN@. TEHNOLOGIJE book/Aerozagadjenje - Sveska4.pdfsir}etne kiseline u vazduhu bi se zna~ajno raslojavale od vazduha i padale ka tlu. Pare sir}etne kiseline,](https://img.pdfslide.net/doc/110x75/60a7deeeea41ed33940e1191/milovanovi-miroslav-dipl-in-bookaerozagadjenje-sveska4pdf-siretne-kiseline.jpg)
![MILOVANOVI] MIROSLAV, DIPL. IN@. TEHNOLOGIJE book/Aerozagadjenje - Sveska3.pdfrafinisani metanola dva pufer rezervoara od 300 m3, kao i rezervoar od 11 000 m3. Rafinisani metanol je](https://img.pdfslide.net/doc/110x75/5e2cc5b056bfc93ba622e202/milovanovi-miroslav-dipl-in-bookaerozagadjenje-sveska3pdf-rafinisani-metanola.jpg)