Embed Size (px)
Citation preview
8/13/2019 ID0341-IBGAP-1455_Expanding Options for Income Generation as Interest Rates Rise_v2_rr
http://slidepdf.com/reader/full/id0341-ibgap-1455expanding-options-for-income-generation-as-interest-rates 1/6
globalspdrs.com FOR PROFESSIONAL AND INSTITUTIONAL INVESTOR USE ONLY. NOT FOR PUBLIC USE.
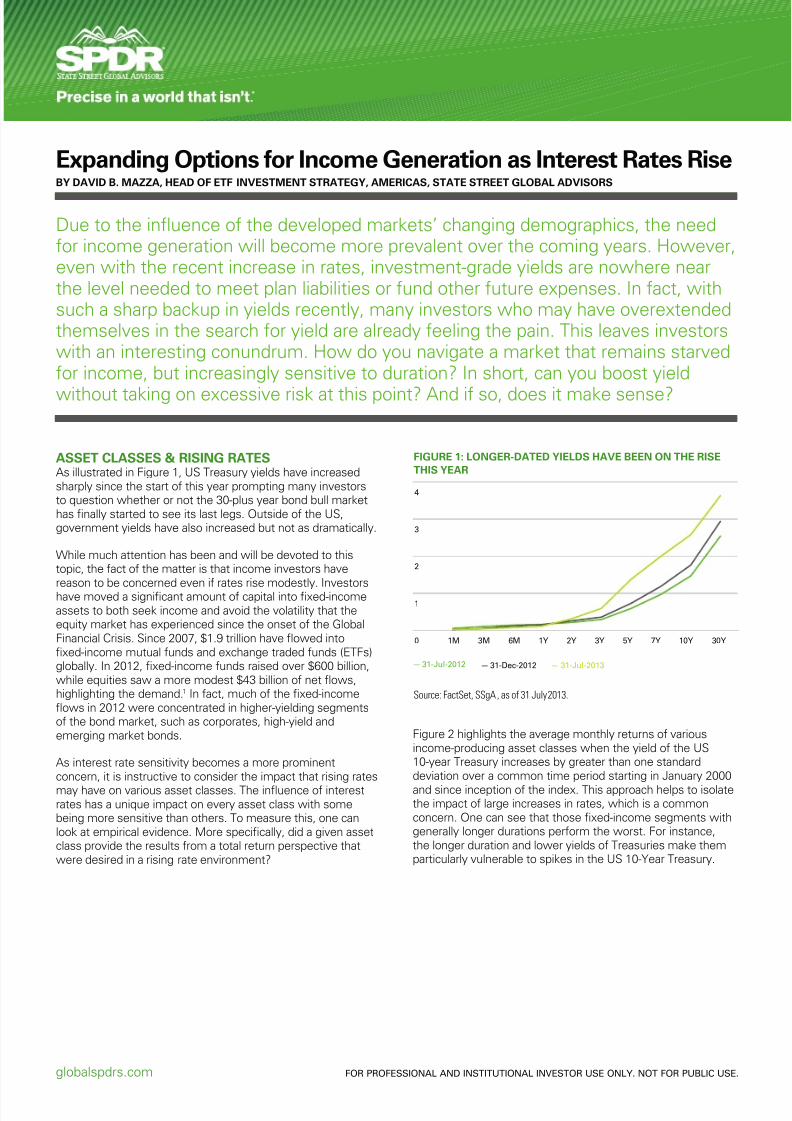
Expanding Options for Income Generation as Interest Rates RiseBY DAVID B. MAZZA, HEAD OF ETF INVESTMENT STRATEGY, AMERICAS, STATE STREET GLOBAL ADVISORS
Due to the influence of the developed markets’ changing demographics, the needfor income generation will become more prevalent over the coming years. However,even with the recent increase in rates, investment-grade yields are nowhere nearthe level needed to meet plan liabilities or fund other future expenses. In fact, withsuch a sharp backup in yields recently, many investors who may have overextendedthemselves in the search for yield are already feeling the pain. This leaves investorswith an interesting conundrum. How do you navigate a market that remains starvedfor income, but increasingly sensitive to duration? In short, can you boost yield
without taking on excessive risk at this point? And if so, does it make sense?
ASSET CLASSES & RISING RATESAs illustrated in Figure 1, US Treasury yields have increasedsharply since the start of this year prompting many investorsto question whether or not the 30-plus year bond bull markethas nally started to see its last legs. Outside of the US,government yields have also increased but not as dramatically.
While much attention has been and will be devoted to thistopic, the fact of the matter is that income investors havereason to be concerned even if rates rise modestly. Investorshave moved a signi cant amount of capital into xed-incomeassets to both seek income and avoid the volatility that theequity market has experienced since the onset of the GlobalFinancial Crisis. Since 2007, $1.9 trillion have owed into
xed-income mutual funds and exchange traded funds (ETFs)globally. In 2012, xed-income funds raised over $600 billion,while equities saw a more modest $43 billion of net ows,highlighting the demand. 1 In fact, much of the xed-income
ows in 2012 were concentrated in higher-yielding segmentsof the bond market, such as corporates, high-yield andemerging market bonds.
As interest rate sensitivity becomes a more prominentconcern, it is instructive to consider the impact that rising ratesmay have on various asset classes. The in uence of interestrates has a unique impact on every asset class with somebeing more sensitive than others. To measure this, one canlook at empirical evidence. More speci cally, did a given assetclass provide the results from a total return perspective thatwere desired in a rising rate environment?
Figure 2 highlights the average monthly returns of variousincome-producing asset classes when the yield of the US10-year Treasury increases by greater than one standarddeviation over a common time period starting in January 2000and since inception of the index. This approach helps to isolatethe impact of large increases in rates, which is a commonconcern. One can see that those xed-income segments withgenerally longer durations perform the worst. For instance,the longer duration and lower yields of Treasuries make themparticularly vulnerable to spikes in the US 10-Year Treasury.
FIGURE 1: LONGER-DATED YIELDS HAVE BEEN ON THE RISETHIS YEAR
Source: FactSet, SSgA, as of 31 July 2013.
— 31-Jul-2012
0
1
2
3
4
1M 3M 6M 1Y 2Y 3Y 5Y 7Y 10Y 30Y
— 31-Dec-2012 — 31-Jul-2013

8/13/2019 ID0341-IBGAP-1455_Expanding Options for Income Generation as Interest Rates Rise_v2_rr
http://slidepdf.com/reader/full/id0341-ibgap-1455expanding-options-for-income-generation-as-interest-rates 2/62
FOR PROFESSIONAL AND INSTITUTIONAL INVESTOR USE ONLY. NOT FOR PUBLIC USE.
Monthly losses averaged 0.88% and 1.25% for TIPS. Inaddition, US investment grade corporate bonds were similarlyimpacted falling 1.42%. Global xed-income indices generallyexhibit similar behavior with many segments generatingnegative returns on average.
Of course, investors could always look to target shorterduration to reduce interest rate risk. Floating-rate,investment-grade notes generated an average monthlyreturn of 0.66%. Due to the oating-rate feature of these
securities, these instruments have the ability to provide ahedge against rate increases. Another means of doing so iswith xed-rate, high-yield bonds, which were up 0.60% inmonths of increasing rates. Even more impressive are seniorsecured loans, with an average return of 1.64%. However,both high yield and loans come with increased credit risk.This begins to highlight some of the important trade-offs thatinvestors must make when choosing one asset class overanother in an environment of rising rates. This also raisesimportant questions about cross-asset class correlations.In other words, high-yield bonds tend to have a relativelyhigh correlation to equities, so investors must not take these
gures in isolation.
Convertible securities, which have elements of xed incomeand equities, had the highest performance under this test.Within the equity market, the picture is generally positive, butthere are large divergences at the regional level. Emergingmarket equities seem to generate the most upside, but thatmay be due to factors other than just the in uence of movesin the 10-year. Interestingly, the S&P High Yield DividendAristocrats Index generated positive monthly returns, whichseems to be contrary to what most would expect fromdividend paying equities. Equities tend to hold up best becauseincreasing interest rates may be driven by an improvingeconomic outlook, which boosts equity prices all else beingequal. In today’s market, investors will also want to considerwhat impact rising rates may have relative to any historical
relationships. For example, over the past few years investorsmay have moved into high yielding equities due to the lack ofyield available into other traditional alternatives. Going forward,investors may want to take more speci c exposures in theirportfolios to balance these risks, which we will explore ingreater detail.
PUTTING IT ALL TOGETHERWhile it is instructive to review the merits of individual assetclasses to better understand their behavior in a rising rateenvironment, it is most impactful to see how they interact witheach other in a broader portfolio. To do so, we created thefollowing hypothetical multi-asset class portfolios comprisingexchange traded funds. Using ETFs allows us to construct
portfolios with speci c goals in mind and drill into the fundsunderlying holdings.
FIGURE 2: ASSET CLASS PERFORMANCE IN RISINGRate enviRonments
TOTAL RETURNSINCE JANUARY
2000 (%)TOTAL RETURN SINCE
INCEPTION (%)INCEPTION
DATE
Fixed Income
Barclays U.S. Aggregate -0.17 -1.87 Jan-76
Barclays U.S. Treasury -0.37 -0.88 Jan-76
Barclays U.S. TreasuryIn ation Protected Notes -0.57 -1.25 Mar-97
Barclays U.S. Mbs -0.05 -2.08 Jan-76Barclays U.S. Agencies -0.17 -1.42 Jan-76
Barclays U.S. InvestmentGrade 0.43 -1.42 Jan-76
Barclays U.S. 1–3 MonthT-Bills 0.19 0.22 Jan-92Barclays U.S. High Yield 0.58 0.60 Aug-83Credit Suisse LeveragedLoan 0.23 1.64 Jan-00
Barclays U.S. Floating Rate Notes 0.66 4-May
Barclays U.S.
Convertibles Composite 2.62 3-JanBarclays Municipal Bond -0.04 -1.97 Feb-80Bofa Merrill Lynch PreferredStock Fixed Rate 0.68 -0.19 Mar-89
Barclays Global Aggregate -0.65 -0.97 Jan-90
Barclays Global Treasury -0.85 -0.91 Feb-87Barclays Global Corporate -0.49 Sep-00
Barclays Global AggregateEx U.S. -0.96 -0.78 Jan-90
Barclays Global TreasuryEx U.S. -0.98 -0.49 Feb-87
Barclays Global CorporateEx U.S. -0.36 5-JanBarclays Global High Yield 0.26 0.62 Feb-90Jp Morgan Gbi-Em Global Composite 0.40 2-JanJp Morgan Embi Global -0.06 -0.81 Jan-94
Equities
Russell 3000® 1.33 0.83 Feb-87
S&P 500® 1.24 1.07 Jan-76S&P® High Yield Dividend Aristocrats 1.70 1.85 Jan-00MSCI AC World 0.94 0.93 Jan-88
MSCI Emerging Markets 1.26 3.01 Jan-88MSCI EAFE -0.29 0.00 Jan-76
Dow Jones US Select REIT 0.48 0.87 Feb-87FTSE EPRA/NAREITDeveloped 2.88 Mar-13
Source: FactSet, SSgA, as of 31 July 2013.Past performance is not a guarantee of future results.Index returns are unmanaged and do not reflect the deduction of any fees or expenses.Index returns reflect all items of income, gain and loss and the reinvestment ofdividends and other income.
8/13/2019 ID0341-IBGAP-1455_Expanding Options for Income Generation as Interest Rates Rise_v2_rr
http://slidepdf.com/reader/full/id0341-ibgap-1455expanding-options-for-income-generation-as-interest-rates 3/63
FOR PROFESSIONAL AND INSTITUTIONAL INVESTOR USE ONLY. NOT FOR PUBLIC USE.
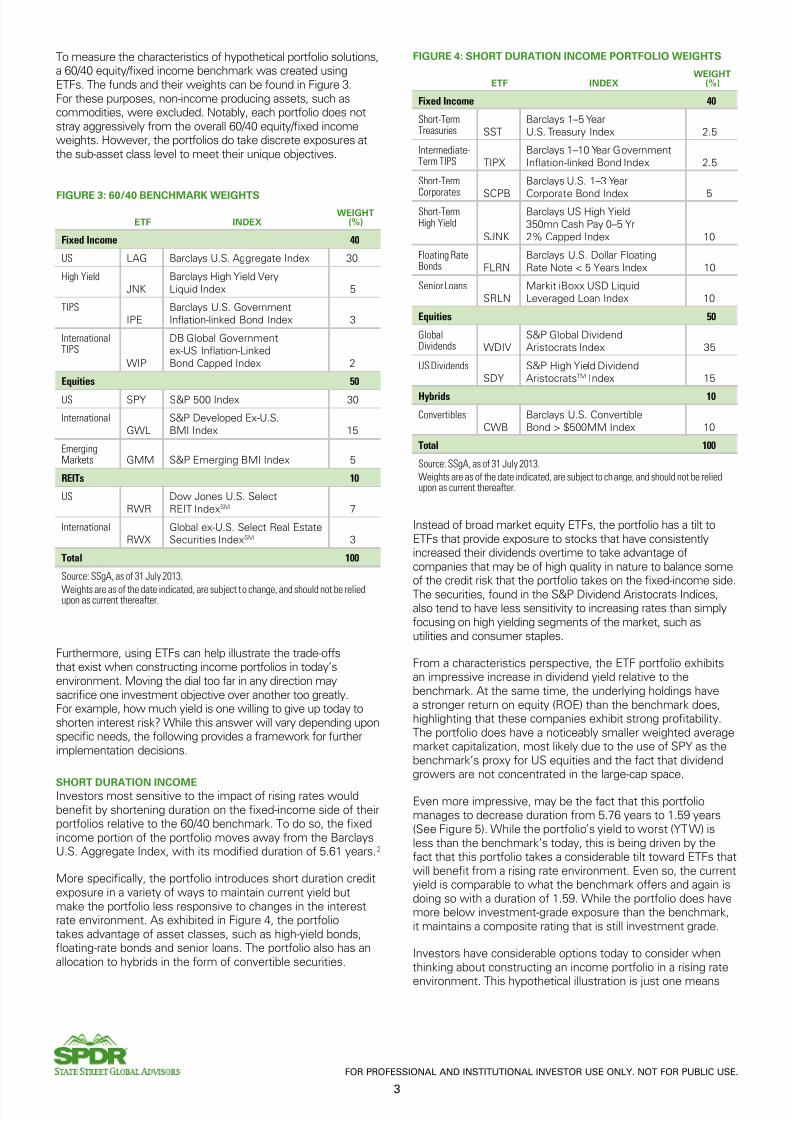
To measure the characteristics of hypothetical portfolio solutions,a 60/40 equity/ xed income benchmark was created usingETFs. The funds and their weights can be found in Figure 3.For these purposes, non-income producing assets, such ascommodities, were excluded. Notably, each portfolio does notstray aggressively from the overall 60/40 equity/ xed incomeweights. However, the portfolios do take discrete exposures atthe sub-asset class level to meet their unique objectives.
Furthermore, using ETFs can help illustrate the trade-offsthat exist when constructing income portfolios in today’senvironment. Moving the dial too far in any direction maysacri ce one investment objective over another too greatly.For example, how much yield is one willing to give up today toshorten interest risk? While this answer will vary depending uponspeci c needs, the following provides a framework for furtherimplementation decisions.
SHORT DURATION INCOMEInvestors most sensitive to the impact of rising rates wouldbene t by shortening duration on the xed-income side of theirportfolios relative to the 60/40 benchmark. To do so, the xedincome portion of the portfolio moves away from the BarclaysU.S. Aggregate Index, with its modi ed duration of 5.61 years. 2
More speci cally, the portfolio introduces short duration creditexposure in a variety of ways to maintain current yield butmake the portfolio less responsive to changes in the interestrate environment. As exhibited in Figure 4, the portfoliotakes advantage of asset classes, such as high-yield bonds,
oating-rate bonds and senior loans. The portfolio also has anallocation to hybrids in the form of convertible securities.
Instead of broad market equity ETFs, the portfolio has a tilt toETFs that provide exposure to stocks that have consistentlyincreased their dividends overtime to take advantage ofcompanies that may be of high quality in nature to balance someof the credit risk that the portfolio takes on the xed-income side.The securities, found in the S&P Dividend Aristocrats Indices,also tend to have less sensitivity to increasing rates than simplyfocusing on high yielding segments of the market, such asutilities and consumer staples.
From a characteristics perspective, the ETF portfolio exhibitsan impressive increase in dividend yield relative to thebenchmark. At the same time, the underlying holdings havea stronger return on equity (ROE) than the benchmark does,highlighting that these companies exhibit strong pro tability.The portfolio does have a noticeably smaller weighted averagemarket capitalization, most likely due to the use of SPY as thebenchmark’s proxy for US equities and the fact that dividendgrowers are not concentrated in the large-cap space.
Even more impressive, may be the fact that this portfoliomanages to decrease duration from 5.76 years to 1.59 years(See Figure 5). While the portfolio’s yield to worst (YTW) isless than the benchmark’s today, this is being driven by thefact that this portfolio takes a considerable tilt toward ETFs thatwill bene t from a rising rate environment. Even so, the currentyield is comparable to what the benchmark offers and again isdoing so with a duration of 1.59. While the portfolio does havemore below investment-grade exposure than the benchmark,it maintains a composite rating that is still investment grade.
Investors have considerable options today to consider whenthinking about constructing an income portfolio in a rising rate
environment. This hypothetical illustration is just one means
FIGURE 3: 60/40 BENCHMARK WEIGHTS
ETF INDEXWEIGHT
(%)
Fixed Income 40
US LAG Barclays U.S. Aggregate Index 30
High YieldJNK
Barclays High Yield VeryLiquid Index 5
TIPSIPE
Barclays U.S. GovernmentIn ation-linked Bond Index 3
InternationalTIPS
WIP
DB Global Governmentex-US In ation-Linked Bond Capped Index 2
Equities 50
US SPY S&P 500 Index 30
InternationalGWL
S&P Developed Ex-U.S. BMI Index 15
EmergingMarkets GMM S&P Emerging BMI Index 5
REITs 10
USRWR
Dow Jones U.S. SelectREIT Index SM 7
InternationalRWX
Global ex-U.S. Select Real EstateSecurities Index SM 3
Total 100
Source: SSgA, as of 31 July 2013.
Weights are as of the date indicated, are subject to change, and should not be reliedupon as current thereafter.
FIGURE 4: SHORT DURATION INCOME PORTFOLIO WEIGHTS
ETF INDEXWEIGHT
(%)
Fixed Income 40
Short-TermTreasuries SST
Barclays 1–5 YearU.S. Treasury Index 2.5
Intermediate-Term TIPS TIPX
Barclays 1–10 Year GovernmentIn ation-linked Bond Index 2.5
Short-Term
Corporates SCPB
Barclays U.S. 1–3 Year
Corporate Bond Index 5Short-TermHigh Yield
SJNK
Barclays US High Yield350mn Cash Pay 0–5 Yr2% Capped Index 10
Floating RateBonds FLRN
Barclays U.S. Dollar FloatingRate Note < 5 Years Index 10
Senior LoansSRLN
Markit iBoxx USD LiquidLeveraged Loan Index 10
Equities 50
GlobalDividends WDIV
S&P Global DividendAristocrats Index 35
US DividendsSDY
S&P High Yield DividendAristocrats TM Index 15
Hybrids 10
ConvertiblesCWB
Barclays U.S. ConvertibleBond > $500MM Index 10
Total 100
Source: SSgA, as of 31 July 2013.Weights are as of the date indicated, are subject to change, and should not be reliedupon as current thereafter.

8/13/2019 ID0341-IBGAP-1455_Expanding Options for Income Generation as Interest Rates Rise_v2_rr
http://slidepdf.com/reader/full/id0341-ibgap-1455expanding-options-for-income-generation-as-interest-rates 4/64
FOR PROFESSIONAL AND INSTITUTIONAL INVESTOR USE ONLY. NOT FOR PUBLIC USE.
of doing so. Investors who are more credit sensitive could dialback some of the credit exposure and still maintain many of thebene ts that are presented in this option. They could also lookto other strategies that may offer more yield, with slightly moreduration, such as intermediate corporates.
INFLATION PROTECTED INCOMEHowever, some investors may be cognizant of a rising rateenvironment and, while in ation expectations remain lowtoday, may be concerned about the impact in ation canhave on future purchasing power. The hypothetical portfoliopresented in Figure 6 offers one solution for addressing bothof these needs. This portfolio includes ETFs that have eitherimbedded in ation components or respond favorably toincreases in in ation.
A considerable difference between the short-duration incomeportfolio presented above and this in ation-protected incomeportfolio is that the later includes an allocation to US andinternational REITs. In fact, the REITs allocation is greater thanthe benchmark’s 10% allocation. In addition, this portfolioincludes commodity producing equities at the expense of puredividend plays and a much greater allocation to in ation-linkedbonds. The portfolio still provides exposure to both oating-rate bonds and senior loans.
As shown in Figure 7, this portfolio has interesting characteristicsas well. In this case, the dividend yield is still higher than whatthe benchmark offers, which may be surprising to some, whooften overlook commodity-producing equities as yield producing
assets. The portfolio is also more expensive relative to thebenchmark, as measured by price-to-earnings (PE) and is lesspro table than the benchmark, as measured by return on equity.Part of the higher PE, is driven by the US REIT exposure, butthis exposure also contributes to the attractive yield and in ation
ghting potential.
Within the xed-income sleeve, the in ation protected incomeportfolio has slightly less interest rate risk than the benchmarkwith a similar decrease in current yield. While this decrease inyield may seem unacceptable at rst, this solution attempts tobalance income needs with in ation protection. At the sametime, the portfolio includes exposure to asset classes that maybe offering less yield in today’s market but will bene t fromfurther increases in yield. From a credit risk perspective, thisportfolio matches the rating of the benchmark as the portfoliohas an overall 25% allocation to TIPs and linkers.
FIGURE 5: SHORT DURATION INCOME PORTFOLIO EXPOSURES
CHARACTERISTICS PORTFOLIO BENCHMARK DIFFERENCE
Equity
Dividend Yield 4.55 2.79 1.76
Price to Earnings Ratio 16.07 17.4 -1.34
Return on Equity 18.14 16.98 1.15
Market Capitalization 33,374 74,543 -41,168
Fixed Income
Current Yield 3.42 3.6 -0.18
Yield to Worst 0.28 2.52 -2.25
Option Adjusted Duration 1.59 5.76 -4.17
Bloomberg Composite Rating BBB AA-
Source: Bloomberg, L.P., SSgA, as of 31 July 2013.Past performance is not a guarantee of future results.Index returns are unmanaged and do not reflect the deduction of any feesor expenses. Index returns reflect all items of income, gain and loss and thereinvestment of dividends and other income.The calculation method for value added returns may show rounding differences.
FIGURE 6: INFLATION PROTECTED INCOME PORTFOLIO WEIGHTS
ETF INDEX WEIGHT(%)
Fixed Income 40
TIPSIPE
Barclays U.S. GovernmentIn ation-linked Bond Index 5
TIPSTIPX
Barclays 1–10 Year GovernmentIn ation-linked Bond Index 10
InternationalTIPS
WIP
DB Global Governmentex-US In ation-Linked Bond Capped Index 10
Floating RateBonds FLRN
Barclays U.S. Dollar FloatingRate Note < 5 Years Index 7.5
Senior Loans
SRLN
Markit iBoxx USD Liquid
Leveraged Loan Index 7.5Equities 40
GlobalNaturalResources GNR
S&P Global Natural ResourcesIndex 28
US Energy XLE S&P Energy Select Sector Index 3.5
InternationalEnergy IPW
S&P Developed Ex-U.S. BMIEnergy Sector Index 3.5
US Metalsand Miners XME
S&P Metals and Mining SelectIndustry ® Index 5
REITs 20
US REITsRWR
Dow Jones U.S. SelectREIT Index SM 11
InternationalREITs RWX
Global ex-U.S. Select Real EstateSecurities Index SM 9
Total 100
Source: SSgA, as of 31 July 2013.Weights are as of the date indicated, are subject to change, and should not be reliedupon as current thereafter.
FIGURE 7: INFLATION PROTECTED INCOMEPoRtfolio exPosuRes
CHARACTERISTICS PORTFOLIO BENCHMARK DIFFERENCE
Equity
Dividend Yield 3.25 2.79 0.45
Price to Earnings Ratio18.77 17.40 1.36
Return on Equity 9.09 16.99 -7.90
Market Capitalization 52,135 74,543 -22,407
Fixed Income
Current Yield 1.71 3.60 -1.90
Yield to Worst 0.79 2.52 -1.73
Option Adjusted Duration 5.34 5.76 -0.42
Bloomberg Composite Rating AA- AA-
Source: Bloomberg, L.P., SSgA, as of 31 July 2013.Past performance is not a guarantee of future results.Index returns are unmanaged and do not reflect the deduction of any feesor expenses. Index returns reflect all items of income, gain and loss and thereinvestment of dividends and other income.The calculation method for value added returns may show rounding differences.

8/13/2019 ID0341-IBGAP-1455_Expanding Options for Income Generation as Interest Rates Rise_v2_rr
http://slidepdf.com/reader/full/id0341-ibgap-1455expanding-options-for-income-generation-as-interest-rates 5/65
FOR PROFESSIONAL AND INSTITUTIONAL INVESTOR USE ONLY. NOT FOR PUBLIC USE.
TOTAL RETURN FOCUSED INCOMESince income investors have the tendency to emphasizecurrent income at the expense of total return, the hypotheticaltotal-return portfolio strategically takes a multi-asset classview toward addressing the balance of income and capitalappreciation. For example, as Goolgasian, Pierce and Hollyhighlighted, high-yield bonds had the highest yield at thebeginning of 2008, but were subsequently one of the worstperformers by the end of the year.
To address the tendency to seek out yield too aggressively,the portfolio includes ETFs representing a wide range of asset
classes across bonds, equities, hybrids and REITs. Again, theportfolio takes a global approach to income generation andlooks across multiple asset classes for yield.
As shown in Figure 9, out of the three portfolios presented, thetotal-return, focused-income portfolio has the highest dividendyield and lowest market capitalization. However, the higher yielddoes come with the potential for greater sensitivity to risingrates than the previous two portfolios. The reason behind thisis because the equity portion of the portfolio includes both theS&P High Yield Dividend Aristocrats Index for US exposureand the S&P Dividend Opportunities Indices for exposure to
international developed and emerging markets. It also includes
infrastructure equities. This again highlights the balance thatinvestors must take when seeking yield, but considering theimpact on other exposures. In other words, there is no freelunch. The portfolio is also slightly less expensive than thebenchmark with the underlying equities having marginally lesspro tability than the standard 60/40. This portfolio also has thehighest current yield, but still maintains a lower duration relativeto the benchmark. In addition, its credit is roughly in-line with thebenchmark even though it has exposure to a 10% allocation tohigh-yield bonds and a 5% allocation to emerging market, local-currency bonds.
CONCLUSIONWhile short-term policy rates in the United States will likelyremain anchored until at least 2015, investors should begin toconsider solutions that will make portfolios more resilient tothe various paths that yields may take going forward. To do so,they need not reinvent the wheel when it comes to incomeinvesting in an age of increasing interest rates, especially whenmonetary policy remains broadly accommodative. Instead,investors should embrace the ability to generate income ina low-return environment that multiple asset classes offer.Investors will be well served to look beyond simply the highestyielding market segments. They should drill down into theseasset classes to understand the appropriate trade-offs thatexist when balancing the continued need for income, but theheightened focus on what rising rates may mean. Furthermore,all of the tools exist for investors to build well-diversi edportfolios that meet the needs and targets that they may have.
REFERENCESGoolgasian, Chris, Pierce, Daniel C. and Holly, Jerry (2012). The ETF Way: Providing Total Return by Investing in Incomeand Yield-Generating Assets, SSgA Capital Insights.
Hoguet, George R. (2013). What Does US Interest RateNormalization Mean? An Introduction to the Natural Rate ofInterest and Its Implication for Investors, SSgA Capital Insights.
FIGURE 8: TOTAL RETURN FOCUSED INCOMEPORTFOLIO WEIGHTS
ETF INDEXWEIGHT
(%)
Fixed Income 45
TreasuriesITE
Barclays IntermediateU.S. Treasury Index 10
TIPSTIPX
Barclays 1–10 Year GovernmentIn ation-linked Bond Index 5
Corporates ITR Barclays IntermediateU.S. Corporate Index 10
High YieldJNK
Barclays High Yield VeryLiquid Index 10
InternationalCorporates
IBND
Barclays Global Aggregateex-USD > $1B: CorporateBond Index 5
EmergingMarkets EBND
Barclays EM Local CurrencyGovernment Diversi ed Index 5
Equities 35
USSDY
S&P High Yield DividendAristocrats TM Index 15
International
DWX
S&P International Dividend
Opportunities ® Index 10EmergingMarkets EDIV
S&P Emerging Markets DividendOpportunities Index 5
Infrastructure GII S&P Global Infrastructure Index 5
Hybrids 10
ConvertiblesCWB
Barclays U.S. ConvertibleBond > $500MM Index 5
PreferredsPSK
Wells Fargo Hybrid and PreferredSecurities Aggregate Index 5
Total 100
Source: SSgA, as of 31 July 2013.Weights are as of the date indicated, are subject to change, and should not be reliedupon as current thereafter.
FIGURE 9: TOTAL RETURN FOCUSED INCOMEPORTFOLIO EXPOSURES
CHARACTERISTICS PORTFOLIO BENCHMARK DIFFERENCE
Equity
Dividend Yield 4.71 2.79 1.92Price to Earnings Ratio 16.46 17.40 -0.94
Return on Equity 15.98 16.98 -1.00
Market Capitalization 27,814 74,543 -46,728
Fixed IncomeCurrent Yield 4.12 3.6 0.52
Yield to Worst 2.03 2.52 -0.49
Option Adjusted Duration 4.72 5.76 -1.04prt
Bloomberg Composite Rating A- AA-
Source: Bloomberg, L.P., SSgA, as of 31 July 2013.Past performance is not a guarantee of future results.Index returns are unmanaged and do not reflect the deduction of any feesor expenses. Index returns reflect all items of income, gain and loss and thereinvestment of dividends and other income.The calculation method for value added returns may show rounding differences.

8/13/2019 ID0341-IBGAP-1455_Expanding Options for Income Generation as Interest Rates Rise_v2_rr
http://slidepdf.com/reader/full/id0341-ibgap-1455expanding-options-for-income-generation-as-interest-rates 6/66
FOR PROFESSIONAL AND INSTITUTIONAL INVESTOR USE ONLY. NOT FOR PUBLIC USE.
STATE STREET GLOBAL ADVISORS ASIA LIMITED STATE STREET GLOBAL ADVISORS SINGAPORE LIMITED68/F, Two Internat ional Finance Centre COMPANY REGISTRATION: 200002719D8 Finance Street, Central, Hong Kong 168 Robinson Road, #33-01 Capital Tower
+852 2103 0100 +65 6826 7500 spdrs.com.hk spdrs.com.sg
1Morningstar, SSgA, as of June 30, 2013. 2
Barclays, SSgA, as of July 31, 2013.
FOR PROFESSIONAL AND INSTITUTIONAL INVESTOR USE ONLY.This document and the information contained herein may not be distributed and published in jurisdictions in which such distribution and publication is not permitted. Investment involves risk.The information provided does not constitute investment advice and it should not be relied on as such. It should not be considered a solicitation to buy or an offer to sell a security. It does not take into accountany investor’s particular investment objectives, strategies, tax status or investment horizon. You should consult your tax and nancial advisor. All material has been obtained from sources believed to bereliable. There is no representation or warranty as to the accuracy of the information and State Street shall have no liability for decisions based on such information.“SPDR” is a trademark of Standard & Poor’s Financial Services LLC (“S&P”) and has been licensed for use by State Street Corporation. STANDARD & POOR’S, S&P, SPDR and S&P 500 have been regiin many countries as trademarks of Standard & Poor’s Financial Services LLC and have been licensed for use by State Street Corporation. No nancial product offered by State Street Corporation or itsaf liates is sponsored, endorsed, sold or promoted by S&P or its af liates, and S&P and its af liates make no representation, warranty or condition regarding the advisability of buying, selling or holdingunits/shares in such products. Further limitations and important information that could affect investors’ rights are described in the prospectus for the applicable product.The whole or any part of this work may not be reproduced, copied or transmitted or any of its contents disclosed to third parties without SSgA’s express written consent.ETFs trade like stocks, are subject to investment risk and will uctuate in market value. The investment return and principal value of an investment will uctuate in value, so that when shares are sold orredeemed, they may be worth more or less than when they were purchased. Although shares may be bought or sold on an exchange through any brokerage account, shares are not individually redeemablefrom the fund. Investors may acquire shares and tender them for redemption through the fund in large aggregations known as creation units. Please see the fund? see prospectus for more details.
Frequent trading of ETFs could signi cantly increase commissions and other costs such that they may offset any savings from low fees or costs.Thank you for your interest in SPDR ETFs. The information above is provided in response to your request and is not intended to constitute an offer to sell or a solicitation of an offer to buy securities. SPDRETFs are not registered for public distribution, so please contact your local nancial, legal and or tax advisors to discuss the local consequences of investing.
© 2013 State Street Corporation. All Rights Reserved. IBGAP-1535 Exp. Date: 31/12/2014
ABOUT SPDR ETFSOffered by State Street Global Advisors, SPDR ETFs are a family of exchange traded funds that provide investors with the exibility to selectinvestments that are precisely aligned to their investment strategy. Recognized as an industry pioneer, State Street Global Advisors createdthe rst ever ETF in 1993—the SPDR S&P 500 ®, which is currently the world’s largest ETF *. In 1999, SSgA introduced ETFs in Asia Paci cwhen it launched the Tracker Fund of Hong Kong. Currently, State Street Global Advisors manages approximately US$374 billion of ETF assetsworldwide. **
For comprehensive information on our ETFs, visit us at globalspdrs.com .
SALES AND MARKETING
For more information about our ETFs or how to invest, please call +852 2103 0100 or email [email protected] . *Bloomberg, as of September 30, 2013.. **As of September 30 , 2013. This AUM includes the assets of the SPDR Gold Trust (approx. $38.6 billion, as of September 30, 2013), for which an af liate of State Street Global Advisors
serves as marketing agent.


,](https://img.pdfslide.net/doc/110x75/5eb531018980a05e8e52d1ed/orf555-fin555-fixed-income-ratesfixe-income-modelspdf-chapter-2-interest.jpg)