Embed Size (px)
Citation preview
* IDA
September 1998
Approved for public release; distribution unlimited.
IDA Paper P-3385
Log: H 98-000072
INSTITUTE FOR DEFENSE ANALYSES
Environmental/Noise Effects on VHF/UHF UWB SAR
James Ralston James Heagy Roger Sullivan
CO CO CO O to
O o to
DTIC QUALITY INSPECTED 1

This work was conducted under contract DASW01 94 C 0054, Task A-155, for the Defense Advanced Research Projects Agency. The publication of this IDA document does not indicate endorsement by the Department of Defense, nor should the contents be construed as reflecting the official position of that Agency.
© 1998,1999 Institute for Defense Analyses, 1801 N. Beauregard Street, Alexandria, Virginia 22311-1772 • (703) 845-2000.
This material may be reproduced by or for the U.S. Government pursuant to the copyright license under the clause at DFARS 252.227-7013 (10/88).

PREFACE
This work was undertaken for the Defense Advanced Research Projects Agency
under a task entitled "Counter Camouflage Concealment and Deception (CCC&D)
Systems Studies" as part of the program to develop ultra-wideband radar technology for
detecting hostile targets that may be covered, concealed, or camouflaged.
u

CONTENTS
EXECUTIVE SUMMARY ES"1
I. INTRODUCTION l
II. NOISE SOURCES 3
A. Galactic Noise 3 B. Solar Noise 5 C. Man-made Unintentional Noise 7
D. Atmospheric Noise 9
E. Ground Noise 9 F. Composite External Noise 10
III. ANTENNA TEMPERATURE MODEL 11
IV. SYSTEM NOISE TEMPERATURE 13
V. CONCLUSIONS 16
REFERENCES 17
FIGURES
1. Galactic Noise Temperature 5
2. Solar Contribution to Antenna Temperature 7 3. External Man-made Noise Temperature 9 4. Composite External Noise 1° 5. Determining Antenna Noise Temperature 11 6. Antenna Temperature vs. Frequency and Pattern 12 7. Transmission System Model 13 8. System Noise Temperature at LNA Input 15 9. Effective Wideband Noise Figure 15
in

EXECUTIVE SUMMARY
This paper presents a straightforward approach to estimating the impact of natural
environmental noise on an overall system noise temperature for very high frequency/
ultrahigh frequency synthetic aperture radar (VHF/UHF SAR), emphasizing the 30-
600 MHz band. The most important external noise sources included are galactic noise,
solar noise, and unintended man-made noise. In addition, the estimate of system noise
temperature includes the effect of thermal noise due to ground and antenna losses as well
as receiver noise.
The effect of solar noise varies with solar activity ("sunspot") cycle. Although
quiet and near-quiet sun conditions are generally typical, solar noise can increase greatly
during solar storm, solar bursts, and other periods of strong activity. This analysis
includes estimates of anticipated solar noise during both quiet and active conditions.
Sky noise (the sum of galactic and solar noise) is expected to have a major impact
on system sensitivity at frequencies below 100 MHz but should not be critical above
200 MHz. Over the frequency range of interest, galactic noise is expected to be the major
component of external natural noise during quiet sun conditions. Solar storms or noise
bursts have the potential to exceed galactic noise but are expected to be rare enough that
system operation would not be significantly limited. When they occur, solar storms may
also lead to excess noise at frequencies above 100 MHz, thus affecting UHF as well as
VHF operation. Atmospheric noise contributions to total sky noise are likely to be
negligible above 30 MHz, but they could be important at lower frequencies.
The major uncertainties at this point relate to man-made noise sources.
Unintentional man-made radiation is not expected to be a dominant noise source as long
as operations are airborne and distant from major centers of industrial activity. Radio
frequency interference (RFI) from communications and broadcast sources (which is not
considered here), however, will probably have a major impact. This is known to be the
case at UHF frequencies, and RFI may dominate even the high levels of natural noise
expected at VHF.
Only tentative conclusions can be drawn at this point about the impact of sky
noise to the choice of specific test areas. In general, it appears that high northern latitudes
will be favored with less noise, particularly at times when the galactic center is below the
ES-1

local horizon. Likewise, night operations may be favored during the most extreme and
unlikely solar activity conditions. In northern latitudes, therefore, the winter night should
provide the lowest sky noise conditions. Most important, however, test areas should be
located as remotely as possible from sources of intentional and unintentional man-made
radiation.
ES-2

I. INTRODUCTION
Although the sensitivity of radars operating at microwave and higher frequencies
can generally be assumed to be set by internal receiver noise and system losses, for radars
operating in the very high frequency/ultrahigh frequency (VHF/UHF) bands (30-
1,000 MHz) we must consider the potential impact of external noise sources. An earlier
IDA memorandum (ref. 1) provided estimates of the effect of natural noise (principally
galactic noise and noise from the "quiet" sun) on VHF/UHF ultra-wideband (UWB)
radars and introduced a model of the effect of external noise on system noise
temperature. This paper extends and updates that memo to include better estimates of
galactic noise, as well as the effects of solar storms and noise bursts. Although the
previous memo specifically did not include any effects of man-made noise, this paper
includes estimates of noise effects due to unintentional radiation by nonbroadcast
sources. Broadcast noise sources, which may have a dominant effect, are not considered.
This paper presents a straightforward approach to estimating the impact of natural
environmental noise on an overall system noise temperature for VHF/UHF synthetic
aperture radar (SAR), emphasizing the 30-600 MHz band. The most important external
noise sources included are galactic noise, solar noise, and unintended man-made noise. In
addition, the estimate of system noise temperature includes the effect of thermal noise
due to ground and antenna losses as well as receiver noise. Atmospheric noise is
generally much less than other sources in the band of interest here and so has not been
specifically included. Similarly, thermal noise originating in atmospheric absorption
losses is not significant in this band.
The effect of solar noise varies with solar activity ("sunspot") cycle. Although
quiet and near-quiet sun conditions are generally typical, solar noise can increase greatly
during solar storm, solar bursts, and other periods of strong activity. This analysis
includes estimates of anticipated solar noise during both quiet and active conditions. It
should be noted that we are currently experiencing an activity low of the 11-year sunspot
cycle. The next minimum is anticipated to occur in September 1998, and the subsequent
maximum is be anticipated to occur -4.3 years later, around January 2002.

We consider first the contributions of various sources to an overall sky
temperature and then a model for estimating the effect of sky temperature on the system
noise temperature of a practical, non-ideal, radar receiver.

II. NOISE SOURCES
For radars operating in the VHF/UHF bands we must consider the potential
impact of all of the following sources of external noise: galactic, solar, man-made
unintentional, atmospheric, ground, and composite external.
A. GALACTIC NOISE
Galactic or cosmic noise originates from radio sources primarily in the Milky
Way galaxy. The resulting distribution of noise temperature has been mapped at various
frequencies by many observers. The temperature distribution is not uniform; it is
strongest in the plane of the galaxy and most concentrated in the direction of the galactic
center. Because the north pole of earth's axis of rotation is tilted away from the galactic
center, the hottest part of the sky is below the equator at approximately -30 deg of
latitude. This means that the galactic noise temperature distribution from a given point on
the earth's surface will depend on the latitude of the point and the sidereal time, with
northern latitudes experiencing lower noise levels. A comprehensive, but somewhat
dated, summary of galactic noise is given in reference 2. More recent measurements at
408 MHz are reported in reference 3. Although many different coordinate systems are in
use to locate galactic objects, all can be referenced to declination and right ascension
based on the earth's equator and poles and a fixed direction in space. In such coordinates,
the map of galactic noise temperature can be expressed as:
* galactic = ■'galactic (a> °> / ) *■l >
where a is the right ascension, 5 the declination, and/the frequency of measurement. In
analyses of galactic noise it is conventional, although not precise, to assume that the
galactic temperature map can be separated into spatial and frequency factors. That is,
A" (2) rgalactic(a,8,/) = r0(a,8)-|^ k
f
where/o is a reference frequency and n is the spectral index, which is generally taken to
be in the range 2.3 to 2.5. In this form, the function 7b(a,8) is the sky temperature at
frequency/o. Equation (2) implies that galactic noise will increase by about 23-25 dB for
each decade reduction in frequency with respect to the reference frequency.

For the case of airborne UWB SAR, the antenna lobes will be broad and then-
absolute orientation with respect to the Galaxy will vary with time and geographic loca-
tion. Thus, the detailed space-varying function, 7b(a,5), must be reduced to a suitable
statistic or effective sky temperature relevant to our application. Assuming this is done,
Eq. (2) may be reduced to the final expression for the expected effective antenna
temperature due to galactic noise:
Tg - Tg0 'foY
\fj (3)
where Tg0 is the effective temperature at/0. In the table below the parameters of Eq. (3)
are used to compare the galactic noise estimates (n) of several sources.
Table 1
fo/MHz VK n Source
100 3050 2.5 Blake, ref. 4
100 1155 2.3 CCIR, ref.5
408 44.6 2.56 IDA
The effective temperature assumed by Blake (ref. 4) is the geometric mean of the
maximum and minimum values in the maps of galactic noise given in reference 2. Blake
does not make clear what assumptions have been made about the beamwidth of the hypo-
thetical ideal antenna. Moreover, it is not clear from Blake's discussion what relation the
geometric mean of the extremes of variation has to the arithmetic mean of sky tempera-
ture, which is a quantity more closely related to expected noise power received. The
conditions pertaining to the CCIR galactic temperature values are not given in the ref-
erences provided. The disparity between these first two sources and the uncertainty about
the methodologies employed by them led IDA to perform an independent estimate of
effective galactic noise temperature. This estimate is based on the most recent and
carefully calibrated astronomical data (ref. 3), which were taken at 408 MHz. The effec-
tive temperature is defined by IDA to be the mean plus one-sigma value of the
temperature of an ideal lossless antenna having a 30-deg beamwidth which is scanned
over the entire celestial sphere. This is equivalent to assuming an antenna at a random
position on the earth pointed randomly at the sky. If the operating conditions can be con-
strained to keep the galactic center below the local horizon, then the noise temperature
would be significantly less.

As frequency decreases from UHF to VHF, the magnitude of galactic noise
increases sharply. As frequency further decreases into the HF band and below, the impact
of galactic noise on terrestrial radars should begin to decrease as ionospheric absorption
increases. For present purposes, Eq. (3) is expected to be valid above -20 MHz. Figure 1
shows the frequency dependence of the estimates in Table 1.
Galactic Noise Temperature 1*10
no
no
I ö mo
100
10
: N
ST a. 's,, " „ —> 4 511
"'5*N. ::: Zd
f^S S.
|§lll! ii^::
10 100
Frequency/MHz
no
-*- Blake "+■ CCIR -* IDA
Figure 1. Galactic Noise Temperature
B. SOLAR NOISE
In the following discussion of solar noise impact, it is necessary to distinguish
between quiet sun and disturbed sun conditions. Although the former term refers
specifically to the absence of visible sunspots (ref. 6), quiet sun periods are also associ-
ated with relatively low levels of radio emissions. Solar radio noise originates from
within the Sun's disk, and although the solar temperature at VHF frequencies can be
~106 K even during "quiet sun" conditions, the fact that it corresponds to a solid angle,
Qs, of only 6.8-10-5 sr means that its contribution to the noise temperature of an isotropic
antenna is only -10 K. There are periods of intense solar activity, however, when the
radio noise temperature of the solar disk can be as large as 1011 K (ref. 6 and 7). At such
times, there is potential for solar noise to dominate all other noise sources. The frequency
of occurrence and the duration of such solar activity is obviously of concern, and the

literature is not consistent on this point. Blake (ref. 4) asserts that solar bursts of greatly
excess noise have durations of "several seconds," which would not be a major concern.
Kraus (ref. 6), however, indicates that periods of intense activity can last for several
hours. Kraus further cites anecdotes of solar bursts shutting down wartime radar
operations at 60 MHz for extended periods. McNamara (ref. 8, p. 105) suggests that
"disturbed sun" conditions severe enough to affect ionospheric communications can
occur on the order of "three or so days of the month."
The most consistent and relevant data source on solar bursts at VHF frequencies
is compiled in reference 9, which includes a 13-year (1966-78) set of observations at
245 MHz and 610 MHz. These data include measurements of slow variations in the long-
term quiet sun background as well as observations of intense transient phenomena.
Although only two spot frequencies relevant to UWB FOPEN SAR are available, we
have used these observations to scale other older, more generic solar noise spectra found
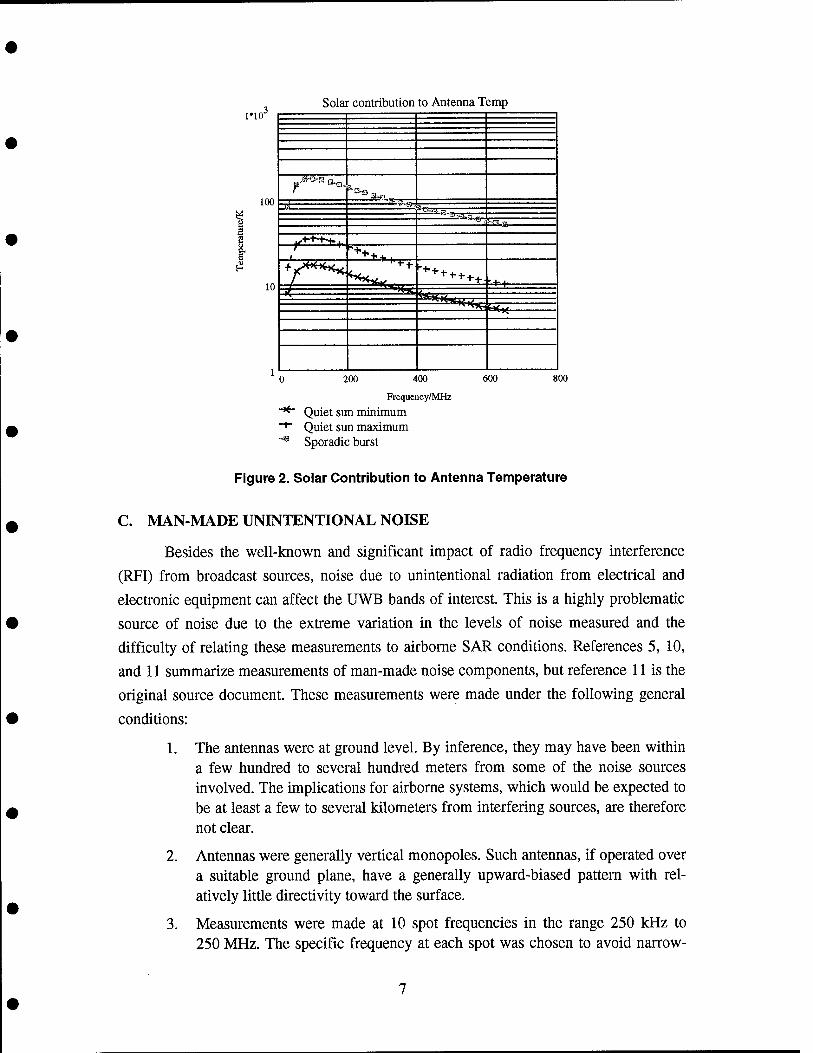
in reference 6 to obtain the results shown in Figure 2. We obtained the temperatures
plotted in Figure 2 by first scaling the solar disk temperatures given in reference 6 to
force agreement at 245 MHz with the data in reference 9, and then multiplying the
resulting solar disk temperature by QS/2TT to give the incremental temperature of an
antenna that is isotropic over the upper (zenith) hemisphere and has no response toward
the ground. Because the average solar flux at 245 MHz varies with the long-term, 11-
year solar cycle, we show the estimated temperature spectrum during both sunspot
minima and maxima.
In addition to monitoring the average flux levels, reference 9 also reports data on
solar bursts that greatly exceed the average values. Sporadic events occurred over the
period of observation during which the quiet-sun flux density was exceeded by a factor
of 5 or more. Although the duration of these bursts ranged from 10 minutes to 2 hours,
the daily average time during which the threshold was exceeded was only ~3 minutes in
an equivalent 24-hour day of solar observation, implying that a 10-minute burst might be
expected twice per week and a 2-hour burst once per month. Of course, such bursts
would disrupt radar observations only if they occur during active data collection. Figure
2 shows a "sporadic burst" temperature that is five times the quiet sun background during
solar maximum years. This represents a temperature impact that should only rarely be
exceeded. Even this near-worst case for solar noise is well below the estimates of galactic
noise.
1*10
I
100
10
Solar contribution to Antenna Temp
■^
3'E-a^,5„, s-eterp-
^-t-M->
„,,'" »TSLB-JJ pa-sr
T * '***.,
+ ******. "**+**t+. y-H
—Sa*«>4*'r
200 400
Frequency/MHz
"*■ Quiet sun minimum ~*~ Quiet sun maximum ~s Sporadic burst
600 800
Figure 2. Solar Contribution to Antenna Temperature
C. MAN-MADE UNINTENTIONAL NOISE
Besides the well-known and significant impact of radio frequency interference (RFI) from broadcast sources, noise due to unintentional radiation from electrical and electronic equipment can affect the UWB bands of interest. This is a highly problematic source of noise due to the extreme variation in the levels of noise measured and the difficulty of relating these measurements to airborne SAR conditions. References 5, 10, and 11 summarize measurements of man-made noise components, but reference 11 is the original source document. These measurements were made under the following general
conditions:
1. The antennas were at ground level. By inference, they may have been within a few hundred to several hundred meters from some of the noise sources involved. The implications for airborne systems, which would be expected to be at least a few to several kilometers from interfering sources, are therefore not clear.
2. Antennas were generally vertical monopoles. Such antennas, if operated over a suitable ground plane, have a generally upward-biased pattern with rel- atively little directivity toward the surface.
3. Measurements were made at 10 spot frequencies in the range 250 kHz to 250 MHz. The specific frequency at each spot was chosen to avoid narrow-

band RFI. Thus, the noise power measured is believed to be due solely to nonbroadcast sources.
Measurements were made in the continental United States during daylight hours.
References 5 and 11 cite noise measurements collected in four types of regions:
1. Business. The test receiver was located in an industrial park, large shopping center, busy street or highway, etc.
2. Residential. The receiver was located in an area with at least two dwelling units per acre and no nearby highways.
3. Rural. The receiver was located in agricultural or range areas with at least 5 acres per dwelling.
4. Quiet rural. These measurements were taken at rural locations "chosen with great care to ensure low levels of man-made noise." Significantly, these measurements are very low, generally below the level of galactic noise, and can accordingly be measured only at frequencies below 30 MHz, the ionosphere's approximate absorption cutoff.
Figure 3 shows the median values of the noise power measurements. The IDA
estimate for galactic noise is shown for reference. Note that even the rural noise level
greatly exceeds galactic noise. If this noise level is in fact typical of the environment in
which VHF UWB SAR must operate, it would have enormous implications for system
power requirements and sensitivity. It is not certain, however, to what extent these
ground-level measurements can be extrapolated to a manned test-bed aircraft at 5 km
altitude or to a UAV at 20-km altitude. The existence of the "quiet rural" data set
suggests that noise levels can be low at sufficient distances from the sources, and there is
thus no reason to assume that the "rural" noise level will obtain in extremely remote
areas or at high altitudes. Reference 11 states that at frequencies above 20 MHz, the
intensity of broadband man-made noise correlated strongly with automobile traffic
density. Since this is a highly localized association, it offers further suggestion that the
quiet rural rather than rural noise levels may apply to airborne UWB SAR tests. In the
following analysis, both "rural" and "quiet noise" will be considered.
For purposes of estimating noise impact on UWB SAR, we will assume that test
conditions reflect a man-made noise environment at the "quiet rural" level. In this case,
we would expect man-made noise to be negligible compared to galactic noise.

External man-made noise temperature 1*10
1'10
1*10
§ no5
1*10
1*10
100
i
Z& tN ^ •J
5 B a
v— Vp — c - \ N, '
3t- v SL IV "- vT\
n*- w
1 r"1-
x> 10 100 1*10
Freq/MHz
~*~ Galactic temperature (IDA) "+■ Business (CCIR) -* Residential (CCIR) -* Rural (CCIR) -°- Quiet Rural (CCIR)
Figure 3. External Man-made Noise Temperature
D. ATMOSPHERIC NOISE
The atmosphere can contribute to system noise in two ways: passively, through absorption losses which contribute a thermal noise component like any other lossy element, and actively, through tropospheric disturbances, principally tropical thunder- storms which can broadcast noise around the world. At the frequencies of interest here, however, atmospheric losses are negligible. The tropospheric disturbance contribution, although very important below 30 MHz, is generally much less important than galactic noise above 30 MHz (ref. 12, p. 450). For these reasons, we will assume that atmospheric noise effects have negligible impact on VHF/UHF SAR compared to the galactic and solar noise considered above.
E. GROUND NOISE
As an imperfect absorber, the earth is a lossy element in the transmission/ reception path of the antenna and thus is a contributor of thermal noise, particularly for antennas aimed at the surface. Because the earth is much cooler than the sky at frequen- cies below ~250 MHz, the effect of surface losses is generally to mitigate the effects of sky noise. This point is considered further below.

F. COMPOSITE EXTERNAL NOISE
Figure 4 shows the contribution of the major sources of external noise to the
expected antenna temperature of a lossless antenna aimed randomly at the sky with no
lobes directed to the earth. The galactic noise is based on the IDA analysis; the solar
noise level corresponds to the "sporadic burst" temperature from Figure 2, and the man-
made noise level corresponds to the "quiet rural" environment, extrapolated to frequen-
cies above 30 MHz. Of these noise sources, the dominant is clearly galactic noise below
the VHF region, with the potential for solar bursts to be stronger in the UHF region. At
UHF however, we expect receiver noise and losses to dominate all external noise sources
except RFI. Figure 4 also shows the "rural" level of man-made noise. If system operating
conditions reflect man-made noise at this level or nearly so, then this noise component
will dominate all natural noise sources below 400 MHz, and system RF sensitivity will
be drastically curtailed.
In developing models of the antenna temperature and system noise temperature,
we will take the sum of galactic noise temperature and sporadic solar burst temperature
as the composite "sky noise" and neglect other noise sources in comparison.
Composite External Noise
Frequency/MHz
-*- Galactic (IDA) ~t" Sporadic solar bursts ~a Man-made "quiet rural" "* Man-made "rural"
Figure 4. Composite External Noise
10

III. ANTENNA TEMPERATURE MODEL
The first step in modeling external noise effects on system noise temperature is to
determine the antenna noise temperature. We will compute this by considering a series of
successively less ideal antennas exposed to sky noise. This approach is illustrated in
Figure 5.
All resistive losses (surface reflectance, antenna ohmic) are assumed to be at Tm^
Tant: noise temperature of lossy antenna with sidelobes. Ohmic losses = L™.
T3: noise temperature of lossless antenna with sidelobes in upper hemisphere.
T2: noise temperature of lossless antenna aimed down without sidelobes.
Surface reflection loss: Lsai = 1/Reflectivity
Figure 5. Determining Antenna Noise Temperature
An ideal low-gain antenna aimed at the sky with no sidelobes pointed at the
surface will, under average or typical conditions, have a noise temperature given by
Eq. (3). If the same lossless, sidelobeless antenna is aimed at the ground, it will see the
noisy sky reflected in the surface of reflectivity, R = l/LSurf, and at thermal temperature
Iamb- In that case, the antenna temperature, T2, is given by:
r2=-^L+ramb-(i-i/Lsurf). (4)
Depending on the surface temperature and reflectance, the antenna temperature
can be substantially less than the raw sky temperature. Now let the ideal antenna be
modified to have sidelobes pointed at the sky. Let Gdown and Gup be the average gains in
the lower and upper hemispheres. The sidelobe loss, Lside, is then defined to be
Gdowr/Gup- The noise temperature of this antenna, T3, is a weighted average of the
temperature viewed by the mainlobe via surface reflectance, T2, and the sky temperature
viewed by sidelobes directly:
11

r,= +■ 'sky
(1 + 1/Lside) (1 + Iside) (5)
The final antenna temperature, r^t, is obtained by introducing the antenna's
ohmic loss, Lam> assumed to be at Tamb:
T = iant _ 13
Jant + (i-i/Lant)-ramb. (6)
In Figure 6 we plot the antenna temperature as given by Eq.s (3-6) for two cases. The first case is an antenna with unity down/up ratio looking into an earth with 0.5 reflectance, which corresponds to a horizontal dipole at low VHF frequency. The second case is an antenna with a down/up ratio of 10 looking into an earth with 0.2 reflectance, corresponding to a higher gain antenna at UHF. In both cases, the antenna ohmic efficiency is assumed to be 0.5. The third trace in Figure 5 is the "raw" sky temperature, that is, the sum of galactic and solar burst noise temperatures. It is evident that the cooler absorbers (earth, antenna loss) in the transmission path act to mitigate the hot sky temperature. At approximately 250 MHz the sky temperature from Eq. (1) equals the 300 K ambient, so all the traces cross at this point. Above 250 MHz the sky is cooler than ambient, and an antenna with large upward directed sidelobes has an advantage from a combined noise (but not gain) standpoint.
Antenna Temperature vs. Freq and Pattern
*^^mmi^^±^
200 400 600
Frequency/ MHz
"**" Isotropie elevation pattern-0.5 surface reflectance ~+" 10 dB down/up ratio-0.2 surface reflectance ~*~ "Raw" sky temperature
Figure 6. Antenna Temperature vs. Frequency and Pattern
12

IV. SYSTEM NOISE TEMPERATURE
Figure 7 shows the system model used to define the system noise temperature.
a) Transmis- sion Line
ant "-RF
amb
b)
sys
Figure 7. Transmission System Model
In this figure, the four different temperatures defined and used are the following:
1. The antenna noise temperature, Tm. T'ant is the temperature of a matched termination that would provide the same noise power available at the antenna terminals. It is defined by Eq.s (3-6).
2. The effective receiver or low-noise amplifier (LNA) input temperature, Tr. Tr is the temperature of a matched termination at the LNA input that accounts for the incremental noise power at the LNA output due to noise generated within the LNA itself. It is related to the LNA noise figure, F, by:
rr = (F-l)-290K. (7)
3. The ambient thermal temperature, T^b, of the absorbers and losses in the system and scene. In general, these objects can be at somewhat different temperatures, but for present purposes they are all assumed to be at 300 K.
4. The system noise temperature, rsys. rsys is the temperature of a matched termination at the input of an ideal noiseless LNA that accounts for all the noise at the LNA output due to internal and natural external processes.
All of the noise processes and sources in the receiving system of Figure 7a can be transformed into an equivalent matched termination at the temperature rsys, referred to the input of an equivalent noiseless LNA (Figure 7b). Tsys is given by:
13

Tsys=^L+(l-yLRFyTamh+Tr. (8)
-RF
As defined in Eq. (8), Tsys depends on frequency via 7^1- In a wideband system, the receiver temperature, Tr, may also have significant frequency dependence, but that is neglected here. For a receiving system with 2 dB transmission line loss (LRF = 1.6) at 300 K ambient temperature and 2 dB LNA noise figure (Tr = 170 K), the antenna temperature curves plotted in Figure 6 correspond to system noise temperatures plotted in Figure 8. Note that both "noise" and "quiet noise" cases of man-made noise are con- sidered for the near-isotropic antenna. To give an idea of equivalent noise figure as a function of RF frequency, the temperatures are plotted in decibels relative to 290 K. It is evident that although system noise temperature increases markedly at low frequencies, an average over a wide bandwidth would have a much lower effective value. We define the effective noise temperature, reff, as an average over the frequency band employed. If/i and fz are the lower and upper limits, and if the response to noise over the passband is
flat, the effective system noise temperature is given in Eq. (9).
7;ff=7J-r-J^sys(/¥/- (9)
This effective system noise temperature is to be used in the denominator of the
radar equation:
S PavG2X2<sTd
N (4nyR4LRFkTef{
(10)
Recall that reff is referred to the LNA input port, consistent with including the
receiver RF transmission line losses explicitly in Eq. (10).
The effective wideband noise temperature thus depends on the operating fre- quency band limits chosen. Because external sky noise is primarily a problem at low VHF frequencies, we choose as an example a case expected to be relevant to that band: isotropic elevation pattern and 0.5 earth reflectance, with other losses and temperatures as defined above. In Figure 9 we plot the effective noise temperature as defined in Eq. (9) vs. the low frequency band cutoff, with the high-frequency cutoff fixed at 88 MHz. For a low-frequency limit near 30 MHz, the effective average noise temperature corresponds to a noise figure of -9.5 dB in a "quiet noise" environment. The correspond-
ing value in a "rural" environment would be -16 dB.
On the high-frequency band (215-550 MHz), the system noise temperature is
close to 2 dB (relative to 290 K) over the entire band (Figure 8); sky noise is not an issue.
14

25
20
System Noise Temperature at LNA Input
g a. i5
10
[ \ \
\ I
1 I
1 1 i I
\ ■*■
\ \ \ \ > \ \
r \ \ K
N..
^ 'v. ' "*-^
^1-»- Irufc- A—A- -i , A. A .». . > u P—o-^i
100 400 500 200 300
Frequency/MHz
"•" Isotropie Elevation Pattern~50% reflectance--"Quiet Rural ~+" Isotropic~50%~"Rural" man-made noise level -*- 10 dB Down/Up ratio--20% Reflectance~"Quiet Rural"
Figure 8. System Noise Temperature at LNA Input
Effective Wideband Noise Figure
o
o Z
8 e w
16
14
12
10
\ \ \ i. T^
\
"^k
N. lls^ >r ""-K^ |
20 30 40 50 60 70
Low Frequency Cutoff/ MHz
~*~ "Quiet Rural" Environment ~*~ "Rural" Environment
Figure 9. Effective Wideband Noise Figure
80
15

V. CONCLUSIONS
Sky noise (the sum of galactic and solar noise) is expected to have a major impact
on system sensitivity at frequencies below 100 MHz but should not be critical above
200 MHz. Over the frequency range of interest, galactic noise is expected to be the major
component of external natural noise during quiet sun conditions. Solar storms or noise
bursts have the potential to exceed galactic noise but are expected to be rare enough that
system operation would not be significantly limited. When they occur, solar storms may
also lead to excess noise at frequencies above 100 MHz, thus affecting UHF as well as
VHF operation. Atmospheric noise contributions to total sky noise are likely to be
negligible above 30 MHz, but they could be important at lower frequencies.
The major uncertainties at this point relate to man-made noise sources.
Unintentional man-made radiation is not expected to be a dominant noise source as long
as operations are airborne and distant from major centers of industrial activity. RFI from
communications and broadcast sources (which is not considered here), however, will
probably have a major impact. This is known to be the case at UHF frequencies, and RFI
may dominate even the high levels of natural noise expected at VHF.
Only tentative conclusions can be drawn at this point about the impact of sky
noise to the choice of specific test areas. In general, it appears that high northern latitudes
will be favored with less noise, particularly at times when the galactic center is below the
local horizon. Likewise, night operations may be favored during the most extreme and
unlikely solar activity conditions. In northern latitudes, therefore, the winter night should
provide the lowest sky noise conditions. Most important, however, test areas should be
located as remotely as possible from sources of intentional and unintentional man-made
radiation.
16
REFERENCES
1. Ralston, Jim, et. al., "Estimates of Natural Noise Effects on VHF/UHF UWB SAR,"
IDA Memo of 7 May 1997.
2. Kraus, J. D., and M-C Ko, "Celestial Radio Radiation," Ohio State University Report
1 of RF project 673, 1957(AD 117-273).
3. Haslam, C. G. T., et. al., "A 408 MHz All-Sky Continuum Survey," Astronomy and
Astrophysics, 100, 209-219 (1981).
4. Blake, Lamont V., Radar Range Performance Analysis (Artech, 1986).
5. Freeman, Roger L., Reference Manual for Telecommunications Engineering, 2nd ed.
(Wiley, 1993).
6. Kraus, John D., Radio Astronomy, 2nd ed., (Cygnus-Quasar Books, 1988).
7. Valley, Shea L., ed., AFCRL Handbook of Geophysics and Space Environments
(McGraw-Hill, 1965).
8. McNamara, Leo F., The Ionosphere: Communications, Surveillance, and Direction
Finding (Krieger, 1991).
9. Jursa, A.S., ed., Handbook of Geophysics and the Space Environment (Air Force
Geophysics Laboratory, 1985).
10. Man-Made Noise, CCIR Report 258-4, 1986.
11. Spaulding, Arthur D., et.al., Man-Made Radio Noise, Office of Telecommunications
Report 74-38, 1974.
12. Davies, Kenneth, Ionospheric Radio (Peter Peregrinus, 1990).
17

Puttie Raporfrg buro>n b, W «I«»« 0. inlorma.on I. ■*»* to .».rag. ^SSSZäStSÜ ^[^^^^^InTX^^^T^^""' ^o^b^C^wgffn compl.bnr.nd reviewing 6.,collac or,.?'-lonTV.b«v Sjnd ^STlTn^iS^^H^J'^^.VS^.^ ^^.^ <■> •» ™«. °< S.n.^man, .nd Budget. ^.p.rwo* Reaction Pro,.« H.—, (0704-0168). Washington, DC 20503.
1. AGENCY USE ONLY (Leave blank)
REPORT DOCUMENTATION PAGE Form Approved OMB No. 0704-0188
olebng and rev awing lha collection 01 imormaoon. »ana cotnrnan» "v;""'»"™ "■": -rT™.-.-.' ,™ »ESio„ Ü» 52202- dquatters Sorvicee, Directorate lor Inioimaoon Oparaliono and Report», 1215 JeHoreon Davis Hghway, Suite 1204, Arlington, V* ZZZOZ
2. REPORT DATE September 1998
3. REPORT TYPE AND DATES COVERED Final—January-June 1997
TITLE AND SUBTITLE Environmental/Noise Effects on VHF/UHF UWB SAR
6. AUTHOR(S)
James Ralston, James Heagy, Roger Sullivan
7. PERFORMING ORGANIZATION NAME(S) AND ADDRESS(ES)
Institute for Defense Analyses 1801 N. Beauregard St. Alexandria, VA 22311-1772
9. SPONSORING/MONITORING AGENCY NAME(S) AND ADDRESS(ES)
Defense Advanced Research Projects Agency 3701 N. Fairfax Drive Arlington, VA 22203-1714
11. SUPPLEMENTARY NOTES
12a. DISTRIBUTION/AVAILABILITY STATEMENT
Approved for public release; distribution unlimited.
5. FUNDING NUMBERS
DASW01 94 C 0054 DARPA Assignment A-155
8. PERFORMING ORGANIZATION REPORT NUMBER
IDA Paper P-3385
10. SPONSORING/MONITORING AGENCY REPORT NUMBER
12b. DISTRIBUTION CODE
13. ABSTRACT (Maximum 180 words)
This paper presents a straightforward approach to estimating the impact of natural environmental noise on an overall system noise temperature for very high frequency/ultrahigh frequency synthetic aperture radar (VHF/UHI- SAR) emphasizing the 30-600 MHz band. The most important external noise sources included are galactic noise' solar noise, and unintended man-made noise. In addition, the estimate of system noise temperature includes the effect of thermal noise due to ground and antenna losses as well as receiver noise. Atmospheric noise is generally much less than other sources in the band of interest here and so has not been specifically included Similarly, thermal noise originating in atmospheric absorption losses is not significant in this band. We consider first the contributions of various sources to an overall sky temperature and then a model for estimating the effect of sky temperature on the system noise temperature of a practical, non-ideal, radar receiver.
14. SUBJECT TERMS
sky noise, sky temperature, ultra-wideband radar, VHF radar, UHF radar
15. NUMBER OF PAGES 25
17. SECURITY CLASSIFICATION OF REPORT
UNCLASSIFIED
18. SECURITY CLASSIFICATION OF THIS PAGE
UNCLASSIFIED
19. SECURITY CLASSIFICATION OF ABSTRACT
UNCLASSIFIED
16. PRICE CODE
20. LIMITATION OF ABSTRACT
SAR
NSN 7540-01-280-5500 Standard Form 298 (Rev. 2-89) Prescribed by ANSI Sid. 239-18 298-102