Embed Size (px)
Citation preview
IDAHOIDAHOPOWER POWER
Environmental Affairs
Limnological Survey of theC.J. Strike HydroelectricProject
Ralph E. MyersProject Limnologist
Stanley A. PierceEnvironmental Technician
Technical ReportAppendix E.2.2-A
C.J. StrikeFERC No. 2055
December 1997

C.J. Strike Limnology Survey
Idaho Power Company Page i
Table of ContentsTable of Contents............................................................................................................................. i
List of Tables .................................................................................................................................. ii
List of Figures ................................................................................................................................ iii
Abstract ............................................................................................................................................1
1. Introduction.................................................................................................................................1
2. Study Area...................................................................................................................................3
2.1. Hydrology ....................................................................................................................32.2. Land Features and Geology..........................................................................................42.3. Climate.........................................................................................................................52.4. Land Use ......................................................................................................................5
3. Methods.......................................................................................................................................6
3.1. Site Locations...............................................................................................................63.2. Sampling Techniques...................................................................................................63.3. Data Analysis ...............................................................................................................73.4. Quality Control and Assurance ....................................................................................8
4. Results.........................................................................................................................................8
4.1. Compliance with the Idaho Standard for Waters Discharged from Dams,Reservoirs, and Hydroelectric Facilities.......................................................................8
4.2. Compliance with the Idaho General Surface Water Quality Criteria for allSurface Waters of the State ..........................................................................................8
4.3. Compliance with the Idaho Surface Water Quality Criteria for SupportingDesignated Uses ...........................................................................................................9
4.4. Descriptive Characterization......................................................................................104.4.1. Physical Characteristics ..................................................................................104.4.2. Water Temperature .........................................................................................104.4.3. Dissolved Oxygen ...........................................................................................114.4.4. Water Clarity...................................................................................................124.4.5. Nutrients..........................................................................................................124.4.6. Nutrient QA/QC..............................................................................................134.4.7. Algae ...............................................................................................................134.4.8. Zooplankton ....................................................................................................15
5. Discussion .................................................................................................................................15
6. Literature Cited .........................................................................................................................17

C.J. Strike Limnology Survey
Idaho Power Company Page ii
List of Tables
Table 1. Field collection and laboratory analysis techniques (mdl = minimum detectionlimit) used to monitor water quality in C.J. Strike Reservoir, Snake River,Idaho, 1993–1995. .........................................................................................................20
Table 2. Locations and times of sampling for temperature, dissolved oxygen,conductivity, pH, and turbidity in C.J. Strike Reservoir, 1993–1995. ..........................21
Table 3. Locations and times of sampling for total phosphorus, dissolvedorthophosphate, nitrate nitrogen, total Kjeldahl nitrogen, and ammonia nitrogenin C.J. Strike Reservoir, 1993–1995..............................................................................21
Table 4. Locations and times of sampling for chlorophyll a in C.J. Strike Reservoir,1993–1995. ....................................................................................................................23
Table 5. Ranges and means for 16 water-quality variables monitored in the BruneauArm of C.J. Strike Reservoir, May 1993–October 1995. ..............................................24
Table 6. Ranges and means for 16 water-quality variables monitored in the Snake RiverArm of C.J. Strike Reservoir May 1993–October 1995. ...............................................25
Table 7. Ranges and means for 16 water-quality variables monitored in the tailwater ofC.J. Strike Reservoir, May 1993–October 1995............................................................26
Table 8. Morphologic data for C.J. Strike Reservoir. ..................................................................27
Table 9. Summary table of maximum changes in water-column temperature (°C) onindividual sampling dates at nine sampling locations throughout C.J. StrikeReservoir. ......................................................................................................................28
Table 10. Summary results for field duplicate and spike samples collected as part of theQA/QC program. Summary statistics are based on Bauer (1986)................................29
Table 11. Phytoplankton species list for samples collected in the Snake River Arm andBruneau Arm of C.J. Strike Reservoir...........................................................................30
Table 12. Zooplankton species list for samples collected in the Snake River Arm andBruneau Arm of C.J. Strike Reservoir...........................................................................31
C.J. Strike Limnology Survey
Idaho Power Company Page iii
List of Figures
Figure 1. Study area map of C.J. Strike Reservoir, Snake and Bruneau rivers, Idaho. 33
Figure 2. Schematic depiction of the locations of sampling sites monitored in C.J. StrikeReservoir. 34
Figure 3. Dissolved oxygen levels in water discharged from the C.J. Strike Projectrelative to the Idaho State Standard. 35
Figure 4. Percent exceedence curves for chlorophyll a levels in the Bruneau Arm, theSnake River Arm, and the tailwaters of the C.J. Strike Project. 36
Figure 5. Percent exceedence curves for total suspended solids levels in the Bruneau Arm,the Snake River Arm, and the tailwaters of the C.J. Strike Project. 37
Figure 6. Percent exceedence curves for total phosphorus and dissolved orthophosphate inthe Bruneau Arm, the Snake River Arm, and the tailwaters of the C.J. StrikeProject. 38
Figure 7. Daily maximum and daily mean water temperatures for water discharged fromthe C.J. Strike Project during 1993–1995. 39
Figure 8. Retention time estimates for C.J. Strike Reservoir at full pool (solid line) andminimum pool (dashed line) over a range of flows. 40
Figure 9. Water temperature isopleths for C.J. Strike Reservoir, March–June 1994. 41
Figure 10. Water temperature isopleths for C.J. Strike Reservoir, July–October 1994. 42
Figure 11. Water temperature isopleths for C.J. Strike Reservoir, March–June 1995. 43
Figure 12. Water temperature isopleths for C.J. Strike Reservoir, July–October 1995. 44
Figure 13. Maximum daily water temperature at three locations in the Snake River fromBliss Dam downstream to C.J. Strike Dam, 1994 and 1995. 45
Figure 14. Diel water-temperature fluctuations of water entering C.J. Strike Reservoir atIndian Cove (RM 525.3) and water leaving the reservoir (RM 493.7), 1994and 1995. 46
Figure 15. Dissolved oxygen isopleths for C.J. Strike Reservoir, March–June 1994. 47
Figure 16. Dissolved oxygen isopleths for C.J. Strike Reservoir, July–October 1994. 48
Figure 17. Dissolved oxygen isopleths for C.J. Strike Reservoir, March–June 1995. 49
Figure 18. Dissolved oxygen isopleths for C.J. Strike Reservoir, July–October 1995. 50

C.J. Strike Limnology Survey
Idaho Power Company Page iv
Figure 19. Hydrograph of Snake River flows leaving the C.J. Strike Project during 1993–1995. 51
Figure 20. Daily minimum and mean dissolved oxygen levels at three locations in theSnake River from Bliss Dam downstream to C.J. Strike Dam, 1994 and 1995. 52
Figure 21. Turbidity of water flowing into C.J. Strike Reservoir at Indian Cove Bridge(RM 525.3) and leaving the reservoir (RM 493.7). 53
Figure 22. Mean Secchi depth (solid dot) with 95% confidence limits (asterisk) measuredat 11 sites throughout the study area. 54
Figure 23. Turbidity isopleths for C.J. Strike Reservoir for June–November, 1994. 55
Figure 24. Turbidity isopleths for C.J. Strike Reservoir for March–October, 1995. 56
Figure 25. Total phosphorus and dissolved orthophosphate loads at King Hill (inflow)and in the C.J. Strike Project tailrace (outflow), 1994 and 1995. 57
Figure 26. Nitrate nitrogen, total Kjeldahl nitrogen, and total nitrogen (defined as totalKjeldahl and nitrate) loads at King Hill (inflow) and in the C.J. Strike Projecttailrace (outflow), 1994 and1995. 58
Figure 27. Isopleths for total phosphorus, dissolved orthophosphate, and particulatephosphorus (defined as the difference between total phosphorus and dissolvedorthophosphate) for C.J. Strike Reservoir, based on time-averaged profile datafor June–August, 1994. 59
Figure 28. Isopleths for ammonia, total Kjeldahl, and nitrate nitrogen for C.J. StrikeReservoir, based on time-averaged profile data for June–August 1994. 60
Figure 29. Average cell densities and biovolume for major phytoplankton divisions ateight sampling locations sampled in 1994 and 1995 throughout the study area. 61
Figure 30. Average cell densities and biovolume for major phytoplankton divisionssummarized by depth at RM 494.5 and RM 495.3 based on samples collectedin 1994 and 1995. 62
Figure 31. Average cell densities and biovolume for major phytoplankton divisionssummarized by depth at RM 500, 504, and 508 based on samples collected in1994 and 1995. 63
Figure 32. Average cell densities and biovolume for major phytoplankton divisionssummarized by depth at RM 2 and 4.3 in the Bruneau Arm of C.J. StrikeReservoir based on samples collected in 1994 and 1995. 64
Figure 33. Box and whisker plot of chlorophyll a levels measured at eight sites along thelength of C.J. Strike Reservoir during 1994 and 1995. 65

C.J. Strike Limnology Survey
Idaho Power Company Page v
Figure 34. Summary plot of chlorophyll a levels measured in water at King Hill (RM546.6) and in the tailrace of C.J. Strike Dam (RM 493.7), October 1993–September 1995. 66
Figure 35. Cell densities for zooplankton divisions on six dates in 1994 and 1995 fromsamples collected at depths of 5 meters or less at seven sites throughout C.J.Strike Reservoir. 67
Figure 36. Zooplankton densities summarized by depth at RM 2 (Bruneau Arm) of C.J.Strike Reservoir on six sampling dates in 1994 and 1995. 68
Figure 37. Zooplankton densities summarized by depth at RM 4.3 (Bruneau Arm) of C.J.Strike Reservoir on six sampling dates in 1994 and 1995. 69
Figure 38. Zooplankton densities summarized by depth at RM 494.5 (Snake River Arm)of C.J. Strike Reservoir on six sampling dates in 1994 and 1995. 70
Figure 39. Zooplankton densities summarized by depth at RM 495.3 (Snake River Arm)of C.J. Strike Reservoir on six sampling dates in 1994 and 1995. 71

C.J. Strike Limnology Survey
Idaho Power Company Page vi
This page left blank intentionally.

C.J. Strike Limnology Survey
Idaho Power Company Page 1
Abstract
Idaho Power Company (IPC) conducted a descriptive limnology survey of C.J. StrikeReservoir from 1993 through 1995. The goal of the study was to characterize the reservoir andevaluate the status of water-quality relative to the State of Idaho water-quality standards. Water-quality issues identified in IPC’s study include low dissolved oxygen and high ammonia nitrogenlevels during summer stratification, warm summer water temperatures, and phytoplanktonblooms. Elevated water temperature is not unique to the reservoir; it is an issue throughout theSnake River system. Problematic dissolved oxygen, ammonia nitrogen, and phytoplankton levelsare more site specific and related to the presence of C.J. Strike Reservoir. The causes of thewater-quality problems in the reservoir are related to the quality of water being delivered to theproject as well as to the processing of pollutants within the reservoir.

C.J. Strike Limnology Survey
Idaho Power Company Page 2
1. Introduction
The C.J. Strike Hydroelectric Project was built in 1952 to meet increasing electricity loaddemands of southern Idaho. Idaho Power Company (IPC) currently operates the project under alicense, which expires in 2000, from the Federal Energy Regulatory Commission (FERC). Ageneral limnological study was proposed during the formal consultation process of applying for anew license to continue operations. This study of C.J. Strike Reservoir would describeconditions within the reservoir and provide a basis for management decisions. Identifyinglimnological characteristics—the physical, biological, and chemical processes—of the reservoirwould also enhance management of reservoir fish populations (McConnell 1971). And provide abasic understanding of water-quality problems associated with the reservoir (Milligan et al.1983).
Therefore, IPC conducted this study of C.J. Strike Reservoir from 1993 through 1995.The goal of the study was to characterize C.J. Strike Reservoir using selected physical, chemical,and biological parameters. The two objectives were to 1) characterize the reservoir based onstandard limnological parameters and 2) document water-quality conditions relative to the IdahoState Water Quality Standards.
C.J. Strike Reservoir does not store water on a seasonal basis. Averages of daily flowentering and leaving C.J. Strike Reservoir are highly correlated (R2 = 0.94). This correlationsuggests that daily project inflows and outflows are nearly equal.
The reservoir experiences minimal daily water-level fluctuations. The C.J. Strike Projectis operated to increase power generation at times of peak demand (block loading). Peak timesare typically 7:00 to 10:00 am and 5:00 to 7:00 pm. The block loading results in typical dailyreservoir headwater fluctuations of 0.3 feet. Ninety percent of the maximum daily change inheadwater elevation is less than 0.4 feet per day.
Water-level fluctuations are more pronounced in the tailwater of the project than in thereservoir. The project tailwater fluctuations are more pronounced than the reservoir. While 90%of the maximum hourly tailwater elevation changes are less than 1 foot, total daily elevationchanges of up to 3 feet can be expected during a typical day.
In addition to daily alteration of flow patterns for power production, the hydrology of theSnake River has been significantly affected by large irrigation and flood-control reservoirsupstream of C.J. Strike (i.e., American Falls and Palisades reservoirs). Also, agriculturaldemands, including the near-total diversion of the Snake River at Milner Dam (RM 639) andseveral large pumping diversions upstream of C.J. Strike Reservoir, can markedly reduce watersupply during the irrigation season.
Prior to this study, descriptive water-quality data for C.J. Strike Reservoir was verylimited. Milligan et al. (1983) sampled the reservoir once and classified the reservoir aseutrophic. Specifically, of 85 lakes and reservoirs sampled throughout Idaho, only 12 wereclassified as more productive than C.J. Strike Reservoir. Dillon (1991 and 1992) collected

C.J. Strike Limnology Survey
Idaho Power Company Page 3
limited-water-quality characterization data coincidental with fish sampling in the reservoir.General water quality and biological communities within the reservoir and downstream in theearly 1950s were described by Irving and Cuplin (1956). Nutrient data collected by IPC in C.J.Strike Reservoir from 1973 to 1975 indicated that nutrient concentrations in the reservoirexceeded the 0.05 mg/l EPA criteria for phosphorus in reservoirs. Data collected by IPC from1988 to 1993 are summarized by IPC (1993). Myers et al. (1995) and Myers and Pierce (1996)are descriptive studies of other upstream hydroelectric reservoirs which provide a basis forcomparisons among reservoirs, and insight into how the Snake River is functioning as a system.
Recent drought conditions in the Snake River drainage have emphasized water-qualityproblems and concerns. Much of the Snake River from its headwaters in eastern Idahodownstream to Brownlee Dam has been designated as “water quality limited” (IDHW-DEQ1989; IDHW-DEQ 1992; IDHW-DEQ 1994). The water-quality-limited designation indicatesthat water quality is not adequate to support all designated beneficial uses. The EnvironmentalProtection Agency (EPA) is under a court-imposed timeline to prepare Total Maximum DailyLoad (TMDL) documents for the water-quality-limited segments. The designated uses for waterswithin the C.J. Strike Project include domestic and agricultural water supply, primary andsecondary contact recreation, and coldwater biota. The project area supports self-sustainingpopulations of warmwater sport fishes and a hatchery-sustained trout fishery. Extensive coloniesof an endangered snail (Pyrgulopsis idahoensis) inhabit the reservoir and tailwaters (IPC, unpub.data).
2. Study Area
The study area is in Elmore and Owyhee counties of southwestern Idaho. Our study areaincludes approximately 53 miles of the Snake River (from C.J. Strike Dam upstream to KingHill) and 5 miles of the Bruneau River (Figure 1). Approximately 30 of the 53 miles on theSnake River are within the backwaters of the C.J. Strike Project. The remaining 23 miles areupstream of the C.J. Strike backwater. All 5 miles of the Bruneau River are within the backwaterof the reservoir.
2.1. Hydrology
The watershed of the study area is approximately 38,500 square miles. The total is thesum of the Snake River Basin (35,800 square miles) and the Bruneau River Basin (2630 squaremiles). The Snake River Basin includes 450 miles of the Snake River and 24 major subbasins(Low 1991).
Average annual discharge into the study area from the Snake River is 10,730 cfs,resulting in a total annual flow of slightly less than 8 million acre-feet (Brennan et al. 1996b).Mean annual discharge in the Bruneau River is 388 cfs, with a corresponding total annual flow of

C.J. Strike Limnology Survey
Idaho Power Company Page 4
273,000 acre-feet (Brennan et al. 1996a). Mean annual discharge for the Snake River into thestudy area is 10,730 cfs. Peak runoff, associated with spring snowmelt for both the Snake andBruneau rivers, occurs from April through June. Summer flows are largely controlled byupstream irrigation reservoirs and diversions.
Upstream construction of water-diversion projects and hydroelectric projects began in theearly 1900s with the construction of Milner Dam, which was built to divert irrigation water, andthe Shoshone Falls Hydroelectric Project. Snake River hydroelectric projects have a combinedcapacity of approximately 500 megawatts. Water storage for power production is minimal, withessentially all upstream water storage associated with irrigation or flood control. Approximately13.2 million acre-feet of water is diverted from the river to irrigate 2.3 million acres in the SnakeRiver Basin (Low 1991).
Four to five million acre-feet of spring water enters the river annually through a series oflarge springs within 180 miles upstream of the study area. Much of the spring-water is used byaquaculture facilities prior to its discharge into the river. These aquaculture facilities combine toproduce most of the commercial trout raised in the United States.
2.2. Land Features and Geology
The study area is located within the Snake River Canyon in the southwestern Snake RiverPlain of southern Idaho. Much of the canyon resembles a broad, steep-sided trench cut into theplain that extends more than 300 miles across southern Idaho. The Snake River Plain iscomposed of basaltic lava flows that are about 4000 feet thick. Geologic units within the studyarea are part of a unique series of basaltic lava flows, pillow lavas (formed by lava extrudingunder water), river deposits, and deposits from ancestral lakes. Geologic features includedeposits associated with the catastrophic Bonneville Flood, which flowed through the canyonabout 15,000 years ago. The Bonneville Flood also may have been responsible for the removalof much detritus (rock fragments or loose material caused by disintegration) from the canyonfloor, as well as for the erratic deposition of well-rounded basalt boulders (FERC 1990; Malde1991).
Nearly vertical, black basalt cliffs dominate the canyon and are extensively jointed. Thiscolumnar jointing is a result of contraction of the lava during cooling. Unconsolidated depositsoccur in the area, usually near the bases of the canyon walls and on talus slopes (FERC 1990;Malde 1991). These unconsolidated materials include windblown dust (loess), river sands andgravels (alluvium), and talus (colluvium). Soils, ranging from silty clay loams to gravelly loams,have formed on the unconsolidated materials. Also, the Snake River and its tributaries, includingnumerous ephemeral creeks, transport sediments into the study area. Tributaries to the reservoirinclude the Bruneau River, Jacks Creek, Bennett Creek, Cold Springs, and Little Canyon Creek.
Riparian communities in the C.J. Strike Study Area are limited and lack diversity (Cole1997). The largest wetland communities are located at the upstream ends of the Snake and

C.J. Strike Limnology Survey
Idaho Power Company Page 5
Bruneau river Arms of the reservoir. Elsewhere, Emergent Wetlands occur sporadically and arevery small. Hardstem bulrush (Scirpus acutus) dominates the emergent wetland communities(Cole 1997). Forested Wetlands are rare and frequently dominated by species adapted to salinesoil conditions, e.g., Russian olive (Elaeagnus angustifolia) and coyote willow (Salix exigua).
2.3. Climate
The climate of the study area is typical of the Great Basin Desert. The study area issemiarid due to an orographic rainshadow created by the Cascade Mountain Range (Caldwell1985; Franklin and Dyrness 1988; West 1988). Summers are typically hot and dry. Daytimemidsummer temperatures regularly exceed 100 °F (37.8 °C). Total precipitation per yearaverages less than 10 inches. Most precipitation falls during winter months. Generally, the smallamount of precipitation that falls during summer does not percolate in the soil but is lost throughevaporation and runoff (Caldwell 1985; West 1988).
The terrain surrounding the reservoir consists of plateaus and low hills, leaving thereservoir unprotected from the prevailing westerly and northwesterly winds. During the summer,winds of 10 to 20 mph occur most afternoons, and higher winds are associated with eveningthundershowers or storm fronts that can move through the area any time of year.
2.4. Land Use
Agriculture (rangeland and irrigated cropland) is the dominant land use in the study area.Large expanses of rangelands (publicly and privately owned) occur throughout the study area andadjacent vicinity. Most of the public rangelands are administered by the Bureau of LandManagement (BLM). Other public lands in the vicinity are managed by the State of Idaho.Bruneau Dunes State Park, Three Island Crossing State Park, and C.J. Strike WildlifeManagement Area are managed primarily for recreational use. The Idaho Department of Fish andGame manages the C.J. Strike Wildlife Management Area primarily to support recreationalhunting.
Development of hydroelectric power helped consolidate and extend the development ofnew farms and towns in the vicinity of the project (Stacy 1991). Electricity enabled additionalacreage to be irrigated from the Snake River by electric-powered pumps. These lands includeseveral farms that lie high above C.J. Strike Reservoir. Expanding agriculture resulted in agrowing economy, population growth, new towns, and related industrial development.Agriculture dominants the social and economic structure of the region.

C.J. Strike Limnology Survey
Idaho Power Company Page 6
3. Methods
3.1. Site Locations
The reservoir was divided into two areas for sampling purposes: the Snake River Arm(from the dam upstream to Loveridge Bridge) and the Bruneau Arm (from the Bruneau Narrowsupstream). Sampling sites were systematically located longitudinally through the Snake RiverArm of the reservoir (Figure 2). Two sites were located in the Bruneau Arm. One site was in thelarge pool and the other was in the narrows. We sampled at the deepest point of the channelcross section. In addition, we monitored three sites outside the reservoir areas. One site was atthe King Hill Bridge, another was at the Indian Cove Bridge, and the third was at the USGSgauge site (on the bridge) immediately downstream of the dam.
3.2. Sampling Techniques
We sampled sixteen parameters (Table 1) at various locations and times (Tables 2, 3, and4). Measurements collected using the Hydrolab Surveyor 3 were typically sampled at amaximum depth interval of 5 m and a minimum depth interval of 1 m. Readings were taken at 1m depth intervals, where changes of temperature or dissolved oxygen exceeded 1° C or 2 mg/l,respectively, within 5 m of depth change. At shallow sites (total depth < 5 m) only surfaceHydrolab readings and nutrient samples were taken. Where total depth exceeded 20 m, nutrientsamples were collected at the surface, 10 m above the reservoir bottom, and 5 m above thereservoir bottom. Nutrient-sample collection and analyses were consistent with American PublicHealth Association (1989) and EPA (1983).
Dissolved oxygen and temperature measurements taken at Indian Cove Bridge (RM525.3) and in the project tailwaters (RM 493.7) were collected at 10-minute intervals. HydrolabDatasonde 3 datalogger probes submerged in a perforated PVC pipe were used to measure andrecord data. The oxygen sensors were calibrated at least every two weeks.
Phytoplankton species and chlorophyll a surface samples (< 1 m deep) were collected asgrab samples directly into a polypropylene bottle. Brown bottles were used for chlorophyllsamples to minimize sample contact with light. Samples were stored on ice for a maximum of48 hours. Samples were filtered using Whatman GFC glass fiber filters, macerated using round-bottom glass grinding tubes and matching pestles, and clarified using a 0.45 µm membrane filter.Chlorophyll a values were corrected for pheophytin a (APHA 1989:10200.H.2.4.b). Samplescollected from depths greater than 1 m were retrieved using a Van Dorn style sampler andtransferred to sample containers immediately.
Phytoplankton species samples were scheduled for collection monthly from April throughOctober in 1994 and 1995. Samples were preserved in the field using Lugol's solution. Sampleswere shipped to AquaID (Carrboro, NC) for species identification and enumeration.Phytoplankton cells were counted using the Utermohol settling chamber technique (Utermohol

C.J. Strike Limnology Survey
Idaho Power Company Page 7
1958). Cells were magnified 320 times (320x) for identification and enumeration. The numberof “fields” counted varied among samples. Cells were counted until the standard error as apercentage of the mean for dominant species was less than 10% (Lund et al. 1958). Typically,this procedure resulted in counting 400 to 800 cells. In addition, the entire settling chamber wasscanned to look for large species such as Cratium hirundinella or colonies such as Microcystisaeruginosa. Phytoplankton biovolume was estimated by measuring cell dimensions of 10individuals per species and size class from each sample and averaging those values. If fewerthan 10 individuals were found, all individuals collected were measured. Volumetric equationsfor shapes that most closely resembled the shapes of individual species were used to determinecell volume (Willen 1976). Cell volume was multiplied by cell density to estimate totalbiovolume.
Zooplankton species samples were scheduled to be collected monthly from April throughOctober in 1994 and 1995. Samples were collected and concentrated using a 20-liter Schindler-Patalis style sampler (80-micron mesh) for all depths. Organisms were preserved in the fieldwith 80% ethanol. Samples were shipped to AquaID for species identification and enumeration.Typically, three subsample aliquots of 0.5–3.0 ml were taken from each zooplankton sample forspecies identification and enumeration. Organisms were identified to genus at 30xmagnification. Microdissection for species identification was done at 100x to 300xmagnification. For enumeration, organisms were counted until the standard error as a percentageof the mean for the dominant species was less than 10%. If the criteria could not be met withthree subsample aliquots, then more organisms were subsampled.
3.3. Data Analysis
Analyses were descriptive in nature. Statistical analysis of data is limited to calculationof ranges, medians, or means by location, depth, or time. Plots showing changes in water-qualitydescriptors and indices longitudinally and through time were constructed for descriptivecharacterization purposes.
Analysis of the 10-minute temperature and dissolved oxygen data included calculation ofsummary statistics consistent with the Idaho State Water Quality Standards. Instantaneoustemperature and dissolved oxygen, 7-day mean dissolved oxygen minima, and 30-day dissolvedoxygen means were graphically compared with the state criteria levels. The 30-day and 7-daymean oxygen levels were calculated using the following equations:
7-day mean minimum = (x(i) + x(i-1) + …x(i–6) ) / 7where xi = daily instantaneous minimum dissolved oxygen (x) on a given day (i)
30-day mean = (x (i) + x(i–1) + ...x(i–29)) / 30where xi = daily average dissolved oxygen calculated from 144 10-minute instantaneous readings(x) on a given day (i).

C.J. Strike Limnology Survey
Idaho Power Company Page 8
3.4. Quality Control and Assurance
All instruments used to collect field data were calibrated and maintained consistent withthe manufacturer's instructions. Nutrient samples were collected in plastic cubitainers.Approximately 20% of the samples were spiked with phosphate, nitrate, and ammonia.Approximately 20% of the samples were collected in duplicate. Locations of sample spiking andduplicate sample collection were randomly chosen prior to each sampling episode. Field blankswere collected for each case of sample containers. Accuracy and precision estimates werecalculated based on methodologies described in Bauer (1986). Alchem Laboratories (Boise, ID)conducted all nutrient analyses. Alchem Laboratories have QA/QC guidelines for all nutrientanalyses conducted as part of our study (Alchem Laboratory 1991).
4. Results
4.1. Compliance with the Idaho Standard for Waters Dischargedfrom Dams, Reservoirs, and Hydroelectric Facilities
This Idaho standard applies specifically to dissolved oxygen during June 15 throughOctober 15. The standard has three specific levels: an instantaneous minimum level of 3.5 mg/l,a 7-day mean minimum level of 4.7 mg/l, and a 30-day mean level of 6.0 mg/l. Water leavingthe project fell below the minimum standard levels for brief periods in 1993 and 1994 (Figure 3).
4.2. Compliance with the Idaho General Surface Water QualityCriteria for all Surface Waters of the State
Parameters relating to the general water quality criteria for all waters of the state includehazardous materials; toxic substances; deleterious materials; radioactive materials; floating,suspended or submerged matter; excessive nutrients; oxygen demanding materials; and sediment.Our study did not include sampling for hazardous, toxic, or radioactive materials. Sampling ofdeleterious materials; floating, suspended or submerged matter; nutrients; and oxygen demandingmaterial included chlorophyll a (as an indicator of suspended algae biomass), total suspendedsolids, nitrogen, and phosphorus sampling.
Although Idaho has not identified specific chlorophyll a levels that limit beneficial uses,the State of Oregon has identified 15 µg/l as the level that should trigger concern. The highestchlorophyll a level (165 µg/l) was measured in the Bruneau Arm of the reservoir. The medianchlorophyll a level in the Bruneau and Snake River Arms of the reservoir exceeded 15 µg/l(Tables 5 and 6). In the tailwater, chlorophyll a levels ranged up to 64 µg/l, with a median levelof 14 µg/l (Table 7). Approximately 68% of the chlorophyll a values measured in the BruneauArm exceeded 15 µg/l, while 60% of the values in the Snake River Arm did so (Figure 4). The

C.J. Strike Limnology Survey
Idaho Power Company Page 9
primary linkage of suspended algae to impaired beneficial uses appears related to the effect of thealgae on dissolved oxygen levels in the reservoir. Oxygen demand from senescent and decayingalgae cells likely contributes to low dissolved oxygen levels in the reservoir.
Over 90% of the total suspended solids levels measured throughout the study area wereless than 30 mg/l (Figure 5). Higher levels were found in the reservoir than in the tailwater, withthe highest level in the reservoir being 77 mg/l (Table 6). Generally, the highest levels ofsuspended solids were in the upstream end of the reservoir. We found evidence that material wassettling within the water column and will present more detail on sedimentation processes in thereservoir later in this report.
The State of Idaho has no numeric criteria for “excessive” nutrients but identifies theneed for nutrient levels that do not result in visible slime growths or other aquatic growths thatimpair beneficial uses. The EPA (1986) proposed that a target total phosphorus levels of 0.05mg/l for water flowing directly into an impoundment should prevent the development ofbiological nuisances and control eutrophication. The EPA proposed in-reservoir phosphoruslevel is 0.025 mg/l. All samples collected in the reservoir were above the 0.025 mg/l level, while98% of the samples we collected in the Snake River Arm of the reservoir also exceeded the lessstringent 0.05 mg/l limit for inflowing water (Figure 6). Target levels for ammonia and nitratenitrogen that would prevent the development of nuisance biological growth are less defined thanfor phosphorus. The linkage between the nutrient levels in C.J. Strike Reservoir and beneficialuses is likely the support of algal blooms in the reservoir by high nutrient levels that in turn resultin some level of oxygen depletion as the algae cells die and decay.
4.3. Compliance with the Idaho Surface Water Quality Criteria forSupporting Designated Uses
Designated beneficial uses for C.J. Strike Reservoir include; domestic and agriculturalwater supply, primary and secondary recreation, and cold water biota. We did not measure anyparameters in this study that should impair domestic or agricultural water supply uses. Theprimary water quality criterion for determining if primary and secondary recreation are beingsupported is the lack of fecal coliform in the water. Our study included only two samples forfecal coliform in the reservoir. Samples taken on July 15 and October 20, 1993, had less than 10counts/100ml. While our data are very limited, they support the conclusion that fecal coliformlevels in the reservoir are well within the limits for supporting both primary and secondaryrecreation.
We found that high water temperatures and low dissolved oxygen levels are probablyimpairing coldwater biota in the reservoir and tailwaters. Summer water temperatures exceededthe 22°C instantaneous upper limit, and the 18°C daily average upper limit for coldwater biota inboth the reservoir and tailwaters (Figure 7, Tables 5 and 6). Likewise, dissolved oxygen levelsfell below 6.0 mg/l in the reservoir and tailwater during all three years sampled. The reservoirand tailwaters support two native coldwater fish species: rainbow trout and mountain whitefish.

C.J. Strike Limnology Survey
Idaho Power Company Page 10
While rainbow trout are native to the project area, the current population in the reservoir is solelyhatchery stock (Brink et al. 1997).
4.4. Descriptive Characterization
4.4.1. Physical Characteristics
C.J. Strike Reservoir is a relatively large reservoir with little active storage (Table 8).The reservoir has two distinct Arms. The Bruneau Arm totals 2164 acres in area, consisting of alarge pool that flows into a constricted canyon prior to entering the Snake River. The large poolin the Bruneau Arm is oblong and has a maximum depth of 10 m. In contrast, the Narrowsbetween the Bruneau Pool and the Snake River is relatively narrow and deep. The mean depthfor the entire Bruneau Arm is 21 feet. The Snake River Arm consists of a large open poolimmediately upstream of the dam. Approximately one mile upstream of the powerhouse, thereservoir narrows as the surrounding topography forms steep canyon walls that extend 15 milesupstream. The surrounding topography then flattens with occasional buttes and rockoutcroppings bordering the reservoir. The Snake River Arm has a mean depth of 33 ft.
Water retention times in the reservoir are mainly dependent on flow (Figure 8). Theaverage discharge through the project is approximately 11,000 cfs, which results in a reservoirretention time of approximately eight days.
4.4.2. Water Temperature
The Bruneau Arm, Snake River Arm, and tailwater showed relatively similar ranges ofvalues for most of the standard parameters measured (Tables 5, 6, and 7). The upper limit fortemperature was higher in the Bruneau Arm than in the Snake River Arm or tailwater. Also, themedian temperature in the tailwater was notably different from those in the reservoir locations.The higher limit in the Bruneau Arm likely accurately reflects slightly warmer water conditionsin the Bruneau Arm than in the Snake River Arm. The higher median tailwater temperature,however, is an artifact of sampling methodology. The tailwater monitor took samples throughoutthe year, while the reservoir monitoring was limited to spring summer and fall. Consequently, thereservoir data does not include cold winter temperatures that were included in the tailwatermedian.
Thermal gradients begin to appear in the reservoir as inflowing water warms and flowsover the cooler water in the deeper parts of the reservoir (Figures 9, 10, 11, and 12). Whiletemperature gradients are present, the reservoir does not exhibit a strong thermocline. Maximumsummer temperatures in the deep water generally exceeded 15°C. The maximum water-columnprofile temperature range we found was 9.4°C at RM 494.5 in 1994 (Table 9).
Comparison of water temperatures flowing into the reservoir at Indian Cove with watertemperatures leaving the reservoir and water temperatures 20 miles upstream of the reservoir at

C.J. Strike Limnology Survey
Idaho Power Company Page 11
Bliss Dam show that the temperature increase through the unimpounded reach is similar to watertemperature increases through the reservoir (Figure 13). The reservoir tailwater data showsmaller daily temperature fluctuations than were observed at Indian Cove (Figure 14). Thisobservation would be expected since the larger volume of water contained within the reservoirreach would be less responsive to daily changes in air temperature than would the shallower riverat Indian Cove. Springtime warming of water leaving the reservoir generally occurred slightlylater than upstream of the reservoir, while water cooling in the fall also lagged slightly behindupstream conditions (Figure 13). Winter temperatures showed a greater decrease from IndianCove to C.J. Strike Dam than through the upstream reach of similar length from Bliss Dam toIndian Cove.
4.4.3. Dissolved Oxygen
Dissolved oxygen differences were minimal among the three areas. One notabledifference, however, was the extremely low oxygen levels in both arms of the reservoir but not inthe tailwater(Tables 5, 6, and 7). The reservoir experienced times when some portion of thewater column had a very low (< 2 mg/l) dissolved oxygen levels (Figures 15, 16, 17, and 18).These low levels in the reservoir coincided with low dissolved oxygen levels in the tailwater.However, during summer months, shallow water (<1 m deep) typically experienced dailysupersaturated oxygen conditions. These conditions resulted from photosynthetic activity of highlevels of phytoplankton.
Low dissolved oxygen levels occurred in the reservoir from the dam upstream to RM 502and were generally confined to depths greater than 10 m. Low dissolved oxygen levels wereobserved in the reservoir in June of both 1993 and 1995 despite flows exceeding 20,000 cfs(Figure 19).
Comparison of dissolved oxygen levels entering the reservoir at Indian Cove, in the damtailwater, and 20 miles upstream of the reservoir at Bliss Dam showed more seasonal variation inoxygen levels in the inflow and outflow of C.J. Strike Reservoir than at Bliss Dam (Figure 20).In 1994, low dissolved oxygen levels in the tailwater of C.J. Strike Dam did not correspond withlow oxygen levels in inflowing water. In 1995, however, we found low oxygen levels in both thereservoir inflow and outflow.

C.J. Strike Limnology Survey
Idaho Power Company Page 12
4.4.4. Water Clarity
We measured water clarity in terms of turbidity and Secchi depth. Turbidity measured atthe Indian Cove Bridge, which represents the condition of water flowing into the reservoir, wasconsistently higher than turbidity of water in the tailwater of the dam as it was leaving thereservoir (Figure 21). Secchi measurements taken in the reservoir corroborate the increase inwater clarity downstream through the reservoir (Figure 22). Secchi depth measurements in theBruneau Arm were similar to measurements taken at locations in the Snake River Armdownstream of RM 500.
The most notable turbidity event occurred in July 1993 (Figure 21) and was associatedwith a large landslide 40 miles upstream of C.J.Strike Dam near the town of Bliss. The northslope of the canyon moved down into the river channel, altering the flow of the river andreleasing large amounts of sediment into the river. While inflowing turbidity to the reservoirexceeded all other turbidity measured throughout the study, this extreme pulse of inflowingturbidity did not elevate outflowing turbidity to extreme levels (Figure 21).
Turbidity isopleths from profile data collected in the reservoir showed consistentlyincreasing turbidity down through the water column in the reservoir (Figures 23 and 24). Underlower flow conditions in 1994, the turbidity gradient was most apparent upstream of RM 500.Under higher flows in 1995, the gradient extended downstream to the dam.
Our data clearly supports the conclusion that suspended material in the water column issettling out in the reservoir, resulting in a net improvement in water clarity as water passesthrough the reservoir. Bathymetry data also supports the conclusion that material is settling outin the reservoir. Data collected in 1994 and 1995 indicates that the reservoir currently has acapacity of 226,800 acre-feet (IPC unpubl. data). This estimate is 13,200 acre-feet less than theestimated capacity of the reservoir at impoundment (IPC 1993).
4.4.5. Nutrients
C.J. Strike Reservoir is consistently retaining phosphorus and nitrogen (Figures 25 and26). Specifically, total phosphorus, dissolved orthophosphate, and nitrate nitrogen all show netreductions in loads (concentration times flow) from King Hill to below C.J. Strike Dam.Conversely, with the exception of November 1994 through May 1995, total Kjeldahl nitrogen(TKN) leaving the reservoir exceeded the amount flowing past King Hill. Comparison of totalnitrogen (defined as TKN plus nitrate) inflow and outflow show that there is generally a netretention of nitrogen, especially during winter months.
Total phosphorus loads to the reservoir peaked during March and April of 1994, and Mayand June of 1995 (Figure 25). In 1995, the peak load was the result of high springtime flows.The peak load in 1995 was associated with the large amount of water flowing into the reservoirrather than elevated phosphorus concentrations in the water. Phosphorus concentrations during

C.J. Strike Limnology Survey
Idaho Power Company Page 13
May and June, 1995 were only slightly higher than other months of the year. Conversely, in1994, the high phosphorus load in the spring was not a result of large quantities of water flowinginto the reservoir. In 1994, there was no elevated spring runoff (Figure 19). Still, phosphorusloads into the reservoir showed a distinct peak in the spring. The phosphorus load peak in 1994was related to noticeably higher concentrations of phosphorus in the water rather than elevatedwater volume.
The dissolved orthophosphate load trends were less identifiable than the total phosphorusload trends. Peaks in orthophosphate loads entering the reservoir occurred in December 1994and May 1995. Unlike total phosphorus, no consistent seasonal trend between years wasapparent. Similar to total phosphorus, high orthophosphate loading in May 1995 coincided withelevated discharge from spring runoff. Unlike total phosphorus, in 1994 when spring flows wereno higher than other times of the year, a peak in orthophosphate load to the reservoir did notoccur.
Changes in nutrient levels through the water column in the reservoir coincided withthermal and dissolved oxygen gradients. Phosphorus concentrations increased noticeably in thedeep anoxic water within the reservoir (Figure 27). The increase is attributable to higherdissolved orthophosphate concentrations in the deeper parts of the reservoir where low dissolvedoxygen levels cause anoxic sediments to release phosphorus. Particulate phosphorus (defined astotal phosphorus minus dissolved orthophosphate) showed a general decline from the upstreamend of the reservoir to the dam, with relatively similar levels throughout the water column.Similar to water clarity data, this pattern indicates the settling of particles from the water columnin the reservoir.
Ammonia nitrogen levels were 20 times higher in the deep anoxic water than in theaerobic surface water (Figure 28). Elevated total Kjeldahl nitrogen levels were attributable to theelevated ammonia levels, while nitrate levels in the deep anoxic water were lower than in theoverlying aerobic water. As in the phosphorus profiles, it is apparent that low dissolved oxygenconditions in the deep water of the reservoir are resulting in chemical changes in the watercolumn.
4.4.6. Nutrient QA/QC
We collected 33 duplicates and field-spiked 33 samples. Total Kjeldahl nitrogen samplesshowed the largest absolute and relative range (Table 10). All parameters except total Kjeldahlnitrogen showed a relative range of less than 8%. Field-spiked samples showed the greatestrange of recovery for total phosphorus. Nitrate showed the largest deviation from 100%recovery. Field blanks failed to show levels exceeding the minimum detection limits.

C.J. Strike Limnology Survey
Idaho Power Company Page 14
4.4.7. Algae
We measured water column algae (phytoplankton) by collecting samples for speciesidentification and enumeration, and also chlorophyll a analysis. Samples for speciesidentification were collected on April 7, June 13, July 13, and August 30, 1994. In 1995, speciessamples were collected on April 17, June 22, August 29, and October 24. We identified 67phytoplankton species from six Divisions (Table 11). The reservoir was consistently dominatedby Chrysophyta and Cyanophyta phytoplankton species (Figure 29). Seasonally, Chrysophytaspecies were the most prevalent in both numbers and biovolume except for summer months.Chrysophyta species always dominated the April and May samples. Cyanophyta species hadhigh densities during summer months, but did not dominate in biovolume. During summer andfall months, Cyanophyta species replaced Chrysophyta species as the dominants between the damand RM 500 on approximately half of the sampled dates. In the Bruneau Arm, Cyanophytaspecies consistently dominated the Bruneau Pool during summer and fall months.
Spatially, Chrysophyta species always dominated upstream of RM 500 on the SnakeRiver Arm of the reservoir. Cyanophyta species showed relatively high densities in the BruneauRiver Arm and downstream of RM 500 in the Snake River Arm. While Cyanophyta speciesaccounted for a large proportion of the number of algae cells, biovolume of the Cyanophytaspecies again remained relatively small because of the relatively small cell size of theCyanophyta species compared to the Chrysophyta species.
Algae cell density and biovolume showed a marked decline down through the watercolumn downstream of RM 500 (Figure 30). Typically, the Cyanophyta species were moreprevalent in water less than 10 m deep, while the Chrysophyta species dominated in deeperwater. Upstream of RM 500, we failed to see notable changes in phytoplankton densities throughthe water column (Figure 31). The lack of change is likely because these sites were shallowerand had more riverine hydraulic conditions. We noted reduced algae levels at 10 m of depth inthe Bruneau Narrows (RM 2) but found mixed conditions in the Bruneau Pool (Figure 32).
Chlorophyll a measurements in the reservoir showed noticably higher upper limits ofchlorophyll a than the tailrace samples. The maximum chlorophyll a level we measured in thetailrace was 64µg/l, while the maximum levels in the two Arms of the reservoir exceeded 130µg/l (Tables 5, 6, and 7). Summarized surface chlorophyll a levels at stations located through thereservoir failed to identify conclusive trends (Figure 33). Chlorophyll a levels in water leavingthe reservoir were typically higher than chlorophyll a levels entering the reservoir, indicating anet production of algae in the water column as it passes through the reservoir (Figure 34).
4.4.8. Zooplankton
Because of leakage and damage of samples during shipping, zooplankton data are onlyavailable for August 30, and October 20 in 1994, and April 17, June 22, August 24, and October24 in 1995. Zooplankton numbers were very low at all sites except the two Bruneau Arm sites(RM 2 and 4.3), and the two downstream Snake River Arm sites (RM 494.5 and 495.3)(Figure

C.J. Strike Limnology Survey
Idaho Power Company Page 15
35). Summer zooplankton numbers were comparable at those four sites. During spring and fall,the Bruneau Arm sites had notably higher zooplankton densities that the Snake River Arm sites.The Bruneau Arm sites appeared to have slightly higher zooplankton densities at shallow depthsduring summer, although this result is highly speculative given the paucity of data (Figures 36and 37). In the Snake River Arm, shallow samples generally contained the most organisms inAugust, while densities were highest in the deep samples in April and October (Figures 38 and39).
5. Discussion
Our study showed that water quality in C.J. Strike Reservoir is likely not adequate to fullysupport all designated beneficial uses. Specifically, dissolved oxygen, ammonia nitrogen, watertemperature, and nutrient (and resulting algae) levels were at problematic levels during sometimes of our sampling. The low dissolved oxygen levels and high ammonia nitrogen in thereservoir result from lack of mixing because of reduced water velocity and increased water depth.The elevated ammonia levels are directly attributable to the low dissolved oxygen conditions.Under anoxic conditions, oxidized nitrogen forms are reduced to ammonia. Without low oxygenlevels, ammonia levels would not be problematic.
The 1996 Idaho 303(d) list identified C.J.Strike Reservoir as water quality limitedbecause of sediment. EPA (1986) identifies four potential ways that suspended solids may affectfish. Suspended solids may act directly on fish in the water column by killing them; by reducinggrowth rates or resistance to disease, etc.; by preventing development of fish eggs or larvae; bymodifying movement or migrations; or by reducing food abundance. Since sediment levels wemeasured should be well below toxic thresholds for aquatic biota, we speculate that the primarypotential for effects of suspended solids at concentrations found in the study area are related tothe settling of material from the water column. Settling of fine sediments could affect benthicmacroinvertebrate communities and reduce oxygen levels in the water column.
Water temperatures were problematic upstream of, within, and downstream of theimpoundment; and are not directly attributable to project operations. Our study showed that thewarming of water as it passes through the reservoir is consistent with upstream warming as waterflows through unimpounded reaches of the river. Likewise, Irving and Cuplin (1956) concludedthat temperature changes from construction of the hydroelectric project were so small that therewas “little effect” on the fishery. Our characterization of the thermal profile within the reservoiris also very similar to what Irving and Cuplin’s (1956) finding that no definite, strongthermocline existed in the reservoir. However, they did note a 7°C change in water temperaturefrom the top to the bottom of the water column.
Algae levels in water entering the reservoir were very similar to levels leaving thereservoir. Surface films caused by blue-green algal blooms were noted during our study,primarily in the Bruneau Pool area of the reservoir. Determining with certainty that algae ornutrient levels are problematic is not possible because problems associated with nutrient levels

C.J. Strike Limnology Survey
Idaho Power Company Page 16
are typically expressed as excessive or nuisance growths of aquatic plants. “Nuisance” and“excessive growth” are hard to define and vary considerably depending on the resource or user.Our study indicated that phytoplankton levels in the reservoir were within the range to raiseconcerns about potential negative effects on beneficial uses of the reservoir. Whether the levelsof algae are in fact impairing beneficial uses is beyond the scope of our study.
C.J. Strike Reservoir is clearly a settling basin for suspended sediment and organicmaterial transported into the reservoir by the upstream river. Our bathymetry, turbidity, Secchi,total suspended solids, and nutrient data all support this conclusion. Irving and Cuplin (1956)also concluded that the reservoir was acting as a settling basin. They hypothesized benefits to thefishery as a result of lower downstream turbidity and enhanced algae production (as a foodsource) within the reservoir. Our data indicate that effects such as low dissolved oxygen andhigh ammonia nitrogen levels are degrading habitat conditions in the reservoir, in part because ofthe settling of material within the reservoir.
Nutrient levels were typically lowered by water passing through the reservoir, resulting indiminished nutrient loads leaving the project than entering. Our data indicate that the loss ofnutrients in the water column is a result of particles settling as water slows within the reservoir.Biological and chemical processes in the reservoir that result in internal recycling orresuspension of nutrients into the water column are not occurring at levels high enough to offsetthe nutrient loss through settling. This conclusion is supported by our data showing thatdissolved orthophosphate and nitrate nitrogen are retained in the reservoir similar to totalphosphorus.
Water-quality problems in C.J. Strike Reservoir are related to the quality of inflowingwater and the processing of pollutants transported into the reservoir. Activities that decrease thelevels of pollutants entering the reservoir should result in improved conditions within thereservoir. Likewise, activities that reduce the amount of pollutant processing occurring in thereservoir should improve water quality in the reservoir, although consideration should be givento downstream effects of flushing pollutants downstream for processing.
Our study provides a good baseline for determining what water-quality problems areoccurring in the reservoir and providing insight into causal factors. Potential actions to improvewater quality in the reservoir should consider the interrelated nature of water-quality issues inC.J. Strike Reservoir, as well as the project-specific aspects. The relative consistency of our datawith data collected since 1956 indicates subtle or no changes in water-quality parameters such astemperature over the past 40 years. The long-term stability of water-quality conditions should beconsidered in developing future goals and expectations for C.J. Strike Reservoir.
C.J. Strike Limnology Survey
Idaho Power Company Page 17
6. Literature Cited
Alchem Laboratory. 1991. Quality assurance/quality control manual: inorganic analysis. AlchemLaboratory, Boise, ID.
[APHA] American Public Health Association. 1989. Standard methods for the examination ofwater and wastewater. 17th edition. APHA, American Water Works Association, EaterPollution Control Federation. Washington, D.C.
Bauer, S. B. 1986. Pilot study of quality assurance sample procedures 1986. Idaho Department ofHealth and Welfare–Division of Environmental Quality, Boise. 16 p.
Brennan, T. S., A. K. Lehmann, I. O’Dell, A. M. Tungate. 1996a. Water resources data—Idaho,water year 1995. Volume 1, Upper Columbia River Basin and Snake River Basin above KingHill. U.S. Geological Survey, Water Resources Division, Boise, ID. 357 p.
Brennan, T. S., A. K. Lehmann, I. O’Dell, A. M. Tungate. 1996b. Water resources data—Idaho,water year 1995. Volume 2, Upper Columbia River Basin and Snake River Basin below KingHill. U.S. Geological Survey, Water Resources Division, Boise, ID. 357 p.
Brink, S. R., B. Reingold, J. A. Chandler, C. Randolph. 1997. Fish community and habitatinventory in C.J. Strike Reservoir, Snake River. Idaho Power, Boise.
Caldwell, M. M. 1985. Cold desert. In: B. F. Chabot, H. A. Mooney, editors. Physiologicalecology of North American plant communities. Chapman and Hall, New York. p. 108–212.
Cole, N. K. 1997. Cover type map and vegetation classification of the C.J. Strike Study Area,southern Idaho. In: License Application for the C.J. Strike Hydroelectric Project. Volume 3.Technical Report E.3.3-A. Idaho Power, Boise.
Dillon, J. C. 1991. Job performance report. Idaho Department of Fish and Game, Boise. ProjectF-73-R-13. 58 p.
Dillon, J. C. 1992. Job performance report. Idaho Department of Fish and Game, Boise. ProjectF-73-R-14. 79 p.
[EPA] Environmental Protection Agency. 1983. Methods for chemical analysis of water andwastes. EPA, Cincinnati, OH. EPA-600/4-79-020. 521 p.
[EPA] Environmental Protection Agency. Quality criteria for water, 1986. EPA, Washington,D.C. EPA-404/5-86-001.
[FERC] Federal Energy Regulatory Commission. 1990. Final environmental impact statement forMilner (FERC No. 2899), FERC No. 18), Auger Falls (FERC No. 4797), and Star Falls(FERC No. 5797) Hydroelectric Projects, Idaho. FERC, Washington, D.C.

C.J. Strike Limnology Survey
Idaho Power Company Page 18
Franklin, J. F., C. T. Dyrness. 1988. Natural vegetation of Oregon and Washington. Oregon StateUniversity Press, Corvallis. 452 p.
[IDHW–DEQ] Idaho Department of Health and Welfare–Division of Environmental Quality.1989. Idaho water quality status report and nonpoint source assessment. IDHW–DEQ, Boise.236 p.
[IDHW–DEQ] Idaho Department of Health and Welfare–Division of Environmental Quality.1992. Idaho water quality status report. IDHW–DEQ, Boise. 69 p.
[IDHW–DEQ] Idaho Department of Health and Welfare–Division of Environmental Quality.1994. Idaho water quality standards and wastewater treatment requirements. IDHW–DEQ,Boise. 65 p.
[IPC] Idaho Power Company. 1993. Formal consultation package for relicensing, C.J. StrikeHydroelectric Project (FERC No. 2055). IPC, Boise. 367 p.
Irving, R. B., P. Culpin. 1956. The effect of hydroelectric developments on fishery resources ofSnake River. Idaho Department of Fish and Game, Boise. 169 p.
Low. 1991. Water Fact Sheet. National water-quality assessment program-Upper Snake RiverBasin. Open-file report 91-165. U.S. Geological Survey, Department of Interior, Boise, ID.
Lund, J. W., G. C. Kipling, E. D. LeCren. 1958. The inverted microscope method of estimatingalgal numbers and the statistical basis of estimations of counting. Hydrobiologia 11:143–170.
Malde, H. E. 1991. Quaternary geology and structural history of the Snake River Plain, Idaho andOregon. In: R. B. Morrison, editor. The geology of North America. Volume K-2, Quaternarynonglacial geology, conterminous United States. Geological Society of America, Boulder,CO. p. 251–281.
McConnell, W. 1971. Limnology introduction. In: G. E. Hall, editor. Reservoir fisheries andlimnology. American Fisheries Society, Washington, D.C. p. 137.
Milligan, J. H., R. A. Lyman, C. M. Falter, E. E. Krumpe, J. E. Carlson. 1983. Classification ofIdaho’s freshwater lakes. University of Idaho, Idaho Water Resources Research Institute,Moscow. 67 p.
Myers, R., S. Pierce, C. Randolph. 1995. Descriptive limnological study of the Snake River,Idaho: Buhl to King Hill. Idaho Power, Boise. 56 p
Myers, R. and S.A. Pierce. 1996. Limnological survey of the Shoshone Falls HydroelectricProject. Idaho Power, Boise. 60 p.
Petts, G. E. 1984. Impounded rivers: perspectives for ecological management. J. Wiley, NewYork. 326 p.

C.J. Strike Limnology Survey
Idaho Power Company Page 19
Stacy, S. M. 1991. Legacy of light: a history of Idaho Power Company. Idaho Power, Boise.256 p.
Utermohol, H. 1958. Zur Vervollkomnung der quatitativen phyplankton methodix. Mitt. Int.Verein. Limnol. 9:1–38.
West, N. E. 1988. Intermountain deserts, shrub steppes, and woodlands. In: M. G. Barbour, W.D. Billings, editors. North American terrestrial vegetation. Cambridge University Press,Cambridge, England. p. 209–230.
Willen, E. 1976. A simplified method of phytoplankton counting. Br. Phycol. J. 11:265–278

C.J. Strike Limnology Survey
Idaho Power Company Page 20
Table 1. Field collection and laboratory analysis techniques (mdl = minimum detection limit)used to monitor water quality in C.J. Strike Reservoir, Snake River, Idaho, 1993–1995.
Variable MethodologyField Techniques Laboratory
Temperature Thermistor(Hydrolab Surveyor 3, Hydrolab Datasonde
3)
none
Dissolved Oxygen Polarographic membrane electrode (HydrolabSurveyor 3, Hydrolab Datasonde 3)
none
Conductivity 6-electrode cell (Hydrolab Surveyor 3)
none
pH Glass electrode (Hydrolab Surveyor 3)
none
Turbidity Direct grab Nephelometric (Hach Model 2100A or2100P)
Total Phosphate Direct grab EPA (1983): 365.2 (Colorimetric, AscorbicAcid) (mdl 0.01 mg/l)
Orthophosphate Direct grab EPA (1983): 365.2 (Colorimetric, AscorbicAcid) (mdl 0.01 mg/l)
Kjeldahl Nitrogen Probe
Direct grab EPA (1983): 351.4 (Potentiometric, IonSelective) (mdl 0.1 mg/l)
Ammonia Nitrogen Probe
Direct grab EPA (1983): 350.3 (Potentiometric/IonSelective) (mdl 0.05 mg/l)
Nitrate Nitrogen Direct grab EPA (1983): 300.0 (Ion Chromatography)(mdl 0.1 mg/l)
Total Dissolved Solids
Direct grab EPA (1983): 160.1 (Gravimetric, Dried @180 C)
Total Suspended Solids
Direct grab EPA (1983): 160.2 (Gravimetric, Dried @103–105 C)
Fecal coliform Direct grab
Chlorophyll a Direct grab APHA (1989): 10200.H (Spectrophotometric)
Phytoplankton Direct grab Inverted compound microscope Zooplankton Schindler-Patalis style trap Stereoscopic microscope

C.J. Strike Limnology Survey
Idaho Power Company Page 21
Table 2. Locations and times of sampling for temperature, dissolved oxygen, conductivity, pH,and turbidity in C.J. Strike Reservoir, 1993–1995.
River Mile 1993 1994 1995493.7 Jan. 18–Oct. 19
biweeklyMarch 10–Nov. 2
biweeklyMarch 23–Oct. 12
biweekly494.5 NA April 7–Oct. 20
biweeklyMarch 23–Oct. 12
biweekly495.3 May 5–Oct. 20
monthlyMarch 9–Nov. 2
biweeklyMarch 23–Oct. 12
biweekly498 NA March 9–Nov. 2
biweeklyMarch 23–Oct. 12
biweekly500 NA March 10–Nov. 2
biweeklyMarch 23–Oct. 12
biweekly502 NA March 10–Nov. 2
biweeklyMarch 23–Oct. 12
biweekly504 NA March 10–Nov. 2
biweeklyMarch 23–Oct. 12
biweekly506 NA March 10–Nov. 2
biweeklyMarch 23–Oct. 12
biweekly508 NA March 10–Nov. 2
biweeklyMarch 23–Oct. 12
biweekly510 NA March 10–Nov. 2
biweeklyMarch 23–Oct. 12
biweekly513 NA March 10–Nov. 2
biweeklyMarch 23–Oct. 12
biweekly525.3 March 26–Oct. 19
biweeklyMarch 9–Dec. 20
biweeklyJan. 5–Dec. 28
biweekly546.6 March 26–Oct. 19
biweeklyMarch 8–Dec. 20
biweeklyJan. 5–Dec. 28
biweekly
2.0 NA March 9–Nov. 2biweekly
March 23–Oct. 12biweekly
4.3 May 5–Oct. 20monthly
March 9–Nov 2biweekly
March 23–Oct 12biweekly
NA indicates no samples were taken

C.J. Strike Limnology Survey
Idaho Power Company Page 22
Table 3. Locations and times of sampling for total phosphorus, dissolved orthophosphate,nitrate nitrogen, total Kjeldahl nitrogen, and ammonia nitrogen in C.J. StrikeReservoir, 1993–1995.
River Mile 1993 1994 1995493.7 Feb. 10, March 26 March 9–Nov. 2
monthlyMarch 14–Dec. 12
monthly
494.5 NA April 7–Nov. 2monthly
March 23–Oct. 24monthly
495.3 May 5, July 15 March 9–Nov. 2monthly
March 23–Oct. 24monthly
500 NA March 10–Nov. 2monthly
March 23–Oct. 24monthly
504 NA March 10–Nov. 2monthly
March 23–Oct. 24monthly
508 NA March 10–Nov. 2monthly
March 23–Oct. 24monthly
513 Feb. 10, March 26 NA March 23–Oct. 24monthly
546.6 Feb. 10, March 26 Jan. 12–Dec. 20monthly
March 14–Dec. 12monthly
2.0 NA June 13–Nov. 2monthly
March 23–Oct. 24monthly
4.3 May 5, July 15, Oct.20
April 7–Nov. 2monthly
March 23–Oct 24monthly
NA indicates no samples were taken

C.J. Strike Limnology Survey
Idaho Power Company Page 23
Table 4. Locations and times of sampling for chlorophyll a in C.J. Strike Reservoir, 1993–1995.
River Mile 1993 1994 1995493.7 Feb. 10–Oct. 7
monthlyJan. 1–Nov. 2
biweeklyJan. 18–Sept. 28
biweekly
494.5 NA March 23–Nov. 2biweekly
March 23–Sept. 28biweekly
495.3 May 5–Oct. 7monthly
March 9–Nov. 2biweekly
March 3–Sept. 28biweekly
500 NA March 10–Nov. 2biweekly
March 22–Sept. 28biweekly
504 NA March 10–Nov. 2biweekly
March 23–Sept. 12biweekly
508 NA March 10–Nov. 2biweekly
March 23–Sept. 12biweekly
513 Feb. 10, March 26 NA April 3–Sept. 28biweekly
525.3 Feb. 10–Oct. 7monthly
Jan. 12–April 7monthly
NA
546.6 Feb. 10–Oct. 6biweekly
Jan. 12–Nov. 1monthly
Jan. 18–Sept. 21monthly
2.0 NA April 19–Nov. 2biweekly
March 23–Sept. 12biweekly
4.3 May 5–Oct. 7monthly
April 7–Nov. 2monthly
March 23–Sept. 28biweekly

C.J. Strike Limnology Survey
Idaho Power Company Page 24
Table 5. Ranges and means for 16 water–quality variables monitored in the Bruneau Arm ofC.J. Strike Reservoir, May 1993–October 1995.
Variable Sample Size(n)
Range Median
Temperature (°C) 379 6.1–26.1 18.5Dissolved Oxygen (mg/l) 342 0.3–15.0 7.9Conductivity (msiemens) 379 0.139–0.529 0.421pH 379 7.2–9.5 8.5Oxidation/Reduction Potential (mV) 379 82–384 258Turbidity (ntu) 315 2.3–211 11.6Secchi Depth (m) 65 0.4–2.6 1.0Total Phosphorus (mg/l) 23 0.04–0.58 0.08Orthophosphate (mg/l) 23 <0.01–0.06 0.02Kjeldahl Nitrogen (mg/l) 23 0.32–6.56 0.56Ammonia Nitrogen (mg/l) 23 <0.05–1.01 <0.05Nitrate Nitrogen (mg/l) 23 <0.10–0.79 0.31Total Dissolved Solids (mg/l) 16 158–350 264Total Suspended Solids (mg/l) 22 4 –54 10Chlorphyll a (µg/l) 80 1–165 32

C.J. Strike Limnology Survey
Idaho Power Company Page 25
Table 6. Ranges and means for 16 water-quality variables monitored in the Snake River Armof C.J. Strike Reservoir May 1993–October 1995.
Variable Sample Size(n)
Range Median
Temperature (°C) 1805 4.0–24.9 16.9Dissolved Oxygen (mg/l) 1699 0.1–15.8 9.0Conductivity (msiemens) 1805 0.182–0.542 0.481pH 1805 7.3–9.0 8.4Oxidation/Reduction Potential (mV) 1805 –96–455 261Turbidity (ntu) 1456 2.4–226 16.5Secchi Depth (m) 261 0.2–2.7 0.8Total Phosphorus (mg/l) 198 0.03–0.58 0.12Orthophosphate (mg/l) 198 <0.01–0.43 0.04Kjeldahl Nitrogen (mg/l) 198 <0.10–2.05 0.0.40Ammonia Nitrogen (mg/l) 198 <0.05–1.53 <0.05Nitrate Nitrogen (mg/l) 198 <0.10–1.77 1.02Total Dissolved Solids (mg/l) 114 250–375 317Total Suspended Solids (mg/l) 186 <1–77 10Chlorphyll a (µg/l) 521 <1–131 19

C.J. Strike Limnology Survey
Idaho Power Company Page 26
Table 7. Ranges and means for 16 water-quality variables monitored in the tailwater of C.J.Strike Reservoir, May 1993–October 1995.
Variable Sample Size(n)
Range Median
Temperature (°C) 131608 3.5–24.8 12.7Dissolved Oxygen (mg/l) 131092 3.5–15.7 9.8Conductivity (msiemens) 131607 0.220–0.710 0.473pH 92 7.9–8.9 8.4Oxidation/Reduction Potential (mV) 92 195–403 296Turbidity 72 3.0–24.4 7.1Secchi Depth (m) 0 NA NATotal Phosphorus (mg/l) 25 0.05–0.28 0.10Orthophosphate (mg/l) 25 <0.01–0.3 0.03Kjeldahl Nitrogen (mg/l) 25 <0.10–0.84 0.50Ammonia Nitrogen (mg/l) 25 <0.05–0.23 0.06Nitrate Nitrogen (mg/l) 25 0.44–1.45 1.06Total Dissolved Solids (mg/l) 12 267–360 306Total Suspended Solids (mg/l) 21 <1–22 8Chlorphyll a (µg/l) 52 <1–64 14

C.J. Strike Limnology Survey
Idaho Power Company Page 27
Table 8. Morphologic data for C.J. Strike Reservoir.
Snake River Arm Bruneau Arm Entire ReservoirPool Elevation
(ft msl)2455 2450 2455 2450 2455 2450
Surface Area(acres)
5480 4416 2164 1828 7650 6240
Total Volume(acre-feet)
180,935 148,525 45,879 36,048 226,800 184,573
Active Storage(acre-feet)
32,410 0 9831 0 44,077 0
Mean Depth(feet)
33 34 21 20 29.6 29.6
Maximum Depth(feet)
139 134 74 69 139 134
Littoral Area(acres)
1533 NA 550 NA 1997 1446
Littoral Volume(acre-feet)
45,030 NA 18,436 NA 60,147 44,077

C.J. Strike Limnology Survey
Idaho Power Company Page 28
Table 9. Summary table of maximum changes in water-column temperature (°C) on individualsampling dates at nine sampling locations throughout C.J. Strike Reservoir.
River Mile 1993 1994 19954.3 3.6 5.7 5.8
494.5 9.4 7.5495.3 4.6 8.8 7.1498 8.5 6.8500 7.5 6.4502 7.7 3.4504 5.4 1.6506 1.8 1.6508 2.1 1.2

C.J. Strike Limnology Survey
Idaho Power Company Page 29
Table 10. Summary results for field duplicate and spike samples collected as part of theQA/QC program. Summary statistics are based on Bauer (1986).
FIELD DUPLICATES N MaximumRange
Mean Range Relative Range
Total Phosphorus 33 0.06 <0.01 7.3Dissolved Orthophosphate 26 0.02 0.01 7.3
Nitrate Nitrogen 33 0.09 0.03 3.2Ammonia Nitrogen 8 0.06 0.01 6.4
Total Kjeldahl Nitrogen 29 0.14 0.05 14.3
FIELD SPIKES N Mean 95% C.I.Total Phosphorus 33 102.9 100.5–105.3
Dissolved Orthophosphate 26 101.0 99.0–103.0Nitrate Nitrogen 33 93.4 90.5–96.3
Ammonia Nitrogen 11 98.6 97.1–100.1Total Kjeldahl Nitrogen 31 101.0 98.0–104.0

C.J. Strike Limnology Survey
Idaho Power Company Page 30
Table 11. Phytoplankton species list for samples collected in the Snake River Arm andBruneau Arm of C.J. Strike Reservoir.
DIVISION SPECIES BRUNEAU Arm SNAKE Arm
Chlorophyta Actinastrum hantzschii *Chlorophyta Ankistrodesmus falcatus * *Chlorophyta Ankistrodesmus falcatus var. mirabilis * *Chlorophyta Carteria sp. * *Chlorophyta Chlamydomonas sp. * *Chlorophyta Chorella sp. *Chlorophyta Closteriopsis longissima *Chlorophyta Closterium sp. *Chlorophyta Cosmarium regnesi * *Chlorophyta Cosmarium sp. *Chlorophyta Crucigenia tetrapedia * *Chlorophyta Kirchneriella subsalsa *Chlorophyta Lagerheimia subsalsa *Chlorophyta Oocystis solitaria * *Chlorophyta Oocystis sp. * *Chlorophyta Pandorina morum *Chlorophyta Pediastrum duplex * *Chlorophyta Scenedismus bijuga *Chlorophyta Scenedesmus dimorphus * *Chlorophyta Scenedesmus quadricauda * *Chlorophyta Scenedesmus serratus *Chlorophyta Schroederia setigera * *Chlorophyta Sphaerocystis Schroeteri * *Chlorophyta Tetraedron caudatum *Chlorophyta Tetraedron minimum *Chrysophyta Asterionella foRMosa * *Chrysophyta Cocconeis sp. * *Chrysophyta Cyclotella sp. * *Chrysophyta Cymatopleura sp. * *Chrysophyta Cymbella sp. *Chrysophyta Diatoma sp. *Chrysophyta Dinobryon sertularia * *Chrysophyta Fragilaria construens *Chrysophyta Fragilaria crotonensis * *Chrysophyta Fragilaria sp. *Chrysophyta Gomphonema sp. * *Chrysophyta Gyrosigma sp. *Chrysophyta Mallomonas sp. *Chrysophyta Melosira granulata * *Chrysophyta Melosira granulata var. angustissima * *Chrysophyta Navicula sp. *Chrysophyta Nitzschia sp. * *Chrysophyta Pennate diatom * *Chrysophyta Pinnularia sp. *Chrysophyta Roicosphenia sp. *Chrysophyta Stephanodiscus hantzschii * *Chrysophyta Stephanodiscus niagarae * *Chrysophyta Surirella sp. *Chrysophyta Synedra sp. * *Chrysophyta Synedra ulna * *Cryptophyta Cryptomonas ovata * *Cryptophyta Cryptomonas reflexa * *Cryptophyta Rhodomonas minuta var. nannoplanktica * *Cyanophyta Anabaena flos-aquae * *Cyanophyta Anabaena spiroides * *Cyanophyta Aphanizomenon flos-aquae * *Cyanophyta Chroococcus dispersus var. minor * *Cyanophyta Marssoneilla elegans *Cyanophyta Merismopedia tanuissima * *Cyanophyta Microcystis aeruginosa colonies * *Cyanophyta Oscillatoria geminata * *Cyanophyta Oscillatoria limnetica * *
Euglenophyta Phacus sp. *Euglenophyta Trachelomonas sp. *
Pyrrophyta Certatium hiundinella * *Pyrrophyta Glenodinium sp. * *Pyrrophyta Peridinium sp. *

C.J. Strike Limnology Survey
Idaho Power Company Page 31
Table 12. Zooplankton species list for samples collected in the Snake River Arm and BruneauArm of C.J. Strike Reservoir.
ORDER SPECIES BRUNEAUArm
SNAKEArm
Cladocera Alona guttata *Alona sp. *
Bosmina longirostris * *Chydorus sphaericus * *
Camptocercus rectirostris *Ceriodaphnia quadrangula * *
Daphnia pulex * *Daphnia retrocurva * *
Daphnia rosea *Daphnia thorata * *
Daphnia sp. *Diaphanosoma brachyurum * *
Eurycercus lamellatus *Leptodora kindtii * *Macrothricid sp. *
Macrothrix laticornis *Polyphemus pediculus *
Sida sp. *Simocephalus laticornis *
Copepoda Cyclops bicuspidatus thomasi * *Cyclops vernalis * *
Cyclops sp. * *Diaptomus sp. * *
Harpacticoid sp. * *Mesocyclops edax * *
Rotidera Asplancha sp. * *Brachionus sp. *
Filinia sp. * *Kellicottia sp. *
Keratella coclearis * *Keratella sp. * *
Polyarthra sp. * *Unknown * *
Volvocida Volvox sp. *Hydracarina *

C.J. Strike Limnology Survey
Idaho Power Company Page 32
This page left blank intentionally


C.J. Strike Limnology Survey
Idaho Power Company Page 34
C.J
. ST
RIK
E
DA
M
RM
4.3
HIG
HW
AY
51
LO
VE
RID
GE
BR
IDG
E
RM
500
HIG
HW
AY
78
IND
IAN
CO
VE
BR
IDG
E
RM
506
US
GS
GA
GE
(RM
493
.7)
RM
2
RM
498
RM
49
5.3
RM
49
4.5
(RM
513
)(R
M 5
25.3
)
SNAKE RIV
ER ARM
BRUNEAU ARM
RM
508 R
M 5
10
RM
504
RM
502
Figure 2. Schematic depiction of the locations of sampling sites monitored in C.J. StrikeReservoir.

C.J. Strike Limnology Survey
Idaho Power Company Page 35
Dis
solv
ed O
xyge
n (m
g/l)
0
2
4
6
8
10
12
14
0
2
4
6
8
10
12
14
0
2
4
6
8
10
12
14
Dai
ly M
inim
um (
mg/
l)7-
Day
Mea
n M
inim
um (
mg/
l)30
-Day
Mea
n (
mg/
l)
Jan. 1, 1993 Jan. 1, 1994 Jan. 1, 1995 Jan. 1, 1996
Jan. 1, 1993 Jan. 1, 1994 Jan. 1, 1995 Jan. 1, 1996
Jan. 1, 1993 Jan. 1, 1994 Jan. 1, 1995 Jan. 1, 1996
Idaho Standard 6.0 mg/l
Idaho Standard 4.7 mg/l
Idaho Standard 3.5 mg/l
Figure 3. Dissolved oxygen levels in water discharged from the C.J. Strike Project relative tothe Idaho State Standard.

C.J. Strike Limnology Survey
Idaho Power Company Page 36
Tailwater
Snake Arm
Bruneau Arm
0 50 100 150 2000
20
40
60
80
100
Chlorophyll a (ug/l)
% F
requ
ency
of E
xcee
denc
e
Figure 4. Percent exceedence curves for chlorophyll a levels in the Bruneau Arm, the SnakeRiver Arm, and the tailwaters of the C.J. Strike Project.

C.J. Strike Limnology Survey
Idaho Power Company Page 37
0 20 40 60 80 1000
20
40
60
80
100
Total Suspended Solids (mg/l)
% F
requ
ency
of E
xcee
denc
e
Tailwater
Snake Arm
Bruneau Arm
Figure 5. Percent exceedence curves for total suspended solids levels in the Bruneau Arm, theSnake River Arm, and the tailwaters of the C.J. Strike Project.

C.J. Strike Limnology Survey
Idaho Power Company Page 38
Tailwater
Snake Arm
Bruneau Arm
0 0.1 0.2 0.3 0.4 0.50
20
40
60
80
100
Dissolved Orthophosphate (mg/l)
% F
requ
ency
of E
xcee
denc
e
Tailwater
Snake Arm
Bruneau Arm
0 0.1 0.2 0.3 0.4 0.5 0.6 0.70
20
40
60
80
100
Total Phosphorus (mg/l)
% F
requ
ency
of E
xcee
denc
e
Figure 6. Percent exceedence curves for total phosphorus and dissolved orthophosphate in theBruneau Arm, the Snake River Arm, and the tailwaters of the C.J. Strike Project.

C.J. Strike Limnology Survey
Idaho Power Company Page 39
0
5
10
15
20
25
July 20 1993
Feb. 41994
Aug. 221994
March 111995
Sept. 271995
0
5
10
15
20
25
Wat
er T
empe
ratu
re (
C)
Dai
ly M
axim
um
Dai
ly M
ean
July 20 1993
Feb. 41994
Aug. 221994
March 111995
Sept. 271995
Idaho Standard (22)
Idaho Standard (18)
Figure 7. Daily maximum and daily mean water temperatures for water discharged from theC.J. Strike Project during 1993–1995.

C.J. Strike Limnology Survey
Idaho Power Company Page 40
5,000
10,000
15,000
20,000
25,000
30,000
35,000
40,000
5
10
15
20
25
Reservoir Outflow (cfs)
Ret
entio
n T
ime
(day
s)
Figure 8. Retention time estimates for C.J. Strike Reservoir at full pool (solid line) andminimum pool (dashed line) over a range of flows.

C.J. Strike Limnology Survey
Idaho Power Company Page 41
MAY 1994
494.00 496.00 498.00 500.00 502.00 504.00 506.00 508.00 510.00 512.00-30.00
-20.00
-10.00
0.00
JUNE 1994
494.00 496.00 498.00 500.00 502.00 504.00 506.00 508.00 510.00 512.00-30.00
-20.00
-10.00
0.00
MARCH 1994
494.00 496.00 498.00 500.00 502.00 504.00 506.00 508.00 510.00 512.00-30.00
-20.00
-10.00
0.00
APRIL 1994
494.00 496.00 498.00 500.00 502.00 504.00 506.00 508.00 510.00 512.00-30.00
-20.00
-10.00
0.00
494.00
DE
PT
H (
M)
DE
PT
H (
M)
DE
PT
H (
M)
DE
PT
H (
M)
RIVER MILE
Figure 9. Water temperature isopleths for C.J. Strike Reservoir, March–June 1994.
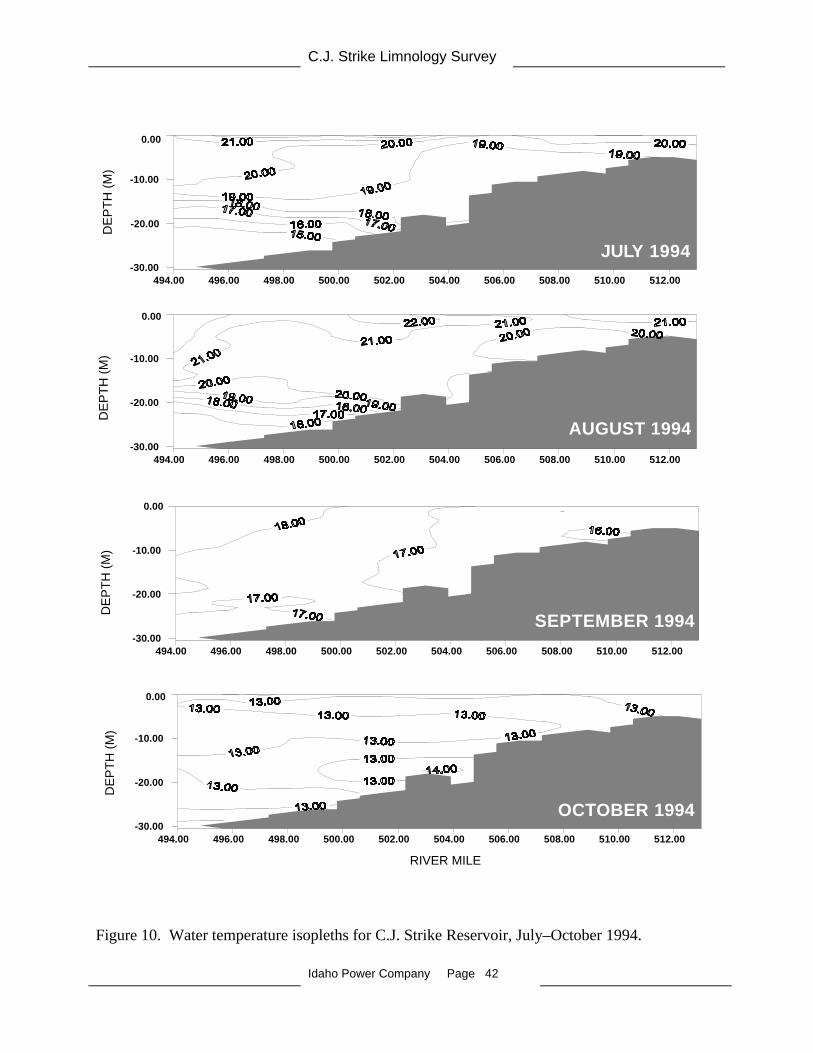
C.J. Strike Limnology Survey
Idaho Power Company Page 42
494.00 496.00 498.00 500.00 502.00 504.00 506.00 508.00 510.00 512.00-30.00
-20.00
-10.00
0.00
494.00 496.00 498.00 500.00 502.00 504.00 506.00 508.00 510.00 512.00-30.00
-20.00
-10.00
0.00
494.00 496.00 498.00 500.00 502.00 504.00 506.00 508.00 510.00 512.00-30.00
-20.00
-10.00
0.00
494.00 496.00 498.00 500.00 502.00 504.00 506.00 508.00 510.00 512.00-30.00
-20.00
-10.00
0.00
JULY 1994
AUGUST 1994
SEPTEMBER 1994
OCTOBER 1994
DE
PT
H (
M)
DE
PT
H (
M)
DE
PT
H (
M)
DE
PT
H (
M)
RIVER MILE
Figure 10. Water temperature isopleths for C.J. Strike Reservoir, July–October 1994.

C.J. Strike Limnology Survey
Idaho Power Company Page 43
494.00 496.00 498.00 500.00 502.00 504.00 506.00 508.00 510.00 512.00-30.00
-20.00
-10.00
0.00
APRIL 1995
494.00 496.00 498.00 500.00 502.00 504.00 506.00 508.00 510.00 512.00-30.00
-20.00
-10.00
0.00
MAY 1995
494.00 496.00 498.00 500.00 502.00 504.00 506.00 508.00 510.00 512.00-30.00
-20.00
-10.00
0.00
JUNE 1995
494.00 496.00 498.00 500.00 502.00 504.00 506.00 508.00 510.00 512.00-30.00
-20.00
-10.00
0.00
MARCH 1995
DE
PT
H (
M)
DE
PT
H (
M)
DE
PT
H (
M)
DE
PT
H (
M)
RIVER MILE
Figure 11. Water temperature isopleths for C.J. Strike Reservoir, March–June 1995.

C.J. Strike Limnology Survey
Idaho Power Company Page 44
0.00
494.00 496.00 498.00 500.00 502.00 504.00 506.00 508.00 510.00 512.00-30.00
-20.00
-10.00
0.00
JULY 1995
494.00 496.00 498.00 500.00 502.00 504.00 506.00 508.00 510.00 512.00-30.00
-20.00
-10.00
0.00
AUGUST 1995
494.00 496.00 498.00 500.00 502.00 504.00 506.00 508.00 510.00 512.00-30.00
-20.00
-10.00
SEPTEMBER 1995
494.00 496.00 498.00 500.00 502.00 504.00 506.00 508.00 510.00 512.00-30.00
-20.00
-10.00
0.00
OCTOBER 1995
DE
PT
H (
M)
DE
PT
H (
M)
DE
PT
H (
M)
DE
PT
H (
M)
RIVER MILE
Figure 12. Water temperature isopleths for C.J. Strike Reservoir, July–October 1995.

C.J. Strike Limnology Survey
Idaho Power Company Page 45
Max
imum
Dai
ly W
ater
Tem
pera
ture
(C
)
5
10
15
20
25
CJ Strike Tailwater
Indian Cove
Bliss Tailwater
June1994
June1995
Dec.1994
Dec.1995
Figure 13. Maximum daily water temperature at three locations in the Snake River from BlissDam downstream to C.J. Strike Dam, 1994 and 1995.

C.J. Strike Limnology Survey
Idaho Power Company Page 46
0
1
2
3
4
Indian Cove
CJ Strike Tailwater
Dai
ly W
ater
Tem
pera
ture
Flu
ctua
tion
(C)
June1994
June1995
Dec.1994
Dec.1995
Figure 14. Diel water-temperature fluctuations of water entering C.J. Strike Reservoir at IndianCove (RM 525.3) and water leaving the reservoir (RM 493.7), 1994 and 1995.

C.J. Strike Limnology Survey
Idaho Power Company Page 47
494.00 496.00 498.00 500.00 502.00 504.00 506.00 508.00 510.00 512.00
MARCH 1994-30.00
-20.00
-10.00
0.00
494.00 496.00 498.00 500.00 502.00 504.00 506.00 508.00 510.00 512.00
APRIL 1994-30.00
-20.00
-10.00
0.00
494.00 496.00 498.00 500.00 502.00 504.00 506.00 508.00 510.00 512.00
MAY 1994-30.00
-20.00
-10.00
0.00
494.00 496.00 498.00 500.00 502.00 504.00 506.00 508.00 510.00 512.00
JUNE 1994-30.00
-20.00
-10.00
0.00
DE
PT
H (
M)
DE
PT
H (
M)
DE
PT
H (
M)
DE
PT
H (
M)
RIVER MILE
Figure 15. Dissolved oxygen isopleths for C.J. Strike Reservoir, March–June 1994.

C.J. Strike Limnology Survey
Idaho Power Company Page 48
494.00 496.00 498.00 500.00 502.00 504.00 506.00 508.00 510.00 512.00
JULY 1994-30.00
-20.00
-10.00
0.00
494.00 496.00 498.00 500.00 502.00 504.00 506.00 508.00 510.00 512.00
AUGUST 1994-30.00
-20.00
-10.00
0.00
494.00 496.00 498.00 500.00 502.00 504.00 506.00 508.00 510.00 512.00
SEPTEMBER 1994-30.00
-20.00
-10.00
0.00
494.00 496.00 498.00 500.00 502.00 504.00 506.00 508.00 510.00 512.00
OCTOBER 1994-30.00
-20.00
-10.00
0.00
DE
PT
H (
M)
DE
PT
H (
M)
DE
PT
H (
M)
DE
PT
H (
M)
RIVER MILE
Figure 16. Dissolved oxygen isopleths for C.J. Strike Reservoir, July–October 1994.

C.J. Strike Limnology Survey
Idaho Power Company Page 49
494.00 496.00 498.00 500.00 502.00 504.00 506.00 508.00 510.00 512.00-30.00
-20.00
-10.00
0.00
494.00 496.00 498.00 500.00 502.00 504.00 506.00 508.00 510.00 512.00-30.00
-20.00
-10.00
0.00
494.00 496.00 498.00 500.00 502.00 504.00 506.00 508.00 510.00 512.00-30.00
-20.00
-10.00
0.00
494.00 496.00 498.00 500.00 502.00 504.00 506.00 508.00 510.00 512.00-30.00
-20.00
-10.00
0.00
DE
PT
H (
M)
DE
PT
H (
M)
DE
PT
H (
M)
DE
PT
H (
M)
RIVER MILE
MARCH 1995
APRIL 1995
MAY 1995
JUNE 1995
Figure 17. Dissolved oxygen isopleths for C.J. Strike Reservoir, March–June 1995.

C.J. Strike Limnology Survey
Idaho Power Company Page 50
494.00 496.00 498.00 500.00 502.00 504.00 506.00 508.00 510.00 512.00
July 1995-30.00
-20.00
-10.00
0.00
494.00 496.00 498.00 500.00 502.00 504.00 506.00 508.00 510.00 512.00
August 1995-30.00
-20.00
-10.00
0.00
494.00 496.00 498.00 500.00 502.00 504.00 506.00 508.00 510.00 512.00
September 1995-30.00
-20.00
-10.00
0.00
494.00 496.00 498.00 500.00 502.00 504.00 506.00 508.00 510.00 512.00
October 1995-30.00
-20.00
-10.00
0.00
DE
PT
H (
M)
DE
PT
H (
M)
DE
PT
H (
M)
DE
PT
H (
M)
RIVER MILE
Figure 18. Dissolved oxygen isopleths for C.J. Strike Reservoir, July–October 1995.

C.J. Strike Limnology Survey
Idaho Power Company Page 51
0
5,000
10,000
15,000
20,000
25,000
30,000
0
5,000
10,000
15,000
20,000
25,000
30,000
2192 2222 2252 2282 2312 2342 2372 2402 2432 24625,000
10,000
15,000
20,000
25,000
30,000
Dis
char
ge (
cfs)
1995
1994
1993
Jan. Feb. Mar. Apr. May June July Aug. Sep. Oct. Nov. Dec.
Figure 19. Hydrograph of Snake River flows leaving the C.J. Strike Project during 1993–1995.

C.J. Strike Limnology Survey
Idaho Power Company Page 52
4
6
8
10
12
14
4
6
8
10
12
14
Dis
solv
ed O
xyge
n (m
g/l)
Bliss Tailwater
Indian Cove
Daily minimums
CJ Tailwater
CJ TailwaterBliss Tailwater
Indian Cove
Daily means
June1994
June1995
Dec.1994
Dec.1995
June1994
June1995
Dec.1994
Dec.1995
Figure 20. Daily minimum and mean dissolved oxygen levels at three locations in the SnakeRiver from Bliss Dam downstream to C.J. Strike Dam, 1994 and 1995.
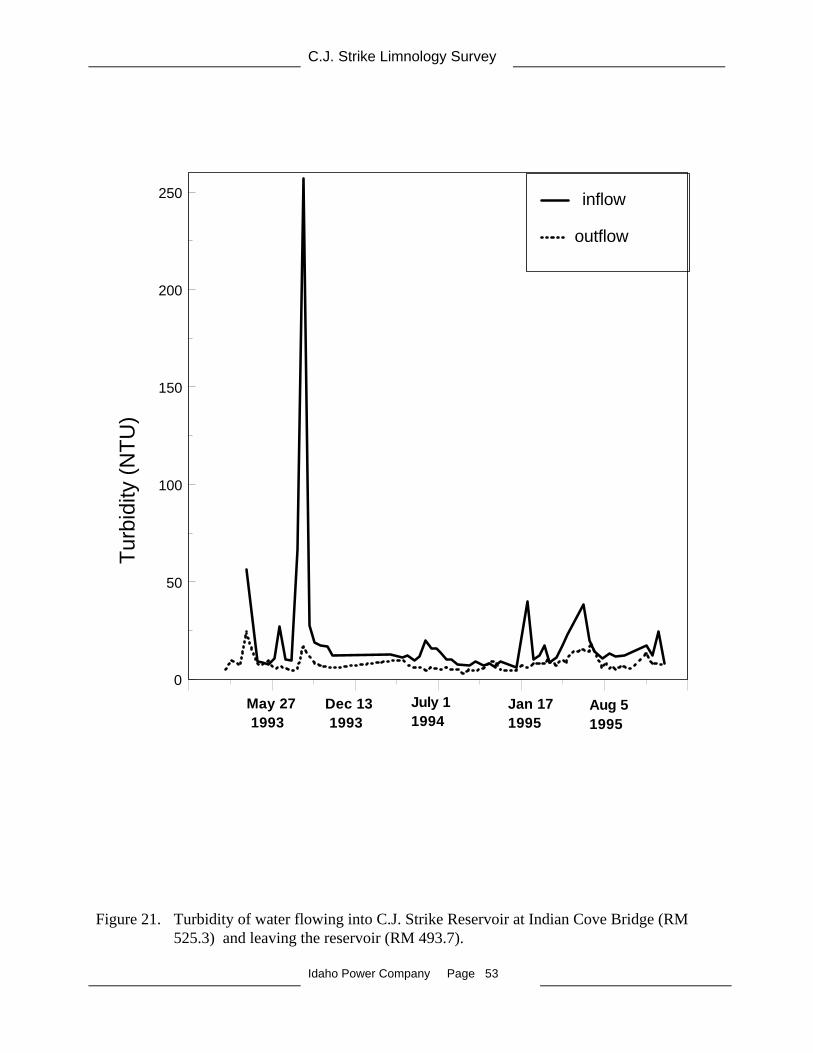
C.J. Strike Limnology Survey
Idaho Power Company Page 53
May 27 1993
Dec 13 1993
July 11994
Jan 171995
Aug 51995
0
50
100
150
200
250
Tur
bidi
ty (
NT
U)
inflow
outflow
Figure 21. Turbidity of water flowing into C.J. Strike Reservoir at Indian Cove Bridge (RM525.3) and leaving the reservoir (RM 493.7).

C.J. Strike Limnology Survey
Idaho Power Company Page 54
4.3 2 494.5 495.3 498 500 502 504 506 508 5100.4
0.6
0.8
1
1.2
1.4
1.6
1.8
2
River Mile
Sec
chi D
epth
(m
)
Figure 22. Mean Secchi depth (solid dot) with 95% confidence limits (asterisk) measured at 11sites throughout the study area.

C.J. Strike Limnology Survey
Idaho Power Company Page 55
495.00 500.00 505.00 510.00 515.00 520.00 525.00
September 1994
-30.00
-25.00
-20.00
-15.00
-10.00
-5.00
495.00 500.00 505.00 510.00 515.00 520.00 525.00
July 1994
-30.00
-25.00
-20.00
-15.00
-10.00
-5.00
495.00 500.00 505.00 510.00 515.00 520.00 525.00
June 1994
-30.00
-25.00
-20.00
-15.00
-10.00
-5.00
495.00 500.00 505.00 510.00 515.00 520.00 525.00
October 1994
-30.00
-25.00
-20.00
-15.00
-10.00
-5.00
500.00 505.00 510.00 515.00 520.00 525.00
November 1994
-30.00
-25.00
-20.00
-15.00
-10.00
-5.00
Dep
th (
m)
RIVER MILE
Dep
th (
m)
Dep
th (
m)
RIVER MILE
10
1010 10
10
10
20
20
20
20
20 2030
3030
30
30
30
30
20
20
20
20
3030
30
30
30
30
30
40
40
40
40
20
20
20
20
20
20
10
10
10
10 10
August1994
495.00 500.00 505.00 510.00 515.00 520.00 525.00
-30.00
-25.00
-20.00
-15.00
-10.00
-5.00
10
10 10 1010
2020
20
20
20
20
20
30
30
30
30
20
40
10
10
10
20
20
2020
30
40
30
30
30
30
20
20 40
10
10
10
10
10
1010 10 10
10
20
3020
20
20
20
10
20
30
10 10 1010
20
20
Figure 23. Turbidity isopleths for C.J. Strike Reservoir for June–November, 1994.

C.J. Strike Limnology Survey
Idaho Power Company Page 56
March 1995
-30
-25
-20
-15
-10
-5
April 1995
-30
-25
-20
-15
-10
-5
May 1995
-25
-20
-15
-10
-5
June 1995
-25
-20
-15
-10
-5
0
July 1995
-25
-20
-15
-10
-5
495 500 505 510 515 520 525
September 1995
-30
-25
-20
-15
-10
-5
-30
-25
-20
-15
-10
-5
495 500 505 510 515 520 525-30
-25
-20
-15
-10
-5
October 1995
Dep
th (
m)
RIVER MILE
Dep
th (
m)
Dep
th (
m)
RIVER MILE
Dep
th (
m)
20
20
20
20
20
20
4040
40
40
6060
60
2020
20
20
20
20
20
40
40
40
40
40
60
60
20
20
20
20
20 20
20
20 40
40
40
40
40
40
40
40 404060
60
60
60
60
60
80
60
60
80
80
2020
20
20
20
20
20
20
4040
20
20
40
40
40
6060
40
40
40 20
60
60
60
60
60
60
60
40
40
40
40
40
80100
80
80
80
80
100
60 402020
20
20
20
20
20
20
20
20
40
40
40
40
40
40
4040
40
60
60
6060
60
80
80
80
80
80
40180
100
120 140
14060
60
2020
20
20
20
20
2020
20
202020
20
20
20
20
40
40
40
40
40
40
40
40
August1995
Figure 24. Turbidity isopleths for C.J. Strike Reservoir for March–October, 1995.

C.J. Strike Limnology Survey
Idaho Power Company Page 57
Oct 93 Feb 94 Jun 94 Oct 94 Feb 95 Jun 95
1,000
2,000
3,000
4,000
5,000
6,000T
otal
Pho
spho
rus
(kg/
day)
Oct 93 Feb 94 Jun 94 Oct 94 Feb 95 Jun 95
500
1,000
1,500
2,000
Dis
solv
ed O
rtho
phos
phat
e (k
g/da
y)
inflow
outflow
inflow
outflow
Figure 25. Total phosphorus and dissolved orthophosphate loads at King Hill (inflow) and inthe C.J. Strike Project tailrace (outflow), 1994 and 1995.

C.J. Strike Limnology Survey
Idaho Power Company Page 58
Oct 93
Feb 94
Jun 94
Oct 94
Feb 95
Jun 95
5,000
10,000
15,000
20,000
25,000
30,000
35,000
Nitr
ate
Nitr
ogen
(kg
/day
)
Oct 93
Feb 94
Jun 94
Oct 94
Feb 95
Jun 95
0
2,000
4,000
6,000
8,000
10,000
12,000
14,000
16,000
18,000
Tot
al K
jeld
ahl N
itrog
en (
kg/d
ay)
Oct 93
Feb 94
Jun 94
Oct 94
Feb 95
Jun 95
15,000
20,000
25,000
30,000
35,000
40,000
45,000
50,000
Tot
al K
jeld
ahl +
Nitr
ate
Nitr
ogen
(kg
/day
)
inflow
inflow
inflow
outflow
outflow
outflow
Figure 26. Nitrate nitrogen, total Kjeldahl nitrogen, and total nitrogen (defined as total Kjeldahland nitrate) loads at King Hill (inflow) and in the C.J. Strike Project tailrace(outflow), 1994 and1995.

C.J. Strike Limnology Survey
Idaho Power Company Page 59
496 498 500 502 504 506 508-24
-22
-20
-18
-16
-14
-12
-10
-8
-6
-4
-2
Total Phosphorus
June-Aug 1994
496 498 500 502 504 506 508
-24
-22
-20
-18
-16
-14
-12
-10
-8
-6
-4
-2
496 498 500 502 504 506 508
-24
-22
-20
-18
-16
-14
-12
-10
-8
-6
-4
-2
Dissolved OrthophosphateJune-Aug 1994
Particulate Phosphorus
June-Aug 1994
Dep
th (
m)
Dep
th (
m)
RIVER MILE
Dep
th (
m)
0.10
0.10
0.100.10
0.10
0.10
0.10
0.200.20
0.30
0.40
0.30
0.40
0.30
0.20 0.20
0.10
0.20
0.30
0.40
0.20
0.30
0.10
0.20
0.30
0.10 0.10
0.060.06
0.06
0.06
0.06
0.06
0.06
0.06
0.06
0.07
0.07
0.07
0.07
0.07
0.07
0.070.08
0.08
0.08
0.08
0.08
0.05
0.05
0.05
0.05
0.070.08
Figure 27. Isopleths for total phosphorus, dissolved orthophosphate, and particulate phosphorus(defined as the difference between total phosphorus and dissolved orthophosphate)for C.J. Strike Reservoir, based on time-averaged profile data for June–August,1994.

C.J. Strike Limnology Survey
Idaho Power Company Page 60
496 498 500 502 504 506 508
-24
-22
-20
-18
-16
-14
-12
-10
-8
-6
-4
-2
496 498 500 502 504 506 508
-24-22-20-18-16-14
-12
-10-8-6-4-2
496 498 500 502 504 506 508
-24
-22
-20
-18
-16
-14
-12
-10
-8
-6
-4
-2
Dep
th (
m)
Dep
th (
m)
RIVER MILE
Dep
th (
m)
Ammonia Nitrogen
June-Aug 1994
Total KjeldahlNitrogen
June-Aug 1994
NitrateNitrogen
June-Aug 1994
0.5
0.5
0.5
0.25
0.25
0.75
0.75
0.75
0.75
0.75
0.75
1.00
1.00
1.00
1.00
1.00
1.00
1.00
0.50
0.500.50
0.500.50
0.50
0.90
0.90
1.90
1.40
1.40
1.40
0.90
0.50
0.50
1.00
1.00
1.00
0.50
0.50
0.05
0.05
0.050.05
0.050.05
Figure 28. Isopleths for ammonia, total Kjeldahl, and nitrate nitrogen for C.J. Strike Reservoir,based on time-averaged profile data for June–August 1994.

C.J. Strike Limnology Survey
Idaho Power Company Page 61
Cel
l Bio
volu
me
(cub
ic m
illim
eter
s/l)
RIVER MILE
4.3 2.0 494.5 495.3 500.0 504.0 508.0 513.00
2
4
6
8
10
OtherCyanophytaChrysophyta
12
Cel
l Den
sity
(m
illio
ns/l)
4.3 2.0 494.5 495.3 500.0 504.0 508.0 513.00
2
4
6
8
10
12
14
16
Other
CyanophytaChrysophyta
Figure 29. Average cell densities and biovolume for major phytoplankton divisions at eightsampling locations sampled in 1994 and 1995 throughout the study area.

C.J. Strike Limnology Survey
Idaho Power Company Page 62
.3
5
10
15
25
0 2 4 6 8 10 12
Dep
th (
m)
Cell Density (million cells/l)
River Mile 494.5
.3
5
10
15
25
Dep
th (
m)
.3
5
10
15
25
0
Dep
th (
m)
Cell Biovolume(cubic millimeters/l)
.3
5
10
15
25
0
Dep
th (
m)
River Mile 495.3
River Mile 494.5
River Mile 495.3
Cell Density (million cells/l)0 2 4 6 8 10 12 14
2 4 6 8
Cell Biovolume(cubic millimeters/l)2 4 6
Other
Cyanophyta
Chrysophyta
Other
Cyanophyta
Chrysophyta
Other
Cyanophyta
Chrysophyta
Other
Cyanophyta
Chrysophyta
Figure 30. Average cell densities and biovolume for major phytoplankton divisions summarizedby depth at RM 494.5 and RM 495.3 based on samples collected in 1994 and 1995.

C.J. Strike Limnology Survey
Idaho Power Company Page 63
12
8
Chlorophyta Cryptophyta
6
.3
5
10
15
25
0 1 2 3 4 5
.3
5
0 2 4 6 8 10 12
.3
5
10
15
0 2 4 6 8 10
Cell Biovolume (cubic millimeters/l)
.3
5
10
15
25
0 2 4 6 8
Dep
th (
m)
Cell Density(million cells/l)
.3
5
0 2 4 6 8 10
Dep
th (
m)
.3
5
10
15
0 2 4 6
Dep
th (
m)
Dep
th (
m)
Dep
th (
m)
Dep
th (
m)
River Mile 500
River Mile 500
River Mile 504
River Mile 508
River Mile 504
River Mile 508
Other
Cyanophyta
Chrysophyta
Other
Cyanophyta
Chrysophyta
Other
Cyanophyta
Chrysophyta
Cell Biovolume (cubic millimeters/l) Cell Density(million cells/l)
Other
Cyanophyta
Chrysophyta
Cell Density(million cells/l)
Other
Cyanophyta
Chrysophyta
Cell Biovolume (cubic millimeters/l)
Figure 31. Average cell densities and biovolume for major phytoplankton divisions summarizedby depth at RM 500, 504, and 508 based on samples collected in 1994 and 1995.

C.J. Strike Limnology Survey
Idaho Power Company Page 64
Dep
th (
m)
.3
5
10
0 2 4 6 8
.3
5
10
0 5 10 15 20
Dep
th (
m)
.3
10
5
0 1 2 3 4 5 6
.3
5
10
0 5 10 15 20
Dep
th (
m)
Dep
th (
m)
River Mile 2 River Mile 2
River Mile 4.3River MIle 4.3
Other
Cyanophyta
Chrysophyta
Other
Cyanophyta
Chrysophyta
Other
Cyanophyta
Chrysophyta
Other
Cyanophyta
Chrysophyta
Cell Density(million cells/l)
Cell Density(million cells/l)
Cell Biovolume (cubic millimeters/l)
Cell Biovolume (cubic millimeters/l)
Figure 32. Average cell densities and biovolume for major phytoplankton divisions summarizedby depth at RM 2 and 4.3 in the Bruneau Arm of C.J. Strike Reservoir based onsamples collected in 1994 and 1995.

C.J. Strike Limnology Survey
Idaho Power Company Page 65
494 495 496 500 504 508 510 513
40
100
160
220
280
River Mile (Snake River Arm)
Chl
orop
hyll
a (u
g/l)
Figure 33. Box and whisker plot of chlorophyll a levels measured at eight sites along the lengthof C.J. Strike Reservoir during 1994 and 1995.

C.J. Strike Limnology Survey
Idaho Power Company Page 66
Feb. 101994
10
20
30
40
50
60
70
Chl
orop
hyll
a (u
g/l)
Feb. 101995
Feb. 101993
Oct. 11995
King Hill (RM 546.6))
tailrace (RM 493.7)
Figure 34. Summary plot of chlorophyll a levels measured in water at King Hill (RM 546.6) andin the tailrace of C.J. Strike Dam (RM 493.7), October 1993–September 1995.

C.J. Strike Limnology Survey
Idaho Power Company Page 67
4.3 2.0 494.5 495.3 500.0 504.0 508.00
100
200
300
400
April 17, 1995
4.3 2.0 494.5 495.3 500.0 504.0 508.00
100
200
300
400
Aug. 30 1994
4.3 2.0 494.5 495.3 500.0 504.0 508.00
100
200
300
400
Oct. 20, 1994
4.3 2.0 494.5 495.3 500.0 504.0 508.00
100
200
300
400
June 22, 1995
4.3 2.0 494.5 495.3 500.0 504.0 508.00
100
200
300
400
Aug. 24, 1995
4.3 2.0 494.5 495.3 500.0 504.0 508.00
100
200
300
400
Oct. 24, 1995
Cladocera
Copepoda
Rotifera
Cladocera
Copepoda
Rotifera
Cladocera
Copepoda
Rotifera
Cladocera
Copepoda
Rotifera
Cladocera
Copepoda
Rotifera
Cladocera
Copepoda
Rotifera
RIVER MILERIVER MILE
RIVER MILE RIVER MILE
RIVER MILE RIVER MILE
Cel
l Den
sity
(ce
lls/l)
Cel
l Den
sity
(ce
lls/l)
Cel
l Den
sity
(ce
lls/l)
Cel
l Den
sity
(ce
lls/l)
Cel
l Den
sity
(ce
lls/l)
Cel
l Den
sity
(ce
lls/l)
Figure 35. Cell densities for zooplankton divisions on six dates in 1994 and 1995 from samplescollected at depths of 5 meters or less at seven sites throughout C.J. Strike Reservoir.

C.J. Strike Limnology Survey
Idaho Power Company Page 68
April 17, 1995
Aug. 30 1994
Oct. 20, 1994
June 22, 1995
Aug. 24, 1995
Oct. 24, 1995
Cladocera
Copepoda
Rotifera
Cladocera
Copepoda
Rotifera
Cladocera
Copepoda
Rotifera
Cladocera
Copepoda
Rotifera
Cladocera
Copepoda
Rotifera
Cladocera
Copepoda
Rotifera
.3
5
15
0 50 100 150 200 250 300
Dep
th (
m)
Cell Density (cells/l)
.3
5
10
0 50 100 150 200 250 300
Dep
th (
m)
Cell Density (cells/l)
.3
5
10
0 50 100 150 200 250 300
Dep
th (
m)
Cell Density (cells/l)
.3
5
10
0 50 100 150 200 250 300
Dep
th (
m)
Cell Density (cells/l)
.3
5
10
0 50 100 150 200 250 300
Dep
th (
m)
Cell Density (cells/l)
.3
5
10
0 50 100 150 200 250 300
Dep
th (
m)
Cell Density (cells/l)
Figure 36. Zooplankton densities summarized by depth at RM 2 (Bruneau Arm) of C.J. StrikeReservoir on six sampling dates in 1994 and 1995.

C.J. Strike Limnology Survey
Idaho Power Company Page 69
.3
5
10
0 50 100 150 200 250 300 350 400
Dep
th (
m)
Cell Density (cells/l)
April 17, 1995
.3
5
10
0 50 100 150 200 250 300 350 400
Dep
th (
m)
Cell Density (cells/l)
Aug. 30 1994
.3
5
10
0 100 200 300 400
Dep
th (
m)
Cell Density (cells/l)
Oct. 20, 1994
.3
5
10
0 50 100 150 200 250 300 350 400
Dep
th (
m)
Cell Density (cells/l)
June 22, 1995
.3
5
10
0 50 100 150 200 250 300 350 400
Dep
th (
m)
Cell Density (cells/l)
Oct. 24, 1995
.3
5
10
0 100 200 300 400
Dep
th (
m)
Cell Density (cells/l)
Aug. 24, 1995Cladocera
Copepoda
Rotifera
Cladocera
Copepoda
Rotifera
Cladocera
Copepoda
Rotifera
Cladocera
Copepoda
Rotifera
Cladocera
Copepoda
Rotifera
Cladocera
Copepoda
Rotifera
No sampleNo sample
Figure 37. Zooplankton densities summarized by depth at RM 4.3 (Bruneau Arm) of C.J. StrikeReservoir on six sampling dates in 1994 and 1995.

C.J. Strike Limnology Survey
Idaho Power Company Page 70
.3
5
10
15
20
25
0 20 40 60 80 100 120 140
Dep
th (
m)
Cell Density (cells/l)
Oct. 20, 1994Cladocera
Copepoda
Rotifera
.3
5
10
15
20
25
0 50 100 150 200 250
Dep
th (
m)
Cell Density (cells/l)
Cladocera
Copepoda
Rotifera
.3
5
10
15
20
25
0 5 10 15 20
Dep
th (
m)
Cell Density (cells/l)
June 22, 1995
Cladocera
Copepoda
Rotifera
.3
5
10
15
20
25
0 20 40 60 80 100 120 140
Dep
th (
m)
Cell Density (cells/l)
April 17, 1995Cladocera
Copepoda
Rotifera
.3
5
10
15
20
25
0 20 40 60 80 100 120 140
Dep
th (
m)
Cell Density (cells/l)
Cladocera
Copepoda
Rotifera
.3
5
10
15
20
25
0 20 40 60 80 100 120 140
Dep
th (
m)
Cell Density (cells/l)
Aug. 30 1994
Cladocera
Copepoda
Rotifera
Oct. 24, 1995
Aug. 24, 1995
No sample
No sample
No sample
No sample
No sample
No sample
No sample
No sample
Figure 38. Zooplankton densities summarized by depth at RM 494.5 (Snake River Arm) of C.J.Strike Reservoir on six sampling dates in 1994 and 1995.

C.J. Strike Limnology Survey
Idaho Power Company Page 71
Cladocera
Copepoda
Rotifera
.3
5
10
15
20
25
0 20 40 60 80 100
Dep
th (
m)
Cell Density (cells/l)
Cladocera
Copepoda
Rotifera
.3
5
10
15
20
25
0 20 40 60 80 100
Dep
th (
m)
Cell Density (cells/l)
Cladocera
Copepoda
Rotifera
Cladocera
Copepoda
Rotifera
.3
5
10
15
25
0 20 40 60 80 100
Dep
th (
m)
Cell Density (cells/l)
Cladocera
Copepoda
Rotifera
April 17, 1995
.3
5
10
15
20
25
0 20 40 60 80 100
Dep
th (
m)
Cell Density (cells/l)
Aug. 30 1994
.3
5
10
15
25
0 20 40 60 80 100
Dep
th (
m)
Cell Density (cells/l)
Oct. 20, 1994
.3
5
10
15
20
25
0 20 40 60 80 100
Dep
th (
m)
Cell Density (cells/l)
Cladocera
Copepoda
Rotifera
June 22, 1995
Oct. 24, 1995
Aug. 24, 1995
No sample
No sample
No sample
No sample
Figure 39. Zooplankton densities summarized by depth at RM 495.3 (Snake River Arm) ofC.J. Strike Reservoir on six sampling dates in 1994 and 1995.

C.J. Strike Limnology Survey
Idaho Power Company Page 72
This page left blank intentionally.