Embed Size (px)
Citation preview
Identification of Reaction Mechanisms with
a Dynamic PFR Model �
Jan C. Schoneberger ∗ Harvey Arellano-Garcia ∗
Holger Thielert ∗∗ Gunter Wozny ∗
∗ Berlin Institute of Technology,Chair of Process Dynamics andOperation, Berlin, Germany (e-mail: [email protected])
∗∗ Uhde GmbH, Dortmund, Germany
Abstract: In this work, a dynamic model of a catalytic fixed bed reactor (FBR) based onpartial differential equations (PDE) is introduced and used for the identification of reactionmechanisms which take place during the oxidation of sulfur dioxide over a vanadium pentoxidcatalyst. The measured data is collected from a pilot plant, which uses commercial sized catalystparticles. In order to reduce the experimental effort, a developed framework based on themethods of nonlinear optimal experimental design is applied using a steady state FBR model.The systematic procedure is improved using a dynamic reactor model. This makes the timedependent measurement data valuable for the identification procedure.
Keywords: Catalytic fixed bed reactor (FBR), reaction mechanisms, partial differentialequations (PDE), parameter identification, optimal experimental design.
1. INTRODUCTION
Catalytic gas phase reactions have a high relevance inchemical engineering. The majority of chemical processeswill not be profitable and in some cases not even viablewithout the usage of catalysts. An important applicationrepresents the utilization of FBR for waste gas treatmentprocesses. In this work, the oxidation of sulfur dioxideto sulfur trioxide is considered, which is converted withwater to sulphuric acid. It should be noted that hugeeffort is made in the development of new catalysts with ahigher activity. Commonly, new catalysts are designed andtested at micro scale, i.e. a pulverized catalyst. However,the catalyst used in industrial plants are much larger andthe previously identified mechanisms and kinetic parame-ters can not be transferred without further investigationsin a scale up procedure w.r.t. the reactor layout. Thus,measurements with commercial catalyst particles are in-evitable implying a high experimental effort. The sizedparticles require a larger reactor diameter, and thus, highgas flow rates are necessary in order to hold the operationconditions close to the industrial scale reactor. Moreover,corresponding requirements for process automation andsafety engineering have to be met. Consequently, in orderto reduce the experimental effort while reaching a desiredmodel quality, methods of nonlinear optimal experimentaldesign can be applied. In addition, due to the fact thata good deal of data enhances the mechanism and param-eter identification, the proposed framework can still beimproved when using a model, which describes the pilotplant dynamic behavior. In this work, a homogeneous anda two-phase FBR model are presented. The latter canbe used for dynamic simulations. Both are compared toeach other based on a set of measured data taken from anidentification campaign. The experiments were performed� This work is supported by the Max-Buchner-Forschungsstiftung.
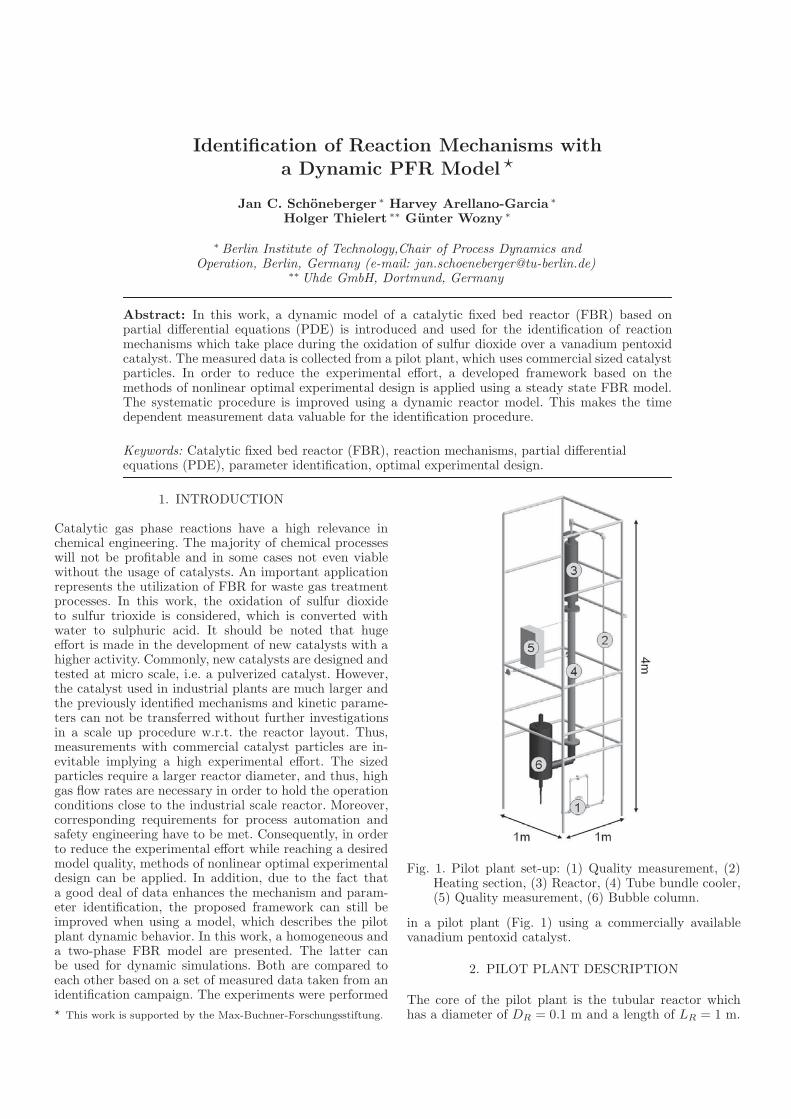
Fig. 1. Pilot plant set-up: (1) Quality measurement, (2)Heating section, (3) Reactor, (4) Tube bundle cooler,(5) Quality measurement, (6) Bubble column.
in a pilot plant (Fig. 1) using a commercially availablevanadium pentoxid catalyst.
2. PILOT PLANT DESCRIPTION
The core of the pilot plant is the tubular reactor whichhas a diameter of DR = 0.1 m and a length of LR = 1 m.
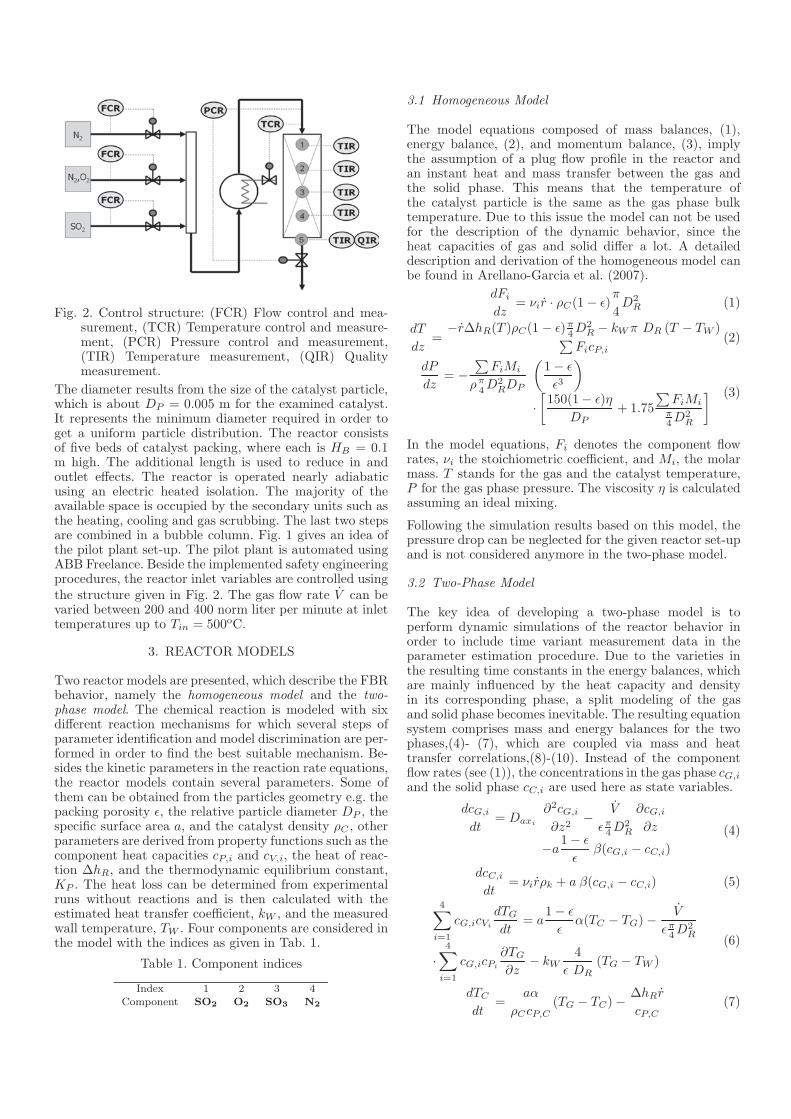
Fig. 2. Control structure: (FCR) Flow control and mea-surement, (TCR) Temperature control and measure-ment, (PCR) Pressure control and measurement,(TIR) Temperature measurement, (QIR) Qualitymeasurement.
The diameter results from the size of the catalyst particle,which is about DP = 0.005 m for the examined catalyst.It represents the minimum diameter required in order toget a uniform particle distribution. The reactor consistsof five beds of catalyst packing, where each is HB = 0.1m high. The additional length is used to reduce in andoutlet effects. The reactor is operated nearly adiabaticusing an electric heated isolation. The majority of theavailable space is occupied by the secondary units such asthe heating, cooling and gas scrubbing. The last two stepsare combined in a bubble column. Fig. 1 gives an idea ofthe pilot plant set-up. The pilot plant is automated usingABB Freelance. Beside the implemented safety engineeringprocedures, the reactor inlet variables are controlled usingthe structure given in Fig. 2. The gas flow rate V can bevaried between 200 and 400 norm liter per minute at inlettemperatures up to Tin = 500oC.
3. REACTOR MODELS
Two reactor models are presented, which describe the FBRbehavior, namely the homogeneous model and the two-phase model. The chemical reaction is modeled with sixdifferent reaction mechanisms for which several steps ofparameter identification and model discrimination are per-formed in order to find the best suitable mechanism. Be-sides the kinetic parameters in the reaction rate equations,the reactor models contain several parameters. Some ofthem can be obtained from the particles geometry e.g. thepacking porosity ε, the relative particle diameter DP , thespecific surface area a, and the catalyst density ρC , otherparameters are derived from property functions such as thecomponent heat capacities cP,i and cV,i, the heat of reac-tion ΔhR, and the thermodynamic equilibrium constant,KP . The heat loss can be determined from experimentalruns without reactions and is then calculated with theestimated heat transfer coefficient, kW , and the measuredwall temperature, TW . Four components are considered inthe model with the indices as given in Tab. 1.
Table 1. Component indices
Index 1 2 3 4
Component SO2 O2 SO3 N2
3.1 Homogeneous Model
The model equations composed of mass balances, (1),energy balance, (2), and momentum balance, (3), implythe assumption of a plug flow profile in the reactor andan instant heat and mass transfer between the gas andthe solid phase. This means that the temperature ofthe catalyst particle is the same as the gas phase bulktemperature. Due to this issue the model can not be usedfor the description of the dynamic behavior, since theheat capacities of gas and solid differ a lot. A detaileddescription and derivation of the homogeneous model canbe found in Arellano-Garcia et al. (2007).
dFi
dz= νir · ρC(1 − ε)
π
4D2
R (1)
dT
dz=
−rΔhR(T )ρC(1 − ε)π4 D2
R − kW π DR (T − TW )∑FicP,i
(2)
dP
dz= −
∑FiMi
ρπ4 D2
RDP
(1 − ε
ε3
)
·
[150(1 − ε)η
DP+ 1.75
∑FiMi
π4 D2
R
] (3)
In the model equations, Fi denotes the component flowrates, νi the stoichiometric coefficient, and Mi, the molarmass. T stands for the gas and the catalyst temperature,P for the gas phase pressure. The viscosity η is calculatedassuming an ideal mixing.
Following the simulation results based on this model, thepressure drop can be neglected for the given reactor set-upand is not considered anymore in the two-phase model.
3.2 Two-Phase Model
The key idea of developing a two-phase model is toperform dynamic simulations of the reactor behavior inorder to include time variant measurement data in theparameter estimation procedure. Due to the varieties inthe resulting time constants in the energy balances, whichare mainly influenced by the heat capacity and densityin its corresponding phase, a split modeling of the gasand solid phase becomes inevitable. The resulting equationsystem comprises mass and energy balances for the twophases,(4)- (7), which are coupled via mass and heattransfer correlations,(8)-(10). Instead of the componentflow rates (see (1)), the concentrations in the gas phase cG,i
and the solid phase cC,i are used here as state variables.
dcG,i
dt= Daxi
∂2cG,i
∂z2−
V
επ4 D2
R
∂cG,i
∂z
−a1 − ε
εβ(cG,i − cC,i)
(4)
dcC,i
dt= νirρk + a β(cG,i − cC,i) (5)
4∑i=1
cG,icVi
dTG
dt= a
1 − ε
εα(TC − TG) −
V
επ4 D2
R
·
4∑i=1
cG,icPi
∂TG
∂z− kW
4
ε DR(TG − TW )
(6)
dTC
dt=
aα
ρCcP,C(TG − TC) −
ΔhRr
cP,C(7)
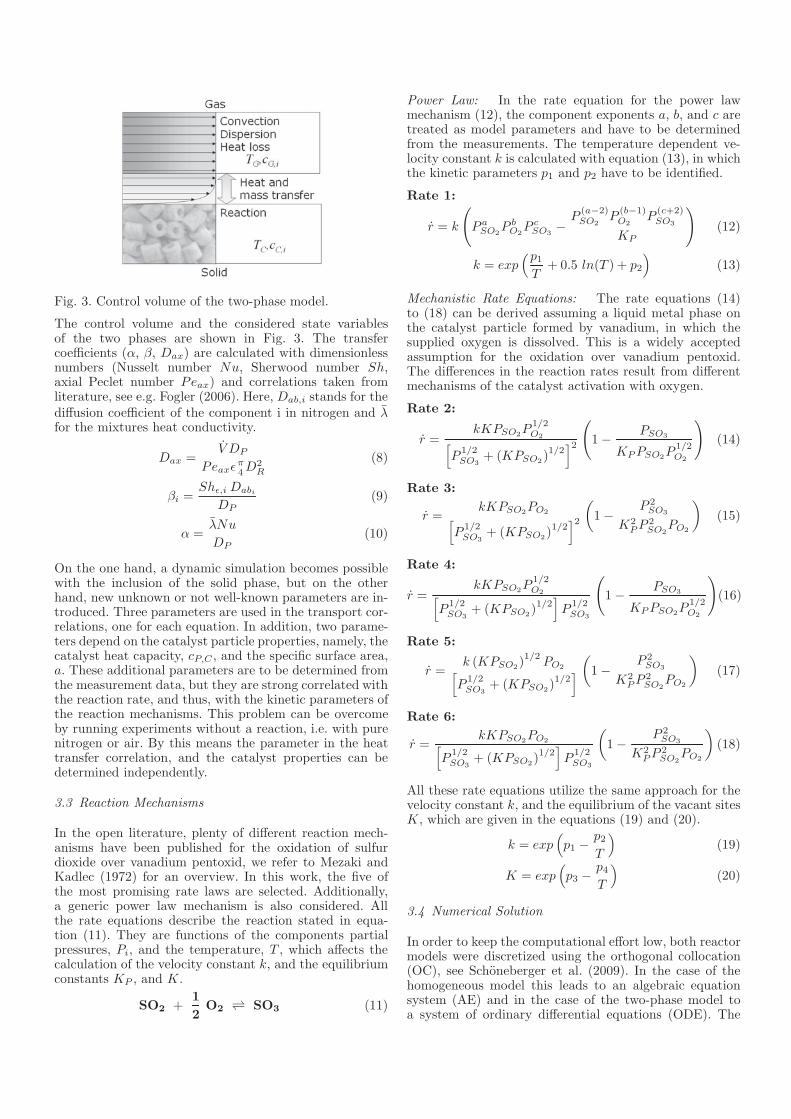
Fig. 3. Control volume of the two-phase model.
The control volume and the considered state variablesof the two phases are shown in Fig. 3. The transfercoefficients (α, β, Dax) are calculated with dimensionlessnumbers (Nusselt number Nu, Sherwood number Sh,axial Peclet number Peax) and correlations taken fromliterature, see e.g. Fogler (2006). Here, Dab,i stands for thediffusion coefficient of the component i in nitrogen and λfor the mixtures heat conductivity.
Dax =V DP
Peaxεπ4 D2
R
(8)
βi =Shε,i Dabi
DP(9)
α =λNu
DP(10)
On the one hand, a dynamic simulation becomes possiblewith the inclusion of the solid phase, but on the otherhand, new unknown or not well-known parameters are in-troduced. Three parameters are used in the transport cor-relations, one for each equation. In addition, two parame-ters depend on the catalyst particle properties, namely, thecatalyst heat capacity, cP,C , and the specific surface area,a. These additional parameters are to be determined fromthe measurement data, but they are strong correlated withthe reaction rate, and thus, with the kinetic parameters ofthe reaction mechanisms. This problem can be overcomeby running experiments without a reaction, i.e. with purenitrogen or air. By this means the parameter in the heattransfer correlation, and the catalyst properties can bedetermined independently.
3.3 Reaction Mechanisms
In the open literature, plenty of different reaction mech-anisms have been published for the oxidation of sulfurdioxide over vanadium pentoxid, we refer to Mezaki andKadlec (1972) for an overview. In this work, the five ofthe most promising rate laws are selected. Additionally,a generic power law mechanism is also considered. Allthe rate equations describe the reaction stated in equa-tion (11). They are functions of the components partialpressures, Pi, and the temperature, T , which affects thecalculation of the velocity constant k, and the equilibriumconstants KP , and K.
SO2 +1
2O2
⇀↽ SO3 (11)
Power Law: In the rate equation for the power lawmechanism (12), the component exponents a, b, and c aretreated as model parameters and have to be determinedfrom the measurements. The temperature dependent ve-locity constant k is calculated with equation (13), in whichthe kinetic parameters p1 and p2 have to be identified.
Rate 1:
r = k
(P a
SO2P b
O2P c
SO3−
P(a−2)SO2
P(b−1)O2
P(c+2)SO3
KP
)(12)
k = exp(p1
T+ 0.5 ln(T ) + p2
)(13)
Mechanistic Rate Equations: The rate equations (14)to (18) can be derived assuming a liquid metal phase onthe catalyst particle formed by vanadium, in which thesupplied oxygen is dissolved. This is a widely acceptedassumption for the oxidation over vanadium pentoxid.The differences in the reaction rates result from differentmechanisms of the catalyst activation with oxygen.
Rate 2:
r =kKPSO2
P1/2O2[
P1/2SO3
+ (KPSO2)1/2
]2
(1 −
PSO3
KP PSO2P
1/2O2
)(14)
Rate 3:
r =kKPSO2
PO2[P
1/2SO3
+ (KPSO2)1/2
]2
(1 −
P 2SO3
K2P P 2
SO2PO2
)(15)
Rate 4:
r =kKPSO2
P1/2O2[
P1/2SO3
+ (KPSO2)1/2
]P
1/2SO3
(1 −
PSO3
KP PSO2P
1/2O2
)(16)
Rate 5:
r =k (KPSO2
)1/2
PO2[P
1/2SO3
+ (KPSO2)1/2
] (1 −
P 2SO3
K2PP 2
SO2PO2
)(17)
Rate 6:
r =kKPSO2
PO2[P
1/2SO3
+ (KPSO2)1/2
]P
1/2SO3
(1 −
P 2SO3
K2PP 2
SO2PO2
)(18)
All these rate equations utilize the same approach for thevelocity constant k, and the equilibrium of the vacant sitesK, which are given in the equations (19) and (20).
k = exp(p1 −
p2
T
)(19)
K = exp(p3 −
p4
T
)(20)
3.4 Numerical Solution
In order to keep the computational effort low, both reactormodels were discretized using the orthogonal collocation(OC), see Schoneberger et al. (2009). In the case of thehomogeneous model this leads to an algebraic equationsystem (AE) and in the case of the two-phase model toa system of ordinary differential equations (ODE). The
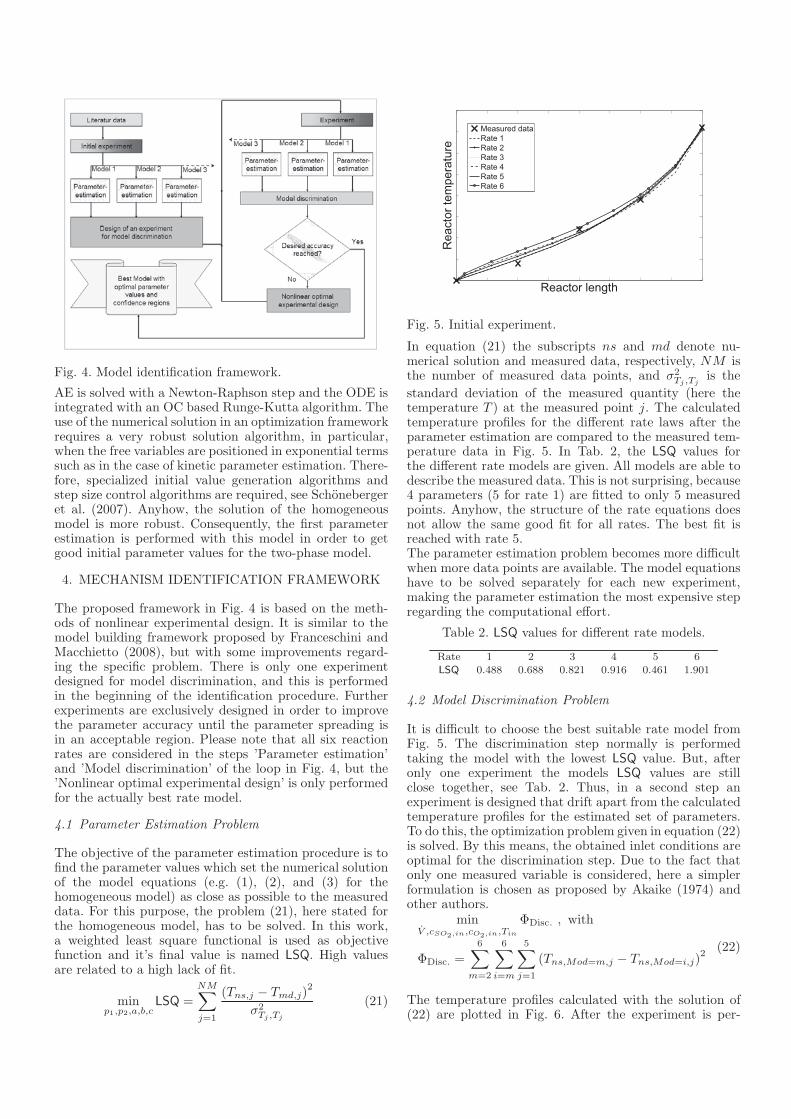
Fig. 4. Model identification framework.
AE is solved with a Newton-Raphson step and the ODE isintegrated with an OC based Runge-Kutta algorithm. Theuse of the numerical solution in an optimization frameworkrequires a very robust solution algorithm, in particular,when the free variables are positioned in exponential termssuch as in the case of kinetic parameter estimation. There-fore, specialized initial value generation algorithms andstep size control algorithms are required, see Schonebergeret al. (2007). Anyhow, the solution of the homogeneousmodel is more robust. Consequently, the first parameterestimation is performed with this model in order to getgood initial parameter values for the two-phase model.
4. MECHANISM IDENTIFICATION FRAMEWORK
The proposed framework in Fig. 4 is based on the meth-ods of nonlinear experimental design. It is similar to themodel building framework proposed by Franceschini andMacchietto (2008), but with some improvements regard-ing the specific problem. There is only one experimentdesigned for model discrimination, and this is performedin the beginning of the identification procedure. Furtherexperiments are exclusively designed in order to improvethe parameter accuracy until the parameter spreading isin an acceptable region. Please note that all six reactionrates are considered in the steps ’Parameter estimation’and ’Model discrimination’ of the loop in Fig. 4, but the’Nonlinear optimal experimental design’ is only performedfor the actually best rate model.
4.1 Parameter Estimation Problem
The objective of the parameter estimation procedure is tofind the parameter values which set the numerical solutionof the model equations (e.g. (1), (2), and (3) for thehomogeneous model) as close as possible to the measureddata. For this purpose, the problem (21), here stated forthe homogeneous model, has to be solved. In this work,a weighted least square functional is used as objectivefunction and it’s final value is named LSQ. High valuesare related to a high lack of fit.
minp1,p2,a,b,c
LSQ =
NM∑j=1
(Tns,j − Tmd,j)2
σ2Tj ,Tj
(21)
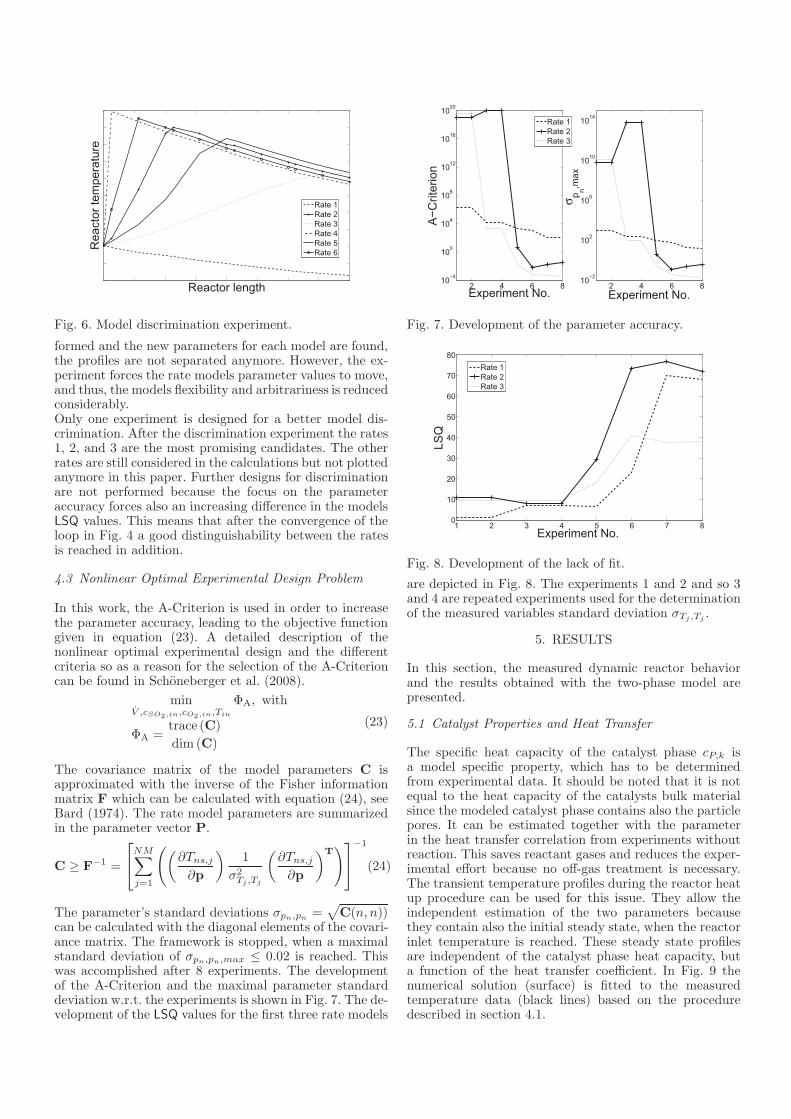
Reactor length
Rea
ctor
tem
pera
ture
Measured dataRate 1Rate 2Rate 3Rate 4Rate 5Rate 6
Fig. 5. Initial experiment.
In equation (21) the subscripts ns and md denote nu-merical solution and measured data, respectively, NM isthe number of measured data points, and σ2
Tj ,Tjis the
standard deviation of the measured quantity (here thetemperature T ) at the measured point j. The calculatedtemperature profiles for the different rate laws after theparameter estimation are compared to the measured tem-perature data in Fig. 5. In Tab. 2, the LSQ values forthe different rate models are given. All models are able todescribe the measured data. This is not surprising, because4 parameters (5 for rate 1) are fitted to only 5 measuredpoints. Anyhow, the structure of the rate equations doesnot allow the same good fit for all rates. The best fit isreached with rate 5.The parameter estimation problem becomes more difficultwhen more data points are available. The model equationshave to be solved separately for each new experiment,making the parameter estimation the most expensive stepregarding the computational effort.
Table 2. LSQ values for different rate models.
Rate 1 2 3 4 5 6
LSQ 0.488 0.688 0.821 0.916 0.461 1.901
4.2 Model Discrimination Problem
It is difficult to choose the best suitable rate model fromFig. 5. The discrimination step normally is performedtaking the model with the lowest LSQ value. But, afteronly one experiment the models LSQ values are stillclose together, see Tab. 2. Thus, in a second step anexperiment is designed that drift apart from the calculatedtemperature profiles for the estimated set of parameters.To do this, the optimization problem given in equation (22)is solved. By this means, the obtained inlet conditions areoptimal for the discrimination step. Due to the fact thatonly one measured variable is considered, here a simplerformulation is chosen as proposed by Akaike (1974) andother authors.
minV ,cSO2,in,cO2,in,Tin
ΦDisc. , with
ΦDisc. =
6∑m=2
6∑i=m
5∑j=1
(Tns,Mod=m,j − Tns,Mod=i,j)2
(22)
The temperature profiles calculated with the solution of(22) are plotted in Fig. 6. After the experiment is per-
Reactor length
Rea
ctor
tem
pera
ture
Rate 1Rate 2Rate 3Rate 4Rate 5Rate 6
Fig. 6. Model discrimination experiment.
formed and the new parameters for each model are found,the profiles are not separated anymore. However, the ex-periment forces the rate models parameter values to move,and thus, the models flexibility and arbitrariness is reducedconsiderably.Only one experiment is designed for a better model dis-crimination. After the discrimination experiment the rates1, 2, and 3 are the most promising candidates. The otherrates are still considered in the calculations but not plottedanymore in this paper. Further designs for discriminationare not performed because the focus on the parameteraccuracy forces also an increasing difference in the modelsLSQ values. This means that after the convergence of theloop in Fig. 4 a good distinguishability between the ratesis reached in addition.
4.3 Nonlinear Optimal Experimental Design Problem
In this work, the A-Criterion is used in order to increasethe parameter accuracy, leading to the objective functiongiven in equation (23). A detailed description of thenonlinear optimal experimental design and the differentcriteria so as a reason for the selection of the A-Criterioncan be found in Schoneberger et al. (2008).
minV ,cSO2,in,cO2,in,Tin
ΦA, with
ΦA =trace (C)
dim (C)
(23)
The covariance matrix of the model parameters C isapproximated with the inverse of the Fisher informationmatrix F which can be calculated with equation (24), seeBard (1974). The rate model parameters are summarizedin the parameter vector P.
C ≥ F−1 =
⎡⎣NM∑
j=1
((∂Tns,j
∂p
)1
σ2Tj ,Tj
(∂Tns,j
∂p
)T)⎤
⎦−1
(24)
The parameter’s standard deviations σpn,pn=
√C(n, n))
can be calculated with the diagonal elements of the covari-ance matrix. The framework is stopped, when a maximalstandard deviation of σpn,pn,max ≤ 0.02 is reached. Thiswas accomplished after 8 experiments. The developmentof the A-Criterion and the maximal parameter standarddeviation w.r.t. the experiments is shown in Fig. 7. The de-velopment of the LSQ values for the first three rate models
2 4 6 810−4
100
104
108
1012
1016
1020
Experiment No.
A−C
riter
ion
2 4 6 810−2
102
106
1010
1014
Experiment No.
σ p n,max
Rate 1Rate 2Rate 3
Fig. 7. Development of the parameter accuracy.
1 2 3 4 5 6 7 80
10
20
30
40
50
60
70
80
Experiment No.
LSQ
Rate 1Rate 2Rate 3
Fig. 8. Development of the lack of fit.
are depicted in Fig. 8. The experiments 1 and 2 and so 3and 4 are repeated experiments used for the determinationof the measured variables standard deviation σTj ,Tj
.
5. RESULTS
In this section, the measured dynamic reactor behaviorand the results obtained with the two-phase model arepresented.
5.1 Catalyst Properties and Heat Transfer
The specific heat capacity of the catalyst phase cP,k isa model specific property, which has to be determinedfrom experimental data. It should be noted that it is notequal to the heat capacity of the catalysts bulk materialsince the modeled catalyst phase contains also the particlepores. It can be estimated together with the parameterin the heat transfer correlation from experiments withoutreaction. This saves reactant gases and reduces the exper-imental effort because no off-gas treatment is necessary.The transient temperature profiles during the reactor heatup procedure can be used for this issue. They allow theindependent estimation of the two parameters becausethey contain also the initial steady state, when the reactorinlet temperature is reached. These steady state profilesare independent of the catalyst phase heat capacity, buta function of the heat transfer coefficient. In Fig. 9 thenumerical solution (surface) is fitted to the measuredtemperature data (black lines) based on the proceduredescribed in section 4.1.
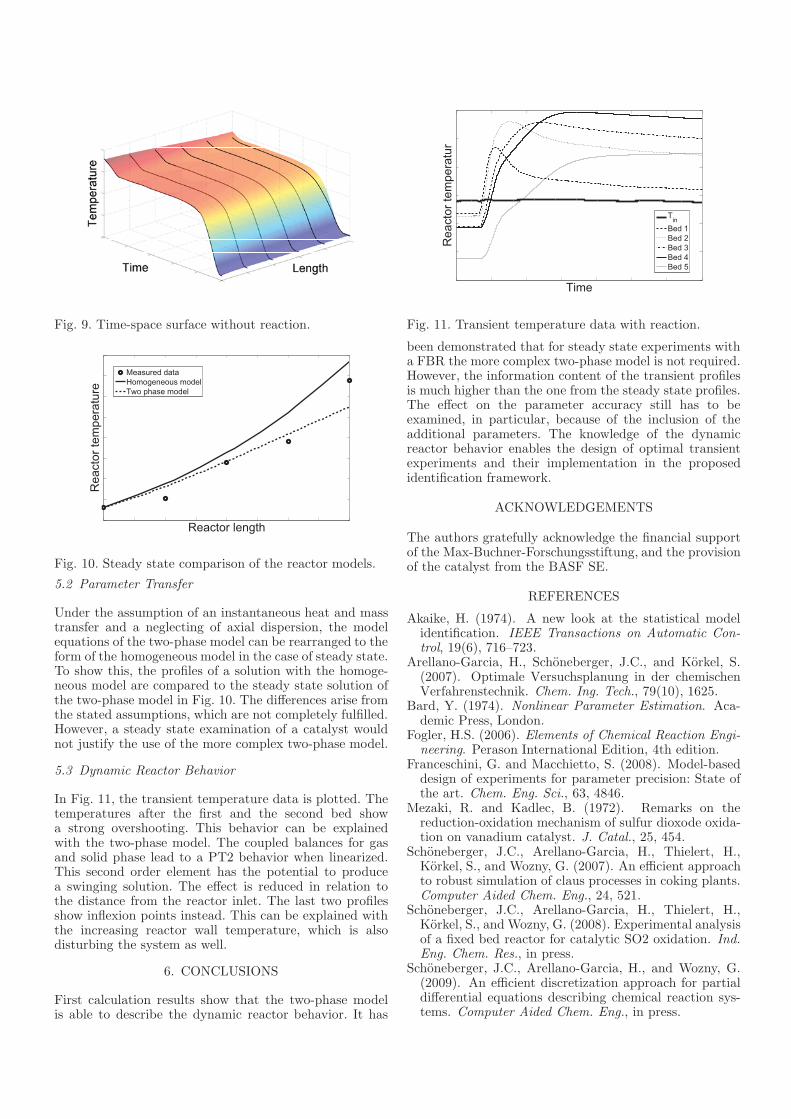
Fig. 9. Time-space surface without reaction.
Reactor length
Rea
ctor
tem
pera
ture
Measured dataHomogeneous modelTwo phase model
Fig. 10. Steady state comparison of the reactor models.
5.2 Parameter Transfer
Under the assumption of an instantaneous heat and masstransfer and a neglecting of axial dispersion, the modelequations of the two-phase model can be rearranged to theform of the homogeneous model in the case of steady state.To show this, the profiles of a solution with the homoge-neous model are compared to the steady state solution ofthe two-phase model in Fig. 10. The differences arise fromthe stated assumptions, which are not completely fulfilled.However, a steady state examination of a catalyst wouldnot justify the use of the more complex two-phase model.
5.3 Dynamic Reactor Behavior
In Fig. 11, the transient temperature data is plotted. Thetemperatures after the first and the second bed showa strong overshooting. This behavior can be explainedwith the two-phase model. The coupled balances for gasand solid phase lead to a PT2 behavior when linearized.This second order element has the potential to producea swinging solution. The effect is reduced in relation tothe distance from the reactor inlet. The last two profilesshow inflexion points instead. This can be explained withthe increasing reactor wall temperature, which is alsodisturbing the system as well.
6. CONCLUSIONS
First calculation results show that the two-phase modelis able to describe the dynamic reactor behavior. It has
Time
Rea
ctor
tem
pera
tur
TinBed 1Bed 2Bed 3Bed 4Bed 5
Fig. 11. Transient temperature data with reaction.
been demonstrated that for steady state experiments witha FBR the more complex two-phase model is not required.However, the information content of the transient profilesis much higher than the one from the steady state profiles.The effect on the parameter accuracy still has to beexamined, in particular, because of the inclusion of theadditional parameters. The knowledge of the dynamicreactor behavior enables the design of optimal transientexperiments and their implementation in the proposedidentification framework.
ACKNOWLEDGEMENTS
The authors gratefully acknowledge the financial supportof the Max-Buchner-Forschungsstiftung, and the provisionof the catalyst from the BASF SE.
REFERENCES
Akaike, H. (1974). A new look at the statistical modelidentification. IEEE Transactions on Automatic Con-trol, 19(6), 716–723.
Arellano-Garcia, H., Schoneberger, J.C., and Korkel, S.(2007). Optimale Versuchsplanung in der chemischenVerfahrenstechnik. Chem. Ing. Tech., 79(10), 1625.
Bard, Y. (1974). Nonlinear Parameter Estimation. Aca-demic Press, London.
Fogler, H.S. (2006). Elements of Chemical Reaction Engi-neering. Perason International Edition, 4th edition.
Franceschini, G. and Macchietto, S. (2008). Model-baseddesign of experiments for parameter precision: State ofthe art. Chem. Eng. Sci., 63, 4846.
Mezaki, R. and Kadlec, B. (1972). Remarks on thereduction-oxidation mechanism of sulfur dioxode oxida-tion on vanadium catalyst. J. Catal., 25, 454.
Schoneberger, J.C., Arellano-Garcia, H., Thielert, H.,Korkel, S., and Wozny, G. (2007). An efficient approachto robust simulation of claus processes in coking plants.Computer Aided Chem. Eng., 24, 521.
Schoneberger, J.C., Arellano-Garcia, H., Thielert, H.,Korkel, S., and Wozny, G. (2008). Experimental analysisof a fixed bed reactor for catalytic SO2 oxidation. Ind.Eng. Chem. Res., in press.
Schoneberger, J.C., Arellano-Garcia, H., and Wozny, G.(2009). An efficient discretization approach for partialdifferential equations describing chemical reaction sys-tems. Computer Aided Chem. Eng., in press.