Embed Size (px)
Citation preview
Food Chemistry 348 (2021) 128907
Available online 24 December 20200308-8146/© 2020 Elsevier Ltd. All rights reserved.
Identification and investigation of mechanically separated meat (MSM) with an innovative ultrasonic method
K. Wieja a, P. Kiełczynski a,*, P. Szymanski b, M. Szalewski a, A. Balcerzak a, S. Ptasznik b
a Institute of Fundamental Technological Research, Polish Academy of Sciences, ul. Pawinskiego 5B, 02-106 Warsaw, Poland b Department of Meat and Fat Technology, Prof. Wacław Dąbrowski Institute of Agricultural and Food Biotechnology, 36 Rakowiecka St., 02-532 Warsaw, Poland
A R T I C L E I N F O
Keywords: Physicochemical parameters Mechanically separated meat Ultrasonic velocity Protein content Calcium content Fat content
A B S T R A C T
An innovative analytical ultrasonic method for identification and investigation of Mechanically Separated Meat (MSM) samples is presented. To this end, the ultrasonic wave velocity (f = 5 MHz) in the investigated meat samples was measured. The measured ultrasonic velocity ranged from 1553.4 to 1589.9 m/s. The investigations were performed for: 1) minced hand deboned chicken fillets, 2) low pressure MSM from chicken carcasses, 3) low pressure MSM from chicken collarbones, 4) high pressure MSM from chicken carcasses and 5) high pressure MSM from chicken collarbones. Statistically significant (p < 0.001) differences in the ultrasonic velocity were observed for each of investigated kinds of meat. High significant correlations were found between the ultrasonic velocity and the content of protein, fat, sodium and density of the investigated meat. The applicability of the developed ultrasonic method for identifying various kinds of meat and to determine the content of protein, fat, sodium and density was demonstrated.
1. Introduction
Growing demands of the food industry as well as consumer expec-tations present increasing challenges for the quality control methods of food products. In fact, the methods for assessing the quality and prop-erties of foodstuffs should be fast, simple, reliable and non-destructive. These methods should also be possible to automate and control with computers, a primary requirement in on-line industrial production lines.
The acronym MSM used throughout the paper stands for the Me-chanically Separated Meat that is a raw material obtained by mechanical separation of soft tissue residues from the bones, remaining after cutting and punching of poultry, pig and beef carcasses.
At present, the MSM is widely used as a component in a variety of meat products. The use of MSM as an ingredient in meat products has a significant influence on their quality as well as consumer satisfaction and safety. It is therefore of paramount importance to develop an effective and reliable industrial method to identify MSM and their properties (de Oliveira et al., 2015; Wubshet et al., 2019; Tomaiuolo et al., 2019).
Addressing these demands, the current paper presents a new inno-vative, ultrasonic method for identification and investigation of MSM samples. The method, developed to this end by the authors in the
Laboratory of Acoustoelectronics at the Institute of Fundamental Tech-nological Research of the Polish Academy of Sciences, Warsaw, Poland, enables for rapid and automated measurements.
The authors put forward the hypothesis that the measurements of the longitudinal ultrasonic wave velocity can be successfully applied to discriminate various types of meat as well as to evaluate the physico-chemical parameters of meat samples.
It should be noticed that up to date, a large number of physical and biochemical methods have been proposed and used in identification of MSM products, such as:
(1) chemical composition analysis (Crosland et al., 1995), (2) gel electrophoresis (Savage et al., 1995), (3) microscopy (Pickering et al., 1995a), (4) immunological techniques (Pickering et al., 1995b), (5) capillary gel electrophoresis (Day & Brown, 2001), (6) proteomic approach (Surowiec et al., 2011a), (7) total reflection X-ray fluorescence (Dalipi et al., 2018), (8) X-ray micro computed tomography (Pospiech et al., 2019), (9) multivariate analysis of protein profiles (Skarpeid et al., 2001),
(10) histological analysis (Tremlova et al., 2006), (11) evaluation of radiostrontium levels (Iammarino et al., 2019),
* Corresponding author. E-mail address: [email protected] (P. Kiełczynski).
Contents lists available at ScienceDirect
Food Chemistry
journal homepage: www.elsevier.com/locate/foodchem
https://doi.org/10.1016/j.foodchem.2020.128907 Received 2 April 2020; Received in revised form 7 December 2020; Accepted 10 December 2020
Food Chemistry 348 (2021) 128907
2
(12) metabolomic approach (Surowiec et al., 2011b), (13) electron spin resonance spectroscopy (Tomaiuolo et al., 2019), (14) inductively coupled plasma-mass spectrometry (Sarakatsianos
et al., 2018).
However, all these methods display many deficiencies. Their main disadvantage is lack of suitability for on-line measurements. They are all in fact laboratory methods. Despite their capability to deliver fairly precise results, they are plagued by a number of additional disadvan-tages (Surowiec et al., 2011b), such as:
a) inability to operate in real time (on-line), b) complicated setup and operation, c) lengthy, time consuming measurements, d) high cost, e) bulky equipment, f) requirement for a highly qualified personnel, g) tedious off-line sample preparation and h) difficult and complex data analysis (Damez & Clerjon, 2008).
Two more promising methods that may be used to investigate properties of MSM products are as follows: 1) Near Infra-Red hyper-spectral imaging method (Kamruzzaman et al., 2012a, Kamruzzaman et al., 2012b) and 2) Near Infra-Red Reflectance spectroscopy method (Alomar et al., 2003; Prieto et al., 2006).
It should be emphasized that these methods are designed generally to determine the chemical composition of meat, not to discriminate various kinds of meat.
Although, these two methods can be in principle used online, they have substantial limitations (Kumar & Karne, 2017) and share most of the disadvantages (a–h) listed above. Their main disadvantages are:
1) very complex calibration procedures and time-consuming sample preparation
2) very complicated algorithms of pre-processing and post-processing analysis,
3) highly complex and difficult interpretation of the results obtained and
4) sophisticated and very costly equipment.
Preferably, the identification process of various meat products in industrial conditions should be fast, relatively inexpensive, non- destructive and performed with compact, portable and fully- auto-mated equipment. The ultrasonic methods, such as those based on ul-trasonic measurements of velocity fulfill all these requirements.
In this paper the authors propose the application of a new innovative ultrasonic method for investigation and identification of various types of MSM. The method is based on the ultrasonic velocity c measurement. The proposed ultrasonic method is free of all of the above mentioned deficiencies (a–h). As a matter of fact, the ultrasonic methods have already been successfully employed in food investigations in a variety of food products, for a general review see, (Taufiq et al., 2016; Kiełczynski, 2017).
Surprisingly, a fairly large number of mechanical and physico-chemical properties of meat and meat products was already evaluated by ultrasound in a numerous papers, e.g.,
1) composition of cod fillets (Ghaedian et al., 1997), 2) mechanical properties of meat (Nowak et al., 2015). 3) structure and composition of pork meat (Koch et al., 2011a). 4) dry salting monitoring (Prados et al, 2016). 5) textural properties of a meat-based product (Llull et al., 2002). 6) detection of bone fragment in mechanically deboned chicken breasts
(Correia et al., 2008) 7) non-destructive determination of fat content in green hams (Prados
et al., 2015).
However, to the best of our knowledge, the ultrasonic methods have not been yet employed to investigate the properties of MSM products. In the proposed ultrasonic method, the authors measure the velocity c of longitudinal ultrasonic waves propagating in various kinds of investi-gated MSM meat samples.
In order to determine the correlation between the ultrasonic velocity and the chemical composition of the meat samples, the content of cal-cium, phosphorus, sodium, water, protein, fat and density of the investigated meat samples were determined. The measured ultrasonic velocity c was subsequently compared with the actual physicochemical parameters of the investigated MSM samples. The measured ultrasonic velocity c displayed a high level of correlation with a number of the actual physicochemical parameters (i.e., content of protein, fat, sodium and density) of the investigated MSM samples. We anticipate that this discovery can constitute a basis for a future on-line industrial method for 1) identification of individual types of MSM meat products and 2) assessment of the basic chemical composition of the investigated meat samples.
The proposed by the authors ultrasonic method has the following favored features:
1) possibility for on-line implementation 2) possibility of full automation and computerization, 3) fast measurement process, 4) no special sample preparation and preprocessing are necessary, 5) high reliability, 6) simplicity and low cost, 7) not destructiveness, 8) no moving mechanical parts, 9) use of industrial grade instrumentation,
10) environmental friendliness.
The goal of this paper was to identify different types of MSM meat samples from measurements of the ultrasonic velocity c and to find possible correlations between the ultrasonic velocity c and the following physicochemical parameters of MSM meat samples: the content of pro-tein, fat, calcium, phosphorus, sodium, water, and the density of the investigated meat samples.
2. Materials and methods
2.1. Meat samples
The sample materials utilized in this work were provided by a Polish poultry processing plant located in Lublin, Poland.
The raw material under investigation was the chicken (Gallus gallus domesticus) breast meat obtained from industrial hand deboning (HD) poultry meat and four types of mechanically separated meat (MSM) obtained from mechanical deboning of non-frozen chicken carcasses and chicken collarbones using two different types of separator devices, namely:
1) Sepamatic Sepa 1200 belt separator device (Overath, Germany) classified as low pressure device produces MSM meat (drum perfo-ration diameter is 3.0 mm). Due to the requirements of the device, the processed bones were initially fragmented into smaller portions. The end product had a consistency similar to minced meat.
2) Lima RM 600 s separator (Quimper, France), classified formally as high pressure device produces MSM meat. The actual operating pressure is 1.5 MPa. The size of the outlet slots is 0.5 × 20.0 mm2. By contrast to device no 1, the processed bones were initially not frag-mented into smaller portions. The obtained MSM meat material had a paste-like consistency.
Before examination, HD poultry meat and MSM samples were minced with a grinder (Edesa PL-22-TU-T, Czosnow, Poland), using a
K. Wieja et al.
Food Chemistry 348 (2021) 128907
3
strainer with 3 mm holes and subsequently mixed with a Keripar mixer (Troy, Ohio, USA) for homogenization.
In this work, we investigated the following five types of meat samples (obtained with different methods), i.e.,
1) minced HD chicken fillets, 2) low pressure MSM samples from chicken carcasses, 3) low pressure MSM samples from chicken collarbones, 4) high pressure MSM samples from chicken carcasses and 5) high pressure MSM samples from chicken collarbones.
Prior to ultrasonic measurements the investigated five types of meat samples were stored at a constant temperature of 4 ◦C.
2.2. Chemical analysis of the investigated meat samples
The following basic physicochemical parameters of the investigated meat samples were measured:
a) Density
The density of meat samples (g/cm3) was measured with a modified pycnometric method. Measuring flask had a volume of 100 cm3. The density measurements were performed for meat samples with a mass of approximately 10 g. In the first stage, we determine the mass of the sample. The volume of the meat sample was determined from the determination of the water level increase after inserting the investigated meat sample into the measuring cylinder with water. Knowledge of the mass and the volume of meat samples allows to determine their density.
b) Calcium content
The calcium content (mg/kg) was evaluated using flame atomic absorption spectrometry (FAAS) and Z-2000 apparatus (Hitachi, Japan). The meat sample was dry mineralized in a muffle furnace at 420–450 ◦C. After the mineralization (on the heating plate and in the muffle furnace), dissolving and adding the matrix modifier - Lanthanum buffer, the sample was analyzed on a spectrophotometer using a Ca lamp with a hollow cathode. The calcium concentration was determined on the basis of the evaluated standard curves.
c) Phosphorus content
The phosphorus content was evaluated according to the [PN-A- 82060:1999] standard. The determination of the total phosphorus content [%], expressed as P2O5, included the following steps: 1) mineralization of the sample, 2) precipitation of phosphorus in the form of choline phosphoromolybdate and 3) weight determination of total phosphorus.
d) Sodium content
The sodium content (mg/kg) was determined using flame atomic absorption spectrometry (FAAS) with the Hitachi Z-2000 apparatus, Japan). The meat sample was dry mineralized in a muffle furnace at 420–450 ◦C. After the mineralization (on the heating plate and in the muffle furnace), dissolving and adding the matrix modifier - Cesium buffer, the sample was analyzed by spectrophotometer using an Na lamp with a hollow cathode. The sodium concentration was determined employing the evaluated standard curves.
e) Water content
The water content [%] was determined using a standard drying method. The measured samples were drying at 103 ◦C for 30 min, (Oven Series 9000, Thermolyne, USA).
f) Protein content
The protein content [%] was measured with a Kjeldahl method, (Foss Tecator, Sweden) according to the [PN-75-A-04018/Az3] standard.
The method relies on determination of the total nitrogen content by the Kjeldahl method, using subsequently the conversion factor of ni-trogen content into protein content (for meat = 6.25).
g) Fat content
The fat content [%] was measured using a weight method according to the [PN-ISO 1444-2000] standard. Extraction of fat was performed employing a Soxhlet technique, (Tecator Co., Sweden).
2.3. Ultrasonic measurements
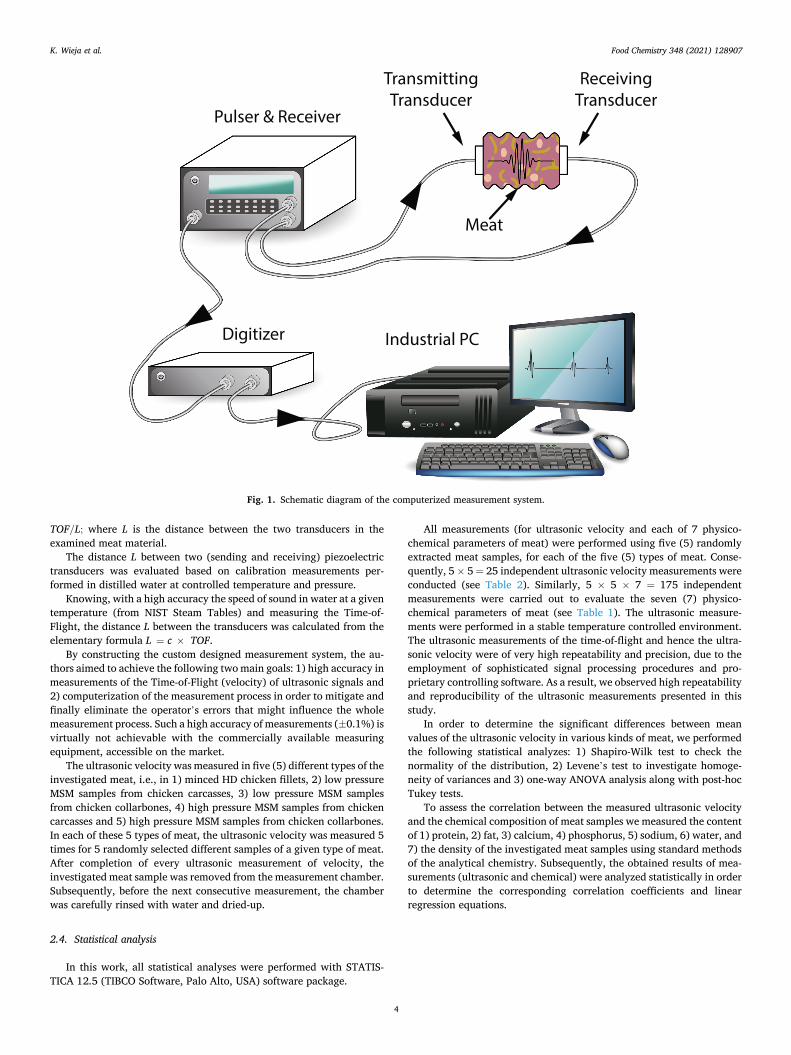
The phase velocity c the ultrasonic waves propagating in the inves-tigated meat samples, was measured with a custom designed comput-erized measurement system, constructed by the authors in the Section of Acoustoelectronics at Institute of Fundamental Technological Research of the Polish Academy of Sciences in Warsaw, Poland (see Fig. 1).
The ultrasonic waves, propagating through the examined meat samples, were generated and detected with custom designed piezo-electric transducers, with LiNbO3, Y-36 ◦ cut piezoelectric elements, provided by (Roditi, USA). The resonant frequency of the transducers was f = 5 MHz.
The ultrasonic transmitting transducers was driven by the state-of- the-art TB1000 pulser-receiver board (Matec, USA). The electric signal from the receiving ultrasonic transducer was amplified in the pulser- receiver board and sent further to the fast PDA1000 digitizer board (Signatec, USA) operating at a sampling rate of 62.5 Mega samples per second. After acquisition the digitized ultrasonic signal was digitally filtered and subsequently averaged 1024 times to further improve the signal to noise ratio (S/N), of the signal. The digital ultrasonic signals, after processing, were displayed in real time on the monitor, enabling therefore for visual control and eventual adjustments by the operator.
The measurement process and the instrumentation were controlled by a custom designed software written in the Microsoft Visual C ++, using object-oriented-technology. The digitizer board and ultrasonic board were enclosed within an industrial PC computer (Berta, Trans-duction Computers, Mississauga, Ontario, Canada), providing stable, temperature controlled and noise free environment.
Fig. 1 sketches only a general diagram of connections of the ultra-sonic measurement system, with the ultrasonic pulser-receiver and the digitizer shown as separate stand-alone devices. In the actual measure-ment system the TB1000 ultrasonic board and PDA1000 digitizer board were totally enclosed within an industrial PC computer (Berta), providing signal processing, signal visualization and data saving capabilities.
The velocity c of longitudinal ultrasonic waves, propagating in the investigated meat samples was determined from measurements of the Time-of -Flight (TOF) τd for two selected ultrasonic impulses travelling between the transmitting and receiving transducers (a through- transmission method), see (Kiełczynski et al., 2014a, Kiełczynski et al., 2014b). The Time-of-Flight (TOF) was determined digitally using a cross-correlation method (Kiełczynski et al., 2015, Kiełczynski et al., 2019). The maximum of the cross-correlation function, between the two selected impulses, corresponds to the Time-of-Flight (TOF) between the ultrasonic impulses in the investigated meat samples.
Relative changes in the Time-of-Flight can be determined with a very high precision (of the order of hundreds picoseconds). The uncertainty in determination of the ultrasonic path and the impact of other sys-tematic errors bound the uncertainty in determination of ultrasonic velocity to ± 0.1%.
The velocity c of propagation of the ultrasonic wave in the investi-gated meat samples was determined from the elementary relation c =
K. Wieja et al.
Food Chemistry 348 (2021) 128907
4
TOF/L; where L is the distance between the two transducers in the examined meat material.
The distance L between two (sending and receiving) piezoelectric transducers was evaluated based on calibration measurements per-formed in distilled water at controlled temperature and pressure.
Knowing, with a high accuracy the speed of sound in water at a given temperature (from NIST Steam Tables) and measuring the Time-of- Flight, the distance L between the transducers was calculated from the elementary formula L = c × TOF.
By constructing the custom designed measurement system, the au-thors aimed to achieve the following two main goals: 1) high accuracy in measurements of the Time-of-Flight (velocity) of ultrasonic signals and 2) computerization of the measurement process in order to mitigate and finally eliminate the operator’s errors that might influence the whole measurement process. Such a high accuracy of measurements (±0.1%) is virtually not achievable with the commercially available measuring equipment, accessible on the market.
The ultrasonic velocity was measured in five (5) different types of the investigated meat, i.e., in 1) minced HD chicken fillets, 2) low pressure MSM samples from chicken carcasses, 3) low pressure MSM samples from chicken collarbones, 4) high pressure MSM samples from chicken carcasses and 5) high pressure MSM samples from chicken collarbones. In each of these 5 types of meat, the ultrasonic velocity was measured 5 times for 5 randomly selected different samples of a given type of meat. After completion of every ultrasonic measurement of velocity, the investigated meat sample was removed from the measurement chamber. Subsequently, before the next consecutive measurement, the chamber was carefully rinsed with water and dried-up.
2.4. Statistical analysis
In this work, all statistical analyses were performed with STATIS-TICA 12.5 (TIBCO Software, Palo Alto, USA) software package.
All measurements (for ultrasonic velocity and each of 7 physico-chemical parameters of meat) were performed using five (5) randomly extracted meat samples, for each of the five (5) types of meat. Conse-quently, 5 × 5 = 25 independent ultrasonic velocity measurements were conducted (see Table 2). Similarly, 5 × 5 × 7 = 175 independent measurements were carried out to evaluate the seven (7) physico-chemical parameters of meat (see Table 1). The ultrasonic measure-ments were performed in a stable temperature controlled environment. The ultrasonic measurements of the time-of-flight and hence the ultra-sonic velocity were of very high repeatability and precision, due to the employment of sophisticated signal processing procedures and pro-prietary controlling software. As a result, we observed high repeatability and reproducibility of the ultrasonic measurements presented in this study.
In order to determine the significant differences between mean values of the ultrasonic velocity in various kinds of meat, we performed the following statistical analyzes: 1) Shapiro-Wilk test to check the normality of the distribution, 2) Levene’s test to investigate homoge-neity of variances and 3) one-way ANOVA analysis along with post-hoc Tukey tests.
To assess the correlation between the measured ultrasonic velocity and the chemical composition of meat samples we measured the content of 1) protein, 2) fat, 3) calcium, 4) phosphorus, 5) sodium, 6) water, and 7) the density of the investigated meat samples using standard methods of the analytical chemistry. Subsequently, the obtained results of mea-surements (ultrasonic and chemical) were analyzed statistically in order to determine the corresponding correlation coefficients and linear regression equations.
Fig. 1. Schematic diagram of the computerized measurement system.
K. Wieja et al.
Food Chemistry 348 (2021) 128907
5
3. Experimental results
3.1. Measurement of physicochemical parameters of the investigated meat samples
Employing the chemical analytical methods described in subsection 2.2, a series of physicochemical parameters of the investigated meat samples were measured.
The obtained results of chemical measurements were processed statistically using one-way analysis of variance (ANOVA) procedures and post-hoc Tukey tests.
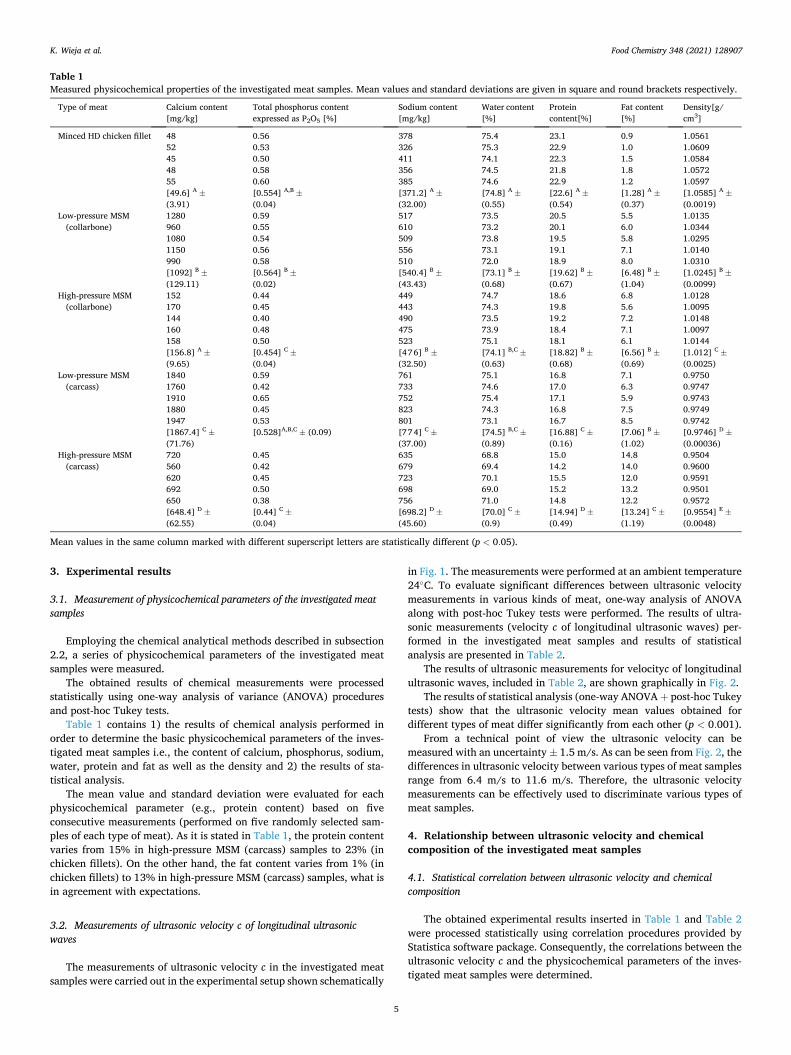
Table 1 contains 1) the results of chemical analysis performed in order to determine the basic physicochemical parameters of the inves-tigated meat samples i.e., the content of calcium, phosphorus, sodium, water, protein and fat as well as the density and 2) the results of sta-tistical analysis.
The mean value and standard deviation were evaluated for each physicochemical parameter (e.g., protein content) based on five consecutive measurements (performed on five randomly selected sam-ples of each type of meat). As it is stated in Table 1, the protein content varies from 15% in high-pressure MSM (carcass) samples to 23% (in chicken fillets). On the other hand, the fat content varies from 1% (in chicken fillets) to 13% in high-pressure MSM (carcass) samples, what is in agreement with expectations.
3.2. Measurements of ultrasonic velocity c of longitudinal ultrasonic waves
The measurements of ultrasonic velocity c in the investigated meat samples were carried out in the experimental setup shown schematically
in Fig. 1. The measurements were performed at an ambient temperature 24◦C. To evaluate significant differences between ultrasonic velocity measurements in various kinds of meat, one-way analysis of ANOVA along with post-hoc Tukey tests were performed. The results of ultra-sonic measurements (velocity c of longitudinal ultrasonic waves) per-formed in the investigated meat samples and results of statistical analysis are presented in Table 2.
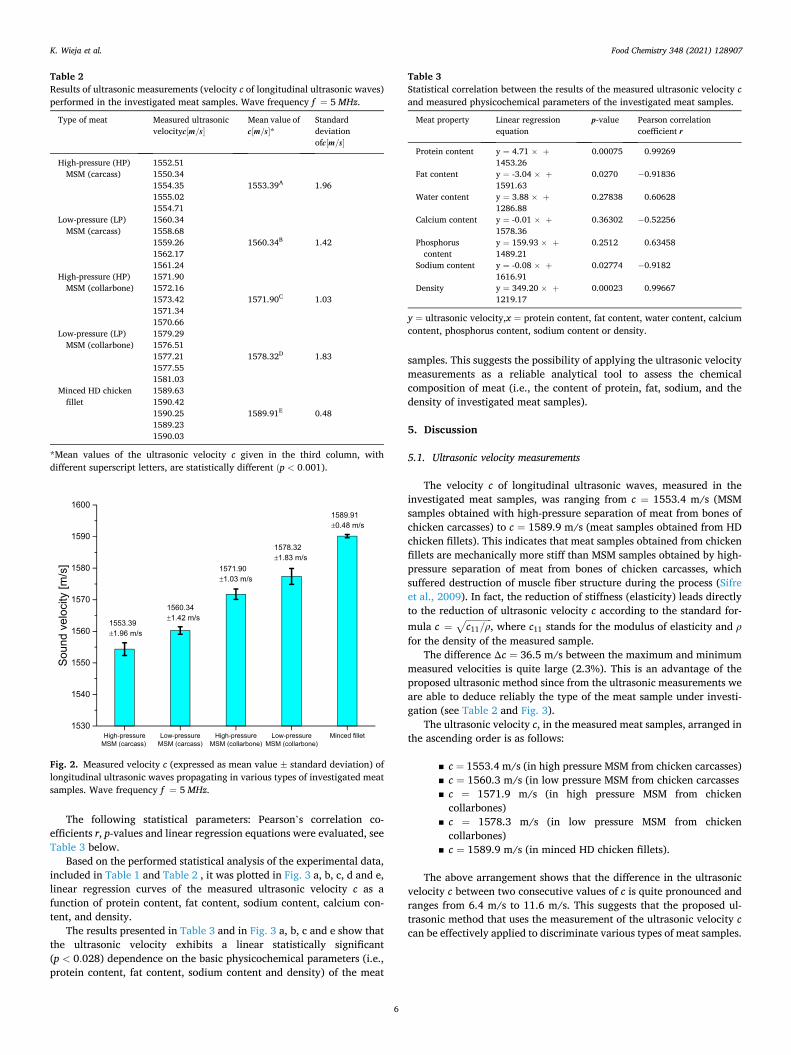
The results of ultrasonic measurements for velocityc of longitudinal ultrasonic waves, included in Table 2, are shown graphically in Fig. 2.
The results of statistical analysis (one-way ANOVA + post-hoc Tukey tests) show that the ultrasonic velocity mean values obtained for different types of meat differ significantly from each other (p < 0.001).
From a technical point of view the ultrasonic velocity can be measured with an uncertainty ± 1.5 m/s. As can be seen from Fig. 2, the differences in ultrasonic velocity between various types of meat samples range from 6.4 m/s to 11.6 m/s. Therefore, the ultrasonic velocity measurements can be effectively used to discriminate various types of meat samples.
4. Relationship between ultrasonic velocity and chemical composition of the investigated meat samples
4.1. Statistical correlation between ultrasonic velocity and chemical composition
The obtained experimental results inserted in Table 1 and Table 2 were processed statistically using correlation procedures provided by Statistica software package. Consequently, the correlations between the ultrasonic velocity c and the physicochemical parameters of the inves-tigated meat samples were determined.
Table 1 Measured physicochemical properties of the investigated meat samples. Mean values and standard deviations are given in square and round brackets respectively.
Type of meat Calcium content [mg/kg]
Total phosphorus content expressed as P2O5 [%]
Sodium content [mg/kg]
Water content [%]
Protein content[%]
Fat content [%]
Density[g/ cm3]
Minced HD chicken fillet 48 52 45 48 55
0.56 0.53 0.50 0.58 0.60
378 326 411 356 385
75.4 75.3 74.1 74.5 74.6
23.1 22.9 22.3 21.8 22.9
0.9 1.0 1.5 1.8 1.2
1.0561 1.0609 1.0584 1.0572 1.0597
[49.6] A ±
(3.91) [0.554] A,B ±
(0.04) [371.2] A ±
(32.00) [74.8] A ±
(0.55) [22.6] A ±
(0.54) [1.28] A ±
(0.37) [1.0585] A ±
(0.0019) Low-pressure MSM
(collarbone) 1280 960 1080 1150 990
0.59 0.55 0.54 0.56 0.58
517 610 509 556 510
73.5 73.2 73.8 73.1 72.0
20.5 20.1 19.5 19.1 18.9
5.5 6.0 5.8 7.1 8.0
1.0135 1.0344 1.0295 1.0140 1.0310
[1092] B ±
(129.11) [0.564] B ±
(0.02) [540.4] B ±
(43.43) [73.1] B ±
(0.68) [19.62] B ±
(0.67) [6.48] B ±
(1.04) [1.0245] B ±
(0.0099) High-pressure MSM
(collarbone) 152 170 144 160 158
0.44 0.45 0.40 0.48 0.50
449 443 490 475 523
74.7 74.3 73.5 73.9 75.1
18.6 19.8 19.2 18.4 18.1
6.8 5.6 7.2 7.1 6.1
1.0128 1.0095 1.0148 1.0097 1.0144
[156.8] A ±
(9.65) [0.454] C ±
(0.04) [476] B ±
(32.50) [74.1] B,C ±
(0.63) [18.82] B ±
(0.68) [6.56] B ±
(0.69) [1.012] C ±
(0.0025) Low-pressure MSM
(carcass) 1840 1760 1910 1880 1947
0.59 0.42 0.65 0.45 0.53
761 733 752 823 801
75.1 74.6 75.4 74.3 73.1
16.8 17.0 17.1 16.8 16.7
7.1 6.3 5.9 7.5 8.5
0.9750 0.9747 0.9743 0.9749 0.9742
[1867.4] C ±
(71.76) [0.528]A,B,C ± (0.09) [774] C ±
(37.00) [74.5] B,C ±
(0.89) [16.88] C ±
(0.16) [7.06] B ±
(1.02) [0.9746] D ±
(0.00036) High-pressure MSM
(carcass) 720 560 620 692 650
0.45 0.42 0.45 0.50 0.38
635 679 723 698 756
68.8 69.4 70.1 69.0 71.0
15.0 14.2 15.5 15.2 14.8
14.8 14.0 12.0 13.2 12.2
0.9504 0.9600 0.9591 0.9501 0.9572
[648.4] D ±
(62.55) [0.44] C ±
(0.04) [698.2] D ±
(45.60) [70.0] C ±
(0.9) [14.94] D ±
(0.49) [13.24] C ±
(1.19) [0.9554] E ±
(0.0048)
Mean values in the same column marked with different superscript letters are statistically different (p < 0.05).
K. Wieja et al.
Food Chemistry 348 (2021) 128907
6
The following statistical parameters: Pearson’s correlation co-efficients r, p-values and linear regression equations were evaluated, see Table 3 below.
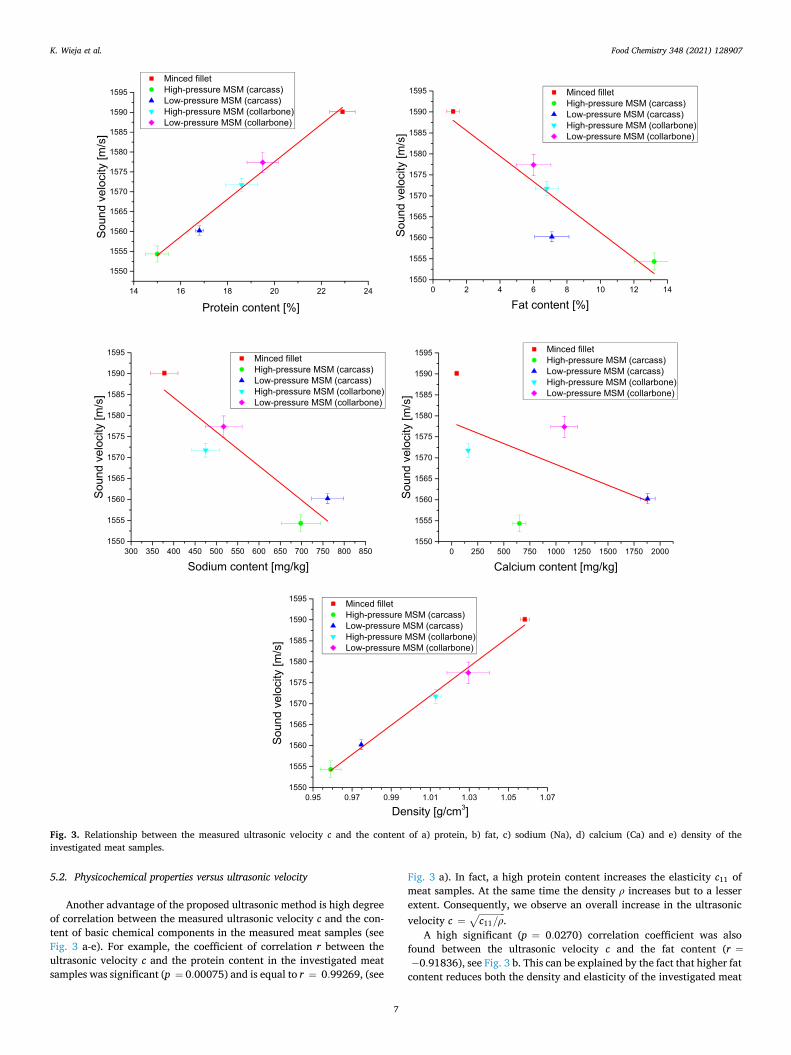
Based on the performed statistical analysis of the experimental data, included in Table 1 and Table 2 , it was plotted in Fig. 3 a, b, c, d and e, linear regression curves of the measured ultrasonic velocity c as a function of protein content, fat content, sodium content, calcium con-tent, and density.
The results presented in Table 3 and in Fig. 3 a, b, c and e show that the ultrasonic velocity exhibits a linear statistically significant (p < 0.028) dependence on the basic physicochemical parameters (i.e., protein content, fat content, sodium content and density) of the meat
samples. This suggests the possibility of applying the ultrasonic velocity measurements as a reliable analytical tool to assess the chemical composition of meat (i.e., the content of protein, fat, sodium, and the density of investigated meat samples).
5. Discussion
5.1. Ultrasonic velocity measurements
The velocity c of longitudinal ultrasonic waves, measured in the investigated meat samples, was ranging from c = 1553.4 m/s (MSM samples obtained with high-pressure separation of meat from bones of chicken carcasses) to c = 1589.9 m/s (meat samples obtained from HD chicken fillets). This indicates that meat samples obtained from chicken fillets are mechanically more stiff than MSM samples obtained by high- pressure separation of meat from bones of chicken carcasses, which suffered destruction of muscle fiber structure during the process (Sifre et al., 2009). In fact, the reduction of stiffness (elasticity) leads directly to the reduction of ultrasonic velocity c according to the standard for-mula c =
c11/ρ
√, where c11 stands for the modulus of elasticity and ρ
for the density of the measured sample. The difference Δc = 36.5 m/s between the maximum and minimum
measured velocities is quite large (2.3%). This is an advantage of the proposed ultrasonic method since from the ultrasonic measurements we are able to deduce reliably the type of the meat sample under investi-gation (see Table 2 and Fig. 3).
The ultrasonic velocity c, in the measured meat samples, arranged in the ascending order is as follows:
▪ c = 1553.4 m/s (in high pressure MSM from chicken carcasses) ▪ c = 1560.3 m/s (in low pressure MSM from chicken carcasses ▪ c = 1571.9 m/s (in high pressure MSM from chicken
collarbones) ▪ c = 1578.3 m/s (in low pressure MSM from chicken
collarbones) ▪ c = 1589.9 m/s (in minced HD chicken fillets).
The above arrangement shows that the difference in the ultrasonic velocity c between two consecutive values of c is quite pronounced and ranges from 6.4 m/s to 11.6 m/s. This suggests that the proposed ul-trasonic method that uses the measurement of the ultrasonic velocity c can be effectively applied to discriminate various types of meat samples.
Table 2 Results of ultrasonic measurements (velocity c of longitudinal ultrasonic waves) performed in the investigated meat samples. Wave frequency f = 5 MHz.
Type of meat Measured ultrasonic velocityc[m/s]
Mean value of c[m/s]*
Standard deviation ofc[m/s]
High-pressure (HP) MSM (carcass)
1552.51 1550.34 1554.35 1555.02 1554.71
1553.39A 1.96
Low-pressure (LP) MSM (carcass)
1560.34 1558.68 1559.26 1562.17 1561.24
1560.34B 1.42
High-pressure (HP) MSM (collarbone)
1571.90 1572.16 1573.42 1571.34 1570.66
1571.90C 1.03
Low-pressure (LP) MSM (collarbone)
1579.29 1576.51 1577.21 1577.55 1581.03
1578.32D 1.83
Minced HD chicken fillet
1589.63 1590.42 1590.25 1589.23 1590.03
1589.91E 0.48
*Mean values of the ultrasonic velocity c given in the third column, with different superscript letters, are statistically different (p < 0.001).
Fig. 2. Measured velocity c (expressed as mean value ± standard deviation) of longitudinal ultrasonic waves propagating in various types of investigated meat samples. Wave frequency f = 5 MHz.
Table 3 Statistical correlation between the results of the measured ultrasonic velocity c and measured physicochemical parameters of the investigated meat samples.
Meat property Linear regression equation
p-value Pearson correlation coefficient r
Protein content y = 4.71 × +
1453.26 0.00075 0.99269
Fat content y = -3.04 × +
1591.63 0.0270 − 0.91836
Water content y = 3.88 × +
1286.88 0.27838 0.60628
Calcium content y = -0.01 × +
1578.36 0.36302 − 0.52256
Phosphorus content
y = 159.93 × +
1489.21 0.2512 0.63458
Sodium content y = -0.08 × +
1616.91 0.02774 − 0.9182
Density y = 349.20 × +
1219.17 0.00023 0.99667
y = ultrasonic velocity,x = protein content, fat content, water content, calcium content, phosphorus content, sodium content or density.
K. Wieja et al.
Food Chemistry 348 (2021) 128907
7
5.2. Physicochemical properties versus ultrasonic velocity
Another advantage of the proposed ultrasonic method is high degree of correlation between the measured ultrasonic velocity c and the con-tent of basic chemical components in the measured meat samples (see Fig. 3 a-e). For example, the coefficient of correlation r between the ultrasonic velocity c and the protein content in the investigated meat samples was significant (p = 0.00075) and is equal to r = 0.99269, (see
Fig. 3 a). In fact, a high protein content increases the elasticity c11 of meat samples. At the same time the density ρ increases but to a lesser extent. Consequently, we observe an overall increase in the ultrasonic velocity c =
c11/ρ
√.
A high significant (p = 0.0270) correlation coefficient was also found between the ultrasonic velocity c and the fat content (r =
− 0.91836), see Fig. 3 b. This can be explained by the fact that higher fat content reduces both the density and elasticity of the investigated meat
Fig. 3. Relationship between the measured ultrasonic velocity c and the content of a) protein, b) fat, c) sodium (Na), d) calcium (Ca) and e) density of the investigated meat samples.
K. Wieja et al.
Food Chemistry 348 (2021) 128907
8
samples. However, the decrease in the elasticity c11 is greater than that in the density ρ. Consequently, we observe the reduction in the ultra-sonic velocity c in the measured meat samples.
It is interesting to note that high significant correlations were also discerned between the ultrasonic velocity c and sodium content (r =− 0.9182 and p = 0.02774), (see Fig. 3 c), and between the ultrasonic velocity c and density ρ (r = 0.99667 and p = 0.00023), (see Fig. 3 e), in the measured meat samples.
It was difficult to determine the significant linear correlation be-tween the ultrasonic wave velocity and the phosphorus and water con-tent, see Table 3, due to the low variability of the phosphorus and water content in the investigated samples.
5.2.1. Calcium content The experimental data (see Table 1 and Fig. 3 d) show a large spread
of the calcium (Ca) content in the investigated meat samples. The lowest calcium (Ca) content was found in the samples of minced HD chicken fillets, as expected. Surprisingly, the highest calcium (Ca) content was found in samples obtained by low-pressure methods, i.e., a) low pressure MSM samples from chicken carcasses and b) low pressure MSM samples from chicken collarbones.
This was not the case in samples obtained by high pressure methods, i.e., c) high pressure MSM samples from chicken carcasses and d) high pressure MSM samples from chicken collarbones.
The above finding can be explained by the fact that the low-pressure methods used with the appropriate exploitation parameter setup may result in meat products with a relatively high bone content, larger than that resulting from the use of high-pressure methods. Moreover, the calcium content in the MSM and HD meat samples varies depending on the animal species, part of the carcass and a method (technical condi-tions) used for meat recovery.
The results of the statistical analysis show that the ultrasonic velocity and calcium content are weakly correlated (r = − 0.52256) with a very low significance (p = 0.363). Therefore, we can conclude that there is no significant linear relationship between the ultrasonic velocity and calcium content. Consequently, the calcium content cannot be used as a reliable indicator for the meat identification in the industrial environment.
The measurements of the ultrasonic velocity performed in this paper show high statistically significant (p < 0.001) differences between mean values of the ultrasonic wave velocity in various kinds of investigated meat samples. Therefore, the ultrasonic measurements of velocity can be recommended as a rapid and effective analytical technique for identi-fying various classes of meat, e.g., in order to differentiate hand- deboned meat (HD) from mechanically separated meat (MSM).
The results obtained in this study are new and original. The literature reports show that up to date, the ultrasonic examination of meat was mainly focused on:
1) estimation the composition of meat (Benedito et al., 2001; Laksh-manan et al., 2012)
2) determining the structure of meat (Koch et al., 2011b) 3) evaluation of marbling in meat samples (Ludwiczak et al., 2017).
By contrast, our study aims at achieving ultrasonic discrimination of MSM meat from HB meat employing ultrasonic velocity measurements.
According to the best of our knowledge, the ultrasonic method, based on ultrasonic velocity measurements, have not yet been used to discriminate various types of meat e.g., to differentiate chicken fillets from mechanically separated chicken meat.
6. Conclusions
The main implications arising from the results of research performed in this work can be summarized as follows:
1. The developed analytical ultrasonic method for identification and investigation of meat samples is rapid and non-destructive and has a potential for an on-line implementation in industrial conditions for real time measurements.
2. The measurements of the ultrasonic velocity c constitute a promising analytical tool to discriminate various types of MSM samples, ob-tained by different methods, in relation to hand deboned meat.
3. The measurements of the ultrasonic velocity can be used as well to evaluate quantitatively the basic physicochemical parameters of meat samples, i.e., the content of protein, fat and sodium, as well as the density of meat samples.
4. High statistically significant correlation was observed between the ultrasonic wave velocity and a) protein content (r = 0.99269 and p =
0.00075), b) fat content (r = − 0.91836 and p = 0.0270), c) sodium content (r = − 0.9182 and p = 0.02774) as well as the density (r = 0.99667 and p = 0.00023), of the meat samples measured (including MSM).
5. The correlation between the ultrasonic velocity c and the content of phosphorus and water in the selected meat samples is moderate and statistically not significant. r = 0.63458 and p = 0.2512 for phos-phorus content, and r = 0.60628 and p = 0.27838 for water content, see Table 3.
6. Since different technological processes lead to different levels of calcium (Ca) content (see the Discussion Section), it is difficult to linearly correlate the Ca content with the ultrasonic velocity c (see Table 3) and consequently with various MSM types. Therefore, the calcium (Ca) content cannot be used as a reliable criterion in iden-tification and investigation of different types of MSM meat.
7. High degree of cross-correlations were also found between protein content, fat content, sodium content and the density. Hence, the evaluation of e.g., protein content can assess the fat content, sodium content and the density of the investigated meat samples.
Taking into account the conclusions No. 2, 3 and 4, presented above, the research hypothesis stated in the Introduction section has been confirmed.
The analytical ultrasonic method, developed by the authors in this paper, can be an attractive alternative to the conventional methods, due to its inherent advantages such as: rapidity, simplicity, low cost, possi-bility of computerization and on-line measurements, simple measure-ment procedure, as well as its ability to identify and quantify different physicochemical parameters in various types of meat (e.g., MSM).
CRediT authorship contribution statement
K. Wieja: Conceptualization. P. Kiełczynski: Supervision, Investi-gation, Formal analysis, Writing - original draft. P. Szymanski: Meth-odology. M. Szalewski: Investigation, Writing - review & editing. A. Balcerzak: Data curation. S. Ptasznik: Resources.
Declaration of Competing Interest
The authors declare that they have no known competing financial interests or personal relationships that could have appeared to influence the work reported in this paper.
References
Alomar, D., Gallo, C., Castaneda, M., & Fuchslocher, R. (2003). Chemical and discriminant analysis of bovine meat by near infrared reflectance spectroscopy (NIRS). Meat Science, 63(4), 441–450. https://doi.org/10.1016/S0309-1740(02) 00101-8.
Benedito, J., Carcel, J. A., Rossello, C., & Mulet, A. (2001). Composition assessment of raw meat mixtures using ultrasonics. Meat Science, 57(4), 365–370. https://doi.org/ 10.1016/S0309-1740(00)00113-3.
Correia, L. R., Mittal, G. S., & Basir, O. A. (2008). Ultrasonic detection of bone fragment in mechanically deboned chicken breasts. Innovative Food Science & Emerging Technologies, 9(1), 109–115. https://doi.org/10.1016/j.ifset.2007.06.004.
K. Wieja et al.
Food Chemistry 348 (2021) 128907
9
Crosland, A. R., Patterson, R. L. S., Higman, R. C., Stewart, C. A., & Hargin, K. D. (1995). Investigation of methods to detect mechanically recovered meat in meat products — I: Chemical composition. Meat Science, 40(3), 289–302. https://doi.org/10.1016/ 0309-1740(94)00060-K.
Dalipi, R., Berneri, R., Curatolo, M., Borgese, L., Depero, L. E., & Sangiorgi, E. (2018). Total reflection X-ray fluorescence used to distinguish mechanically separated from non-mechanically separated meat. Spectrochimica Acta Part B: Atomic Spectroscopy, 148, 16–22. https://doi.org/10.1016/j.sab.2018.06.002.
Damez, J.-L., & Clerjon, S. (2008). Meat quality assessment using biophysical methods related to meat structure. Meat Science, 80(1), 132–149. https://doi.org/10.1016/j. meatsci.2008.05.039.
Day, L.i., & Brown, H. (2001). Detection of mechanically recovered chicken meat using capillary gel electrophoresis. Meat Science, 58(1), 31–37. https://doi.org/10.1016/ S0309-1740(00)00127-3.
Ghaedian, R., Decker, E. A., & McClements, D. J. (1997). Use of Ultrasound to Determine Cod Fillet Composition. Journal of Food Science, 62(3), 500–504. https://doi.org/ 10.1111/j.1365-2621.1997.tb04415.x.
Iammarino, M., Miedico, O., Petrella, A., Mangiacotti, M., & Chiaravalle, A. E. (2019). Innovative approaches for identifying a mechanically separated meat: Evaluation of radiostrontium levels and development of a new tool of investigation. Journal of Food Science and Technology, 57(2), 484–494. https://doi.org/10.1007/s13197-019- 04076-y.
Kamruzzaman, M., ElMasry, G., Sun, D.-W., & Allen, P. (2012). Non-destructive prediction and visualization of chemical composition in lamb meat using NIR hyperspectral imaging and multivariate regression. Innovative Food Science & Emerging Technologies, 16, 218–226. https://doi.org/10.1016/j.ifset.2012.06.003.
Kamruzzaman, M., Barbin, D., ElMasry, G., Sun, D.-W., & Allen, P. (2012). Potential of hyperspectral imaging and pattern recognition for categorization and authentication of red meat. Innovative Food Science & Emerging Technologies, 16, 316–325. https:// doi.org/10.1016/j.ifset.2012.07.007.
Kiełczynski, P., Szalewski, M., Balcerzak, A., Wieja, K., Rostocki, A. J., Siegoczynski, R. M., & Ptasznik, S. (2014). Application of ultrasonic wave celerity measurement for evaluation of physicochemical properties of olive oil at high pressure and various temperatures. LWT - Food Science and Technology, 57(1), 253–259. https://doi.org/10.1016/j.lwt.2014.01.027.
Kiełczynski, P., Szalewski, M., Balcerzak, A., Wieja, K., Malanowski, A., Kosciesza, R., Tarakowski, R., Rostocki, A. J., & Siegoczynski, R. M. (2014). Determination of physicochemical properties of diacylglycerol oil at high pressure by means of ultrasonic methods. Ultrasonics, 54(8), 2134–2140. https://doi.org/10.1016/j. ultras.2014.06.013.
Kiełczynski, P., Szalewski, M., Balcerzak, A., Wieja, K., Rostocki, A. J., & Siegoczynski, R. M. (2015). Ultrasonic evaluation of thermodynamic parameters of liquids under high pressure. IEEE Trans. Ultrason., Ferroelect., Freq. Contr., 62(6), 1122–1131. https://doi.org/10.1109/TUFFC.2015.007053.
Kiełczynski, P. (2017). In Ultrasound in Food Processing: Recent Advances (pp. 115–145). Chichester, UK: John Wiley & Sons, Ltd. https://doi.org/10.1002/9781118964156. ch5.
Kiełczynski, P., Ptasznik, S., Szalewski, M., Balcerzak, A., Wieja, K., & Rostocki, A. J. (2019). Application of Ultrasonic Methods for Evaluation of High-Pressure Physicochemical Parameters of Liquids. Archives of Acoustics, 44, 329–337. https:// doi.org/10.24425/aoa.2019.128496.
Koch, T., Lakshmanan, S., Brand, S., Wicke, M., Raum, K., & Morlein, D. (2011a). Ultrasound velocity and attenuation of porcine soft tissues with respect to structure and composition: I. Muscle. Meat Science, 88(1), 51–58. https://doi.org/10.1016/j. meatsci.2010.12.002.
Koch, T., Lakshmanan, S., Brand, S., Wicke, M., Raum, K., & Morlein, D. (2011b). Ultrasound velocity and attenuation of porcine soft tissues with respect to structure and composition: II. Skin and backfat. Meat Science, 88(1), 67–74. https://doi.org/ 10.1016/j.meatsci.2010.12.004.
Kumar, Y., & Chandrakant Karne, S. (2017). Spectral analysis: A rapid tool for species detection in meat products. Trends in Food Science & Technology, 62, 59–67. https:// doi.org/10.1016/j.tifs.2017.02.008.
Lakshmanan, S., Koch, T., Brand, S., Mannicke, N., Wicke, M., Morlein, D., & Raum, K. (2012). Prediction of the intramuscular fat content in loin muscle of pig carcasses by quantitative time-resolved ultrasound. Meat Science, 90(1), 216–225. https://doi. org/10.1016/j.meatsci.2011.07.004.
Llull, P., Simal, S., Benedito, J., & Rossello, C. (2002). Evaluation of textural properties of a meat-based product (sobrassada) using ultrasonic techniques. Journal of Food Engineering, 53(3), 279–285. https://doi.org/10.1016/S0260-8774(01)00166-2.
Ludwiczak, A., Stanisz, M., Lisiak, D., Janiszewski, P., Bykowska, M., Składanowska, J., & Slosarz, P. (2017). Novel ultrasound approach for measuring marbling in pork. Meat Science, 131, 176–182. https://doi.org/10.1016/j.meatsci.2017.05.013.
Nowak, K. W., Markowski, M., & Daszkiewicz, T. (2015). Ultrasonic determination of mechanical properties of meat products. Journal of Food Engineering, 147, 49–55. https://doi.org/10.1016/j.jfoodeng.2014.09.024.
Oliveira, I. S.d., Lourenço, L.d. F. H., Sousa, C. L., Peixoto Joele, M. R. S., & Ribeiro, S. d. C.d. A. (2015). Composition of MSM from Brazilian catfish and technological properties of fish flour. Food Control, 50, 38–44. https://doi.org/10.1016/j. foodcont.2014.08.018.
Pickering, K., Evans, C. L., Hargin, K. D., & Stewart, C. A. (1995). Investigation of methods to detect mechanically recovered meat in meat products — III: Microscopy. Meat Science, 40(3), 319–326. https://doi.org/10.1016/0309-1740(94)00062-C.
Pickering, K., Griffin, M., Smethurst, P., Hargin, K. D., & Stewart, C. A. (1995). Investigation of methods to detect mechanically recovered meat in meat products — IV: Immunology. Meat Science, 40(3), 327–336. https://doi.org/10.1016/0309-1740 (94)00063-D.
Pospiech, M., Zikmund, T., Javůrkova, Z., Kaiser, J., & Tremlova, B. (2019). An Innovative Detection of Mechanically Separated Meat in Meat Products. Food Analytical Methods, 12(3), 652–657. https://doi.org/10.1007/s12161-018-1394-8.
de Prados, M., Fulladosa, E., Gou, P., Munoz, I., Garcia-Perez, J. V., & Benedito, J. (2015). Non-destructive determination of fat content in green hams using ultrasound and X-rays. Meat Science, 104, 37–43. https://doi.org/10.1016/j. meatsci.2015.01.015.
de Prados, M., Garcia-Perez, J. V., & Benedito, J. (2016). Ultrasonic characterization and online monitoring dry salting process”. Food Control, 60, 646–655. https://doi.org/ 10.1016/j.foodcont.2015.09.009.
Prieto, N., Andres, S., Giraldez, F. J., Mantecon, A. R., & Lavín, P. (2006). Potential use of near infrared reflectance spectroscopy (NIRS) for the estimation of chemical composition of oxen meat samples. Meat Science, 74(3), 487–496. https://doi.org/ 10.1016/j.meatsci.2006.04.030.
Sarakatsianos, I., Manousi, N., Georgantelis, D., Goula, A., Adamopoulos, K., & Samanidou, V. (2018). Detection of mechanically deboned meat in cold cuts by inductively coupled plasma-mass spectrometry. Pakistan Journal of Analytical & Environmental Chemistry, 19, 115–121. https://doi.org/10.21743/pjaec/2018.12.12.
Savage, A. W. J., Ian Richardson, R., Jolley, P. D., Hargin, K. D., & Stewart, C. A. (1995). Investigation of methods to detect mechanically recovered meat in meat products — II: Gel electrophoresis. Meat Science, 40(3), 303–317. https://doi.org/10.1016/0309- 1740(94)00061-B.
Sifre, L., Andre, B., & Coton, J.-P. (2009). Development of a system to quantify muscle fibre destructuration. Meat Science, 81(3), 515–522. https://doi.org/10.1016/j. meatsci.2008.10.009.
Skarpeid, H.-J., Moe, R. E., & Indahl, U. G. (2001). Detection of mechanically recovered meat and head meat from cattle in ground beef mixtures by multivariate analysis of isoelectric focusing protein profiles. Meat Science, 57(3), 227–234. https://doi.org/ 10.1016/S0309-1740(00)00040-1.
Surowiec, I., Koistinen, K. M., Fraser, P. D., & Bramley, P. M. (2011). Proteomic approach for the detection of chicken mechanically recovered meat. Meat Science, 89(2), 233–237. https://doi.org/10.1016/j.meatsci.2011.04.004.
Surowiec, I., Fraser, P. D., Patel, R., Halket, J., & Bramley, P. M. (2011). Metabolomic approach for the detection of mechanically recovered meat in food products. Food Chemistry, 125(4), 1468–1475. https://doi.org/10.1016/j.foodchem.2010.10.064.
Taufig, M., Khairi, M., Sallehuddin, I., & Md Yunus, M.A. (2016). Contact and non- contact ultrasonic measurement in the food industry: a review. Measurement Science and Technology, 27, 012001. pp. 23. DOI: 10.1088/0957-0233/27/1/012001.
Tomaiuolo, M., Chiaravalle, A. E., Mangiacotti, M., Petrella, A., Di Taranto, A., & Iammarino, M. (2019). Innovative techniques for identifying a mechanically separated meat: Sample irradiation coupled to electronic spin resonance. European Food Research and Technology, 245(10), 2331–2341. https://doi.org/10.1007/ s00217-019-03340-x.
Tremlova, B., Sarha, P., Pospiech, M., Buchtova, H., & Randulova, Z. (2006). Histological analysis of different kinds of mechanically recovered meat. Archiv für Lebensmittelhygiene, 57, 85–91.
Wubshet, S. G., Wold, J. P., Bocker, U., Sanden, K. W., & Afseth, N. K. (2019). Raman spectroscopy for quantification of residual calcium and total ash in mechanically deboned chicken meat. Food Control, 95, 267–273. https://doi.org/10.1016/j. foodcont.2018.08.017.
K. Wieja et al.