Embed Size (px)
Citation preview

www.elsevier.com/locate/foodchem
Food Chemistry 105 (2007) 353–363
FoodChemistry
Identification and quantification of antioxidants in Fructus lycii
Kim Le a, Francis Chiu b, Ken Ng a,*
a Department of Pharmaceutics, Faculty of Pharmacy, Monash University, 381 Royal Parade, Melbourne, Vic. 3052, Australiab Centre for Drug Candidate Optimisation, Faculty of Pharmacy, Monash University, 381 Royal Parade, Melbourne, Vic. 3052, Australia
Received 14 July 2006; received in revised form 30 October 2006; accepted 24 November 2006
Abstract
Fructus lycii was extracted with 95% ethanol and the flavonoid content was determined to be 1.56 mg quercetin-equivalents/g extract.The following antioxidative activities were determined in the extract: (a) radical-scavenging activity (80 lmol trolox equivalent antiox-idant capacity/g), measured by its ability to scavenge 2,20-azinobis-3-ethylbenzothiazoline-6-sulfonic acid radical, (b) reducing capacity(301 lmol trolox equivalent reducing capacity/g), measured by its ability to directly donate an electron in the reduction of Fe(III) toFe(II), and (c) chelating activity (2.5 lmol ethylenediamine-tetraaceticacid equivalents/g), measured by its ability to remove Fe(II) ionfrom complexation with ferrozine. Three flavonol species in the extract were identified and quantitated by reversed-phase HPLC andtheir structures confirmed by electrospray ionization-mass spectroscopy: kaempferol (135 lg/g), quercetin (296 lg/g) and myricetin(247 lg/g). These results showed that F. lycii contains substantial amounts of the three antioxidative activities and is rich in flavonoids.The three flavonols accounted for 43% of total flavonoid content.� 2006 Elsevier Ltd. All rights reserved.
Keywords: Fructus lycii; Lycium barbarum; Antioxidant activity; TEAC; APTS; Reducing capacity; Iron chelating activity; Flavonols; Kaempferol;Quercetin; Myricetin
1. Introduction
The interest in many traditional herbs and plant foodsupplements, as a source of nutritional antioxidants, isdue to our increasing knowledge of the role of antioxidantsand free radicals in human heath and disease (for reviews,see Halliwell, 1994; Higdon & Frei, 2003; Scalbert, Man-ach, Moran, & Remesy, 2005; Willcox, Ash, & Catignani,2004). Plant materials contain a diverse group of phenoliccompounds with antioxidant activity, including flavonoids,lignans and stilbenes, and simple phenolic acids, such ashydroxybenzoic acids and hydroxycinnamic acids (Bravo,1998). The flavonoid class is the most prominent and themost important plant antioxidant (Higdon & Frei, 2003).Flavonoid sub-classes include flavones, isoflavones, flava-nones, flavonols, flavanols (catechins and gallocatechins),
0308-8146/$ - see front matter � 2006 Elsevier Ltd. All rights reserved.
doi:10.1016/j.foodchem.2006.11.063
* Corresponding author. Tel.: +61 3 9903 9606; fax: +61 3 9903 9583.E-mail address: [email protected] (K. Ng).
chalcones and anthocyanidins. To add to the structuraldiversity, as much as 90% of flavonoids isolated from plantsources are glycosylated with one or more sugars linked toan OH group (O-glycosides) or through carbon bonds(C-glycosides). Glucose, galactose and rhamnose are thepredominant neutral sugars found (Bravo, 1998; Hollman& Katan, 1998; Williams & Grayer, 2004).
The antioxidative activities of flavonoids are multifac-eted. Most flavonoids possess the ability to scavenge freeradicals by acting as hydrogen as well as electron donors.Some flavonoids can also act as antioxidant by direct reac-tion with radicals to form less reactive products, and somespecies possess a capacity to chelate transition elements.Metal chelation is an important antioxidant activity astransition ions such as iron and copper can participate inradical production, as pro-oxidants, through the Fentonreaction (Lloyd, Hanna, & Mason, 1997). Some flavonoidsare also strong inhibitors of certain metabolic enzymes inthe body that generate free radical products such as cyclo-oxygenase, lipooxygenase, monoamine oxidase, xanthine

354 K. Le et al. / Food Chemistry 105 (2007) 353–363
oxidase, inducible nitric oxide synthase and some Phase Iand II detoxifying enzymes (Higdon & Frei, 2003; Willcoxet al., 2004).
The common structural features of flavonoids are thepresence of aromatic rings and hydroxyl group(s), withsome species being more potent than vitamin E as hydro-gen donors. The hydrogen-donating antioxidative activitydepends on the number and position of the hydroxyl groupin the flavonoid structure and on other types of substituentthat may be electron-withdrawing or electron-donatinggroups (for reviews on structure–activity relationships,see Heims, Tagliaferro, & Bobilya, 2002; Montoro, Braca,Pizza, & Tommasi, 2005; Rice-Evans, Miller, & Paganga,1996; Silva et al., 2002). This is due to hydrogen donationdependent on the acidity of the phenolic hydrogen. Anincrease in hydroxylation of the gallate moiety (Ring B),for example, increases acidity of the para substitutedhydroxyl hydrogen and hence increases hydrogen-donatingability. This structural feature can be seen in flavonols,such as myricetin, quercetin and kaempferol (Fig. 1). Theantioxidant potency increases from kaempferol, quercetinto myricetin, which coincides with the increase hydroxyl-ation pattern of the gallate moiety.
Lycium barbarum and L. chinese are two closely relatedspecies belonging to the family Solanaceae (Zhu, 1998).They are medicinal plants native to China but are now alsowidely found in Korea, Japan and also, to a lesser degree,in other Asian countries. The plant grows as a spreadingshrub, with tiny branches with violet purple flowers, andproduces orange red fruits called Fructus Lycii, also knownas Gouqizi in Chinese. These fruits, which are harvested insummer and autumn, are first dried in the shade and thenexposed to the sun for further drying until the skin is hardand dry but the pulp remains soft for storage and con-sumption. The nutritional interest in F. Lycii is due to itsprominence in the diet of many Asian communities. It istraditionally consumed as a health food supplementcooked as a broth with poultry and as a medicinal elixirfor improving health and vitality in the form of a beverageinfused in liquor.
It is well established that F. lycii has a number of bioac-tive properties. Bioactive compounds isolated from thisfruit include a cerebroside (Kim, Choi, Kim, Kim, & Lee,
Fig. 1. Structures of some flavonols. Kaempferol: 2R = OH;1R = 3R = H; quercetin: 1R = 2R = OH; 3R = H; myricetin: 1R = 2R =3R = OH.
1997), an arabinogalactan-protein (Peng & Tian, 2001),the carotenoids lutein and xeaxanthin (Leung, Li, Tso, &Lam, 2001) and a pro-vitamin C, 2-O-(b-D-glucopyrano-syl)ascorbic acid (Toyoda-Ono et al., 2004). The cerebro-side was found to protect primary cultured rathepatocytes exposed to galactosamine-induced hepatotox-icity (Kim, Lee, Kim, Lee, & Kim, 2000). Interest in thearabinogalactan-protein was intense. It was shown to inhi-bit time-and hyperthermia-induced damage in culturedseminiferous epithelium (Wang et al., 2002), the growthof a transplantable sarcoma in rats (Gan, Zhang, Yang,& Xu, 2004), and the proliferation and induction of apop-tosis in a human hepatoma cell line (Zhang et al., 2005).Furthermore, the arabinogalactan-protein was found toup-regulate expression of interleukin-2 and tumor necrosisfactor-a at both mRNA and protein levels in humanperipheral blood mononuclear cells (Gan, Zhang, Liu, &Xu, 2003), reduce blood glucose and serum cholesteroland triglyceride levels in rabbit (Luo, Cai, Yan, Sun, &Corke, 2004), and protect rats against carbon tetrachlo-ride-induced hepatotoxicity (Ha et al., 2005).
The nutritional value of F. lycii as a source of antioxi-dant was also recognized by many investigators (referencesabove). Several studies have reported the antioxidant activ-ity of F. lycii from L. barbarum and L. chinese. However, aquantitative assessment and an elucidation of the nature ofthe antioxidative activity are often lacking (Ha et al., 2005;Liu, Ogata, Sato, Unoura, & Onodera, 2001; Nam &Kang, 2004; Wu, Ng, & Lin, 2004; Yim & Ko, 2002).
Kosar, Altintas, Kirimer, and Baser (2003) and Qian,Liu, and Huang (2004) quantitatively determined the anti-oxidant activity in F. lycii from L. barbarum, using 1,10-diphenyl-2-picrylbiphenyl (DPPH) radical. Luo et al.(2004) quantitated the trolox equivalent antioxidant capac-ity (TEAC) and oxygen radical antioxidant capacity(ORAC) in the same fruit. However, the DPPH, TEACand ORAC assays measure scavenging of free radicalsonly. Quantitative determination of other antioxidativeactivities as an expression of antioxidant activity, such asreducing power and metal chelation, in F. lycii has yet tobe reported. To date, there are only two reported studieson the antioxidant components in F. Lycii, but with contra-dictory conclusions regarding the presence of the flavonolrutin (Kosar et al., 2003; Qian et al., 2004).
We have an on-going interest in the identification andquantification of antioxidants in traditional medicinalplant materials (Hsu, Coupar, & Ng, 2006). In recent yearsLC–MS and GC–MS have been applied to unambiguouslyidentify the structures of flavonoids in plant extracts andbiological samples with great success (for recent reviews,see Prasain, Wang, & Barnes, 2004; de Rijke et al., 2006).This paper reports the quantification of three antioxidativeactivities and the identification and quantification of threeflavonol antioxidant components in F. Lycii from L. barba-rum by a combination of HPLC and mass spectrometry(MS) methods. The MS was carried out using an LC–MSsetup.

K. Le et al. / Food Chemistry 105 (2007) 353–363 355
2. Materials and methods
2.1. Chemicals
AlCl3, ascorbic acid, butylated hydroxyanisole (BHA),butylated hydroxytoluene (BHT), ethylenediamine-tetraace-ticacid disodium salt dihydrate (EDTANa2 � 2H2O), gallicacid, 6-hydroxy-2,5,7-8-tetramethylchromane-2-carboxylicacid (TroloxTM), iron(III) chloride hexahydrate, iron(II)chloride, myricetin, quercetin, kaempferol, 3-(2-pyridyl)-5,6-diphenyl-1,2,4-triazine-p-p0-disulfonic acid monosodiumsalt (ferrozine), potassium ferricyanide (III), potassium per-sulfate, rutin and 2-thiobarbituric acid were obtained fromSigma–Aldrich Inc. (St Louis, MO, USA). 2,20-Azinobis-3-ethylbenzothiazoline-6-sulfonic acid diammonium salt(ABTS) and trichloroacetic acid were obtained from FlukaChemical Co. (Buchs, Germany). All other common chem-icals and solvents used were of analytical grade and waterwas of Millipore� HPLC Deionized Water grade.
2.2. Equipment and apparatus
UV absorption measurements were performed with aCary 3 Bio UV–Visible Spectrophotometer (Variant).Rotary evaporation under vacuum was performed with aBUCHI RotaVapor RE111 rotary evaporator fitted withwater jet vacuum system and a BUCHI 461 temperature-controlled water bath. Equipments for HPLC and LC–MS are listed under those sections.
2.3. F. lycii
F. Lycii from L. barbarum was purchased from a localherbal supermarket. The fruit was from the Quangdongprovince of China and was imported from China and dis-tributed by New Eastland Pty. Ltd. Australia (23-24Kempson Court, Keysborough, Vic. 3173, Australia).The fruit came as whole sun-dried fruit and was packedunder vacuum.
2.4. Preparation of F. lycii extract
The imported fruit was oven-dried at 105 �C for 6 h.Thirty grams of the dried fruit were crushed using a mortarand pestle and extracted with 600 ml 95% ethanol at 90 �Cwith stirring in a hot water bath. The paste disintegratedinto small particulate pieces after 10 min. The extractionwas continued for 2 h and stood to cool before the extractwas filtered using a 200-mesh stainless steel sieve to obtaina slightly turbid bright red-coloured extract. The extractwas reduced to a small volume by rotary evaporation undervacuum at 40 �C and then freeze-dried. The freeze-driedextract was dissolved in methanol to 100 mg/ml concentra-tion and kept at �20 �C until used. The yield was 13.8 g (46%, w/w).
2.5. Determination of total flavonoid content
Total flavonoid content was determined by reactionwith AlCl3 and quantitated by absorbance measurementaccording to Woisky and Salatino (1998). Appropriatelydiluted extract in ethanol was mixed with 2% AlCl3solution in ethanol. After 1 h at RT the absorbance wasmeasured at 420 nm. The amounts of flavonoids weredetermined from a standard absorbance plot, using querce-tin as standard, and calculated as quercetin-equivalents(mg/g extract).
2.6. ABTS radical-scavenging activity
2,20-Azinobis-3 ethylbenzothiazoline-6-sulfonic acid(ABTS) radical-scavenging activity was measured by directabsorbance measurement of the radical (ABTS�+) accord-ing to Nenadis, Wang, Tsimidou, and Zhang (2004).ABTS�+ was generated by reacting 5 ml of 7 mM aqueousABTS solution with 88 ll of a 140 mM potassium persul-fate solution (final concentration of potassium persulfateequals 2.45 mM). The solution was stored in the dark for16 h and then diluted with ethanol to an absorbance of0.70 ± 0.05 at k734 nm. The reaction mixture (1.00 ml) con-tained 10 ll of test material (F. lycii extract [0–350 lg] ortrolox [0–3 lg]) and 990 ll of the ABTS�+ solution. Themixture was shaken well and allowed to react at RT for20 min. The absorbance of the ABTS�+ solution was mea-sured at k734 nm against an ethanol blank. The assay wasperformed over a range of concentrations and was plottedas a decrease in absorbance versus concentration of testmaterial in mg/ml reaction.
2.7. Reducing power
Reducing power was measured by the direct reductionof Fe3+(CN�)6 to Fe2+(CN�)6 and was determined byabsorbance measurement of the formation of the Perl’sPrussian Blue complex following the addition of excessFe3+, as described by Yen and Chen (1995). The reactionmixture (1.16 ml) contains 160 ll of test material (F. lycii
extract (0–1 mg) or trolox (0–60 lg)), 500 ll of 1% (w/v)potassium ferricyanide (K3Fe3+(CN�)6) in water and500 ll of 0.2 M phosphate buffer, pH 6.6. The mixturewas then incubated for 20 min at 50 �C and the reactionwas terminated by the addition of 500 ll of 10% (w/v) tri-chloroacetic acid, followed by centrifugation for 10 min at3000 rpm. Five hundred microliters of the supernatantwas mixed with 500 ll water and 100 ll 0.1% (w/v) ferricchloride (FeCl3). The absorbance was measured at k700 nm
against the phosphate buffer blank. The reducing capacity(RC0.5 AU) is arbitrarily defined as the concentration oftest material (mg/ml reaction volume) that produces0.5 AU at k700 nm and was obtained from a line of bestfit of the absorbance data using the linear regressionmethod.

356 K. Le et al. / Food Chemistry 105 (2007) 353–363
2.8. Ferrous ion chelating activity
Ferrous ion chelating activity was measured by inhibi-tion of the formation of iron(II)–ferrozine complex aftertreatment of test material with Fe2+, following the methodof Decker and Welch (1990). The reaction mixture(1.50 ml) contained 500 ll test material (F. lycii extract(0–35 mg) or Na2EDTA � 2H2O (0–25 lg)), 100 ll FeCl2(0.6 mM in water) and 900 ll methanol. The controlcontained all the reaction reagents except the extract andEDTA. The mixture was shaken well and allowed to reactat RT for 5 min. One hundred microliters of ferrozine(5 mM in methanol) was then added, the mixture shakenagain, followed by further reaction at RT for 10 min tocomplex the residual Fe2+ ion. The absorbance of theFe2+–ferrozine complex was measured at k562 nm against amethanol blank. The chelating effect was calculated as apercentage, using the equation below, and plotted againstconcentration of test material in mg/ml of reaction mixture.The assay was performed over a range of concentrations(mg/ml reaction volume), such that saturation (completechelation of free iron not bound to antioxidant) wasreached. Because the increase in absorbance was non-linearwith increasing concentration, an EC50 value (defined asthe effective concentration of test material which produces50% of maximal scavenging effect) was obtained from theplot using a non-linear regression algorithm:
Chelating effect ð%Þ ¼ 1�ASample
k562 nm
AControlk562 nm
!� 100
2.9. Deglycosylation of flavonoids
Flavonoid glycosides were degylcosylated by a quantita-tive acid hydrolysis procedure, as described by Hertog,Hollman, and Venema (1992). Twenty milligrams of extractwas dispersed in 4 ml of 62.5% methanol containing2 mg/ml of butylated hydroxyanisole (BHA) as a protectiveantioxidant in a thick screw-cap pyrex� glass tube. The mix-ture was sonicated for 5 min and 1 ml of 6 M hydrochloricacid was then added. The mixture was bubbled with nitro-gen for 60 s to purge dissolved oxygen and then sealedtightly. Hydrolysis was carried out in a 90 �C water bathfor 2 h. After hydrolysis, the mixture was cooled and filteredwith a 0.22 lm membrane filter disc for HPLC.
2.10. HPLC
The reversed phase HPLC system consisted of a LunaTM
(USA) 5 lm particle size C18 silica guard column disc(5 mm length � 4.6 mm diameter) and main column(250 mm length � 4.6 mm diameter) connected to a UVdetector (WatersTM 486, Tunable Absorbance Detector)and a HPLC pump (WatersTM Model 510). Data acquisitionand manipulation were performed with Waters Millen-nium� software. The injection (sample loop) volume was
100 ll and the column developed using a step gradient ofincreasing concentration of acetonitrile (ACN) in acidifiedwater (1% acetic acid, v:v) as follows: 10% ACN (0–10 min), 20% ACN (10–30 min), 30% ACN (30–60 min),40% ACN (60–90 min) and 60% ACN (90–120 min). Atthe end of a run, the column was washed with 100% aceto-nitrile (30 min) and reconditioned in 10% ACN (30 min)before further injection. Optimal detection wavelength forthe flavonoid chromophore was set at k370 nm.
Spiking of flavonol peaks in the extract was performedwith commercially obtained myricetin, quercetin andkaempferol as standard compounds; 0.2 lg of each stan-dard compound was added individually or as a mixtureto 100 ll of the deglycosylated extracts and analyzed byHPLC as described above.
The amount of the three flavonol species in the deglyco-sylated extract was determined from standard calibrationplots. Flavonol concentrations of 0.25, 0.5, 1.0, 2.2,5.0 lg/ml were prepared for each standard (myricetin,quercetin or kaempferol) and subjected to HPLC sepa-rately. The injection volume was 100 ll and the columndeveloped using the same step gradient as described above.The calibration curve was plotted as peak area (arbitraryunits) obtained from absorbance at k370 nm against stan-dard (lg) and the data points fitted into a line of best fitby the linear regression method.
2.11. LC–ESI-MS of putative flavonol peaks from HPLC
The structures of the putative flavonol peaks, separatedand identified by analytical HPLC and spiking with stan-dards, were confirmed by spectroscopic analysis of eachof the recovered peak materials from HPLC by LC–ESI–MS.
Liquid chromatography–electrospray ionization–massspectroscopy (LC–ESI–MS) analysis was conducted inpositive mode electrospray ionisation on a Waters Micro-mass Q-TOF quadrupole time-of-flight mass spectrometercoupled to a Waters 2795 HPLC (Milford, MA, USA).Chromatographic separation was achieved with a water–acetonitrile gradient (containing 0.05% formic acid) at aflow rate of 0.4 ml/min, using a 50 � 2.1 mm i.d., 4 lm par-ticle size Phenomenex Synergi Hydro C18 column (Torrance,CA, USA) maintained at 40 �C. The ionisation of the flavo-nols was optimized at a capillary voltage of 3.2 kV and conevoltage of 40 eV. The following conditions were maintainedduring analysis: desolvation temperature of 350 �C, sourceblock temperature of 90 �C, desolvation gas flow of 400 l/h and cone gas flow of 100 l/h. MS and MS–MS spectra werecollected in the mass range of 100–1000 mass units and col-lision-induced dissociation (CID) experiments were con-ducted with a collision energy of 30 eV.
2.12. Treatment of data
The experimental results for the antioxidative assayswere expressed as means ±1 SD of quadruplicate reactions

Fig. 2. ABTS�+-scavenging activity of: (a) Fructus lycii ethanol extract and(b) trolox. The decreases in absorbance values were directly plotted as themeans of replicate determinations ± SD (n = 4) against test materialconcentration in mg/ml of reaction volume. The data were fitted into a lineof best fit using the linear regression method.
K. Le et al. / Food Chemistry 105 (2007) 353–363 357
and all uncertainties were reported to two significant fig-ures (EURACHEM/CITAC Guide (2000) on ‘‘Quantify-ing Uncertainty in Analytical Measurement”, in ‘‘http://www.measurementuncertainty.org”). Linear regressionand non-linear algorithm plots were performed using Sig-maPlot� (version 9).
3. Results and discussion
3.1. Extraction of F. lycii and total flavonoids content
Imported L. barbarum’s F. lycii from the Quangdongprovince of China was studied for its flavonoid content.F. lycii was oven-dried until the weight was steady (6 h).The oven-dried fruit was extracted with hot 95% ethanolfor 2 h, which yielded 13.8 g of extract (46%, w/w to driedfruit). Total flavonoid content was determined by reactionwith AlCl3 and the Al–flavonoid complex was quantitatedby absorbance measurement at k420 nm and calculated asquercetin equivalents from a quercetin standard plot.The extracts contained 1.56 quercetin-equivalents/gextract of flavonoids, which gave a value of 0.72 mg quer-cetin-equivalents/g of dried fruit. No flavonoids weredetected in the extracted residue, which indicated thatall detectable flavonoids were extracted by the ethanoltreatment.
3.2. ABTS radical-scavenging activity
Antioxidant activity is defined as the ability of a com-pound to inhibit oxidative degradation, such as lipid perox-idation (Roginsky & Lissi, 2005). However, the nature ofthe antioxidant activity could be multifaceted. Hydrogendonation is one such activity and studies on flavonoids,such as catechin, using tert-butoxyl radicals in acetonitrileshowed that the rate of hydrogen donation is very fast,around 1–3 � 108 M�1 s�1 (Cren-Olive, Hapiot, Pinson,& Rolando, 2002), comparable to that of a-tocopherol(Evans, Scaiano, & Ingold, 1992). The hydrogen-donatingactivity is derived mainly from the flavonoid’s A-ringhydroxyl (Cren-Olive, Hapiot, et al., 2002; Cren-Olive,Lebrun, Hapiot, Pinson, & Rolando, 2000; Cren-Olive,Wierulesky, Maes, & Rolando, 2002).
2,20-Azinobis-3 ethylbenzothiazoline-6-sulfonic acid rad-ical (ABTS�+) is a stable organic radical that has gained gen-eral acceptance as the organic radical for use in measuringradical-scavenging activity as an expression of hydrogen-donating antioxidative activity in plant crude extract (Arts,Dallinga, Voss, Haenen, & Bast, 2004; Arts, Dallinga, Voss,Haenen, & Bast, 2003). ABTS�+ strong absorbance, maxi-mum at k734 nm, is well removed from interfering UVabsorption that is often present in a crude extract. This reli-ably permits quantitation by absorbance measurement.Because ABTS�+ is reduced to a colourless product in thepresence of hydrogen-donating antioxidant, the degree ofdiscoloration correlates with the amount of ABTS�+ thatis scavenged. However, reaction with ABTS�+ does not per-
mit a correlation of structure–activity relationships forsome flavonoids due to further scavenging of ABTS�+ bysome reaction products (Arts, Haenen, & Bast, 2004).
The ability of the ethanol extract to donate hydrogen inscavenging ABTS�+ was indicated by a decrease in absor-bance at k734 nm. The results (Fig. 2a) showed a linearcorrelation between concentration of extract (from 0 to0.35 mg/ml reaction tested) and discoloration of theABTS�+ solution. The hydrogen-donating activity of troloxwas similarly measured (Fig. 2b), and was also concentra-tion-dependent.
By relating extract activity to pure compound such astrolox, comparison with the literature values is possible.The trolox equivalence antioxidant capacity (TEAC) ofthe extract can be calculated by comparing the decreasein absorbance to that of trolox on a molar basis (Nenadiset al., 2004). There are a number of methods for this to bedone. The most accurate method is by relating the gradient

Table 1Nature of antioxidative activities in Fructus lycii
Hydrogen-donating activity 80 lmol TEAC/g of extract36 lmol TEAC/g of dried fruit
Electron-donating activity 301 lmol TERC/g of extract138 lmol TERC/g of dried fruit
Iron(II)-chelating activity 2.5 lmol EDTA-E/g of extract1.1 lmol EDTA-E/g of dried fruit
Values in mass were obtained and calculated from data contained in Figs.2–4 and were converted to lmoles using the molecular weights of the purecompounds.
Fig. 3. Reducing capacity of: (a) Fructus lycii ethanol extract and (b)trolox. The increases in absorbance values were directly plotted as themeans of replicate determinations ± SD (n = 4) against test materialconcentration in mg/ml of reaction volume. The data were fitted into a lineof best fit using the linear regression method.
358 K. Le et al. / Food Chemistry 105 (2007) 353–363
of the activity/concentration plot of the extract to that oftrolox, that is, by the ratio of the linear coefficient of theextract to the linear coefficient of the trolox standard plot(Martinez-Tome et al., 2004). This method takes a rangeof values in generating the two gradients for comparison.
The results showed that the extract contained 80 lmolTEAC/g extract or 36 lmol TEAC/g dried fruit (Table1). This value is more than 3.6 times the TEAC valueobtained by Luo et al. (2004) for an 80% methanol extractat 35 �C for 24 h of the same fruit, but originated fromanother region in China.
3.3. Reducing power
The ability of a compound to donate electron in an oxi-dation-reduction reaction can also be used as a measure ofantioxidative activity, and is referred as its reducing capac-ity (or power). This is because reduction of a free radicalconverts it to a less reactive or unreactive product. Flavo-noids are also electron donors and electron donation ismainly derived from the flavonoid’s B-ring (Cren-Olive,Hapiot, et al., 2002; Cren-Olive et al., 2000; Cren-Olive,Teissier, Duriez, & Rolando, 2003; Cren-Olive, Wierulesky,et al., 2002).
The reducing capacity of a compound or crude extractcan be measured by the direct reduction of Fe3+(CN�)6
to Fe2+(CN�)6. Addition of free Fe3+ to the reduced prod-uct leads to the formation of the intense Perl’s PrussianBlue complex, Fe3þ
4 ½Fe2þðCN�Þ6�3, which has a strong
absorbance maximum at k649 nm Again, the visible kmax isfavourable for a crude extract. An increase in absorbanceof the reaction mixture would indicate an increase in reduc-ing capacity due to an increase in the formation of thecomplex.
As shown in Fig. 3a, the extract had strong electron-donating capability, and hence reducing capacity. Absor-bance increased linearly with concentration of extract.Since the electron acceptor (Fe3+(CN�)6) was added inlarge excess in the assay method, the range of concentra-tions (0–1.0 mg/ml reaction) was chosen such that theabsorbance did not exceed 1.5 U, as higher absorbancedecreases the accuracy due to the logarithmic relationbetween absorbance and transmittance. From the absor-bance plot, an arbitrary point at RC0.5 AU (reducing capac-ity at 0.5 absorbance unit) can be obtained to indicate the
potency of a test substance. It is a convenient point forcomparison with an electron-donating antioxidant, suchas trolox (Fig. 3b), to obtain a trolox equivalent reducingcapacity (TERC) value. The RC0.5 AU values were0.43 mg/ml of extract and 0.023 mg/ml of trolox. TheTERC value for the extract was calculated to be 301 lmolTERC/g of extract or 138 lmol TERC/g of dried fruit(Table 1).
This is a substantial amount of reducing capacity. If wetook account of reducing capacity contributed by 2-O-(b-D-glucopyranosyl) ascorbic acid, which Toyoda-Onoet al. (2004) found, and determined in F. lycii to be50 lmol/g dried fruit, and that the reducing capacity ofascorbic is greater than that of trolox (Kim, Lee, Lee, &Lee, 2002), this would indicate that at least 88 lmolTERC/g of dried fruit was derived from other antioxidantcomponents, such as flavonoids.

Fig. 4. Ferrous iron-chelating activity of: (a) Fructus lycii ethanol extractand (b) EDTA. The absorbance values were converted to chelating effect(%) and data were plotted as the means of replicate determinations ± SD(n = 4) against test material concentration in mg/ml of reaction volume.EDTA was added as Na2EDTA � 2H2O. The data were fitted by a non-linear regression algorithm.
K. Le et al. / Food Chemistry 105 (2007) 353–363 359
3.4. Ferrous ion-chelating activity
Most iron is bound to proteins, such as transferring, orheld in storage as ferritin in a low a redox state in the body(Rang, Dale, & Ritter, 1996). This is to prevent its partic-ipation in the Fenton reaction, which is a transitionmetal-catalyzed decomposition of hydrogen or lipid perox-ide into the highly reactive and biologically damaginghydroxyl radical (Halliwell, 1997). With some diets or dis-ease states, overloading of iron in the body can occur andrequires the consumption of exogenous chelators to pre-vent the build-up of free iron circulating in the body. Suchexogenous chelators can be obtained from certain antioxi-dants in food. An antioxidant’s ability to chelate Fe2+ orother transition elements, such as copper, is thus an impor-tant antioxidant property to measure.
One measurement of the metal-chelating activity of anantioxidant is based on absorbance measurement of iron(II)–ferrozine complex after prior treatment of an iron(II) solution with test material. Ferrozine forms a complexwith free Fe2+ but not with Fe2+ bound to other chelators;thus a decrease in the amount of ferrozine–Fe2+ complexformed after treatment indicates the presence of antioxi-dant chelators. The ferrozine–Fe2+ complex produced ared chromophore with absorbance that can be measuredat k562 nm. A significant drawback of this complexationreaction, in measuring the presence of antioxidant chelator,is that the reaction is affected by both the antioxidant–Fe2+
and of ferrozine–Fe2+ complex formation constants andthe competition between the two chelators for binding toiron. Thus a weak antioxidant iron chelator would be seri-ously underestimated in quantitative determination. Froma nutritional point of view, it is not yet possible to accessthe role of a weak antioxidant iron chelator in preventingthe Fenton reaction in vivo. Nonetheless, this reactionserves as a convenient assay to access iron chelating activityof antioxidant.
The results of the chelating assay were plotted as per-centage chelating effect against concentration of test mate-rial (mg/ml of reaction volume). The ethanol extractshowed Fe2+-chelating activity, exhibiting non-linear con-centration-dependent reaction kinetics (Fig. 4a. Thismerely reflects the complex nature of the extract containinga number of different iron chelators, with different affinitiesfor iron, in competition with ferrozine for binding. None-theless, the chelating effect was saturable at high concentra-tion of extract. To evaluate the potency of the extract, theactivity was compared to EDTA, a hexadentate metal ionchelator (Heimbach et al., 2000) with a binding constantfor Fe2+ of 4.9 � 108 M�1 (Kolayli, Ocak, Kucuk, &Abbasoglu, 2004). The reaction kinetics were linear withEDTA at a concentration below the saturating level ofEDTA (Fig. 4b).
Due to the non-linear nature of the reaction in the crudeextract, EC50 values were determined from the plot of che-lating effect (%) against concentration of test material forcomparison. This method is more accurate than compari-
son at a single fixed point. The results obtained were10 mg/ml of extract and 5.6 lg/ml of Na2EDTA � 2 H2O.Again, the EC50 values merely served as a convenient pointfor comparison with a metal chelator such as EDTA. Theactivity of the extract in terms of EDTA equivalence(EDTA-E) was calculated from the EC50 values to be2.5 lmol EDTA-E/g extract or 1.1 lmol EDTA-E/g ofdried fruit (Table 1).
3.5. Identification of flavonols in F. lycii
Kosar et al. (2003) putatively identified a number ofphenolics but noted the absence of rutin in an ethanolextract of L. barbarum’s F. lycii from Turkey, by compar-ing retention times and UV spectrum with standards usingHPLC and a photodiode array detector. Qian et al. (2004)reported the putative identification of a number of flavo-noids but concluded that rutin was the major flavonoidin a similar extract of L. barbarum’s F. lycii from China,

360 K. Le et al. / Food Chemistry 105 (2007) 353–363
also by comparison of retention times in HPLC. Given theincomplete resolution of the extract complex componentsin HPLC, a more reliable method is required for unambig-uous identification and further structural elucidation.
We employed a reversed phase HPLC using a C18 col-umn to separate the antioxidant components in the extract.The antioxidant components of interest in this study werethe flavonols myricetin, quercetin and kaempferol. As such,the detection wavelength for the HPLC was selected at370 nm, the kmax for the flavonol chromophore. The col-umn was developed with a step gradient of increasing ace-tonitrile concentration in water containing 1% acetic acidas an organic acid modifier. To achieve the desired resolu-tion and quantification, the flavonols were deglycosylatedby a quantitative deglycosylation method (Hertog et al.,1992). In terms of nutritional relevance, quantification ofthe aglycone is valid since dietary flavonoid glycosidesare deglycosylated during the process of absorption fromthe lumen of the intestine into the systemic circulation(Manach & Donovan, 2004; Walle, 2004).
Fig. 5 shows a HPLC chromatogram of the deglycosy-lated extract. The myricetin, quercetin and kaempferolpeaks were putatively identified in the extract by spikingwith individual flavonol standards in separate chromatog-raphy. Fig. 6 shows a HPLC chromatogram of the myrice-tin, quercetin and kaempferol peaks spiked with the threestandard compounds injected together. The fact that thepeak co-eluted with standard compound indicates the iden-tity of that peak.
We confirmed the structures of the flavonols by recover-ing the three HPLC peak materials separately and analysisby positive mode electrospray ionization mass spectro-
Fig. 5. HPLC Chromatogram of Fructus lycii ethanol extract. Four hundreddeveloped with a step gradient of increasing acetonitrile concentration.
metry (Fig. 6). The MS–MS spectra of the CID experi-ments (Fig. 7) showed that the expected molecular ionswere observed for kaempferol (C15H10O6; MH+ 287.0556,observed 287.049), quercetin (C15H10O7; MH+ 303.0505,observed 303.052) and myricetin (C15H10O8; MH+
319.0454, observed 319.042). The following fragments wereobserved for kaempferol, quercetin and myricetin, respec-tively, in their CID spectra (Fig. 7) using the nomenclatureof Ma, Li, Van den Heuvel, & Claeys (1997): 0,2B+,121.030, 137.026 and 153.019; 1,3A+, 153.014, 153.021and 153.019 (strong signal due to additional 0,2B+ frag-ment; 0,2A+, 165.015, 165.018 and 165.016; [M + H�46]+,213.048, 229.052 and 245.046. These fragmentationpatterns were consistent with the assigned flavonol struc-tures (Ma et al., 1997; March & Miao, 2004).
The order of elution of the flavonols from HPLC canbe explained by their structures and polarities (Fig. 1).Myricetin, having three hydroxyl groups, eluted first,due to its higher polarity, followed by quercetin withtwo hydroxyl groups while kaempferol, having only onehydroxyl group, eluted last. BHA, added as a protectiveantioxidant in the acid hydrolysis process, eluted atretention time 153 min where it did not interfere withthe chromatography.
The identification of quercetin in F. lycii in our studysupported the report by Qian et al. (2004) since quercetinis derived from rutin after deglycosylation. Nonetheless,Qian et al. (2004) failed to identify kaempferol andmyricetin (or their glycosylated forms) in their extractdue to incomplete resolution of the components in theirHPLC and the limitation of comparing retention times inidentification.
micrograms of deglycosylated extract were injected and the column was

Fig. 6. Co-elution of putative myricetin, quercetin and kaempferol peaks in Fructus lycii ethanol extract with standard compounds from HPLC. Fourhundred micrograms of deglycosylated extract were co-injected with 0.2 lg each of standard myricetin, quercetin and kaempferol to spike the putativepeaks such that each peak area increased approximately 2-fold.
Fig. 7. CID MS–MS spectra of: (a) myricetin, (b) quercetin and (c) kaempferol peak materials isolated from analytical HPLC. Spectra were obtained atcollision energy of 30 eV in positive mode electrospray ionization mass spectroscopy and MS was performed in LC–MS mode.
K. Le et al. / Food Chemistry 105 (2007) 353–363 361
3.6. Quantification of flavonols in F. lycii
A calibration curve, relating mass (lg) to absorbancepeak area (arbitrary units) was obtained by HPLC for eachof the flavonol standards, myricetin, quercetin and kaempf-erol. The calibration curve produced a linear relationshipbetween mass and peak area over a range of 0.025–
0.100 lg of flavonol with r2 equal to 0.9970 or better (datanot shown).
The amounts of myricetin, quercetin and kaempferol inthe extract were obtained from peak area of the individualpeak and the flavonol standard calibration plot. The results(Table 2) showed that the fruit contained 247 lg myricetin,296 lg quercetin and 135 lg kaempferol per g of extract (or
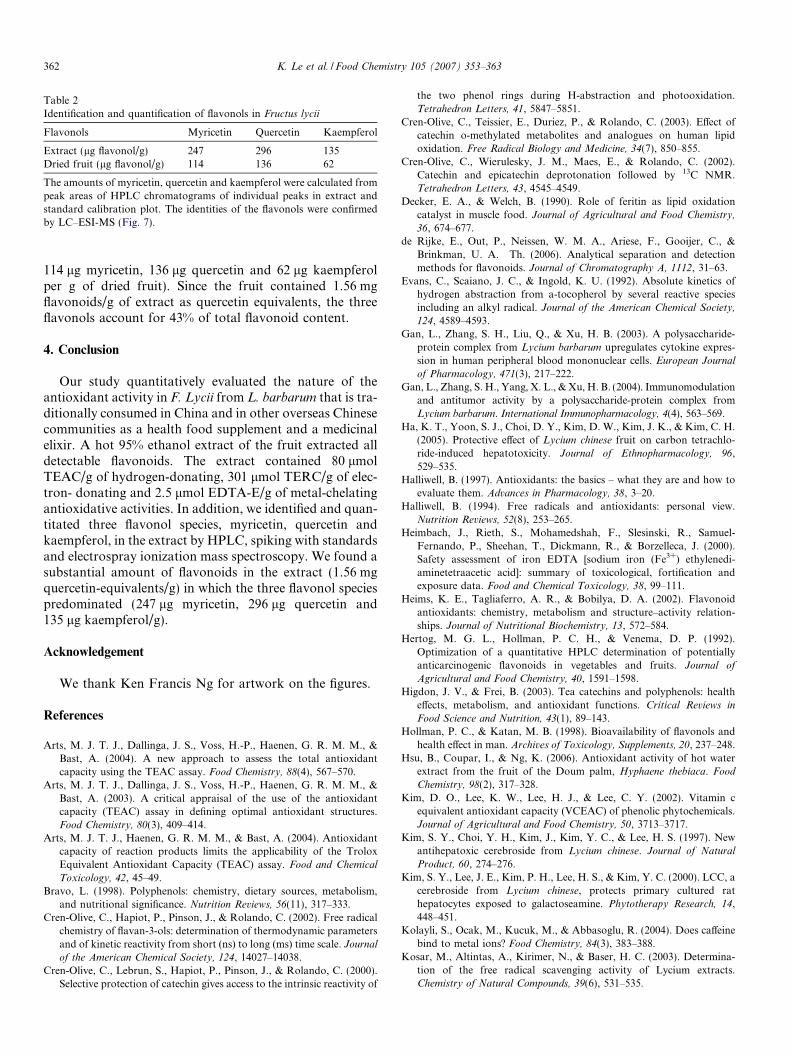
Table 2Identification and quantification of flavonols in Fructus lycii
Flavonols Myricetin Quercetin Kaempferol
Extract (lg flavonol/g) 247 296 135Dried fruit (lg flavonol/g) 114 136 62
The amounts of myricetin, quercetin and kaempferol were calculated frompeak areas of HPLC chromatograms of individual peaks in extract andstandard calibration plot. The identities of the flavonols were confirmedby LC–ESI-MS (Fig. 7).
362 K. Le et al. / Food Chemistry 105 (2007) 353–363
114 lg myricetin, 136 lg quercetin and 62 lg kaempferolper g of dried fruit). Since the fruit contained 1.56 mgflavonoids/g of extract as quercetin equivalents, the threeflavonols account for 43% of total flavonoid content.
4. Conclusion
Our study quantitatively evaluated the nature of theantioxidant activity in F. Lycii from L. barbarum that is tra-ditionally consumed in China and in other overseas Chinesecommunities as a health food supplement and a medicinalelixir. A hot 95% ethanol extract of the fruit extracted alldetectable flavonoids. The extract contained 80 lmolTEAC/g of hydrogen-donating, 301 lmol TERC/g of elec-tron- donating and 2.5 lmol EDTA-E/g of metal-chelatingantioxidative activities. In addition, we identified and quan-titated three flavonol species, myricetin, quercetin andkaempferol, in the extract by HPLC, spiking with standardsand electrospray ionization mass spectroscopy. We found asubstantial amount of flavonoids in the extract (1.56 mgquercetin-equivalents/g) in which the three flavonol speciespredominated (247 lg myricetin, 296 lg quercetin and135 lg kaempferol/g).
Acknowledgement
We thank Ken Francis Ng for artwork on the figures.
References
Arts, M. J. T. J., Dallinga, J. S., Voss, H.-P., Haenen, G. R. M. M., &Bast, A. (2004). A new approach to assess the total antioxidant
capacity using the TEAC assay. Food Chemistry, 88(4), 567–570.Arts, M. J. T. J., Dallinga, J. S., Voss, H.-P., Haenen, G. R. M. M., &
Bast, A. (2003). A critical appraisal of the use of the antioxidant
capacity (TEAC) assay in defining optimal antioxidant structures.Food Chemistry, 80(3), 409–414.
Arts, M. J. T. J., Haenen, G. R. M. M., & Bast, A. (2004). Antioxidant
capacity of reaction products limits the applicability of the Trolox
Equivalent Antioxidant Capacity (TEAC) assay. Food and Chemical
Toxicology, 42, 45–49.Bravo, L. (1998). Polyphenols: chemistry, dietary sources, metabolism,
and nutritional significance. Nutrition Reviews, 56(11), 317–333.Cren-Olive, C., Hapiot, P., Pinson, J., & Rolando, C. (2002). Free radical
chemistry of flavan-3-ols: determination of thermodynamic parameters
and of kinetic reactivity from short (ns) to long (ms) time scale. Journal
of the American Chemical Society, 124, 14027–14038.Cren-Olive, C., Lebrun, S., Hapiot, P., Pinson, J., & Rolando, C. (2000).
Selective protection of catechin gives access to the intrinsic reactivity of
the two phenol rings during H-abstraction and photooxidation.Tetrahedron Letters, 41, 5847–5851.
Cren-Olive, C., Teissier, E., Duriez, P., & Rolando, C. (2003). Effect of
catechin o-methylated metabolites and analogues on human lipid
oxidation. Free Radical Biology and Medicine, 34(7), 850–855.Cren-Olive, C., Wierulesky, J. M., Maes, E., & Rolando, C. (2002).
Catechin and epicatechin deprotonation followed by 13C NMR.Tetrahedron Letters, 43, 4545–4549.
Decker, E. A., & Welch, B. (1990). Role of feritin as lipid oxidation
catalyst in muscle food. Journal of Agricultural and Food Chemistry,
36, 674–677.de Rijke, E., Out, P., Neissen, W. M. A., Ariese, F., Gooijer, C., &
Brinkman, U. A. Th. (2006). Analytical separation and detection
methods for flavonoids. Journal of Chromatography A, 1112, 31–63.Evans, C., Scaiano, J. C., & Ingold, K. U. (1992). Absolute kinetics of
hydrogen abstraction from a-tocopherol by several reactive species
including an alkyl radical. Journal of the American Chemical Society,
124, 4589–4593.Gan, L., Zhang, S. H., Liu, Q., & Xu, H. B. (2003). A polysaccharide-
protein complex from Lycium barbarum upregulates cytokine expres-sion in human peripheral blood mononuclear cells. European Journal
of Pharmacology, 471(3), 217–222.Gan, L., Zhang, S. H., Yang, X. L., & Xu, H. B. (2004). Immunomodulation
and antitumor activity by a polysaccharide-protein complex from
Lycium barbarum. International Immunopharmacology, 4(4), 563–569.Ha, K. T., Yoon, S. J., Choi, D. Y., Kim, D. W., Kim, J. K., & Kim, C. H.
(2005). Protective effect of Lycium chinese fruit on carbon tetrachlo-ride-induced hepatotoxicity. Journal of Ethnopharmacology, 96,529–535.
Halliwell, B. (1997). Antioxidants: the basics – what they are and how to
evaluate them. Advances in Pharmacology, 38, 3–20.Halliwell, B. (1994). Free radicals and antioxidants: personal view.
Nutrition Reviews, 52(8), 253–265.Heimbach, J., Rieth, S., Mohamedshah, F., Slesinski, R., Samuel-
Fernando, P., Sheehan, T., Dickmann, R., & Borzelleca, J. (2000).Safety assessment of iron EDTA [sodium iron (Fe3+) ethylenedi-
aminetetraacetic acid]: summary of toxicological, fortification and
exposure data. Food and Chemical Toxicology, 38, 99–111.Heims, K. E., Tagliaferro, A. R., & Bobilya, D. A. (2002). Flavonoid
antioxidants: chemistry, metabolism and structure–activity relation-
ships. Journal of Nutritional Biochemistry, 13, 572–584.Hertog, M. G. L., Hollman, P. C. H., & Venema, D. P. (1992).
Optimization of a quantitative HPLC determination of potentially
anticarcinogenic flavonoids in vegetables and fruits. Journal of
Agricultural and Food Chemistry, 40, 1591–1598.Higdon, J. V., & Frei, B. (2003). Tea catechins and polyphenols: health
effects, metabolism, and antioxidant functions. Critical Reviews in
Food Science and Nutrition, 43(1), 89–143.Hollman, P. C., & Katan, M. B. (1998). Bioavailability of flavonols and
health effect in man. Archives of Toxicology, Supplements, 20, 237–248.Hsu, B., Coupar, I., & Ng, K. (2006). Antioxidant activity of hot water
extract from the fruit of the Doum palm, Hyphaene thebiaca. Food
Chemistry, 98(2), 317–328.Kim, D. O., Lee, K. W., Lee, H. J., & Lee, C. Y. (2002). Vitamin c
equivalent antioxidant capacity (VCEAC) of phenolic phytochemicals.Journal of Agricultural and Food Chemistry, 50, 3713–3717.
Kim, S. Y., Choi, Y. H., Kim, J., Kim, Y. C., & Lee, H. S. (1997). New
antihepatoxic cerebroside from Lycium chinese. Journal of Natural
Product, 60, 274–276.Kim, S. Y., Lee, J. E., Kim, P. H., Lee, H. S., & Kim, Y. C. (2000). LCC, a
cerebroside from Lycium chinese, protects primary cultured rathepatocytes exposed to galactoseamine. Phytotherapy Research, 14,448–451.
Kolayli, S., Ocak, M., Kucuk, M., & Abbasoglu, R. (2004). Does caffeine
bind to metal ions? Food Chemistry, 84(3), 383–388.Kosar, M., Altintas, A., Kirimer, N., & Baser, H. C. (2003). Determina-
tion of the free radical scavenging activity of Lycium extracts.Chemistry of Natural Compounds, 39(6), 531–535.

K. Le et al. / Food Chemistry 105 (2007) 353–363 363
Leung, I., Li, W., Tso, M., & Lam, T. (2001). Absorption and tissue
distribution of zeaxanthin and lutein in rhesus monkeys after taking
Fructus lycii (Gou Qi Zi) extract. Investigative Ophthalmology and
Visual Science, 42, 466–471.Liu, W., Ogata, T., Sato, S., Unoura, K., & Onodera, J. (2001).
Superoxide scavenging activities of sixty Chinese medicines determined
by an ESR spin-trapping method using electrogenerated superoxide.Yagukaku Zasshi, 121(4), 265–270.
Lloyd, R. V., Hanna, P. M., & Mason, R. P. (1997). The origin of the
hydroxyl radical oxygen in the Fenton Reaction. Free Radical Biology
and Medicine, 22(5), 885–888.Luo, Q., Cai, Y., Yan, J., Sun, M., & Corke, H. (2004). Hypoglycemic and
hypolipidemic effects and antioxidant activity of fruit extracts from
Lycium barbarum. Life Sciences, 76(2), 137–149.Manach, C., & Donovan, J. L. (2004). Pharmacokinetics and metabolism of
dietary flavonoids in humans. Free Radical Research, 38(8), 771–785.Martinez-Tome, M., Murica, M. A., Frega, N., Ruggieri, S., Jimenez, A.
M., Roses, F., & Parras, P. (2004). Evaluation of antioxidant capacity
of cereal brans. Journal of Agricultural and Food Chemistry, 52,4690–4699.
Montoro, P., Braca, A., Pizza, C., & Tommasi, N. De. (2005). Structure–
antioxidant activity relationships of flavonoids isolated from different
plant species. Food Chemistry, 92, 349–355.Ma, Y. L., Li, Q. M., Van den Heuvel, H., & Claeys, M. (1997).
Characterization of flavone and flavonol aglycones by collision-
induced dissociation tandem mass spectrometry. Rapid communica-
tions in mass spectrometry, 11, 1357–1364.March, R. E., & Miao, X-S. (2004). A fragmentation study of kaempferol
using electrospray quadrupole time-of-flight mass spectrometry at high
mass resolution. International Journal of Mass Spectrometry, 231,157–167.
Nam, S. H., & Kang, M. Y. (2004). Antioxidant activity of 13 medicinal
plants. Pharmaceutical Biology, 42(6), 409–412.Nenadis, N., Wang, L. F., Tsimidou, M., & Zhang, H. Y. (2004). Estimation
of scavenging activity of phenolic compounds using the ABTS�+ assay.Journal of Agricultural and Food Chemistry, 52, 4669–4674.
Peng, X., & Tian, G. (2001). Structural characterization of the glycan part
of glycoconjugate LbGp2 from Lycium barbarum L. Carbohydrate
Research, 331(1), 95–99.Prasain, J. K., Wang, C-C., & Barnes, S. (2004). Mass spectroscopic
methods for the determination of flavonoids in biological samples.Free Radical Biology and Medicine, 37(9), 1324–1350.
Qian, J. Y., Liu, D., & Huang, A. G. (2004). The efficiency of flavonoids in
polar extracts of Lycium chinense Mill fruits as free radical scavenger.Food Chemistry, 87(2), 283–288.
Rang, H. P., Dale, M. M., & Ritter, J. M. (1996). Pharmacology. London:ChurchHill Pub.
Rice-Evans, C. A., Miller, N. J., & Paganga, G. (1996). Structure–
antioxidant activity relationships of flavonoids and phenolic acids.Free Radical Biology and Medicine, 20(7), 933–956.
Roginsky, V., & Lissi, E. A. (2005). Review of methods to determine
chain-breaking antioxidant activity in food. Food Chemistry, 92(2),235–254.
Scalbert, A., Manach, C., Moran, C., & Remesy, C. (2005). Dietary
polyphenols and the prevention of Diseases. Critical Reviews in Food
Science and Nutrition, 42, 287–306.Silva, M. M., Santos, M. R., Caroco, G., Rocha, R., Justino, G., & Mira,
L. (2002). Structure–antioxidant activity relationships of flavonoids: a
reexamination. Free Radical research, 36(11), 1219–1227.Toyoda-Ono, T., Maeda, M., Nakao, M., Yoshimura, M., Sugiura-
Tomimori, N., & Fukami, H. (2004). 2-O(a-D-glucopyranosyl) ascor-bic acid, a novel ascorbic acid analogue isolated from Lycium Friut.Journal of Agricultural and Food Chemistry, 52, 2092–2096.
Walle, T. (2004). Absorption and metabolism of flavonoids. Free Radical
Biology and Medicine, 36(7), 829–837.Wang, Y., Zhao, H., Sheng, X., Gambino, P. E., Costello, B., &
Bojanowski, K. (2002). Protective effect of Fructus lycii polysaccharidesagainst time and hyperthermia induced damage in cultured seminifer-ous epithelium. Journal of Ethnopharmacology, 82(2–3), 169–175.
Williams, C. A., & Grayer, R. J. (2004). Natural product reports:anthocyanins and other flavonoids. A review published by The RoyalChemical Society (UK). <hppt://pubs.rcs.org/ej/NP/2004/b311404j/>.
Willcox, J. K., Ash, S. L., & Catignani, G. L. (2004). Antioxidants and
prevention of chronic disease. Critical Reviews in Food Science and
Nutrition, 44, 275–295.Woisky, R. G., & Salatino, A. (1998). Analysis of propolis: some
parameters and procedures for chemical quality control. Journal of
Agricultural Research, 37, 99–105.Wu, S. J., Ng, L. T., & Lin, C. C. (2004). Antioxidant activities of some
common ingredients of traditional Chinese medicine, Angelica sinensis,Lycium barbarum and Poria cocos. Phytotherapy Research, 18,1008–1012.
Yen, G. C., & Chen, H. Y. (1995). Antioxidant activity of various tea
extracts in relation to their antimutagenicity. Journal of Agriculture and
Food Chemistry, 43, 27–32.Yim, T. K., & Ko, K. M. (2002). Antioxidant and immunomodulatory
activities of Chinese tonifying herbs. Pharmaceutical Biology, 40(5),329–335.
Zhang, M., Chen, H., Huang, J., Li, Z., Zhu, C., & Zhang, S. (2005).Effect of Lycium barbarum polysaccharide on human hepatomaQGY7703 cells: inhibition of proliferation and induction of apoptosis.Life Sciences, 76(18), 2115–2124.
Zhu, Y. P. (1998). Chinese material media: chemistry, pharmacology and
applications. Netherlands: Harwood Academic.