Embed Size (px)
Citation preview

RESEARCH ARTICLE Open Access
Identification and validation of single-sample breast cancer radiosensitivity geneexpression predictorsMartin Sjöström1,2* , Johan Staaf1, Patrik Edén3, Fredrik Wärnberg4, Jonas Bergh5,6, Per Malmström1,2,Mårten Fernö1, Emma Niméus1,7,8† and Irma Fredriksson9,10†
Abstract
Background: Adjuvant radiotherapy is the standard of care after breast-conserving surgery for primary breastcancer, despite a majority of patients being over- or under-treated. In contrast to adjuvant endocrine therapy andchemotherapy, no diagnostic tests are in clinical use that can stratify patients for adjuvant radiotherapy. This studypresents the development and validation of a targeted gene expression assay to predict the risk of ipsilateral breasttumor recurrence and response to adjuvant radiotherapy after breast-conserving surgery in primary breast cancer.
Methods: Fresh-frozen primary tumors from 336 patients radically (clear margins) operated on with breast-conservingsurgery with or without radiotherapy were collected. Patients were split into a discovery cohort (N = 172) and avalidation cohort (N = 164). Genes predicting ipsilateral breast tumor recurrence in an Illumina HT12 v4 wholetranscriptome analysis were combined with genes identified in the literature (248 genes in total) to develop atargeted radiosensitivity assay on the Nanostring nCounter platform. Single-sample predictors for ipsilateral breasttumor recurrence based on a k-top scoring pairs algorithm were trained, stratified for estrogen receptor (ER) statusand radiotherapy. Two previously published profiles, the radiosensitivity signature of Speers et al., and the 10-genesignature of Eschrich et al., were also included in the targeted panel.
Results: Derived single-sample predictors were prognostic for ipsilateral breast tumor recurrence in radiotherapy-treatedER+ patients (AUC 0.67, p= 0.01), ER+ patients without radiotherapy (AUC= 0.89, p= 0.02), and radiotherapy-treated ER-patients (AUC= 0.78, p< 0.001). Among ER+ patients, radiotherapy had an excellent effect on tumors classified asradiosensitive (p< 0.001), while radiotherapy had no effect on tumors classified as radioresistant (p= 0.36) and there was ahigh risk of ipsilateral breast tumor recurrence (55% at 10 years). Our single-sample predictors developed in ER+ tumors andthe radiosensitivity signature correlated with proliferation, while single-sample predictors developed in ER- tumors correlatedwith immune response. The 10-gene signature negatively correlated with both proliferation and immune response.
Conclusions: Our targeted single-sample predictors were prognostic for ipsilateral breast tumor recurrence and have thepotential to stratify patients for adjuvant radiotherapy. The correlation of models with biology may explain the differentperformance in subgroups of breast cancer.
Keywords: Breast cancer, Gene expression, Radiotherapy, Radiosensitivity, Radioresistance, Ipsilateral breast tumor recurrence,Local recurrence, Nanostring, nCounter
* Correspondence: [email protected]†Emma Niméus and Irma Fredriksson contributed equally to this work.1Faculty of Medicine, Department of Clinical Sciences Lund, Oncology andPathology, Lund University, Lund, Sweden2Department of Haematology, Oncology and Radiation Physics ,SkåneUniversity Hospital, Lund, SwedenFull list of author information is available at the end of the article
© The Author(s). 2018 Open Access This article is distributed under the terms of the Creative Commons Attribution 4.0International License (http://creativecommons.org/licenses/by/4.0/), which permits unrestricted use, distribution, andreproduction in any medium, provided you give appropriate credit to the original author(s) and the source, provide a link tothe Creative Commons license, and indicate if changes were made. The Creative Commons Public Domain Dedication waiver(http://creativecommons.org/publicdomain/zero/1.0/) applies to the data made available in this article, unless otherwise stated.
Sjöström et al. Breast Cancer Research (2018) 20:64 https://doi.org/10.1186/s13058-018-0978-y

BackgroundPrecision medicine has been the focus of breast cancer re-search during recent decades. As breast cancers are de-tected at an earlier stage, and treatment has improved, theemphasis to avoid over treatment in addition tounder-treatment has increased [1]. Currently, the majorityof primary breast cancers are treated with breast-conservingsurgery (BCS), and the patient is generally offered adjuvanttreatment. Prognostic and treatment-predictive biomarkersbased on traditional immunohistochemical analysis (IHC),or more modern molecular techniques such as gene expres-sion profiling, are presently used to guide the use of adju-vant endocrine therapy, chemotherapy and anti-humanepidermal growth factor receptor 2 (HER2)-directed therapy[2]. However, there is no diagnostic procedure to guidetreatment with adjuvant radiotherapy (RT) after BCS,which is administered to a majority of patients. This isdespite the knowledge that most patients who undergoBCS will remain recurrence-free without RT for at least10 years, and around 20% will suffer a recurrence within10 years despite RT [3]. Traditional clinicopathologicvariables and IHC markers have been unable to identifypatients that could be spared RT [3–5], although studiesare ongoing to find patients with risk of recurrencelow enough to avoid RT (e.g. the LUMINA study,NCT02653755, and the PRIMETIME study [6]).Several attempts have been made to create gene
expression-based classifiers to predict response to RT afterBCS, or to estimate the risk of recurrence with or withoutRT [7–11]. Most recently, Speers et al. presented the radio-sensitivity signature (RSS), a 51-gene random forest modelto classify tumors as radioresistant or radiosensitive [12].Tramm et al. presented a 4-gene classifier predicting the re-sponse to RT after mastectomy [13]. Torres-Roca et al. pre-sented the radiosensitivity index (RSI), a linear model basedon the rank of genes in individual samples, which has beenvalidated in several cancer types, including breast cancer[8]. The same authors have also advanced the model bycombining RSI with the linear-quadratic model for thegenomic-adjusted radiation dose (GARD) [14]. In addition,genome instability is considered to sensitize cancer cells totreatment in general, and a centromere and kinetochoregene expression score was suggested to predict response toRT [15]. Taken together, promising results have been pre-sented, but no profile or marker is yet in clinical use.There are several reasons why gene expression pro-
files have not been introduced in clinical routine.First, the clinical value and cost-effectiveness has notbeen proven, as reported profiles lack extensive inde-pendent validation, and to date, no prospective trialor studies from existing randomized clinical trialshave been presented, except in the mastectomy set-ting [13]. Second, few of the current profiles havebeen tested on technical platforms able to handle
samples with low-quality RNA, such as RNA ex-tracted from formalin-fixed paraffin-embedded (FFPE)tissue, which would greatly improve the clinical util-ity. Third, it has been hard to validate profiles acrossplatforms, although attempts have been made by e.g.scaling (RSS) or rank-based models (RSI). Finally,breast cancer is a heterogeneous disease, and the re-sponse to RT and the pathways associated with radio-resistance may be different in different subgroups.Indeed, this was shown when Torres-Roca et al. presentedthe follow-up study of RSI in estrogen receptor positive(ER+) and estrogen receptor negative (ER-) breast cancer,and only could validate previous findings in ER- tumors[16]. Interestingly, RSI was recently further shown tocorrelate with immune response genes, which may partlyexplain the subgroup-specific performance, as theimmune response is more important for prognosis inER- breast cancer [17, 18].In this study, we aimed to address these issues and
created a targeted radiosensitivity gene expression assayusing the Nanostring nCounter platform, which is suit-able for low quality RNA samples. Based on the targetedassay, we created single-sample predictors (SSPs) using ak-top scoring pairs (k-TSP) algorithm [19]. The SSPswere validated to be prognostic for ipsilateral breasttumor recurrence (IBTR) in samples of low RNA qualityfrom a study cohort, and further validated in public data.The SSPs also showed potential to stratify patients forRT. In addition, the panel included the genes describedfor RSS and a surrogate score for RSI (referred to as the10-gene signature, 10-GS). The previously reportedsignatures were prognostic for IBTR, and partiallypredictive of RT, but their performance was dependenton ER status. Finally, we showed that the biology behindthe different models and predictors may explain thisdifference.
MethodsPatients and samplesPatients with invasive breast cancer radically operated on(clear margins) with BCS in three of six healthcare regionsin Sweden (South, Uppsala-Örebro and Stockholm)between 1983 and 2009, and with fresh-frozen tissue avail-able, were included (N = 336). Patients were excluded ifthey had multifocal cancer (defined as > 20 mm betweentumors), neoadjuvant treatment or prior malignancy(excluding basal-cell carcinoma of the skin, in-situ cervicalcancer and other curatively treated cancer at least 5 yearsprior to the breast cancer). First, all patients with a laterIBTR were selected as cases (N = 144). Next, controls wereselected as patients without any recurrence for at least thesame time as the time to IBTR for the matched case, andwere matched for RT and ER status (N = 192). Medianfollow-up time was 13.1 years in patients without IBTR
Sjöström et al. Breast Cancer Research (2018) 20:64 Page 2 of 13
(controls), and median time to IBTR was 4.4 years in pa-tients with IBTR (cases). Systemic adjuvant treatment wasnot part of the inclusion criteria and was administered ac-cording to regional treatment programs at the time. Thestudy was approved by the Ethics committee of Lund Uni-versity (2010-127).
RNA extractionRNA was extracted from approximately 30 mg offresh-frozen tissue using commercially available extractionkits, either the Qiagen AllPrep kit, or the Qiagen RNEasylipid tissue kit, according to the manufacturer’s instructions(Qiagen, Hilden, Germany). Cancer content was confirmedmicroscopically and samples without cancer cells wereexcluded. Integrity and amount of RNA was measured;samples from one of the three biobank centers had RNA oflower quality, which most likely can be explained bydegradation during the transportation process (Additionalfile 1: Figure S3). We chose to use the higher-qualitysamples from two centers as a discovery cohort (N = 172),and the lower-quality samples from one center as a valid-ation cohort (N = 164) (Fig. 1 and Table 1). For moredetails, see Additional file 2.
Gene expression analysis in the discovery cohortThe discovery cohort (N= 172) was analyzed using IlluminaHT12 v4 microarrays (Illumina, San Diego, CA, USA). Theinput amount was 575 ng of total RNA and RNA washybridized on three plates. Samples were processed in a ran-domized order and the data have been deposited in GeneExpression Omnibus (GEO) [GEO:GSE103746].
Data analysis in the discovery cohortAll data analyses were performed using R [20] (explicitlyoutlined in Additional file 2). Briefly, the Illumina HT12v4 array data was normal-exponential background cor-rected, quantile-normalized and log2-transformed withan offset of 16 added to avoid negative values using thelimma package [21], as previously suggested [22]. Thedata were batch-effect corrected for hybridization plateand biobank center using the sva package [23]. Probeswere filtered based on quality and a variance filter wasapplied to limit the number of probes to 5000. Tumorswere stratified for ER and RT status creating four groups(ER+RT+, ER+RT-, ER-RT+, ER-RT-). A random forestmodel with double-loop cross-validation and recursivefeature elimination based on the caret R package [24]was used to rank the importance of candidate genes, andselect the number of genes to analyze further.
Creation of a targeted radiosensitivity gene panelGenes included in the targeted panel were selected basedon the discriminating performance of cases versus con-trols in the discovery cohort (N = 155). We further
added the genes included in the previously publishedsignatures RSI (N = 10), RSS (N = 51) and the genes de-scribed by Tramm et al. (N = 7) [8, 12, 13]. We alsoadded genes associated with risk of IBTR, radioresis-tance or breast cancer biology identified in the literature,e.g. hormone and growth factor receptors (ESR1, PGR),human epidermal growth factor receptor 2 (ERBB2),proliferation genes (MKI67 and AURKA), and genes re-lated to hypoxia, apoptosis and DNA repair (N = 15)[25–30]. Housekeeping genes were added for purposesof normalization (N = 13). In total, 248 genes were selectedfor the targeted gene expression panel (Fig. 1). For detailssee Additional file 2, and Additional file 3: Table S1.
Gene expression analysis with the targetedradiosensitivity panelBoth the discovery cohort (N = 172) and validation cohort(N = 164) were analyzed in a randomized order with acustom-designed Nanostring nCounter panel (NanostringTechnologies, Seattle, WA, USA). The Nanostring probeswere created with standard chemistry XT-formulation anddesigned and produced by the manufacturer (Nanostring).Analysis-ready probes were analyzed using the Prepstationand Digital analyzer (Nanostring), according to the manu-facturer’s instructions. Gene expression data have beendeposited to GEO [GEO:GSE10374]. For more details, seeAdditional file 2.
Public datasetsTwo public datasets were analyzed [11, 31]. The datasetof Servant et al. was based on anlysis using the IlluminaHT12 v3 in a cohort of 343 patients who underwentBCS and were treated with RT. The dataset of van deVijver et al. included 295 patients who underwent eitherBCS or modified radical mastectomy. RT was givenwhen indicated, and gene expression was analyzed by a25,000-gene oligonucleotide dual-channel array.
Data analysis in the targeted radiosensitivity panelThe data were quality-filtered resulting in 7 probes and29 samples removed (4 from the discovery cohort and25 from the validation cohort) and normalized for posi-tive control probes and housekeeping genes (Fig. 1).SSPs to classify samples as high risk or low risk of IBTRwere trained in the discovery cohort in each of the fourgroups (ER + RT+, ER + RT-, ER-RT+ and ER-RT-) usingthe switchbox R package [19]. The SSPs were based on ak-TSP algorithm that compares the relative expressionof genes within a sample and creates rules in the formgene A > gene B. The default settings of the switchboxpackage were used, which selects the optimal number ofgene pairs by cross-validation in the discovery cohort,[32] and uses the majority vote as cut point without anyweighting of the pairs. The model was allowed to use all
Sjöström et al. Breast Cancer Research (2018) 20:64 Page 3 of 13

genes in the panel and minimum number of pairs to tryfor training was set to 100 pairs, as gene expression pro-files have been shown to be more robust using highernumber of genes [33]. This means that at least 200 geneswere included in each SSP, and thus a combination ofpreviously published genes and novel genes from ourdiscovery analysis. The full set of genes and pairwisecombination is presented in Additional file 4: Table S3.The locked models were then tested in the validationcohort and Kaplan-Meier curves, Cox regression models,
and log-rank p-values were calculated using the survivalR package [34], and receiver operating characteristics(ROC) analysis was performed using the pROC R pack-age [35]. Endpoint was IBTR. RSS and a surrogate scorefor RSI (referred to as 10-GS) were calculated as de-scribed in the original publications [8, 12]. Proliferationscores were calculated as the geometric mean of expres-sion values for MKI67 and AURKA. Immune scores werecalculated as the geometric mean of genes annotated aspart of the immune response (IRF1, IGKC, STAT1,
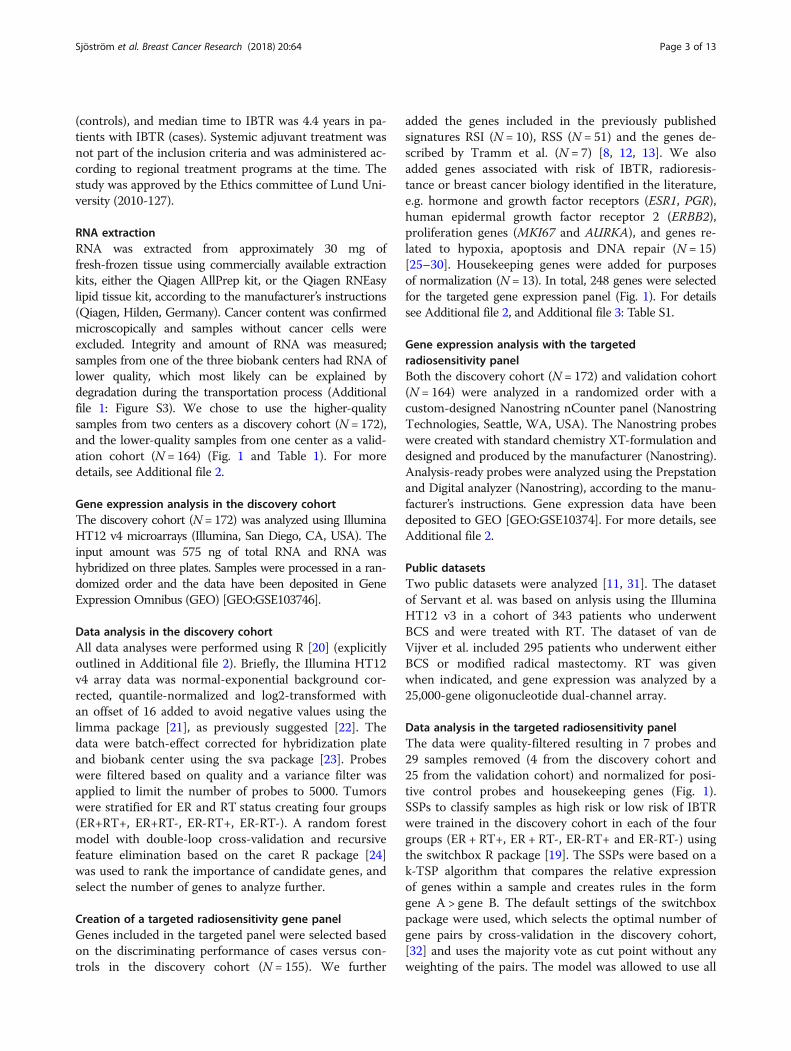
Fig. 1 Project overview. Samples were split into a discovery cohort and a validation cohort. The discovery cohort was analyzed with the IlluminaHT12 v4 whole transcriptome microarray. Top discriminating genes for ipsilateral breast tumor recurrence were combined with genes from theliterature and previous signatures for a radiosensitivity gene panel. A targeted assay was developed, and both the discovery cohort and thevalidation cohort were analyzed. Single-sample predictors were developed in the discovery cohort and validated in the validation cohort and inpublic datasets. Finally, the previously published signatures were tested in all our data. ER, estrogen receptor; RT, adjuvant radiotherapy
Sjöström et al. Breast Cancer Research (2018) 20:64 Page 4 of 13

OSMR, CCL19, RelA, IRF8, FGR, TNFRSF1B, C3) in theonline gene ontology tool PANTHER [36]. Correlationbetween the raw scores for the different models, andcorrelation with proliferation and immune scores weretested with Pearson correlation and linear modeling,with p-values calculated with a test for zero slope. Formore details, see Additional files.
ResultsSelection of genes and creation of a targetedradiosensitivity assayThe Illumina HT12 v4 microarray whole transcriptomegene expression data from the discovery cohort was ana-lyzed stratified for ER status and RT, creating fourgroups (ER + RT+, ER + RT-, ER-RT+, ER-RT-). ROCanalysis showed that optimal performance of the randomforest models was achieved after including around 50genes per model, with the AUC ranging from 0.67 to0.85 depending on group, except for the ER-RT+subgroup, where no signal was found (Additional file 5:Figure S1A and B). Based on their importance in thesemodels, we selected 155 genes for further developmentof a targeted assay. To investigate the biology repre-sented by the selected genes, hierarchical clustering wasperformed and correlated with known gene clusters(Additional file 2 and Additional file 6: Figure S2). Genesselected in the ER+ groups included genes correlatedwith proliferation, and genes selected in the ER- groupsincluded genes correlated with immune response.However, for some clusters no correlation was found,and the genes may thus represent biological pathwaysmore specific for radiosensitivity.We added genes from three previously described
radioresistance gene expression profiles in breast cancerto the 155 genes selected in the discovery analysis: thesewere the 10 genes forming the RSI, the 51 genes in-cluded in the RSS, and the 7 genes described by Trammet al. [8, 12, 13]. We further added genes identified inthe literature (Additional file 3: Table S1). Among thesewere genes associated with apoptosis (BCL2) [25],DNA-repair (BRCA1, BRCA2 and survivin/BIRC5) [26,27], the MET-HGF pair [28], hypoxia (HIF1 and HIF2)
Table 1 Patient and tumor characteristics
Discoverycohort
Validationcohort
Total number of patients 172 164
Analyzed with Illumina HT12 v4 172 0
Analyzed with targeted nCounterpanel
172 164
Included in the final analysis 168 139
Radically operated on (clearmargins)
Yes 168 (100%) 139 (100%)
No 0 0
Extensive intraductal component (EIC)
Yes 9 7
No 109 90
Missing 50 42
Ipsilateral breast tumor recurrence(IBTR)
Yes 68 62
No 100 77
Tumor size mm, median (min-max) 18 (3-45) 17 (3-35)
Lymph node status
Node negative 125 (78%) 108 (78%)
Node positive 35 (22%) 29 (22%)
Missing 8 2
Estrogen receptor (ER) status
Positive 119 (71%) 118 (85%)
Negative 49 (29%) 21 (15%)
Histological grade
1 16 (17%) 12 (19%)
2 46 (50%) 24 (39%)
3 30 (33%) 26 (42%)
Missing 76 77
Subtype
Luminal A 70 (42%) 60 (43%)
Luminal B 42 (25%) 29 (21%)
Basal-like 37 (22%) 12 (9%)
Human epidermal growth factorreceptor 2 (HER2)-enriched
19 (11%) 38 (27%)
Radiotherapy
Yes 116 (69%) 119 (86%)
No 52 (31%) 20 (14%)
Chemotherapy
Yes 34 (20%) 31 (23%)
No 133 (80%) 105 (77%)
missing 1 3
Endocrine therapy
Yes 60 (35%) 91 (65%)
Table 1 Patient and tumor characteristics (Continued)
Discoverycohort
Validationcohort
No 108 (65%) 46 (35%)
missing 0 1
Follow-up time
Median time (range) to IBTR incases, years
3.7 (0.7-18.7) 4.4 (0.1-22.5)
Median follow-up time (range) incontrols, years
13.2 (3.0-19.6) 12.6 (1.7-26.0)
Sjöström et al. Breast Cancer Research (2018) 20:64 Page 5 of 13

[29] and WRAP53 [30]. We also added genes importantfor breast cancer biology or subtyping (ER, PGR, ERBB2,MKI67, AURKA and FOXC1). Finally, we added 13housekeeping genes previously used by Nanostring intheir targeted gene expression assays (Additional file 3:Table S1). In total, 248 genes were selected for the devel-opment of a targeted assay.
Training and validation of single-sample predictors withthe targeted assayBoth the discovery cohort and the validation cohort wereanalyzed with the targeted Nanostring assay. SSPs weretrained in the discovery cohort separately for the fourgroups created when stratifying for ER status and RT sta-tus (ER + RT+, ER + RT-, ER-RT+ and ER-RT-). Thelocked models were then applied in the validation cohort.The validation AUC was 0.67 for the SSP in ER + RT+samples, 0.89 for the SSP in ER + RT- samples, and 0.78for SSP in ER-RT+ samples. The ER-RT- group could notbe analyzed due to too few samples (N = 3). The SSPswere significantly associated with IBTR in survival analysis(log-rank p = 0.01, p = 0.02 and p < 0.001, respectively)(Fig. 2a). Next, we tested the SSPs in two public datasetsand mapped the genes to the respective platforms.Three genes were missing in the Servant et al. data-set, and 34 genes were missing in the van de Vijverdataset, and thus we used the SSPs without thesegene pairs. All patients in the Servant et al. datasetwere treated with RT and we could thus only test the ER+RT+ and ER-RT+ SSPs. Both SSPs were significantly predict-ive of IBTR (log-rank p < 0.001 and p= 0.001, respectively)with corresponding AUC values of 0.62 and 0.74 (Fig. 2b).The van de Vijver dataset also included a majority ofRT-treated patients, and we therefore again tested the ER+RT+ and ER-RT+ SSPs. The ER+RT+ SSP was significantlypredictive of IBTR (p= 0.003, AUC 0.69) but not the ER-RT+ SSP (p= 0.56, AUC 0.50) (Fig. 2c).
Potential clinical applicationThe first set of analyses focused on prognostic predic-tors, either in RT+ patients where our SSPs may beregarded as radioresistance classifiers, or in RT- patients,in which the SSPs may be seen as a method for findingpatients without the need for RT. However, the aim wasto derive a classifier that can stratify patients into threegroups: (1) those that could be spared RT, (2) those thatbenefit from and should be given RT and (3) those thatare intrinsically radioresistant, and where other treat-ments strategies should be considered besides RT, e.g.mastectomy or more aggressive adjuvant systemictreatment. One strategy to stratify patients into the threetreatment groups could be to apply our SSPs consecutively,such that we first determine which patients should bespared RT with a SSP developed in RT- patients. Patients
predicted to have low risk of IBTR would be in the“No-RT” group. For the patients predicted as high risk ofIBTR, the SSP developed in RT+ patients, and thus poten-tially testing radioresistance, could next be applied. Patientspredicted as having low risk of IBTR when given RT wouldbe in the “Give-RT” group, while patients predicted ashaving high risk of IBTR even with RT would be in the“More-treatment” group. To test this conceptual idea, weapplied our SSPs consecutively in our validation cohortseparately for ER+ and ER- tumors. For ER+ tumors, theNo-RT group had no benefit from RT (p = 0.43), but didnot have a low risk of developing IBTR (25% at 10 years)(Fig. 3a). The effect of RT was excellent in the Give-RTgroup (p < 0.001), while RT had no effect in theMore-treatment group (p = 0.36), and the group had a sub-stantially higher risk of IBTR than the No-RT group (55%at 10 years) (Fig. 3a). In a Cox model of the ER+ tumors in-cluding the variable of “Give RT vs No RT” and “Give moretreatment”, RT and the interaction term between theprediction and RT, the interaction term was significant(HRinteraction = 0.12 95% CI 0.03–0.54, Pinteraction = 0.001),further strengthening the treatment predictive potential(Additional file 7: Table S4). Among patients with ER- tu-mors, only two were RT-untreated, and we could thus onlyinvestigate the prognostic effect in this group. Those thatwere predicted as More treatment had a significantly higherrate of IBTR than the patients in the No-RT and Give-RTgroups (p < 0.001) (Fig. 3b).
Analysis of previously published profiles in our dataThe RSS described by Speers et al. was applied to ourentire dataset created with the targeted assay (N = 307),as described in the original publication. There wasan overall association with IBTR in the full dataset(log-rank p = 0.001, AUC of 0.59). When it wasapplied as stratified for ER and RT, it remained sig-nificant only in the ER + RT+ group (p = 0.001, AUC0.58) (Fig. 4a). The 10-GS, based on the genes in-cluded in the RSI, was applied to the targeted data-set as described in the original publications, with thechange that the cut point was set to the medianvalue, as we have enriched for patients with laterIBTR in this dataset. Overall it did not predict thedevelopment of IBTR (log-rank p = 0.20, AUC 0.51).However, stratified for ER and RT, it performed wellin the ER-RT+ group (log-rank p< 0.001, AUC 0.70) (Fig. 4b).Further, high risk/radioresistance, as predicted by 10-GS, wassignificantly associated with fewer instances of IBTR in theER+RT- group (log-rank p= 0.02, AUC 0.70 when changingthe direction of analysis) (Fig. 4b).We also tested the treatment predictive effect of
RSS and 10-GS, i.e. the effect of RT in those pre-dicted to be radioresistant or radiosensitive, respect-ively. Neither of the RSS groups had an effect of RT
Sjöström et al. Breast Cancer Research (2018) 20:64 Page 6 of 13

(p = 0.71 and p = 0.93, respectively) (Fig. 4c). For the10-GS, on the other hand, RT had no effect on the sam-ples predicted to be radioresistant (p = 0.23), while therewas an effect of RT in the samples predicted to be radio-sensitive (p = 0.06) (Fig. 4c). A Cox regression modelincluding RT, 10-GS and the interaction term between RTand 10-GS showed that the interaction term was
significantly predictive of IBTR (pinteraction = 0.03), suggest-ing a treatment predictive effect of the 10-GS.
Comparison of models and association with underlyingbiologyTo investigate similarities and differences between ournewly developed SSPs and the previously published
0 5 10 15
0.0
0.2
0.4
0.6
0.8
1.0
ER+RT+
Predicted
Low riskHigh risk
p−value = 0.01
0 5 10 15
0.0
0.2
0.4
0.6
0.8
1.0
ER+RT−
Time (years)
Predicted
Low riskHigh risk p−value = 0.02
0 5 10 15
0.0
0.2
0.4
0.6
0.8
1.0
ER−RT+
Time (years)
Predicted
Low riskHigh risk
p−value < 0.001
ER+RT+
1.0 0.8 0.6 0.4 0.2 0.0
0.0
0.2
0.4
0.6
0.8
1.0
AUC =0.6795% CI: 0.56 − 0.78
ER+RT−
1.0 0.8 0.6 0.4 0.2 0.0
0.0
0.2
0.4
0.6
0.8
1.0
AUC =0.8995% CI: 0.73 − 1
ER−RT+
1.0 0.8 0.6 0.4 0.2 0.0
0.0
0.2
0.4
0.6
0.8
1.0
AUC =0.7895% CI: 0.53 − 1
0 2 4 6 8 10
0.0
0.2
0.4
0.6
0.8
1.0
ER+RT+
Predicted
Low riskHigh risk
p−value < 0.001
ER+RT+
1.0 0.8 0.6 0.4 0.2 0.0
0.0
0.2
0.4
0.6
0.8
1.0
AUC =0.6295% CI: 0.55 − 0.70
0 2 4 6 8 10
0.0
0.2
0.4
0.6
0.8
1.0
ER−RT+
Predicted
Low riskHigh risk
p−value = 0.001
ER−RT+
1.0 0.8 0.6 0.4 0.2 0.0
0.0
0.2
0.4
0.6
0.8
1.0
AUC =0.7495% CI: 0.61 − 0.86
0 5 10 15
0.0
0.2
0.4
0.6
0.8
1.0
ER+
Predicted
Low riskHigh risk
p−value = 0.003
ER+
1.0 0.8 0.6 0.4 0.2 0.0
0.0
0.2
0.4
0.6
0.8
1.0
AUC =0.6995% CI: 0.62 − 0.76
0 5 10 15
0.0
0.2
0.4
0.6
0.8
1.0
ER−
Predicted
Low riskHigh risk
p−value = 0.56
ER−
1.0 0.8 0.6 0.4 0.2 0.0
0.0
0.2
0.4
0.6
0.8
1.0
AUC =0.5095% CI: 0.36 − 0.64
Validation cohort
Servant data van de Vijver data
Number at riskPredicted low riskPredicted high risk
7328
6118
4712
254
98
61
41
10
144
90
70
10
Number at riskPredicted low riskPredicted high risk
145123
12282
11068
3738
3018
3016
17254
13530
4514
122
3732
1418
74
20
A
B C
Pro
port
ion
with
out I
BT
R
Pro
port
ion
with
out I
BT
R
Pro
port
ion
with
outh
IBT
R
Sen
sitiv
ity
Specificity Specificity Specificity
Sen
sitiv
ity
Sen
sitiv
ity
Sen
sitiv
ity
Sen
sitiv
ity
Sen
sitiv
ity
Sen
sitiv
ity
Specificity Specificity Specificity Specificity
Time (years) Time (years) Time (years) Time (years)
Time (years)
Fig. 2 Validation of single-sample predictors (SSPs) in our validation cohort (a) and two publicly available datasets (b and c). The analysis wasperformed with data stratified for estrogen receptor (ER) status and adjuvant radiotherapy (RT). The endpoint was ipsilateral breast tumorrecurrence (IBTR) and the SSPs were evaluated by survival analysis using the Kaplan-Meier method and log-rank test, and receiver operatingcharacteristics (ROC) analysis with area under the curve (AUC) as a measurement of performance
Sjöström et al. Breast Cancer Research (2018) 20:64 Page 7 of 13

models, we tested correlation between the raw scoresand the models (Fig. 5a-c). Overall, our SSPs wereweakly positively correlated with RSS but not with10-GS.Cancer cell proliferation is a major biological prognos-
tic determinant in ER+ breast cancer (also largely separ-ating the luminal A from the luminal B subtype), whilethe immune response has been shown to be importantfor the prognosis in highly proliferating and ER- breastcancer [18]. To investigate the biology behind themodels, we tested correlation between the raw modelscores and proliferation and immune response, calcu-lated as the geometric mean of the expression of genes
associated with proliferation and immune response, re-spectively (details in Additional file 2). Overall, our SSPswere weakly correlated with proliferation, but not immuneresponse (Fig. 5d and g). RSS was also weakly correlatedwith proliferation and weakly negatively correlated with im-mune response (Fig. 5e and h). 10-GS, on the other hand,was more strongly negatively correlated with both prolifera-tion and immune response (Fig. 5f and i). Further, stratifiedfor ER and RT, the SSPs developed in ER+ tumors corre-lated with proliferation and weakly with immune response.Conversely, the SSPs developed in ER- tumors negativelycorrelated with immune response, but did not correlatewith proliferation (Additional file 8: Figure S4).
0 5 10 15
0.0
0.2
0.4
0.6
0.8
1.0
Predicted No RT
Given treatment
No RTRT
p−value = 0.43
0 5 10 150.
00.
20.
40.
60.
81.
0
Predicted Give RT
Time (years)
Given treatment
No RTRT
p−value < 0.001
0 5 10 15
0.0
0.2
0.4
0.6
0.8
1.0
Predicted More Treatment
Time (years)
Given treatment
No RTRT
p−value = 0.36
0 5 10 15
0.0
0.2
0.4
0.6
0.8
1.0
All groups
Time (years)
Predicted
More treatmentNo RTGive RT
p−value < 0.001
Number at riskNot given RT 3 1 1 0 4 0 0 0
ER+ tumors ER- tumors
Given RT 20 12 8 2 9 6 4 0
Number at riskMore treat.Give RT
8 6 3 1No RT
5 0 0 021 18 15 10
9 6 4 160 49 36 17
BAP
ropo
rtio
n w
ithou
t IB
TR
Pro
port
ion
with
out I
BT
R
Time (years)
Fig. 3 Application of single-sample predictors (SSPs) to stratify patients for treatment. The analysis was performed with data stratified for estrogenreceptor (ER) status. SSPs developed in radiotherapy (RT)-untreated patients (RT-) were used to estimate the risk without giving RT. If they werepredicted as having low risk of IBTR without RT, they were assigned to the “No-RT” groups. If predicted as high risk without RT, a SSP developedin RT+ tumors was applied. If predicted as having low risk with RT, they were assigned to the group “Give RT” and if predicted as having high riskwith RT, they were assigned to the “More-treatment” group. The difference in risk of ipsilateral breast tumor recurrence with or without RT wasvisualized using the Kaplan-Meier method and tested with the log-rank test for ER+ tumors (a) and ER- tumors (b). Among ER- tumors (b), onlytwo were RT- and we thus analyzed the prognostic effect of the groups assigned
0 5 10 15
0.0
0.2
0.4
0.6
0.8
1.0
ER+RT+
Time (years)
Predicted
Low riskHigh risk
p−value = 0.001
0 5 10 15
0.0
0.2
0.4
0.6
0.8
1.0
ER+RT−
Time (years)
Predicted
Low riskHigh risk
p−value = 0.11
Number at riskPredicted low riskPredicted high risk
10277
8850
6633
3911
3721
2514
207
74
0 5 10 15
0.0
0.2
0.4
0.6
0.8
1.0
ER−RT+
Time (years)
Predicted
Low riskHigh risk
p−value = 0.93
0 5 10 15
0.0
0.2
0.4
0.6
0.8
1.0
ER−RT−
Time (years)
Predicted
Low riskHigh risk
p−value = 0.60
Number at riskPredicted low riskPredicted high risk
2630
1617
109
40
77
55
23
03
0 5 10 15
0.0
0.2
0.4
0.6
0.8
1.0
ER+RT+
Time (years)
Predicted
Low riskHigh risk
p−value = 0.67
0 5 10 15
0.0
0.2
0.4
0.6
0.8
1.0
ER+RT−
Time (years)
Predicted
Low riskHigh risk
p−value = 0.02
9584
7068
4950
2327
2137
1128
720
38
0 5 10 15
0.0
0.2
0.4
0.6
0.8
1.0
ER−RT+
Time (years)
Predicted
Low riskHigh risk
p−value < 0.001
0 5 10 15
0.0
0.2
0.4
0.6
0.8
1.0
ER−RT−
Time (years)
Predicted
Low riskHigh risk
p−value = 0.27
3026
2211
127
22
86
73
32
21
0 5 10 15
0.0
0.2
0.4
0.6
0.8
1.0
RSS predicted radiosensitive
Time (years)
Given treatment
No RTRT
p−value = 0.71
0 5 10 15
0.0
0.2
0.4
0.6
0.8
1.0
RSS predicted radioresistant
Time (years)
Given treatment
No RTRT
p−value = 0.93
Number at riskNo RTRT
28107
1967
1042
711
44128
30104
2276
743
0 5 10 15
0.0
0.2
0.4
0.6
0.8
1.0
10−GS predicted radiosensitive
Time (years)
Given treatment
No RTRT
p−value = 0.06
0 5 10 15
0.0
0.2
0.4
0.6
0.8
1.0
10−GS predicted radioresistant
Time (years)
Given treatment
No RTRT
p−value = 0.23
Number at riskNo RTRT
29125
1892
1061
525
43110
3179
2257
929
Performance of RSS Performance of 10-GS Treatment predictive effectA B C
Pro
port
ion
with
out I
BT
RP
ropo
rtio
n w
ithou
t IB
TR
Pro
port
ion
with
out I
BT
RP
ropo
rtio
n w
ithou
t IB
TR
Pro
port
ion
with
out I
BT
RP
ropo
rtio
n w
ithou
t IB
TR
Fig. 4 Performance of the radiosensitivity signature (RSS) (a) and the 10-gene score (10-GS) (b) in the Nanostring data generated with thetargeted radiosensitivity gene expression assay. Tumors classified as a case by RSS, or above the median 10-GS score, were regarded high risk. Theprognostic performance was evaluated with the Kaplan-Meier method and log-rank test for endpoint ipsilateral breast tumor recurrence, stratifiedfor estrogen receptor (ER) status and radiotherapy (RT). The treatment predictive effect was evaluated by analyzing the effect of RT in samplesclassified as radioresistant or radiosensitive by the respective classifiers (c)
Sjöström et al. Breast Cancer Research (2018) 20:64 Page 8 of 13

DiscussionIn this study, we developed and validated single-samplepredictors (SSPs) that were prognostic for IBTR using atargeted gene expression panel applicable to samples oflower RNA quality. We presented a conceptual idea ofapplying the SSPs to stratify patients into treatmentgroups with promising potential. Two previously pub-lished radiosensitivity signatures [8, 12] were also testedin our data, and their performance was found to be ER
status dependent, which may be explained by the biologybehind the different models.The treatment of primary breast cancer is highly indi-
vidualized, and tests are available to guide the use of ad-juvant endocrine therapy, chemotherapy and anti-HER2treatment [37, 38]. However, no test is available to guidethe use of adjuvant RT, which remains an urgent unmetclinical need. Several attempts have been made towardsthis aim, but no test has been introduced in clinical use.
−50 0 50
0.4
0.5
0.6
0.7
SSPs
RS
S
p < 0.001 R = 0.26
−50 0 504
56
78
9SSPs
Pro
lifer
atio
n sc
ore
p < 0.001 R = 0.28
−50 0 50
67
89
1011
SSPs
Imm
une
Sco
re
p = 0.55R = 0.03
−50 0 50
−0.
8−
0.6
−0.
4−
0.2
0.0
0.2
SSPs
10−
GS
p = 0.24R = −0.07
0.4 0.5 0.6 0.7
45
67
89
RSS
Pro
lifer
atio
n sc
ore
p < 0.001 R = 0.21
0.4 0.5 0.6 0.7
67
89
1011
RSSIm
mun
e S
core
p = 0.01R = −0.15
−0.8 −0.6 −0.4 −0.2 0.0 0.2
0.4
0.5
0.6
0.7
10−GS
RS
S
p = 0.25R = 0.07
−0.8 −0.6 −0.4 −0.2 0.0 0.2
45
67
89
10−GS
Pro
lifer
atio
n sc
ore
p < 0.001 R = −0.45
−0.8 −0.6 −0.4 −0.2 0.0 0.2
67
89
1011
10−GS
Imm
une
Sco
re
p < 0.001 R = −0.48
Proliferation Immune responseA D G
B E H
C F I
Fig. 5 Correlation between our single-sample predictors (SSPs), the radiosensitivity signature (RSS) and the 10-gene signature (10-GS) in thecombined discovery and validation data from the targeted radiosensitivity assay (a-c). The samples are classified with the corresponding SSPs, i.e.stratified for estrogen receptor and radiotherapy status. The different profiles were further correlated with a proliferation score calculated as thegeometric mean of the expression of AURKA and MKI67 (d-f), and with an immune score calculated as the geometric mean of immune responserelated genes (g-i)
Sjöström et al. Breast Cancer Research (2018) 20:64 Page 9 of 13

The reasons are mainly due to lack of follow-up studiesand validation, the inability to handle samples of lowerRNA quality, which is typical under clinical conditionswith FFPE samples, and the models being cohortdependent. We here present a novel approach that aimsto overcome these problems, and move individualizedRT closer to clinical use. First, we build on previous bio-logical knowledge by including genes that have been pre-viously described in the literature to be associated withradioresistance, in addition to our newly discovered setof genes. Our final SSP models consist of genes fromthese different sources, and are highly prognostic forIBTR, both in our validation data and in independentpublic data. In addition, the targeted assay includes genesfrom two previously described radiosensitivity signatures,giving us an opportunity to validate a surrogate score forthese two profiles, which indeed validated our data forprognostication in certain subgroups. Importantly, the10-GS is also treatment predictive for RT. Second, mostclinical samples are handled and stored as FFPE tissue,and an assay able to process RNA extracted from FFPEsamples would greatly facilitate its use in the clinical rou-tine. Here, we have used the Nanostring nCounter plat-form for our targeted assay, which has shown goodperformance in FFPE samples and is FDA approved forsuch use with the ProSigna assay [39], and we validatedour targeted radiosensitivity panel in samples of lowerRNA quality. Although not yet directly tested in FFPEsamples, our samples of lower RNA quality are similar toRNA extracted from FFPE samples in terms of the RNAintegrity number (RIN) value and fragment length (datanot shown). Third, we used a machine learning algo-rithm, (k-TSP), which relies only on the relative ex-pression of genes within a sample, which should intheory make it both platform and cohort independent.Indeed, we validated the SSPs in data from samplesthat were partly degraded and in fresh-frozen tumorcohorts, without any scaling or other measure tomake the data comparable.Further, the aim of a radiosensitivity predictor in early
breast cancer is to stratify patients and offer treatmentonly to patients in whom RT had a clinically significanteffect. However, patients that do not benefit from RTafter BCS may either be those that have the least aggres-sive tumors, and remain recurrence-free even withoutRT (requiring de-escalation of treatment), or those withthe most aggressive and radioresistant tumors (requiringescalation of treatment). This may complicate the ana-lysis, since those two groups of tumors most likely arenot similar in their transcriptomic profiles. The strengthof this study is therefore that we developed classifiersthat incorporate those two different settings, for notbenefitting from RT in treatment stratification, creatingthree groups for treatment stratification. The results were
highly significant in the validation cohort, although we ac-knowledge the small sample sizes, and the requirementfor further validation in larger cohort studies or random-ized trials.However, although we herein showed reproducible
classifiers for IBTR prognostication and RT treatmentstratification, it must be noted that RT is an effectivetreatment, with good cost-effectiveness, and relativelymild side effects, which increases the threshold for with-holding RT in patients. High predictive accuracy is re-quired from any radiosensitivity predictor for it to beclinically useful. Although promising, the performanceof our proposed SSPs and the previously published pro-files show that they are not yet ready for clinical use.Validation in additional cohorts may be a next step, butfurther classifier development is likely needed. Indeed,our SSPs were intentionally trained with default settingsusing the majority of genes in the panel as a proof ofconcept. There is great potential to further optimize themodel by e.g. reducing the number of gene pairs,weighting the gene pairs, etc. For a final clinical decisiontool, one alternative may be to include additional param-eters in the models, i.e. combining gene expression datawith clinicopathologic variables, intrinsic subtype, andother molecular data into mixed classifiers. Indeed, com-bining gene expression data with additional informationhas already been suggested [16, 40]. However, this data-set, especially after the validation of a locked profile, isnot sufficient for extensive classifier optimization orevaluation of other clinicopathologic variables.One limitation of our study is the case-control sam-
pling, meaning that RT was not administered in a ran-domized fashion. This limits the analyses that can beperformed, and e.g. the proposed method of using a Coxmodel with an interaction term between treatment andgene expression is not feasible in this dataset [41].Further, the cohort is enriched for patients with IBTR,and thus the Kaplan-Meier curves and HR estimatespresented are not representative of the risk of recurrencein a matched population, and should only be interpretedas an indicator of how the different models perform inthe specific datasets. The problem of treatment given ina non-randomized fashion is not unique to our dataset,but is a general problem in the development of a RTpredictive gene expression signature. The publicly avail-able datasets analyzed here were also non-randomizedfor RT, and the dataset presented by van de Vijver in-cluded patients who underwent both modified radicalmastectomy and BCS, while the dataset by Servant et al.contained only patients who underwent BCS. Also, inthe publicly available datasets the proportion of patientsgiven RT differs. In the dataset of Servant et al., all pa-tients were given RT, while this was not the case in thevan de Vijver et al. cohort. This may explain the
Sjöström et al. Breast Cancer Research (2018) 20:64 Page 10 of 13

observed differences between the datasets when we vali-dated our SSPs. Further, systemic adjuvant treatmentwas allowed in our study and was not specified in the in-clusion criteria, which may introduce bias and make in-terpretation of the classifier performance difficult inrelation to another cohort. Indeed, there are differencesin the proportion of chemotherapy and endocrinetherapy given in the discovery and validation cohorts(Table 1, Additional file 9: Table S2). However, to correctfor this, we performed multivariate Cox regressionadjusting for tumor characteristics (subtype, size andpositive lymph nodes) and treatment (endocrine therapyand chemotherapy) for both the prognostic SSPs, and theconsecutive use of SSPs to stratify patients for treatment,which did not alter the main findings (Additional file 2).We chose to develop different models for ER+ and
ER- breast cancer, as ER status is a major determinant ofbreast cancer biology [42]. Indeed, when we analyzedthe previously reported RSS and 10-GS signatures, theydid not perform uniformly for ER+ and ER- disease. Tothat end, we investigated the biological basis behind themodels, focusing on proliferation and immune response,which have been described as the major drivers of breastcancer biology [18]. As our SSPs developed in ER+breast cancer were correlated with proliferation, onemight suspect that we found the difference between lu-minal A and luminal B tumors, which is defined mainlyby proliferation, and that our high-risk tumors weremainly luminal B tumors. However, the rate of high-riskand low-risk predictions was similar in the luminal Aand luminal B tumors. Although the performance of theSSPs were slightly higher in the luminal A tumors, thedifference was not significant. Furthermore, multivariatemodeling including subtype did not alter the findings(Additional file 2). RSS was also correlated with prolifer-ation, and it was trained in a cohort with mainly ER+tumors all treated with RT, which may explain why itcould only be validated in ER + RT+ patients. Moreinterestingly, the 10-GS could only be validated inER-RT+ patients, and the ER + RT- tumors predicted asradioresistant actually had a lower risk of IBTR,which is consistent with the follow-up study by theoriginal authors [16]. As the 10-GS is negatively cor-related with proliferation and immune response, aswas also shown recently by the original authors [17],this means that the tumors predicted as radioresis-tant were mainly slowly proliferating, and it there-fore makes sense that ER+ tumors predicted asradioresistant have a better outcome. Further, the tu-mors predicted as radioresistant have a lower im-mune response, which may explain why ER- tumorspredicted as radioresistant have a worse outcome, asthe immune response is more important in highlyproliferating and ER- tumors.
ConclusionIn conclusion, we developed and validated single-samplepredictors based on a targeted radiosensitivity gene expres-sion assay using the Nansotring nCounter platform. Wevalidated our SSPs in samples of lower RNA quality, and inexternal data, with promising results in the treatment strati-fication of patients. Previously published profiles were alsovalidated in our data, but their performance was highlydependent on the ER status of tumors. Explanations for thedifference in performance may be found in the biologicalbasis behind the different classifiers, and should be incorpo-rated in future studies.
Additional files
Additional file 1: Figure S3. Principle component analysis (PCA) plot ofthe gene expression data from the targeted panel, with coloring for thebiobank center from which the samples were derived. Center 1 and 3had samples of higher quality RNA and constituted the discovery cohort.Center 2 constituted the validation cohort. (PDF 184 kb)
Additional file 2: Supplemental methods, results and discussion. (DOCX 91 kb)
Additional file 3: Table S1. Genes included in the targeted 248-genepanel. (CSV 38 kb)
Additional file 4: Table S3. Genes in the k-top scoring pairs predictors.(XLSX 24 kb)
Additional file 5: Figure S1. Selection of top discrimination genes inthe Illumina discovery cohort data. Number of genes in the randomforest models are plotted against performance of classifying cases andcontrols, as measured by cross-validated area under the curve (AUC). Theanalysis was stratified for estrogen receptor (ER) status and radiotherapy(RT) treatment, and with added patients from other strata, based on abiological rationale as described in the text. (ZIP 171 kb)
Additional file 6: Figure S2. Hierarchical clustering of the topdiscriminating genes selected in the discovery analysis. Genes arepresented as rows, and samples as columns. Colors of the columnsrepresent group after stratification for estrogen receptor (ER) status andradiotherapy (RT), with red representing tumors with later ipsilateralbreast tumor recurrence (IBTR, cases). Colors of the rows shows thegroup in which the gene was selected. Each of the main four clusterswere compared with the clusters described by Fredlund et al. and thecluster with the highest association has been marked. (PDF 1308 kb)
Additional file 7: Table S4. Univariable and multivariable Cox -modelsfor the ER+ tumors including variables of “Give RT” vs “No RT” and “Givemore treatment”, radiotherapy, and the interaction term between theprediction variable and RT. (XLSX 8 kb)
Additional file 8: Figure S4. Correlation of SSP scores with proliferationand immune response. Raw SSP scores are plotted against a proliferationscore and an immune score, respectively. SSP scores are calculated basedon the four different models developed stratified for estrogen receptor(ER) status and radiotherapy (RT) (ER+RT+, ER+RT-, ER-RT+, ER-RT-). Pear-son correlation values and p-value from a linear model with test for zeroslope are plotted together with the linear model fit. (PDF 1160 kb)
Additional file 9: Table S2. Patient characteristics per cohort, estrogenreceptor status and radiotherapy status. (XLSX 20 kb)
Abbreviations10-GS: 10-Gene signature; AUC: Area under the curve; BCS: Breast-conservingsurgery; CI: Confidence interval; ER: Estrogen receptor alpha; FFPE: Formalin-fixedparaffin-embedded; GEO: Gene Expression Omnibus; HER2: Human epidermalgrowth factor receptor 2; HR: Hazard ratio; IBTR: Ipsilateral breast tumor recurrence;k-TSP: k-top scoring pairs; PR: Progesterone receptor; ROC: Receiver operatingcharacteristics; RSI: Radiosensitivity index; RSS: Radiosensitivity signature;RT: Adjuvant radiotherapy; SSP: Single-sample predictor
Sjöström et al. Breast Cancer Research (2018) 20:64 Page 11 of 13

AcknowledgementsWe gratefully thank Sara Baker, Carina Forsare, Kristina Lövgren and Anna-LenaBorg for excellent technical assistance. We also thank the biobanks of the SouthSweden Breast Cancer Group (SSBCG), the Biobank at the Department of Oncol-ogy and Pathology Lund University biobank at Cancer Center Karolinska andthe Biobank at Akademiska sjukhuset in Uppsala and Department of Pathology,Uppsala University, for collecting the samples and making them available forstudies. We thank the strategic cancer research program BioCARE for providingan excellent learning environment and SCIBLU Genomics for performing theIllumina HT12 anlayses. Finally, we thank Dr. Lori J Pierce, Dr. Felix Y Feng, Dr.Corey Speers, Dr. S Laura Chang and Dr. Shuang G Zhao for assistance incalculating the RSS.
FundingThe study was made possible through support from the Swedish BreastCancer Association (BRO), the Swedish Cancer Society (Cancerfonden),Region Skåne, Governmental Funding of Research within the SwedishNational Health Service (ALF), Mrs. Berta Kamprad Foundation, Anna-Lisa andSven-Erik Lundgren Foundation, Magnus Bergvall Foundation, the GunnarNilsson Cancer Foundation, the Anna and Edwin Berger Foundation, theSwedish Cancer and Allergy Foundation, Skåne County Research Foundation(FOU), Lund University Research Foundation, Skåne University HospitalResarch Foundation, BioCARE, the King Gustaf V Jubilee Fund, The CancerSociety in Stockholm, and the Marcus and Marianne Wallenberg Foundation.
Availability of data and materialsThe datasets generated during the current study are available in the GEOrepository [GEO:GSE103746].
Authors’ contributionsMS, FW, PM, MF, EN and IF conceived of and designed the study. MS, JS andPE performed the data analysis. FW, JB, PM, EN and IF provided the samples.FW, JB, PM, MF, EN and IF provided funding and supervision for the study.All authors analyzed and interpreted the results. All authors revised andapproved the manuscript.
Ethics approval and consent to participateThis study was approved by the Ethics committee of Lund University (2010-127).Patients were informed of the study through advertisements, and further consentwas waived by the ethics committee.
Competing interestsMårten Fernö and Per Malmström declare that they receive research fundingand have royalty agreements with PFS Genomics. The other authors declareno potential conflicts of interest related to the present work.
Publisher’s NoteSpringer Nature remains neutral with regard to jurisdictional claims inpublished maps and institutional affiliations.
Author details1Faculty of Medicine, Department of Clinical Sciences Lund, Oncology andPathology, Lund University, Lund, Sweden. 2Department of Haematology,Oncology and Radiation Physics ,Skåne University Hospital, Lund, Sweden.3Department of Theoretical Physics and Computational Biology, LundUniversity, Lund, Sweden. 4Department of Surgical Sciences, UppsalaUniversity, Uppsala, Sweden. 5Department of Oncology and Pathology,Cancer Center Karolinska, Karolinska Institutet, Stockholm, Sweden.6Department of Oncology, Karolinska University Hospital, Radiumhemmet,Stockholm, Sweden. 7Faculty of Medicine, Department of Clinical SciencesLund, Surgery, Lund University, Lund, Sweden. 8Department of Surgery,Skåne University Hospital, Lund, Sweden. 9Department of Molecular Medicineand Surgery, Karolinska Institutet, Stockholm, Sweden. 10Department ofBreast- and Endocrine Surgery, Karolinska University Hospital, Stockholm,Sweden.
Received: 15 January 2018 Accepted: 8 May 2018
References1. Hosseini A, Khoury AL, Esserman LJ. Precision surgery and avoiding
over-treatment. Eur J Surg Oncol. 2017;43(5):938–43.2. Harbeck N, Gnant M. Breast cancer. Lancet. 2017;389(10074):1134–50.3. Darby S, McGale P, Correa C, Taylor C, Arriagada R, Clarke M, Cutter D,
Davies C, Ewertz M, Godwin J, et al. Effect of radiotherapy after breast-conserving surgery on 10-year recurrence and 15-year breast cancer death:meta-analysis of individual patient data for 10,801 women in 17 randomisedtrials. Lancet. 2011;378(9804):1707–16.
4. Killander F, Karlsson P, Anderson H, Mattsson J, Holmberg E, Lundstedt D,Holmberg L, Malmstrom P. No breast cancer subgroup can be sparedpostoperative radiotherapy after breast-conserving surgery. Fifteen-year resultsfrom the Swedish Breast Cancer Group randomised trial, SweBCG 91 RT. Eur JCancer (Oxford, England : 1990). 2016;67:57–65.
5. Sjostrom M, Lundstedt D, Hartman L, Holmberg E, Killander F, Kovacs A,Malmstrom P, Nimeus E, Werner Ronnerman E, Ferno M, et al. Response toradiotherapy after breast-conserving surgery in different breast cancersubtypes in the Swedish Breast Cancer Group 91 Radiotherapy RandomizedClinical Trial. J Clin Oncol. 2017;35(28):3222–9.
6. Kirwan CC, Coles CE, Bliss J. It's PRIMETIME. Postoperative avoidance ofradiotherapy: biomarker selection of women at very low risk of localrecurrence. Clin Oncol (R Coll Radiol (Great Britain)). 2016;28(9):594–6.
7. Nimeus-Malmström E, Krogh M, Malmström P, Strand C, Fredriksson I,Karlsson P, Nordenskjöld B, Stål O, Östberg G, Peterson C, et al. Geneexpression profiling in primary breast cancer distinguishes patientsdeveloping local recurrence after breast-conservation surgery, with orwithout postoperative radiotherapy. Breast Cancer Res. 2008;10(2):R34.
8. Eschrich SA, Fulp WJ, Pawitan Y, Foekens JA, Smid M, Martens JW,Echevarria M, Kamath V, Lee JH, Harris EE, et al. Validation of aradiosensitivity molecular signature in breast cancer. Clin Cancer Res. 2012;18(18):5134–43.
9. Kreike B, Halfwerk H, Kristel P, Glas A, Peterse H, Bartelink H, van de Vijver MJ. Geneexpression profiles of primary breast carcinomas from patients at high risk for localrecurrence after breast-conserving therapy. Clin Cancer Res. 2006;12(19):5705–12.
10. Nuyten DS, Kreike B, Hart AA, Chi JT, Sneddon JB, Wessels LF, Peterse HJ,Bartelink H, Brown PO, Chang HY, et al. Predicting a local recurrence afterbreast-conserving therapy by gene expression profiling. Breast Cancer Res.2006;8(5):R62.
11. Servant N, Bollet MA, Halfwerk H, Bleakley K, Kreike B, Jacob L, Sie D,Kerkhoven RM, Hupe P, Hadhri R, et al. Search for a gene expressionsignature of breast cancer local recurrence in young women. Clin CancerRes. 2012;18(6):1704–15.
12. Speers C, Zhao S, Liu M, Bartelink H, Pierce LJ, Feng FY. Development andvalidation of a novel radiosensitivity signature in human breast cancer. ClinCancer Res. 2015;21(16):3667–77.
13. Tramm T, Mohammed H, Myhre S, Kyndi M, Alsner J, Borresen-Dale AL,Sorlie T, Frigessi A, Overgaard J. Development and validation of a geneprofile predicting benefit of postmastectomy radiotherapy in patients withhigh-risk breast cancer: a study of gene expression in the DBCG82bc cohort.Clin Cancer Res. 2014;20(20):5272–80.
14. Scott JG, Berglund A, Schell MJ, Mihaylov I, Fulp WJ, Yue B, Welsh E, Caudell JJ,Ahmed K, Strom TS, et al. A genome-based model for adjusting radiotherapy dose(GARD): a retrospective, cohort-based study. Lancet Oncol. 2017;18(2):202–11.
15. Zhang W, Mao JH, Zhu W, Jain AK, Liu K, Brown JB, Karpen GH.Centromere and kinetochore gene misexpression predicts cancerpatient survival and response to radiotherapy and chemotherapy. NatCommun. 2016;7:12619.
16. Torres-Roca JF, Fulp WJ, Caudell JJ, Servant N, Bollet MA, van de Vijver M,Naghavi AO, Harris EE, Eschrich SA. Integration of a radiosensitivitymolecular signature Into the assessment of local recurrence risk in breastcancer. Int J Radiat Oncol Biol Phys. 2015;93(3):631–8.
17. Strom T, Harrison LB, Giuliano AR, Schell MJ, Eschrich SA, Berglund A, FulpW, Thapa R, Coppola D, Kim S, et al. Tumour radiosensitivity is associatedwith immune activation in solid tumours. Eur J Cancer. 2017;84:304–14.
18. Nagalla S, Chou JW, Willingham MC, Ruiz J, Vaughn JP, Dubey P, Lash TL,Hamilton-Dutoit SJ, Bergh J, Sotiriou C, et al. Interactions betweenimmunity, proliferation and molecular subtype in breast cancer prognosis.Genome Biol. 2013;14(4):R34.
Sjöström et al. Breast Cancer Research (2018) 20:64 Page 12 of 13

19. Afsari B, Fertig EJ, Geman D, Marchionni L. switchBox: an R package for k-Top Scoring Pairs classifier development. Bioinformatics (Oxford, England).2015;31(2):273–4.
20. R Core Team. R: A language and environment for statistical computing.R Foundation for Statistical Computing, Vienna, Austria. 2016.https://www.R-project.org/.
21. Ritchie ME, Phipson B, Wu D, Hu Y, Law CW, Shi W, Smyth GK. limmapowers differential expression analyses for RNA-sequencing and microarraystudies. Nucleic Acids Res. 2015;43(7):e47.
22. Ritchie ME, Dunning MJ, Smith ML, Shi W, Lynch AG. BeadArrayexpression analysis using bioconductor. PLoS Comput Biol.2011;7(12):e1002276.
23. Leek JT, Johnson WE, Parker HS, Fertig EJ, Jaffe AE, Storey JD, Zhang Y,Torres LC: sva: Surrogate variable analysis. R package version 3.18.0. 2017.
24. Max K: Contributions from Jed Wing, Steve Weston, Andre Williams, ChrisKeefer, Allan Engelhardt, Tony Cooper, Zachary Mayer, Brenton Kenkel, the RCore Team, Michael Benesty, Reynald Lescarbeau, Andrew Ziem, LucaScrucca, Yuan Tang and Can Candan. (2016). caret: Classification andRegression Training. R package version 6.0-68. In.
25. Kyndi M, Sorensen FB, Knudsen H, Alsner J, Overgaard M, Nielsen HM,Overgaard J. Impact of BCL2 and p53 on postmastectomy radiotherapyresponse in high-risk breast cancer. A subgroup analysis of DBCG82 b&c.Acta oncologica (Stockholm, Sweden). 2008;47(4):608–17.
26. Nilsson MP, Hartman L, Kristoffersson U, Johannsson OT, Borg A, Henriksson K,Lanke E, Olsson H, Loman N. High risk of in-breast tumor recurrence afterBRCA1/2-associated breast cancer. Breast Cancer Res Treat. 2014;147(3):571–8.
27. Vequaud E, Desplanques G, Jezequel P, Juin P, Barille-Nion S. Survivincontributes to DNA repair by homologous recombination in breast cancercells. Breast Cancer Res Treat. 2016;155(1):53–63.
28. Veenstra C, Perez-Tenorio G, Stelling A, Karlsson E, Mirwani SM,Nordenskoljd B, Fornander T, Stal O. Met and its ligand HGF are associatedwith clinical outcome in breast cancer. Oncotarget. 2016;7(24):37145–59.
29. Trastour C, Benizri E, Ettore F, Ramaioli A, Chamorey E, Pouyssegur J, Berra E.HIF-1alpha and CA IX staining in invasive breast carcinomas: prognosis andtreatment outcome. Int J Cancer. 2007;120(7):1451–8.
30. Garvin S, Tiefenbock K, Farnebo L, Thunell LK, Farnebo M, Roberg K. Nuclearexpression of WRAP53beta is associated with a positive response toradiotherapy and improved overall survival in patients with head and necksquamous cell carcinoma. Oral Oncol. 2015;51(1):24–30.
31. van de Vijver MJ, He YD, van't Veer LJ, Dai H, Hart AA, Voskuil DW, SchreiberGJ, Peterse JL, Roberts C, Marton MJ, et al. A gene-expression signature as apredictor of survival in breast cancer. N Engl J Med. 2002;347(25):1999–2009.
32. Afsari B, Braga-Neto UM, Geman D. Rank discriminants for predictingphenotypes from RNA expression. Ann Appl Stat. 2014;8(3):1469–91.
33. Lauss M, Ringner M, Hoglund M. Prediction of stage, grade, and survival inbladder cancer using genome-wide expression data: a validation study. ClinCancer Res. 2010;16(17):4421–33.
34. Therneau T: A package for surival analysis in S. version 2.38. 2015. http://CRANR-project.org/package=survival.
35. Robin X, Turck N, Hainard A, Tiberti N, Lisacek F, Sanchez JC, Muller M.pROC: an open-source package for R and S+ to analyze and compare ROCcurves. BMC Bioinformatics. 2011;12:77.
36. Mi H, Huang X, Muruganujan A, Tang H, Mills C, Kang D, Thomas PD.PANTHER version 11: expanded annotation data from Gene Ontology andReactome pathways, and data analysis tool enhancements. Nucleic AcidsRes. 2017;45(D1):D183–d189.
37. Krop I, Ismaila N, Andre F, Bast RC, Barlow W, Collyar DE, Hammond ME,Kuderer NM, Liu MC, Mennel RG, et al. Use of biomarkers to guide decisionson adjuvant systemic therapy for women with early-stage invasive breastcancer: American Society of Clinical Oncology clinical practice guidelinefocused update. J Clin Oncol. 2017;35(24):2838–47.
38. Harris LN, Ismaila N, McShane LM, Andre F, Collyar DE, Gonzalez-Angulo AM,Hammond EH, Kuderer NM, Liu MC, Mennel RG, et al. Use of biomarkers toguide decisions on adjuvant systemic therapy for women with early-stageinvasive breast cancer: American Society of Clinical Oncology clinicalpractice guideline. J Clin Oncol. 2016;34(10):1134–50.
39. Nielsen T, Wallden B, Schaper C, Ferree S, Liu S, Gao D, Barry G, Dowidar N,Maysuria M, Storhoff J. Analytical validation of the PAM50-based ProsignaBreast Cancer Prognostic Gene Signature Assay and nCounter AnalysisSystem using formalin-fixed paraffin-embedded breast tumor specimens.BMC Cancer. 2014;14:177.
40. Kamath VP, Torres-Roca JF, Eschrich SA. Integrating biological covariatesinto gene expression-based predictors of radiation sensitivity. Internationaljournal of genomics. 2017;2017:6576840.
41. Tian L, Alizadeh AA, Gentles AJ, Tibshirani R. A simple method forestimating interactions between a treatment and a large number ofcovariates. J Am Stat Assoc. 2014;109(508):1517–32.
42. Gruvberger S, Ringner M, Chen Y, Panavally S, Saal LH, Borg A, Ferno M,Peterson C, Meltzer PS. Estrogen receptor status in breast cancer isassociated with remarkably distinct gene expression patterns. Cancer Res.2001;61(16):5979–84.
Sjöström et al. Breast Cancer Research (2018) 20:64 Page 13 of 13

![Intrinsic Radiosensitivity of Normal Human Fibroblasts and ... · (CANCER RESEARCH 52. 6348-6352. November 15. 1992] Intrinsic Radiosensitivity of Normal Human Fibroblasts and Lymphocytes](https://img.pdfslide.net/doc/110x75/60cc08f35a119f051502c1e0/intrinsic-radiosensitivity-of-normal-human-fibroblasts-and-cancer-research.jpg)