Embed Size (px)
Citation preview

ORIGINAL ARTICLE
Identification of defects on highly reflective ring componentsand analysis using machine vision
Riby Abraham Boby & Prashant S. Sonakar &
M. Singaperumal & Balakrishnan Ramamoorthy
Received: 2 February 2009 /Accepted: 11 May 2010# Springer-Verlag London Limited 2010
Abstract This paper deals with the inspection of highlyreflective chrome-coated rings used in textile machineryusing machine vision. These rings are mass produced invery large numbers, and the inspection was done manuallyusing an optical microscope. Introduction of vision inspec-tion using algorithms supplied by a commercial vendor hadnot helped the industry to achieve 100% quality inspection.In order to improve inspection speed and to ensure 100%quality inspection, it was absolutely essential to improvethe complete inspection process, and it was also required toclassify defective and non-defective components by aproper sorting algorithm. The effect of the curved,reflective nature of material and the real-time inspectionmake the imaging and defect detection and classificationdifficult. In the present study, four different algorithmsbased on Fourier filtering, auto-median, image convolution,and single-step thresholding approaches were used fordefect detection, and then their performances were com-pared with reference to efficiency of defect classificationand speed. The complete procedure, analysis, and theresults of different image processing algorithms used indefect detection are reported in this paper.
Keywords Machine vision . Fourier filtering .
Auto-median . Convolution . Defect detection . Dark field
1 Introduction
Manual inspection of components, particularly when itcomes to mass inspection, is expensive, subjective, quali-tative, inaccurate, eye straining, and time consuming. Dueto fatigue, in the long run, it might surface as anoccupational health issue to the quality control inspectors.Therefore, manual inspection has to be replaced byautomatic inspection to reduce labor fatigue, and savemoney and valuable man hours wherever possible. Thishelps in quality improvement, cost reduction, increasedvolume, and shorter cycle time. Tsai et al. [1] used Fourierimage reconstruction for detection of defect on flatsputtered surfaces. Zhang et al. [2] attempted defectdetection on ground and polished surfaces. Wiltschi et al.[3] devised a method of finding steel quality from themicroscopic images of etched and polished steel specimens.Rosati et al. [4] devised a setup and made an attempt to finddefects on reflective curved surfaces. Sun et al. [5] appliedX-ray imaging for real-time detection of defects in steeltubes. Luo et al. [6] used multiple cameras to measure thesurface conditions of cylinder and used the images tomeasure deviations. Abrahamovich et al. [7] described thecalibration and use of multiple cameras for inspection.Microstructure surfaces were reconstructed from STMimages by Samak et al. [8]. Microscopic defect detectionon mirror surfaces using laser beams have been investigatedby Porteus et al. [9] and Marrs et al. [10]. Here, applicationof image processing for real-time defect detection on highlyreflective and curved surfaces has been dealt with in detail,with reference to a specific case study namely the textilering components. Four methods of defect detection algo-rithms based on Fourier filtering [1], auto-median, imageconvolution, and single-step thresholding methods havebeen tested here in this work for accuracy and speed of
R. A. Boby : P. S. Sonakar :B. Ramamoorthy (*)Manufacturing Engineering Section, Department of MechanicalEngineering, Indian Institute of Technology Madras,Chennai, Indiae-mail: [email protected]
M. SingaperumalPrecision Engineering and Instrumentation Lab, Department ofMechanical Engineering, Indian Institute of Technology Madras,Chennai, India
DOI 10.1007/s00170-010-2730-3
/ Published online: 27 May 2010
Int J Adv Manuf Technol (2011) 52:2 –23317
detection. The merits and demerits of each have beenanalyzed such that the one best suited for real-time defectdetection is finally recommended for this purpose. Theseapproaches have been tried out for real-time defectdetection on highly reflective and curved surfaces, andtheir advantages and limitations are presented in detail inthis work.
1.1 Ring inspection
A typical photograph of a ring component and its crosssection details are shown in Fig. 1. These ring travelers areused in textile machinery and are subjected to extreme weardue to sliding contact. Because of this reason, thesecomponents are to be manufactured with high quality.Due to their critical role, they are to be subjected toinspection of various possible defects as explained below.The rings are manufactured in a CNC machine, and thenthe chrome coating is done. Hard chromium coating ishighly reflective. It is an example of a homogenousstatistical texture. The thickness of coating varies from 5to 10 μm. The outside diameter is around 45 mm and theinside diameter 38 mm (Fig. 1c). Later, the rings aresubjected to an inspection process normally using conven-tional equipment, such as profile projector, tool makersmicroscope, etc., to identify the coating defects. The typesof possible defects (Fig. 2) on the component surface aregiven below.
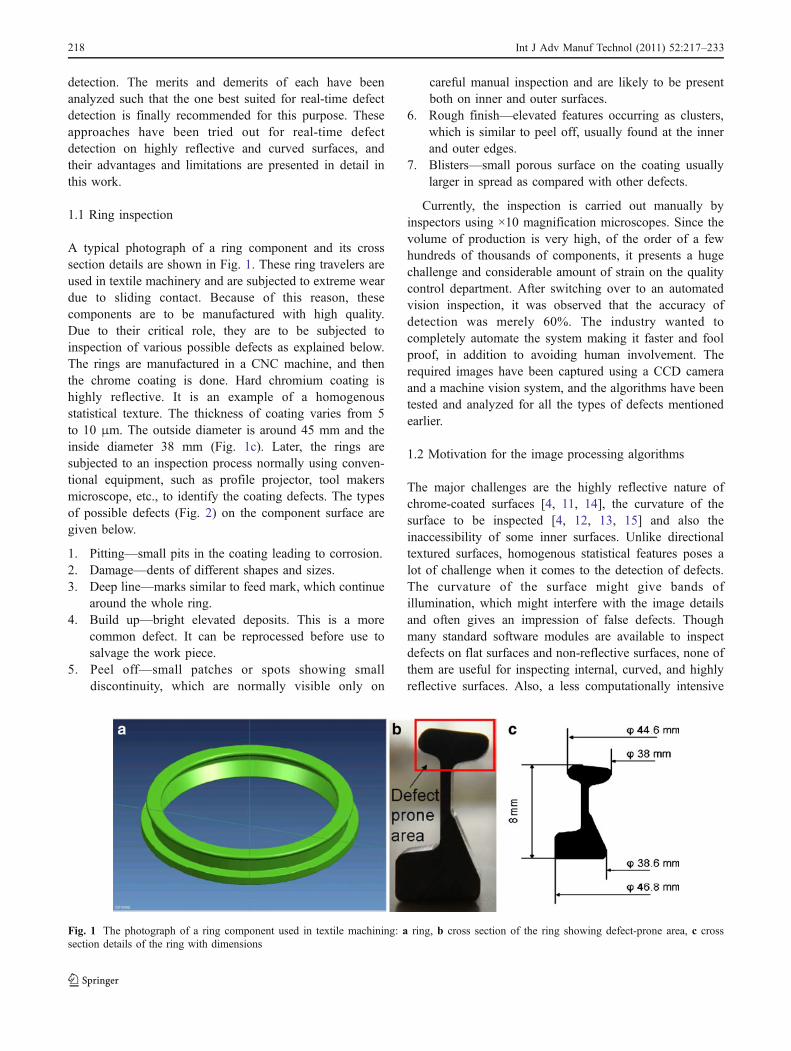
1. Pitting—small pits in the coating leading to corrosion.2. Damage—dents of different shapes and sizes.3. Deep line—marks similar to feed mark, which continue
around the whole ring.4. Build up—bright elevated deposits. This is a more
common defect. It can be reprocessed before use tosalvage the work piece.
5. Peel off—small patches or spots showing smalldiscontinuity, which are normally visible only on
careful manual inspection and are likely to be presentboth on inner and outer surfaces.
6. Rough finish—elevated features occurring as clusters,which is similar to peel off, usually found at the innerand outer edges.
7. Blisters—small porous surface on the coating usuallylarger in spread as compared with other defects.
Currently, the inspection is carried out manually byinspectors using ×10 magnification microscopes. Since thevolume of production is very high, of the order of a fewhundreds of thousands of components, it presents a hugechallenge and considerable amount of strain on the qualitycontrol department. After switching over to an automatedvision inspection, it was observed that the accuracy ofdetection was merely 60%. The industry wanted tocompletely automate the system making it faster and foolproof, in addition to avoiding human involvement. Therequired images have been captured using a CCD cameraand a machine vision system, and the algorithms have beentested and analyzed for all the types of defects mentionedearlier.
1.2 Motivation for the image processing algorithms
The major challenges are the highly reflective nature ofchrome-coated surfaces [4, 11, 14], the curvature of thesurface to be inspected [4, 12, 13, 15] and also theinaccessibility of some inner surfaces. Unlike directionaltextured surfaces, homogenous statistical features poses alot of challenge when it comes to the detection of defects.The curvature of the surface might give bands ofillumination, which might interfere with the image detailsand often gives an impression of false defects. Thoughmany standard software modules are available to inspectdefects on flat surfaces and non-reflective surfaces, none ofthem are useful for inspecting internal, curved, and highlyreflective surfaces. Also, a less computationally intensive
Fig. 1 The photograph of a ring component used in textile machining: a ring, b cross section of the ring showing defect-prone area, c crosssection details of the ring with dimensions
218 Int J Adv Manuf Technol (2011) 52:2 –23317
algorithm is required to speed up the entire inspectionprocess. A Fourier transform method has been implementedin this work in an attempt to achieve this [1]. To increasethe defect detection, a method combining a Fourier filteringmethod and an auto-median operation has been proposed inthe second algorithm. The third algorithm, based on imageconvolution, was used to reduce the time of processing atthe same time maintaining considerable accuracy ofdetection of defects. The fourth algorithm, which involvessingle-step thresholding of the image, taken under dark-field illumination, helps in increasing the speed andaccuracy of detection. This approach is based on anoptimum positioning of camera and illumination source[16]. All the algorithms were designed so that they willwork for images taken from any of the four cameradirections. So, the algorithms are generalized to serve thispurpose. Another major deciding factor is that the inspec-tion of a single ring has to be completed in 8 s withconsiderable accuracy. So, the algorithms have beenoptimized for speed. All the defects stated in Section 1.1can be detected using the algorithms.
2 Experimental setup
2.1 Imaging setup
Images of the rings were created using two differentillumination setups. Each setup necessitates a unique kind of
image processing algorithm, owing to the major differences inthe characteristics of the image captured using them.
2.1.1 Bright-field illumination
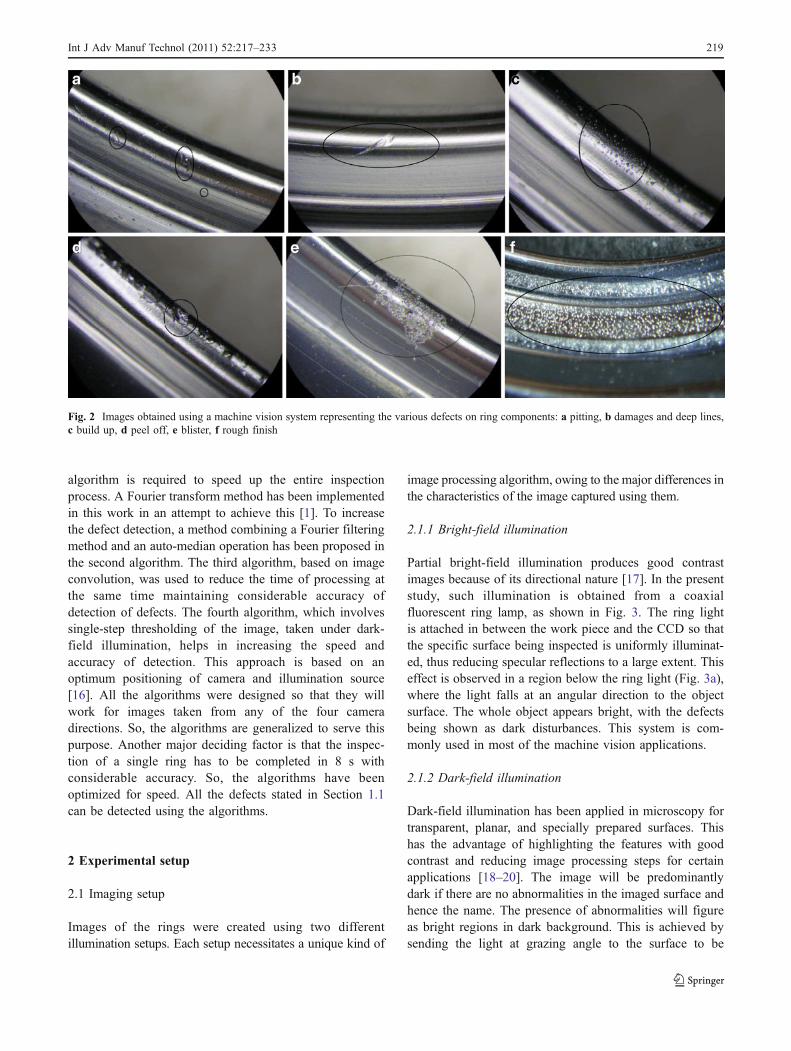
Partial bright-field illumination produces good contrastimages because of its directional nature [17]. In the presentstudy, such illumination is obtained from a coaxialfluorescent ring lamp, as shown in Fig. 3. The ring lightis attached in between the work piece and the CCD so thatthe specific surface being inspected is uniformly illuminat-ed, thus reducing specular reflections to a large extent. Thiseffect is observed in a region below the ring light (Fig. 3a),where the light falls at an angular direction to the objectsurface. The whole object appears bright, with the defectsbeing shown as dark disturbances. This system is com-monly used in most of the machine vision applications.
2.1.2 Dark-field illumination
Dark-field illumination has been applied in microscopy fortransparent, planar, and specially prepared surfaces. Thishas the advantage of highlighting the features with goodcontrast and reducing image processing steps for certainapplications [18–20]. The image will be predominantlydark if there are no abnormalities in the imaged surface andhence the name. The presence of abnormalities will figureas bright regions in dark background. This is achieved bysending the light at grazing angle to the surface to be
Fig. 2 Images obtained using a machine vision system representing the various defects on ring components: a pitting, b damages and deep lines,c build up, d peel off, e blister, f rough finish
219Int J Adv Manuf Technol (2011) 52:2 –23317
inspected. This is commonly used in microscopy oftransparent objects and in the inspection of highly reflectivesurfaces. The images captured using dark-field illuminationwere free from specular reflections, had good contrast, andthus required less processing steps for segmentation ofdefects.
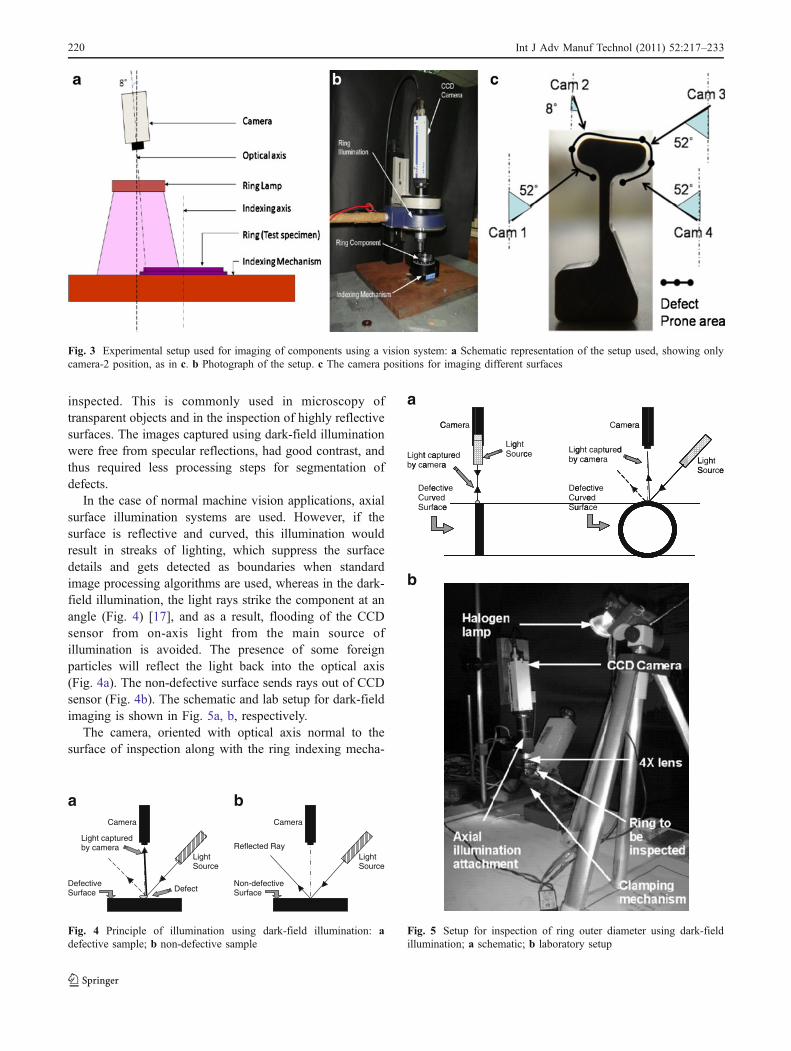
In the case of normal machine vision applications, axialsurface illumination systems are used. However, if thesurface is reflective and curved, this illumination wouldresult in streaks of lighting, which suppress the surfacedetails and gets detected as boundaries when standardimage processing algorithms are used, whereas in the dark-field illumination, the light rays strike the component at anangle (Fig. 4) [17], and as a result, flooding of the CCDsensor from on-axis light from the main source ofillumination is avoided. The presence of some foreignparticles will reflect the light back into the optical axis(Fig. 4a). The non-defective surface sends rays out of CCDsensor (Fig. 4b). The schematic and lab setup for dark-fieldimaging is shown in Fig. 5a, b, respectively.
The camera, oriented with optical axis normal to thesurface of inspection along with the ring indexing mecha-
Liby
ghty ca
DCS
t caam
efeurvurfa
aptuera
ectivvedace
C
urea
ve
e
Cam
ed
merra
LigSo
ghturcce Lig
by
DeCuSu
ghty ca
efecurveurfa
caame
ctivedace
ptuera
ve
ured
Ca
d
ameeraa
LSLighSou
hturcee
a
b
Fig. 5 Setup for inspection of ring outer diameter using dark-fieldillumination; a schematic; b laboratory setup
Reflected Ray LightSource
Non-defectiveSurface
Camera
LightSource
DefectiveSurface
Light captured by camera
Camera
Defect
a b
Fig. 4 Principle of illumination using dark-field illumination: adefective sample; b non-defective sample
Fig. 3 Experimental setup used for imaging of components using a vision system: a Schematic representation of the setup used, showing onlycamera-2 position, as in c. b Photograph of the setup. c The camera positions for imaging different surfaces
220 Int J Adv Manuf Technol (2011) 52:2 –23317

nism, has been used to create images of all surfaces of thering. Four different camera positions are required to createimages of all the required defect-prone surfaces, and theyare shown in Fig. 3c (the same positions are used for bothof the illumination setups). For example, camera position-4is used to create an image of the intersection of twosurfaces that are at a 103° angle. So, the point ofintersection and a small part of both of the surfaces canbe captured with the camera aligned to bisect the angle,thus giving 52°orientation with respect to vertical. Cameraposition-1 is used to image the surfaces that are at 112°angle, the bisector of which is 56°. It has been observedthat the imaging is not much affected with ±5° variation incamera angular position. Angular position of 52° may givean option to image the ring surface corresponding to cameraposition-4, in case one camera is to be avoided (using onecamera for both camera position-1 and camera position-4,by imaging the current surface and the diametricallyopposite position corresponding to camera position-4 bysuitably translating the ring or camera). Camera position-2is for imaging the top surface, which is at 6°, and thus,camera position can be 6±5°, and an angular position of 8°have been decided and used for the current applicationaccording to convenience in installation. Camera position-3
is used to image the curved surface. If a tangent is drawn tothe curved surface, the normal to the tangent is at 52° withrespect to vertical and hence the angular position value of52° for that camera. The proposed system in the industrywill have four cameras oriented in these positions. In thepresent study, a single camera has been used to take imagesfor development of algorithms for defect inspection.Figure 3a, b shows the camera being oriented to inspect aspecific area on the top of the ring. The resolution ofimages captured by the camera is 816×612 pixels, whereeach pixel represents 57 μm×57 μm ring surface area. Thealgorithms were implemented on Intel Core 2 Duo 2.8 GHzPC with 2 GB RAM using National Instruments Labviewsoftware, such that it will be compatible with the proposedmechanical sorting setup. The comparison of performanceof different approaches, with reference to processing timeand accuracy for individual algorithm, is presented inTable 1. Equal number of non-defective sample imagesand defective sample images was used for testing thealgorithm. The performance of the four approaches hasbeen evaluated based on 210 images of ring samplesobtained from the industry (M/s Lakshmi Machine WorksLimited, Coimbatore). The accuracy of the algorithm wasfound out using the expression,
Accuracy ¼number of defective sample images; classified as defective by algorithmþnumber of non�defective sample images; classified as non�defective by algorithmð Þ
Total number of sample imagesð Þð1Þ
2.2 Algorithm used for image processing
2.2.1 Image processing algorithms for bright-field images
FFT-based approach This approach is based on the Fourierimage reconstruction mentioned by Tsai et al. [1], which hehad used for analyzing sputtered surfaces. The illuminationsetup used is bright field. The defects are known to benormally the high-frequency details in the image. Hence, ahigh-pass filter in frequency domain was used for defectdetection.
Conversion from spatial domain to frequency domain wasdone using 2D FFT given by,
F u; vð Þ ¼XNx�1
x¼0
XNy�1
y¼0
f x; yð Þ exp �2pjux
Nxþ vy
Ny
� �� �ð2Þ
for frequency variables u=0, 1,2...Nx−1 and v=0, 1,2...Ny−1.
The power spectrum was calculated from the real andimaginary components of the FFT. That is
P u; vð Þ ¼ F u; vð Þj j2 ¼ R2 u; vð Þ þ I2 u; vð Þ ð3Þ
where R(u,v) and I(u,v) are the real and imaginary parts ofF(u,v), respectively.
The logarithmic value of the amplitude of the FFT of theimage is shown in Fig. 6a. Logarithmic value is usefulwhen it comes to visualizing sudden variations in value. Aradial line from the center of the image to the rightmost endof the image has been visualized, and the intensity of thelogarithmic plot along this line has been studied. It wasobserved that after an initial surge (due to contribution frommetallic streaks) in the value of intensities, the plot beginsto stabilize at a particular intensity value (Fig. 6b). Thispoint is of significance since it is the point at which all thelower frequency components are eliminated and the higherfrequency components start to appear. The radial cut-offdistance has to be close to this point. To find the exact cut-off radius, a disk of increasing radius was used to step by
221Int J Adv Manuf Technol (2011) 52:2 –23317

step mask all the intensity values proceeding from thecenter outward. The mask size is the radial distance alongthe radial line from the center of logarithmic FFT plot. Theoptimum value of the mask size is fixed once the maskleaves out only the intensity values that have become nearlyconstant with increasing radius from center of FFT plot.Figure 6c shows logarithmic value of the amplitude valuesof the FFT of gray-scale values of the image and theoverlapping disk of optimum diameter. The image isreconstructed after making zero all the intensity valueswithin the disk of optimum size (Fig. 6f). This recon-
structed image predominantly gives the defective areasegmented out from the statistical texture. After running iton many images, the frequency corresponding to theoptimum size of the disk has been found as 60% ofmaximum frequency. In the algorithm for the FFT approachdiscussed in the paper, this observation was used to filterout the FFT at single step with a high-pass cut-offfrequency of 60% to save processing time and to reducethe complexity of the approach. The filtered frequencyimage was again converted to spatial domain, using 2Dinverse FFT. The reconstructed image showed the high-
S. no. Method/algorithm Accuracy (%) Run time per image (s)
1 FFT on bright-field images 57 0.248
2 Auto-median on bright-field images 89 0.292
3 Image convolution on bright-field images 83 0.155
4 Single-step thresholding on dark-field images 96.5 0.047
Table 1 Performance compari-son of algorithms
Power at R = 1
0 100 200 300 400 5000
1
2
3
Distance along profile
Energy Distributiona b
c d
e f
Fig. 6 a Image showing loga-rithmic value of amplitude ofFFT and the radial line. b Plot ofintensity variation in a along theradial line. c Image showingdisk of optimum radius used tomask the intensity values withinit and the radial line. d Plot ofintensity variation in c along theradial line after the filteringoperation using the mask. eOriginal image used. f Recon-structed image of c
222 Int J Adv Manuf Technol (2011) 52:2 –23317
frequency details (defects), which were then segmented bythresholding.
Auto-median approach This approach has been developedfor application on bright-field images. The accuracy of thedetection was improved when the reconstructed image wassubjected to a contrast enhancement algorithm and thenthresholded. Later, the auto-median morphology operationwas used to remove the small objects, retaining the simplerobjects with fewer details. The expression for the auto-median operation is given below
I �M ¼ I �Mð Þ �Mð Þ �Mð Þ \ I �Mð Þ �Mð Þ �Mð Þ ð4Þ
where,
⨂ auto-median operation∘ opening operation⋅ closing operationM 3×3 structuring element
M ¼1 1 11 1 11 1 1
24
35
I image
Auto-median operation (⨂) on image (I), using a 3×3square structuring element (M), is a morphological opera-tion which consists of producing two images by imple-menting opening (∘) and closing (⋅) operations in thesequence shown in Eq. 4 and then applying logical AND(∩) operation on them [21]. Opening is erosion followedby dilation, whereas Closing is dilation followed byerosion. Auto-median is used to remove noise (whichmight appear as defect in the FFT approach) in the analyzedimage.
Image convolution approach This approach has beendeveloped for application on bright-field images. Space–time domain conversions (FFT) require more computationaltime than operations in the single spatial domain. Hence,the time for inspection was reduced to enable real-timeapplication of the algorithm by performing image process-ing operations in the space domain itself. The defects areassumed to have smaller-sized objects (e.g., damage) andrelatively larger sized (blister, peel off, etc.). Hence, theoriginal (as captured by CCD) image was convolved with akernel given by,
2 �2 2�2 9 �22 �2 2
24
35
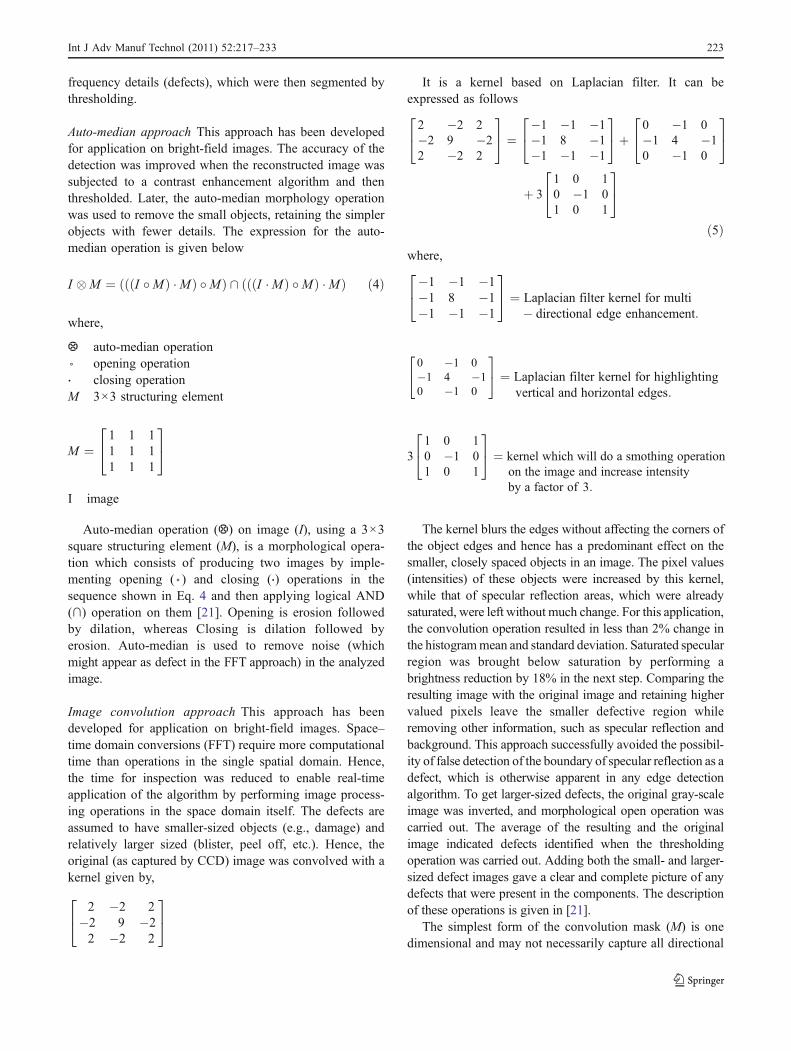
It is a kernel based on Laplacian filter. It can beexpressed as follows
2 �2 2�2 9 �22 �2 2
24
35 ¼
�1 �1 �1�1 8 �1�1 �1 �1
24
35þ
0 �1 0�1 4 �10 �1 0
24
35
þ 31 0 10 �1 01 0 1
24
35
ð5Þwhere,
�1 �1 �1�1 8 �1�1 �1 �1
24
35 ¼ Laplacian filter kernel for multi
� directional edge enhancement:
0 �1 0�1 4 �10 �1 0
24
35 ¼ Laplacian filter kernel for highlighting
vertical and horizontal edges:
31 0 10 �1 01 0 1
24
35 ¼ kernel which will do a smothing operation
on the image and increase intensityby a factor of 3:
The kernel blurs the edges without affecting the corners ofthe object edges and hence has a predominant effect on thesmaller, closely spaced objects in an image. The pixel values(intensities) of these objects were increased by this kernel,while that of specular reflection areas, which were alreadysaturated, were left without much change. For this application,the convolution operation resulted in less than 2% change inthe histogrammean and standard deviation. Saturated specularregion was brought below saturation by performing abrightness reduction by 18% in the next step. Comparing theresulting image with the original image and retaining highervalued pixels leave the smaller defective region whileremoving other information, such as specular reflection andbackground. This approach successfully avoided the possibil-ity of false detection of the boundary of specular reflection as adefect, which is otherwise apparent in any edge detectionalgorithm. To get larger-sized defects, the original gray-scaleimage was inverted, and morphological open operation wascarried out. The average of the resulting and the originalimage indicated defects identified when the thresholdingoperation was carried out. Adding both the small- and larger-sized defect images gave a clear and complete picture of anydefects that were present in the components. The descriptionof these operations is given in [21].
The simplest form of the convolution mask (M) is onedimensional and may not necessarily capture all directional
223Int J Adv Manuf Technol (2011) 52:2 –23317

information. Therefore, a 3×3 mask has been attempted. Aminimum number of calculations are required for a 3×3mask/kernel. It involves nine multiplications and eightadditions. The next higher mask (4×4) will have 16multiplications and 15 additions. So, the computationalload keeps increasing with increasing the size of the mask,and consequently, the time required for processing alsoshoots up. This may cause the inspection to take longerthan what is required by the industry. Similar facts hold truefor the auto-median operation also. The only difference isthat they are logical operations. According to Eq. 3, thenumber of dilation or erosion operations done is 18(considering all the dilation and erosion operations). So,any increase in the size of the masking kernel (let it be Δm)will increase the total number of calculations by 18�Δm� N where N ¼ total number ofð pixels in the imageÞ.The increase will be significantly higher in this case. Thedefects do not have a standard shape, and as a result, square-shaped structuring element has been used, so that variation inall directions may be accounted for. The defects of size lesserthan or equal to 2 pixels, which normally are not considered asdefects, can be removed using a structuring element of size 3×3. As a result, the smallest mask (3×3) was used for the auto-median and the convolution operation.
2.2.2 Image processing algorithm for dark-field images
Single-step thresholding for dark-field images Figure 7ashows the image of a non-defective component under dark-field illumination. Figure 7b shows the histogram, andFig. 7c shows the plot of first derivative of the histogram.The first derivative is given by,
h0ðgÞ ¼ @ hðgÞð Þ@g
¼ hðgÞ � h g � 1ð Þ ð6Þ
where,
hðgÞ ¼ histogram value corresponding to gray� scale value g
h0ðgÞ ¼ first derivative of hðgÞIt can be observed that, lim
g!255h0ðgÞ ¼ 0. On the contrary,
Fig. 8c shows h0ðgÞ for a defective sample shown inFig. 8a. The histogram in Fig. 8b does not show a majorspike in the number of pixels, but there is a noticeable,albeit small, spike in the plot of h0ðgÞ starting at g→250unlike in the case of non-defective sample shown in Fig. 7.These observations are true for all the defective ringimages. Any threshold value from a value 125 to 230should give the details about presence of defects since theplot tends to zero in that interval, till the point at which thespike occurs. This observation has been used to fix a
threshold value in this range for all the dark-field images,such that all those details which correspond to the defectsare segmented out.
3 Results and discussions
3.1 Image processing algorithms for bright-field images
In all the algorithms, to reduce the effect of noise, theobjects (represented by white pixels) with an area of morethan 5 by 5 pixels were set as defects. Any presence of suchobjects will imply that the work piece sample that has beenimaged is defective, and the count/pixel area of suchparticles will indicate the intensity of the defect. The FFTapproach for defect detection is shown in Fig. 9. Thoughthis approach has been discussed by Tsai et al. [1] to detectdefects in sputtered surfaces, some images of non-defectivesurfaces indicated false defective areas (Fig. 10).Figure 10b shows the plot of intensity function afterfiltering frequencies below 60% in the FFT of image inFig. 10a. Figure 10d shows the final reconstructed imageafter the filtering operation. There are some frequencies in anon-defective component image that were above the cut-offfrequency and appeared as defective areas in these images.There is no ideal cut-off radius or frequency for defects,which would segregate only the defective region. It couldbe due to the fact that the defects in the components arediverse in nature, localized, and prominent, unlike thedefects that occur on the sputtered surfaces.
The auto-median operation was appended to the Fourierfiltering approach in an attempt to improve the accuracy.This approach removes the smaller particles left behind,after the Fourier filtering method and the final resultingimage are shown in Fig. 11f. Figure 11d is obtained aftercontrast enhancement on the image obtained from the FFTapproach. The resulting image is thresholded, and thenclosing operation is done (Fig. 11e). The final image, withdefects segmented out, is shown in Fig. 11f, and this is theresult of auto-median operation and removal of borderobjects. The 89% accuracy of the system in detecting andclassifying the components as defective and non-defectiveparts was at the cost of increased time of inspection to0.292 s from 0.248 s for the FFT method. The reason forthis is the fact that an additional auto-median operation wasused after the Fourier filtering.
As mentioned earlier, the rings are to be inspected for allthe defect-prone areas by indexing, which necessitates thereduction in run time for an image. An image convolutionoperation was therefore used to get a simpler and fasteralgorithm. This approach is illustrated in Fig. 12. The valueplane is convolved with the convolution kernel, and thenbrightness adjustment is done to get Fig. 12c. The image
224 Int J Adv Manuf Technol (2011) 52:2 –23317

gray-scale values are compared pixel by pixel with that ofvalue plane image, and the higher gray-scale values arepreserved to get Fig. 12d, which is later thresholded. Thevalue plane image is complemented and subjected to amorphological open operation to get Fig. 12e. This image isaveraged with the value plane image and then thresholdedto get the resultant image as shown in Fig. 12g. The finalimage showing the defect segmented out is obtained byadding images shown in Fig. 12d, g pixel by pixel. Thismethod reduced processing time by 46% compared with theauto-median approach, maintaining 83% accuracy. Thespeed is owing to the simple multiplication of spatialdomain pixel values in windows by the convolution kernel.Since the Fourier conversion and reconstruction is avoided,the algorithm was easy to implement and faster in run time.Figure 13a–x shows the resultant images after applyingeach of the three algorithms on the defective sample image(Fig. 13a, e, i, m, q, and u). Figure 13y–d1 shows theresultant images after applying each of the three algorithmson a non-defective sample image (Fig. 13y, a1, and c1).
Finally, it was observed that the performance of theconvolution approach is better in terms of average process-ing time and also has a fairly high accuracy of detection.Auto-median approach and image convolution approach,which gave an accuracy of detection of 96% when onlydefective samples were tested, makes sure that very lessdefective samples will make it to the customer. When onlynon-defective samples were tested, the convolution ap-proach gave an accuracy of 70%, and the auto-medianapproach gave an accuracy of 81%. When used under ×4magnifications, the depth of focus is approximately 2 mm.As a result, while imaging all surfaces other than the topflat surface, only a small surface area will be in focus(approximately 17 mm), and the rest of the surface imagewill be blurred gradually as the surface height varies. Thismight give erroneous results while processing images ofcurved surface and is the reason for lower accuracy in someapproaches. Such an effect was really high for non-defective samples tested using the FFT algorithm and thusthe very low overall accuracy of the FFT algorithm.
(a) (b) (c)
0
1000
2000
3000
4000
5000
6000
7000
8000
9000
Gray Scale Values Gray Scale Values
Nu
mb
er o
f P
ixel
s
0 50 100 150 200 250 0 50 100 150 200 250 300-3000
-2500
-2000
-1500
-1000
-500
0
500
1000
1500
2000
Fir
st D
eriv
ativ
e
Fig. 7 a Image of non-defective surface of ring under dark-field illumination. b Histogram of a. c Plot of first derivative of h(g) in b where h′(g)≈0 as g→0
(a) (b) (c)
0
2000
4000
6000
8000
10000
Gray Scale Values Gray Scale Values
Num
ber
of P
ixel
s
Firs
t de
riva
tive
0 50 100 150 200 250
Peak
Fig. 8 a Image of defective surface (blister) of ring under dark-field illumination. b Histogram of a. c Plot of first derivative of h(g) in b showingthe slight peak in the value when g→255
225Int J Adv Manuf Technol (2011) 52:2 –23317
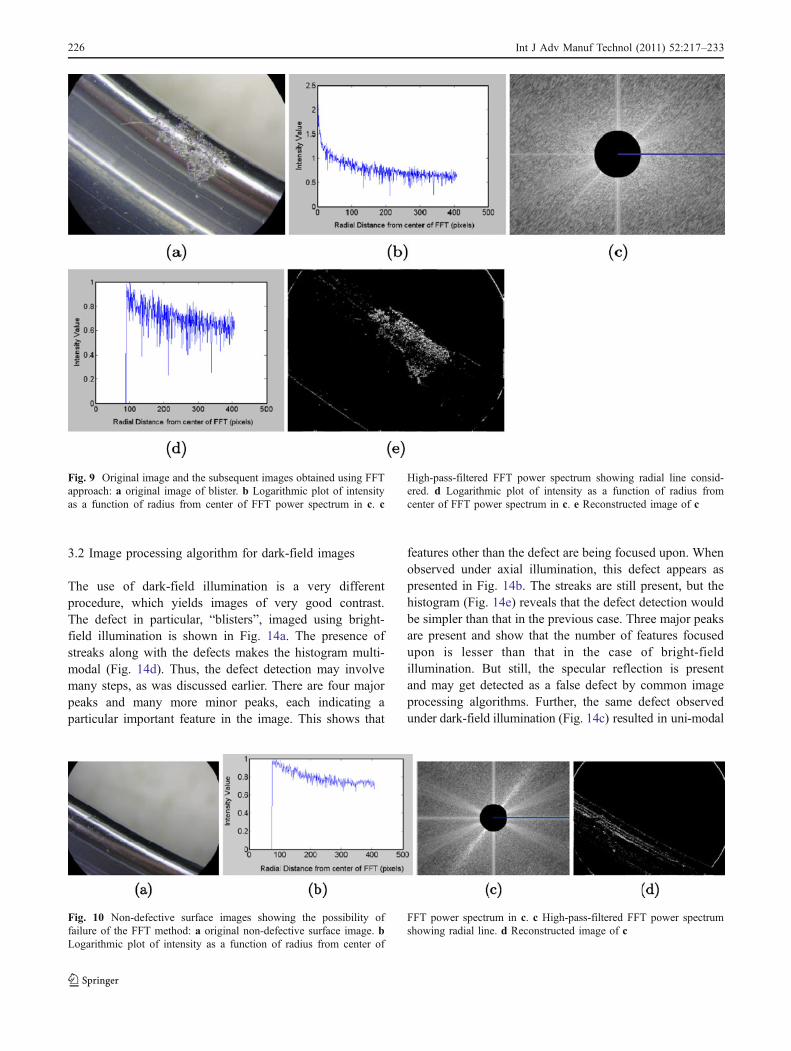
3.2 Image processing algorithm for dark-field images
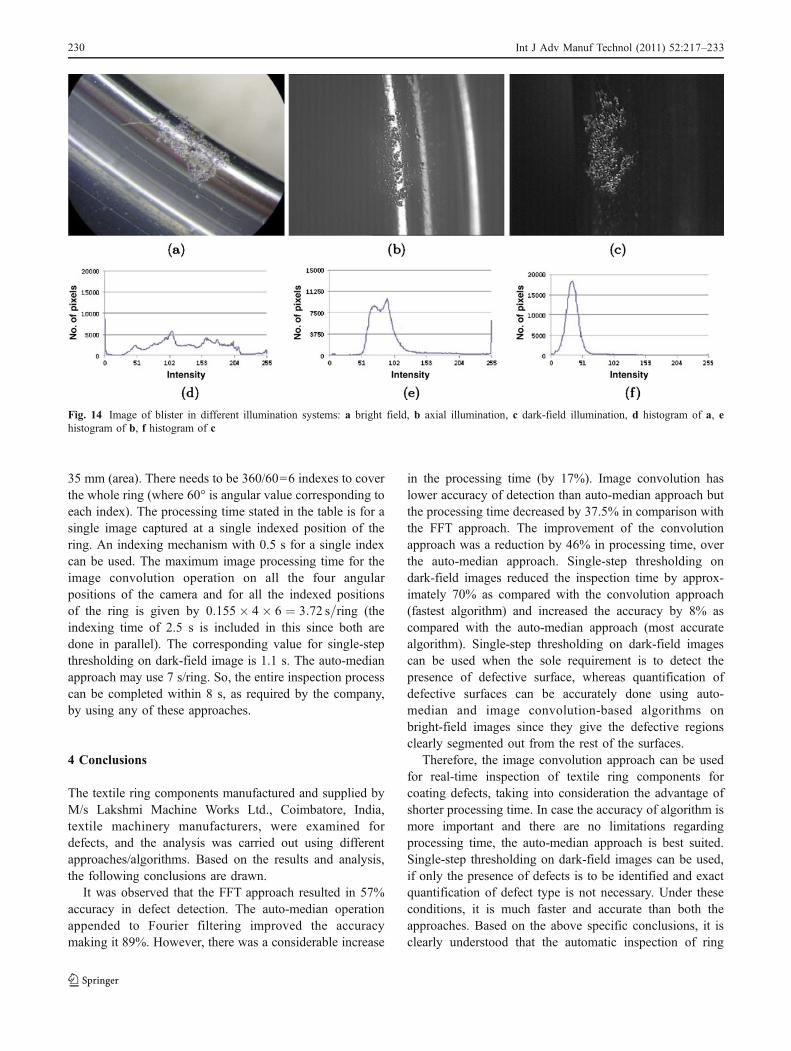
The use of dark-field illumination is a very differentprocedure, which yields images of very good contrast.The defect in particular, “blisters”, imaged using bright-field illumination is shown in Fig. 14a. The presence ofstreaks along with the defects makes the histogram multi-modal (Fig. 14d). Thus, the defect detection may involvemany steps, as was discussed earlier. There are four majorpeaks and many more minor peaks, each indicating aparticular important feature in the image. This shows that
features other than the defect are being focused upon. Whenobserved under axial illumination, this defect appears aspresented in Fig. 14b. The streaks are still present, but thehistogram (Fig. 14e) reveals that the defect detection wouldbe simpler than that in the previous case. Three major peaksare present and show that the number of features focusedupon is lesser than that in the case of bright-fieldillumination. But still, the specular reflection is presentand may get detected as a false defect by common imageprocessing algorithms. Further, the same defect observedunder dark-field illumination (Fig. 14c) resulted in uni-modal
Fig. 10 Non-defective surface images showing the possibility offailure of the FFT method: a original non-defective surface image. bLogarithmic plot of intensity as a function of radius from center of
FFT power spectrum in c. c High-pass-filtered FFT power spectrumshowing radial line. d Reconstructed image of c
Fig. 9 Original image and the subsequent images obtained using FFTapproach: a original image of blister. b Logarithmic plot of intensityas a function of radius from center of FFT power spectrum in c. c
High-pass-filtered FFT power spectrum showing radial line consid-ered. d Logarithmic plot of intensity as a function of radius fromcenter of FFT power spectrum in c. e Reconstructed image of c
226 Int J Adv Manuf Technol (2011) 52:2 –23317

intensity distribution (Fig. 14f). This shows clearly that thefeatures of the defect alone are focused, and the rest areneglected. Hence, the defect segmentation is now a simplethresholding operation as discussed before. With a suitableorientation of camera and illumination, it is possible to imageID or any other curved surface of the ring under dark-fieldimaging conditions. The single-step thresholding algorithm
discussed can be used to find the presence and absence ofdefects. Dark-field images and the corresponding thresh-olded images are shown in Fig. 15. Though the exactdefective region is not segmented, the threshold value of 127(closer to lower bound value and approximately half of themaximum gray-scale value) is used to show the approximatenature or spread of defective region. This was done just for
Fig. 11 Original image of a ring component and subsequent imagesprocessed by auto-median method: a original image of blister. b Valueplane extracted from a. c Reconstructed image of high-pass-filtered
FFT (altered by brightness and contrast changes to make detailsvisible to reader). d Contrast enhancement of c. e Close operation ond. f Auto-median operation followed by removal of border objects in e
Fig. 12 Original image of a ring component and the subsequentimages processed by image convolution method: a original image ofblister. b Value plane extracted from a. c Image b convolved withkernel and subjected to brightness adjustment. d After logical
operation, if c is less than b (altered by brightness adjustment tomake details visible to reader). e Inverse of b subjected tomorphological open operation. f Average of b and e. g Thresholdingof f. h After adding d and g
227Int J Adv Manuf Technol (2011) 52:2 –23317
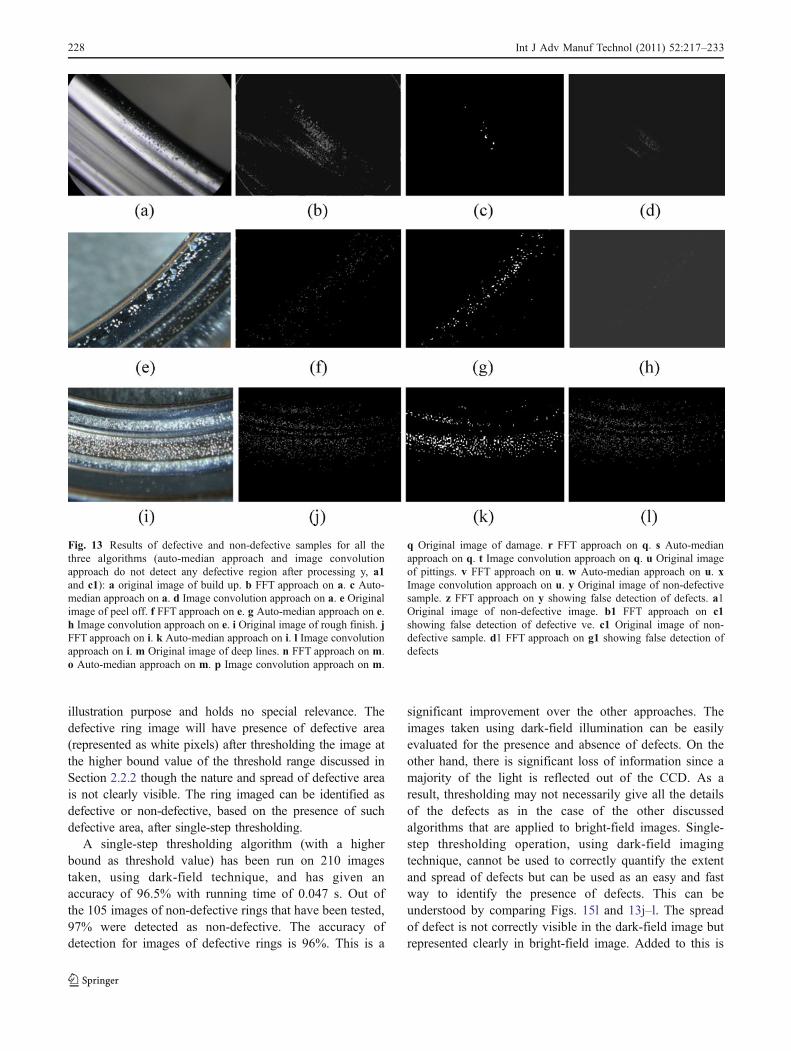
illustration purpose and holds no special relevance. Thedefective ring image will have presence of defective area(represented as white pixels) after thresholding the image atthe higher bound value of the threshold range discussed inSection 2.2.2 though the nature and spread of defective areais not clearly visible. The ring imaged can be identified asdefective or non-defective, based on the presence of suchdefective area, after single-step thresholding.
A single-step thresholding algorithm (with a higherbound as threshold value) has been run on 210 imagestaken, using dark-field technique, and has given anaccuracy of 96.5% with running time of 0.047 s. Out ofthe 105 images of non-defective rings that have been tested,97% were detected as non-defective. The accuracy ofdetection for images of defective rings is 96%. This is a
significant improvement over the other approaches. Theimages taken using dark-field illumination can be easilyevaluated for the presence and absence of defects. On theother hand, there is significant loss of information since amajority of the light is reflected out of the CCD. As aresult, thresholding may not necessarily give all the detailsof the defects as in the case of the other discussedalgorithms that are applied to bright-field images. Single-step thresholding operation, using dark-field imagingtechnique, cannot be used to correctly quantify the extentand spread of defects but can be used as an easy and fastway to identify the presence of defects. This can beunderstood by comparing Figs. 15l and 13j–l. The spreadof defect is not correctly visible in the dark-field image butrepresented clearly in bright-field image. Added to this is
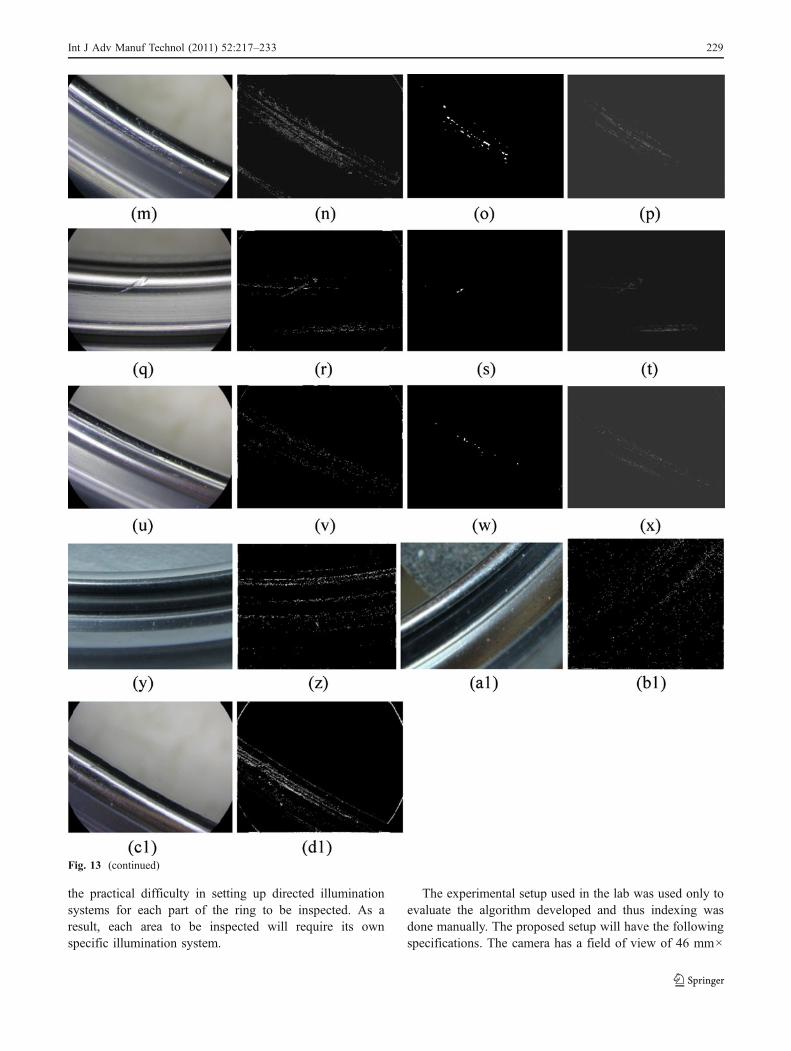
Fig. 13 Results of defective and non-defective samples for all thethree algorithms (auto-median approach and image convolutionapproach do not detect any defective region after processing y, a1and c1): a original image of build up. b FFT approach on a. c Auto-median approach on a. d Image convolution approach on a. e Originalimage of peel off. f FFT approach on e. g Auto-median approach on e.h Image convolution approach on e. i Original image of rough finish. jFFT approach on i. k Auto-median approach on i. l Image convolutionapproach on i. m Original image of deep lines. n FFT approach on m.o Auto-median approach on m. p Image convolution approach on m.
q Original image of damage. r FFT approach on q. s Auto-medianapproach on q. t Image convolution approach on q. u Original imageof pittings. v FFT approach on u. w Auto-median approach on u. xImage convolution approach on u. y Original image of non-defectivesample. z FFT approach on y showing false detection of defects. a1Original image of non-defective image. b1 FFT approach on c1showing false detection of defective ve. c1 Original image of non-defective sample. d1 FFT approach on g1 showing false detection ofdefects
228 Int J Adv Manuf Technol (2011) 52:2 –23317
the practical difficulty in setting up directed illuminationsystems for each part of the ring to be inspected. As aresult, each area to be inspected will require its ownspecific illumination system.
The experimental setup used in the lab was used only toevaluate the algorithm developed and thus indexing wasdone manually. The proposed setup will have the followingspecifications. The camera has a field of view of 46 mm×
Fig. 13 (continued)
229Int J Adv Manuf Technol (2011) 52:2 –23317
35 mm (area). There needs to be 360/60=6 indexes to coverthe whole ring (where 60° is angular value corresponding toeach index). The processing time stated in the table is for asingle image captured at a single indexed position of thering. An indexing mechanism with 0.5 s for a single indexcan be used. The maximum image processing time for theimage convolution operation on all the four angularpositions of the camera and for all the indexed positionsof the ring is given by 0:155� 4� 6 ¼ 3:72 s=ring (theindexing time of 2.5 s is included in this since both aredone in parallel). The corresponding value for single-stepthresholding on dark-field image is 1.1 s. The auto-medianapproach may use 7 s/ring. So, the entire inspection processcan be completed within 8 s, as required by the company,by using any of these approaches.
4 Conclusions
The textile ring components manufactured and supplied byM/s Lakshmi Machine Works Ltd., Coimbatore, India,textile machinery manufacturers, were examined fordefects, and the analysis was carried out using differentapproaches/algorithms. Based on the results and analysis,the following conclusions are drawn.
It was observed that the FFT approach resulted in 57%accuracy in defect detection. The auto-median operationappended to Fourier filtering improved the accuracymaking it 89%. However, there was a considerable increase
in the processing time (by 17%). Image convolution haslower accuracy of detection than auto-median approach butthe processing time decreased by 37.5% in comparison withthe FFT approach. The improvement of the convolutionapproach was a reduction by 46% in processing time, overthe auto-median approach. Single-step thresholding ondark-field images reduced the inspection time by approx-imately 70% as compared with the convolution approach(fastest algorithm) and increased the accuracy by 8% ascompared with the auto-median approach (most accuratealgorithm). Single-step thresholding on dark-field imagescan be used when the sole requirement is to detect thepresence of defective surface, whereas quantification ofdefective surfaces can be accurately done using auto-median and image convolution-based algorithms onbright-field images since they give the defective regionsclearly segmented out from the rest of the surfaces.
Therefore, the image convolution approach can be usedfor real-time inspection of textile ring components forcoating defects, taking into consideration the advantage ofshorter processing time. In case the accuracy of algorithm ismore important and there are no limitations regardingprocessing time, the auto-median approach is best suited.Single-step thresholding on dark-field images can be used,if only the presence of defects is to be identified and exactquantification of defect type is not necessary. Under theseconditions, it is much faster and accurate than both theapproaches. Based on the above specific conclusions, it isclearly understood that the automatic inspection of ring
Fig. 14 Image of blister in different illumination systems: a bright field, b axial illumination, c dark-field illumination, d histogram of a, ehistogram of b, f histogram of c
230 Int J Adv Manuf Technol (2011) 52:2 –23317

Fig. 15 a Image of ring (show-ing blister) under dark-field il-lumination. b Image afterthresholding a at gray-scale val-ue g=127 (89 defective regionsdetected) (after thresholding a atgray-scale value g=230, threedefective regions are detected). cImage of ring (showing deepline) under dark-field illumina-tion. d Image after thresholdingd at gray-scale value g=127 (28defective regions detected). eImage after thresholding d atgray-scale value g=230 (13 de-fective regions detected). f Im-age of ring (showing heavyblister) under dark-field illumi-nation. g Image after threshold-ing g at gray-scale value g=127(51 defective regions detected).h Image after thresholding g atgray-scale value g=230 (24 de-fective regions detected). i Im-age of ring (non-defectivesurface) under dark-field illumi-nation. (After thresholding j atgray-scale value g=127, sevendefective regions are detected,and after thresholding j at gray-scale value g=230, 0 defectiveregions are detected). j Image ofring (showing build up) underdark-field illumination. k Imageafter thresholding m at gray-scale value g=127 (21 defectiveregions detected) (image afterthresholding m at gray-scalevalue g=230 1 defective regionis detected). l Image of ring(showing rough finish) underdark-field illumination. m Imageafter thresholding m at gray-scale value g=127 (41 defectiveregions detected). n Image afterthresholding m at gray-scalevalue g=230 (15 defectiveregions detected). o Image ofring (showing pitting) underdark-field illumination. p Imageafter thresholding s at gray-scalevalue g=127 (eight defectiveregions detected). q Image afterthresholding s at gray-scale val-ue g=230 (one defective regiondetected). r Image of ring(showing damage) under dark-field illumination. s Image afterthresholding v at gray-scale val-ue g=127 (32 defective regionsdetected). t Image after thresh-olding v at gray-scale value g=230 (two defective regionsdetected)
231Int J Adv Manuf Technol (2011) 52:2 –23317

components could be successfully implemented, and theentire process of inspection could also be made much fasterand reliable.
Acknowledgment This work was carried out with the support ofM/s Lakshmi Machine Works Ltd., Coimbatore, India.
Appendix
Value plane
The value plane of a colored image is given by
V r; cð Þ ¼ 1
3R r; cð Þ þ G r; cð Þ þ B r; cð Þð Þ
R(r,c) is the red intensity value for index r,c; G(r,c) is thegreen intensity value for index r,c; B(r,c) is the blueintensity value for index r,c. Value plane is used to get agray-scale image from a color image by an average value ofall the colors.
Different types of illumination
In bright-field illumination setup, the light rays from thesource of illumination falls on a planar object to beinspected at an angle lesser than 45° with respect to surfacenormal and the optical axis of camera coincides with thesurface normal. In this case, the maximum amount of lightis reflected from the surface to be inspected unto the CCDsensor. Axial illumination also is a special case of bright-field illumination. If the angle of incidence is more than45°, the illumination is said to be dark field, where the
defects are highlighted as white specks in dark backgroundbut with less overall information about surface texture.
Accuracy of inspection [22]
Accuracy of inspector
¼ Percentage of defects correctly identified
¼ d � kð Þ= d � k þ bð Þwhere,
d defects reported by the inspectork number of defects reported by the inspector
but determined by the check inspector not tobe defects
(d−k) true defects found by the inspector=correctdetections by the algorithm
b defects missed by the inspector, asdetermined by check inspection
(d−k+b) true defects originally in the product=thetotal number of samples of known status thatis supplied to the algorithm
So, the expression can be rewritten as,
Accuracy ¼ Number of cases of correct inspection by algorithmð Þ=Total number of samples of known status input to the algorithmð Þ
For example, if 100 defective image samples are input tothe algorithm and the algorithm correctly detects say, 80 ofthem, accuracy will be 80%. According to Juran et al. [22],
Fig. 15 (continued)
232 Int J Adv Manuf Technol (2011) 52:2 –23317

the expression for accuracy holds true for 100% visualinspection. In automation of visual inspection, the accuracyof the method is determined by first getting the samplestested by the inspection system and then by an experiencedinspector. Similar methodology has been followed in thiscase also. The quality control team from the industry hadsupplied chrome-coated rings with the defective areascarefully marked out. The images of these defective regionsof the samples were used to test all the algorithms. This wasdone by running the algorithm on the images that werepredetermined to be defective and then evaluating theresults in terms of number of sample images detected asdefective. The same procedure was repeated for non-defective regions of the ring.
References
1. Tsai DM, Kuo CC (2007) Defect detection in inhomogenouslytextured sputtered surfaces using 3D Fourier image reconstruction.Mach Vis Appl 18:383–400. doi:10.1016/S0262-8856(99)00009-8
2. Zhang X, Krewet C, Kuhlenkötter B (2006) Automatic classifi-cation of defects on the product surface in grinding and polishing.Int J Mach Tools Manuf 46:59–69. doi:10.1016/j.ijmachtools.2005.03.013
3. Wiltschi K, Pinz A, Lindberg T (2000) An automatic scheme forsteel quality inspection. Mach Vis Appl 12:113–128. doi:10.1007/s001380050130
4. Rosati G, Boschetti G, Biondi A, Rossi A (2009) Real-time defectdetection on highly reflective curved surfaces. Opt Lasers Eng 47(3–4):379–384. doi:10.1016/j.optlaseng.2008.03.010
5. Sun Y, Bai P, Sun HY, Zhou P (2005) Real time automatic defectdetection of weld defects in steel pipe. NDT E Int 38:522–528.doi:10.1016/j.ndteint.2005.01.011
6. Luo PF, Liou SS (1998) Measurement of curved surfaces bystereo vision and error analysis. Opt Lasers Eng 30:471–486.doi:10.1016/S0143-8166(98)00052-9
7. Abramovich G, Barhak J, Spicer P (2005) Reconfigurable arrayfor machine vision inspection (RAMVI) Proceedings of the 3rdInternational CIRP Conference on Reconfigurable Manufacturing.Ann Arbor, USA, R-01, May 10–12, 2005
8. Samak D, Fischer A, Rittel D (2007) 3D reconstruction andvisualization of microstructure surfaces from 2D images. AnnCIRP 56(1):149–152. doi:10.1016/j.cirp.2007.05.036
9. Porteus JO, Spiker CJ, Franck JB (1986) Correlation between He–Ne scatter and 2.7 μm pulsed laser damage at coating defects.Appl Opt 25(21):3871–3879. doi:10.1364/AO.25.003871
10. Marrs CD, Porteus JO (1985) Nondestructive defect detection in laseroptical coatings. J Appl Phys 57(5):1719–1722. doi:10.1063/1.334443
11. Khalili K, Webb P (2007) The development and application of amultiple wavelength illumination technique for the vision-basedprocess monitoring of aero-structure riveting. Mach Vis Appl18:73–83. doi:10.1007/s00138-006-0049-8
12. Lee MFR, deSilva CW, Croft EA, Wu QMJ (2000) Machinevision system for curved surface inspection. Mach Vis Appl12:177–188. doi:10.1007/s001380000043
13. Aluze D, Merienne F, Dumont C, Gorria P (2002) Vision systemfor defect imaging, detection, and characterization on a specularsurface of a 3D object. Image Vis Comput 20:569–580.doi:10.1016/S0262-8856(02)00046-X
14. Pfeifer T, Wiegers L (1998) Adaptive control for the optimizedadjustment of imaging parameters for surface inspection usingmachine vision. Ann CIRP 47(1):459–462. doi:10.1016/S0007-8506(07)60625-8
15. Perng DB, Chen SH, Chang YS (2009) A novel internal threaddefect auto-inspection system. Int J Adv Manuf Technol.doi:10.1007/s00170-009-2211-8
16. Yi S, Haralick RM, Saphiro LG (1995) Optimal sensor and lightsource positioning for machine vision. Computerv Image Underst61(1):122–137. doi:10.1006/cviu.1995.1009
17. Martin D (2007) A practical guide to machine vision lighting.Advanced illumination. http://advancedillumination.com/uploads/downloads/ A Practical Guide to Machine Vision Lighting.pdf.Accessed 30 Jan 2009
18. Noda N, Kamimura S (2008) A new microscope optics for laserdark-field illumination applied to high precision two dimensionalmeasurement of specimen displacement. Rev Sci Instrum 79(2):1–7. doi:10.1063/1.2839914
19. Bamforth PE, Jackson MR, Williams K (2007) Transmission dark-field illuminationmethod for high-accuracy automatic lace scalloping.Int J Adv Manuf 32(5–6):599–607. doi:10.1007/s00170-005-0359-4
20. Biss DP, Youngworth KS, Brown TG (2006) Dark-field imagingwith cylindrical-vector beams. Appl Opt 45(3):470–479.doi:10.1364/AO.45.000470
21. Thomas K (2003) Image processing with LabVIEW™ andIMAQ™ Vision. Prentice-Hall, Englewood Cliffs
22. Juran JM, Godfrey AB (1998) Juran's quality control handbook,5th edn. McGraw-Hill, New York. doi:10.1036/007034003X
233Int J Adv Manuf Technol (2011) 52:2 –23317