Embed Size (px)
Citation preview
Identification of Electrolytes in Aqueous Solutions from Near-IR Spectra
J I E L I N , * JING ZHOU, and CHRIS W. B R O W N t Department of Chemistry, University of Rhode Island, Kingston, Rhode Island 02881
Dissolut ion of e lectrolytes causes character is t ic changes in the near- IR spec trum of water. These changes result from a decrease in the concentrat ion of water; c h a r g e - d i p o l e interact ions be tween ions and water molecules ; format ion of hydrogen bonds between oxygen or ni trogen atoms in some ions and water molecules; product ion of H ÷ a n d O H - ions from dissociat ion and hydrolys is ; absorpt ions due to OH, NH, and C H groups in some ions; and intrinsic colors of some transit ion metal ions. Changes in spectra were used for iden- tification of e lectrolytes in aqueous solutions. Near - IR spectra of 71 solutions of s ingle e lectrolytes were measured and used to deve lop a spectral l ibrary. This near-IR spectral l ibrary was processed with principal c o m p o n e n t regress ion (PCR) and used for the identifica- tion of s ingle and mult iple e lectrolytes in aqueous solutions with the use of their spectra. Most of the u n k n o w n electrolytes were identi- fied correct ly . For the others , very s imilar e lectrolytes were selected with one ion identified correct ly . The near-IR spectral l ibrary of aqueous solutions of e lectrolytes can be used as a s imple and fast approach for the identif ication of electrolytes.
Index Headings: N e a r - I R spectra; Electrolytes; Spectral l ib ra ry ; Li- b r a r y search; Identif ication.
I N T R O D U C T I O N
Because of the increasing availability of computers, identification of unknown compounds by searching spec- tral libraries has become an increasingly common prac- tice. Numerous algorithms have been developed for the spectral library search using infrared (IR), 1-7 near-IR, 8 and UV-visible spectra. 9,1° Near-IR spectra of aqueous so- lutions of electrolytes have been used to study the struc- ture of water 11 13 and to determine the concentrations of electrolytes?4 22 It has been found that different electro- lytes change the near-IR spectrum of water in different ways and to varying degrees. However, little effort has been made to use these changes in near-IR spectra as the basis for identification of electrolytes in aqueous solu- tions? 5 Potentially, near-IR can be used for rapid identi- fication of electrolytes in aqueous solutions. It has the advantages that sample preparation is not required and the sample is not consumed. Moreover, it can be used for remote monitoring. The method could be used in analysis of water pollution samples as a prel iminary screening technique for identifying the presence of electrolytes.
In this investigation, near-IR spectra of aqueous solu- tions of 71 electrolytes were measured and used to com- pile a spectral library. Identifications of single and mul- tiple electrolytes were performed by library searching us- ing near-IR spectra of their aqueous solutions.
E X P E R I M E N T A L
Solutions of Electrolytes. Aqueous solutions of 71 electrolytes at a concentration of 0.5 M were prepared with reagent-grade salts from various sources (Sigma, Al- drich, Fisher, Mallinckrodt, and J. T. Baker). Sixteen un- known solutions containing single electrolytes, eight so- lutions containing two electrolytes, and two solutions containing three electrolytes were prepared by mixing so- lutions of single electrolytes in equal ratios.
Spectral Measurements. Near-IR spectra of aqueous solutions in the 1100-2500 nm range were measured on an NIRSys tem Model 6250 near-IR spectrophotometer using a 2 -mm cuvette at 28.5 °C. The spectral resolution was 10 nm, and the data point resolution was 2 nm. Twenty scans were coadded to obtain a spectrum.
Data Processing. Spectra in the 1100-1870 nm region were used for data processing; the 1870-2500 nm region was not used, because some of the water bands have ab- sorbances larger than 2.5. As can be seen later, the dif- ference spectra in the latter region were relatively noisy.
Details of the algorithm used to generate the spectral library and to search for an unknown can be found else- where. 6-8,~° Only a brief description is provided here. Spectra of the n known electrolytes in the library were treated as n standard spectra for a mult icomponent anal- ysis of n components. Principal component regression (PCR) was used to reduce the dimensionality of the data and to calculate the regression coefficients f rom the con- centrations of the electrolytes in the standard solutions. Since only one pure standard was used per electrolyte, the effects of interactions in mixtures and nonlinear be- haviors were not considered; thus, only approximate or pseudo-concentrations are predicted. We refer to these p s e u d o - c o n c e n t r a t i o n s as c o m p o s i t i o n indices (CIs) . Twenty eigenvectors were used in the PCR; we deter- mined this number by trial and error, starting with 10 eigenvectors and increasing the number in increments of five until the best results were obtained on known mixtures. For searching spectra of mixtures of multiple electrolytes, the first PCR analysis was followed by the application of an adaptive filter to remove all similarity of the first target electrolyte from the spectrum and fi'om spectra in a selected subgroup of the library; i.e., the spectra were made orthogonal to that of the target elec- trolyte. This step was followed by a second PCR analysis on the modified spectra to identify the next target elec- trolyte. These analyses were repeated until all the elec- trolytes were identified and the residuals decreased to near zero; i.e., CI < 0.1.
Received 3 March 1995; accepted 27 November 1995. * Present address: Department of Chemistry, Portland State University,
Portland, OR 97207. 1 Author to whom correspondence should be sent.
R E S U L T S A N D D I S C U S S I O N
Near-IR Spectra of Aqueous Solutions of Different Electrolytes. There are several processes leading to
444 Volume 50, Number 4, 1996 0003-7028/96/5004-044452.00/0 APPLIED S P E C T R O S C O P Y © 1996 Society for Applied Spectrocopy
O
.£ O
.O <
Water
ooo sbo o'oo Wavelength (nm)
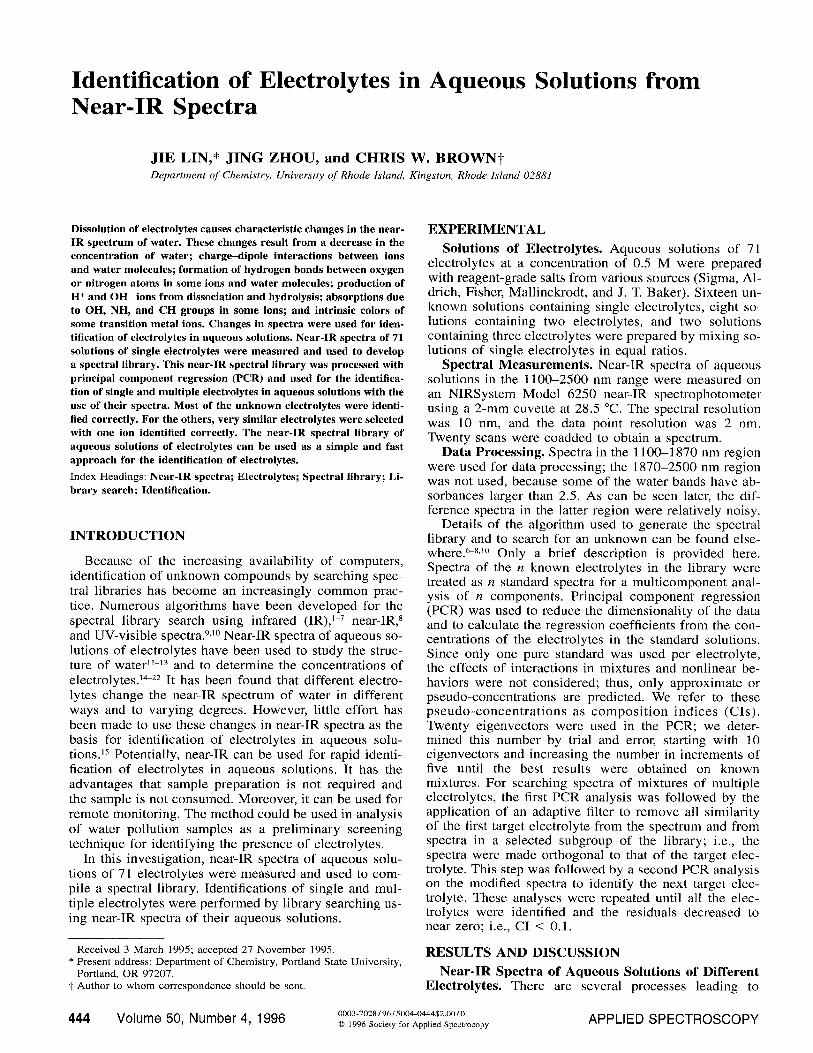
FIG. I. Near-IR spectrum of water in a 2-mm cell.
changes in the near-IR spectra o f water caused by the dissolution o f electrolytes. For comparison, the spectrum of pure water is shown in Fig. 1. The potential effects include the fol lowing: (1) a change (mostly, a decrease) in the concentration of water; (2) charge-dipole interac- tions between ions and water molecules , which change the hydrogen-bonding of OH groups of water; (3) the formation o f hydrogen bonds between oxygen or nitrogen atoms in some ions and water molecules; (4) the condi- tion by which some anions contain OH (e.g., HCO~, HPO~ , H~PO2, and citrate), CH (e.g., acetate, ethylene- diacetate, and citrate), and N H (NHJ) groups; and (5) the condition by which some produce OH- and H + ions through hydrolysis o f ions (e.g., CO~-, HPO] , AP +, and NH2). Furthermore, solutions of some transition metal (i.e., Cu 2+, Ni a+, CO 2+, and Cr 3+ ) salts are colored and their absorptions extend into the near-IR region. There- fore, different electrolytes will cause different changes in near-IR spectra o f water, and these changes in spectra can be used for the identification of electrolytes in aqueous solutions.
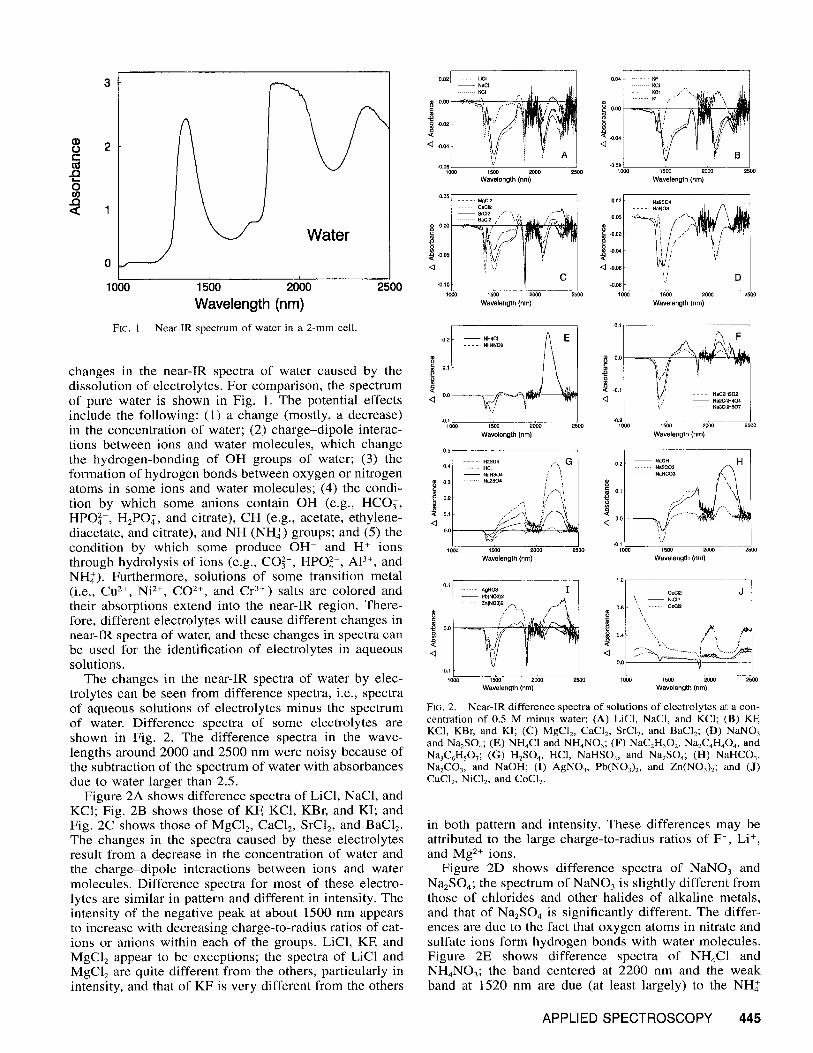
The changes in the near-IR spectra of water by elec- trolytes can be seen from difference spectra, i.e., spectra o f aqueous solutions o f electrolytes minus the spectrum of water. Difference spectra o f some electrolytes are shown in Fig. 2. The difference spectra in the wave- lengths around 2000 and 2500 nm were noisy because of the subtraction o f the spectrum of water with absorbances due to water larger than 2.5.
Figure 2A shows difference spectra of LiC1, NaC1, and KC1; Fig. 2B shows those of KF, KC1, KBr, and KI; and Fig. 2C shows those o f MgC12, CaClz, SrC12, and BaCla. The changes in the spectra caused by these electrolytes result from a decrease in the concentration of water and the charge-dipole interactions between ions and water molecules . Difference spectra for most of these electro- lytes are similar in pattern and different in intensity. The intensity of the negative peak at about 1500 nm appears to increase with decreasing charge-to-radius ratios of cat- ions or anions within each of the groups. LiCI, KF, and MgCla appear to be exceptions; the spectra of LiC1 and MgCI~ are quite different from the others, particularly in intensity, and that of KF is very different from the others
0.02 . . . . ucI - - NaCI
......... ~ ' tli
~ -0.02
'i <] -0.64 ,j
"°'~ooo 1500 2000 Wavelength (nm)
o.oo
I t7
-0.05
<Q
-0.10
10110
- - MgCI2 ........... CaCI2
. . . . . ," "'?; = i i ~ / % , ~ i ~
Wavelength (nm)
0-04 .... . KF ....... KCI
~ -o,o4
-o.o~ 1500 2O0O
Wavelength ( r im)
0.02 - - N~u~SO4
"t~i/" 7 <1 i.," D
1500 2000
Wavelength ( nm)
8 .~ 0.1
o.o
-- NH4CI A E
.......... ~r ;--'~
-01000.1 1500 2OO0 25
Wavelength (nm)
0.5 H2804
0.4 ......... HCi . " , G - - NaHSO4 / '
O~ 0,2 ......... Ne2SO4
o.~ ,,-, :/ \,,
o.1 / j .~ q
1500 2000 2500
Wavelength (nm)
8
<3
o+l c
~x. F
.0.1
~:" ........... Na3C6HSO7
.o.2 L 1O~XI 1500 2~10(1 2~
Wavelength ( nm)
- - NaOH p
- NaHCO3 . -
".%
i j: .o.1
1000 15c0 20OO Wavelength (nrn)
r o.~ [ ........... A~N03 I
/ - - Pb(NO3}2 O . . . . . Z~ (N03 )2 . , .-~ ,i
8 /"' "'"; /" ' t r t?pq 0 . 0 ~
11111O 1500 28OO 250O
Wavelength (nm)
' CuCI2 J ' , N~CI2
0.8 .......... CoCK
8
10t)0 1500 20OO 2500 Wavelength ( nm)
FIG. 2. Near-IR difference spectra of solutions of electrolytes at a con- centration of 0.5 M minus water: (A) LiC1, NaC1, and KCI; (B) KE KCI, KBr, and KI; (C) MgC12, CaC12, SrC12, and BaC12; (D) NaNO 3 and Na2SO4; (E) NH4Cl and NH4NO3; (F) NaC2H3Oa, Na2C4H404, and Na3CaHsOT; (G) H2SO4, HC1, NaHSO 4, and Na2SO4; (H) NaHCO3, Na2CO3, and NaOH; (I) AgNO 3, Pb(NO3) 2, and Zn(NO3)2; and (J) CuCI2, NiCI2, and CoC12.
in both pattern and intensity. These differences may be attributed to the large charge-to-radius ratios of F- , Li +, and Mg 2+ ions.
Figure 2D shows difference spectra of N a N O 3 and Na2SO4; the spectrum of NaNO3 is slightly different from those o f chlorides and other halides of alkaline metals, and that o f Na2SO4 is significantly different. The differ- ences are due to the fact that oxygen atoms in nitrate and sulfate ions form hydrogen bonds with water molecules . Figure 2E shows difference spectra of NH4CI and NH4NO3; the band centered at 2200 nm and the weak band at 1520 nm are due (at least largely) to the NH2
APPLIED SPECTROSCOPY 445
T A B L E I. Results for searching single electrolytes in aqueous so- lutions.
NH4NO3 Ni(NO3)~
Position" CI Position CI
1. NH4NO 3 0.225 1. Ni(NO3)~ 0.440 2. NH4C1 0.178 2. NiCI~ 0.408 3. NHaBr 0.156 3. CoCI~ 0.116 4. NH4I 0.139 4. NaC1 0.065 5. (NH4)2SO 4 0.113 5. Na~C4H404 0.059
NaNO3 Na~CO3
Position CI Position CI
1. NaCI 0.209 1. Na2HPO4 0.106 2. NaNO3 0.184 2. K2HPO4 0.105 3. CaCI 2 0.184 3. Na2CO 3 0.104 4. KNO3 0.166 4. NaOH 0.096 5. NaOH 0.140 5. LiOH 0.092
Position at which each of the electrolytes showed up in the list.
ions. Figure 2F shows difference spectra for NaC2H302, N a 2 C n H 4 0 4 , and N a 3 C 6 H s O 7 (sodium acetate, ethylene- diacetate, and citrate); they are significantly different f rom those of inorganic salts because of the presence of CH groups and the basicity of the solutions resulting from hydrolysis. Figure 2G shows difference spectra for H2S O4 , HC1, NaHSO 4, and N a 2 S O 4 ; the positive features at 1800 and 2250 nm can be attributed to the effect of H + ions on the H-bonding in waterY Figure 2H shows difference spectra for NaOH, Na2CO3, and NaHCO3; the increase in the absorbance in the 1500-1900 and 2000- 2400 nm regions should be largely due to the effect of O H - ions on the H-bonding in water. Figure 21 shows difference spectra for AgNO 3, Pb(NO3) 2, and Zn(NO3)2; they are significantly different from those of nitrates of alkali and alkaline-earth metals. Figure 2J shows differ- ence spectra of CuC12, NiC12, and COC12; their solutions are colored and have large absorbances in the short-wave- length region.
Searching Single Electrolytes. The results for search- ing single electrolytes are listed in Tables I and II. The top five hits with decreasing values of composi t ion in- dices are listed in Table I. For NH4NO3, the target elec- trolyte showed up first, and the top five candidates were all ammonia salts. Searching for Ni(NO3)2 also turned out very well. Solutions containing Ni 2+ and Co 2+ ions are colored and absorb in the near-IR region. Thus, it is rea- sonable that NiC12 was picked as the second choice, since it has a characteristic near-IR absorption due to the Ni 2+ ion. CoC12 had a much smaller CI value because its color is different from that of Ni 2+ salts. For NaNO3, the target electrolyte was in second place; however, the CI values for the top three picks were very close. For Na2CO 3, the target electrolyte was in third place; the first three can- didates were all basic electrolytes, and their difference spectra are similar.
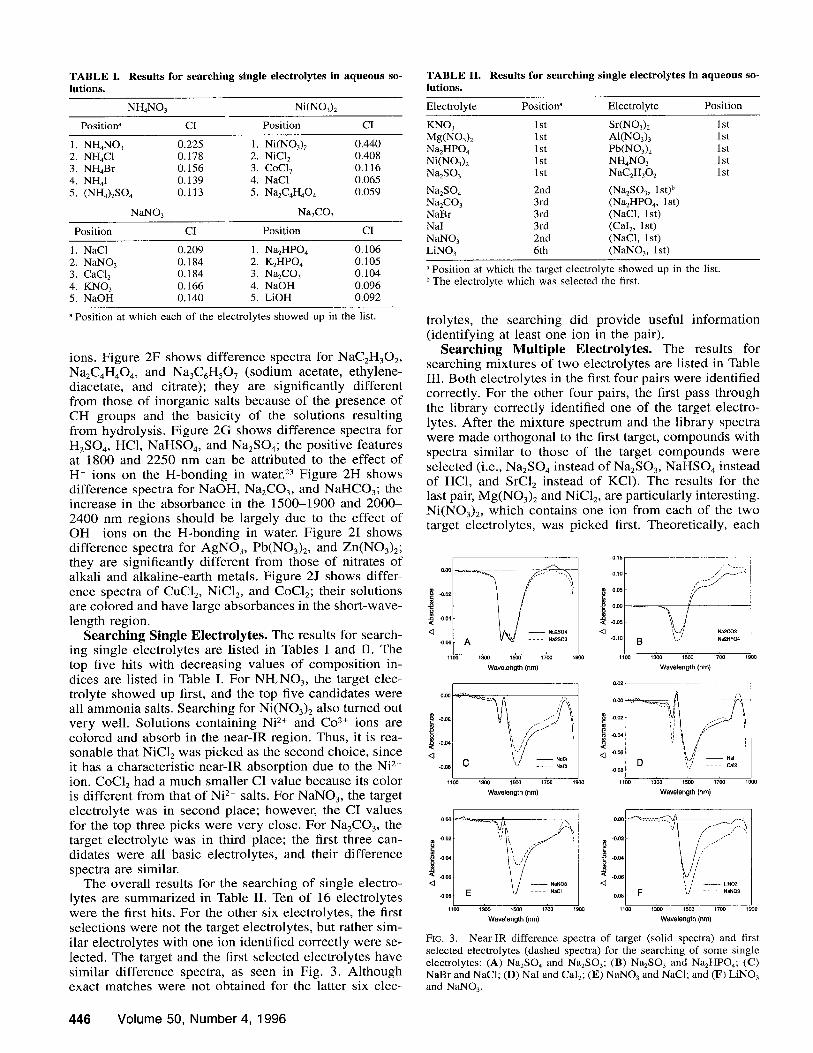
The overall results for the searching of single electro- lytes are summarized in Table II. Ten of 16 electrolytes were the first hits. For the other six electrolytes, the first selections were not the target electrolytes, but rather sim- ilar electrolytes with one ion identified correctly were se- lected. The target and the first selected electrolytes have similar difference spectra, as seen in Fig. 3. Although exact matches were not obtained for the latter six elec-
T A B L E II. Results for searching single electrolytes in aqueous so- lutions.
Electrolyte Position ~ Electrolyte Position
KNO 3 1st Sr(NO3)2 Mg(NO3)2 1 st AI(NO3) 3 Na2HPO 4 l st Pb(NO3) 2 Ni(NO3)2 1st NH4NO3 Na2SO 3 1 st NaC2HaO2
Na2SO 4 2nd (Na2SO3, lst) b N~CO3 3rd (Na2HPO4, lst) NaBr 3rd (NaC1, lst) NaI 3rd (CaIz, lst) NaNO3 2nd (NaC1, lst) LiNO 3 6th (NaNO 3, lst)
1st 1st 1st 1st 1st
"Posi t ion at which the target electrolyte showed up in the list. b The electrolyte which was selected the first.
trolytes, the searching did provide useful information (identifying at least one ion in the pair).
Searching Multiple Electrolytes. The results for searching mixtures of two electrolytes are listed in Table III. Both electrolytes in the first four pairs were identified correctly. For the other four pairs, the first pass through the library correctly identified one of the target electro- lytes. After the mixture spectrum and the library spectra were made orthogonal to the first target, compounds with spectra similar to those of the target compounds were selected (i.e., NazSO 4 instead of Na2SO3, NaHSO4 instead of HC1, and SrCI2 instead of KC1). The results for the last pair, Mg(NO3)2 and NiC12, are particularly interesting. Ni(NO3)2, which contains one ion from each of the two target electrolytes, was picked first. Theoretically, each
o ~ .0.02
~o -0.04
-O.06
1100 13O0 1500 1700 ~900 Wavelength (nm)
o.0o
-0,02
-O,04
<l -0.O6
1100 1300 1500 1700 1900 Wavelength (nrn)
0.O0
o= -0.02
~o -0.04
.O.O6
.0.o0
- - NUN03
FIG. 3.
o.lo ~- ,
8 o.o5 [___ 0.O0
• .0.05 N~C03
-o.lo I- B ,.,,' - - Na2HP04
<3
1~0 1500 1700 1go0 Wavelength (nm)
1100 1300 1500 1700 19o0 Wavelength (nm)
00: olo t ........ :'
..001~ ' - - Nal
1100 1300 15C0 1700 1900 Wavelength (nm)
° o 0 ~ 7
-0.02 . , ' " "
-O.O4 f
.0.06 / ', / - - tJNOa
.0.08
1100 1300 1500 1700 1900 Wavelength (nrn)
Near-IR difference spectra of target (solid spectra) and first selected electrolytes (dashed spectra) for the searching of some single electrolytes: (A) Na2SO4 and Na2SO3; (B) Na2SO 3 and Na2HPO4; (C) NaBr and NaC1; (D) NaI and CaI2; (E) NaNO3 and NaCI; and (F) LiNO3 and NaNO 3.
446 Volume 50, Number 4, 1996
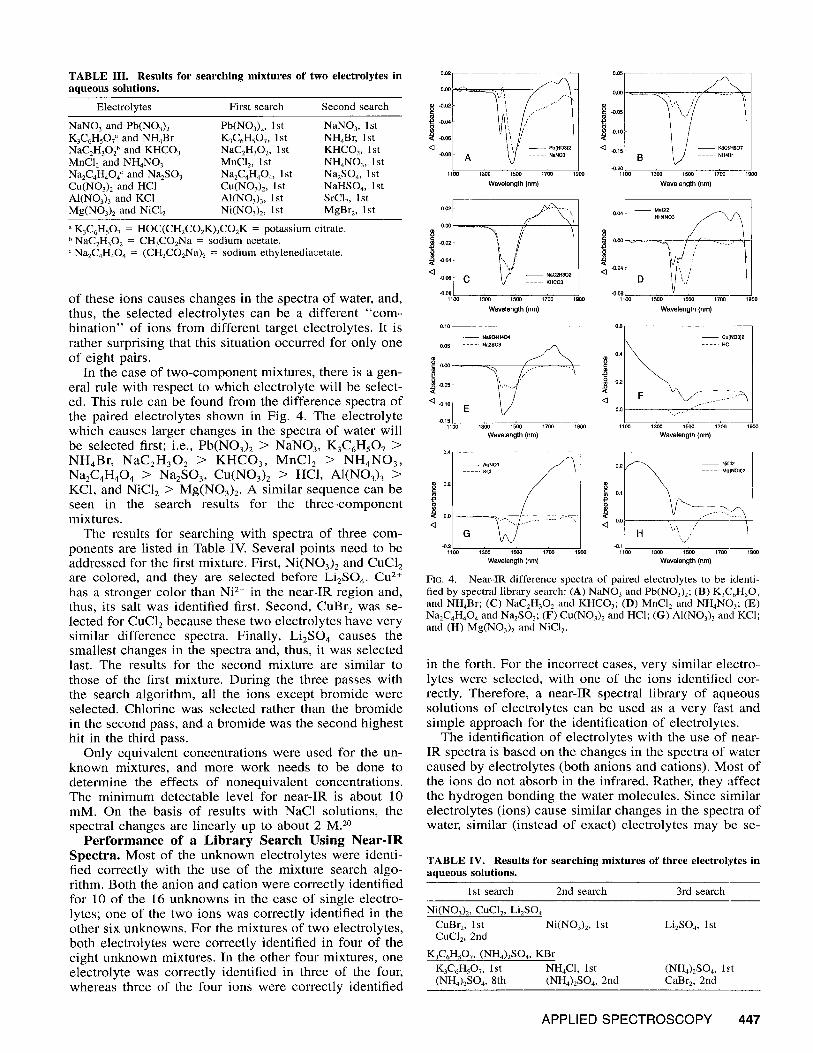
TABLE IlL Results for searching mixtures of two electrolytes in aqueous solutions.
Electrolytes First search Second search
NaNO 3 and Pb(NO3) 2 Pb(NO3)z, 1st NaNO3, 1st K3C6HsO7" and NH4Br K3C6HsO7, 1st NHnBr, 1st NaC2H302 ~ and KHCO3 NaC2H302, 1st KHCO3, 1st MnC12 and NHaNO 3 MnC12, 1st NH4NO3, 1st Na2C4H404 c and Na2SO 3 Na2C4H404, 1st NazSO4, 1st Cu(NO3)z and HC1 Cu(NO3)2, 1st NaHSO4, 1st AI(NO3) 3 and KCI AI(NOa) 3, 1st SrCI=, 1st Mg(NO3)~ and NiCi~ Ni(NO3)~, 1st MgBr~, 1st
a K3C6H507 = HOC(CH2CO2K)2CO2 K = potassium citrate. b NaC2H302 = CH3CO2Na = sodium acetate. c Na2CaH404 = (CH2CO2Na) 2 = sodium ethylenediacetate.
of these ions causes changes in the spectra of water, and, thus, the selected electrolytes can be a different "com- bination" of ions from different target electrolytes. It is rather surprising that this situation occurred for only one of eight pairs.
In the case of two-component mixtures, there is a gen- eral rule with respect to which electrolyte will be select- ed. This rule can be found from the difference spectra of the paired electrolytes shown in Fig. 4. The electrolyte which causes larger changes in the spectra of water will be selected first; i.e., Pb(NO3)2 > NaNO3, K3C6HsO 7 > NH4Br, NaC2H302 > KHCO3, MnC12 > NH4NO3, Na2C4H404 > Na2SO3, CH(NO3) 2 > HCI, Ai (N O 3 ) 3 > KC1, and NiC12 > Mg(NO3)2. A similar sequence can be seen in the search results for the three-component mixtures.
The results for searching with spectra of three com- ponents are listed in Table IV. Several points need to be addressed for the first mixture. First, Ni(NO3) 2 and CuC12 are colored, and they are selected before Li2SO 4. Cu 2+ has a stronger color than Ni 2+ in the near-IR region and, thus, its salt was identified first. Second, CuBr 2 was se- lected for CuC12 because these two electrolytes have very similar difference spectra. Finally, Li2SO 4 causes the smallest changes in the spectra and, thus, it was selected last. The results for the second mixture are similar to those of the first mixture. During the three passes with the search algorithm, all the ions except bromide were selected. Chlorine was selected rather than the bromide in the second pass, and a bromide was the second highest hit in the third pass.
Only equivalent concentrations were used for the un- known mixtures, and more work needs to be done to determine the effects of nonequivalent concentrations. The minimum detectable level for near-IR is about 10 mM. On the basis of results with NaC1 solutions, the spectral changes are linearly up to about 2 M. 2°
Performance of a Library Search Using Near-IR Spectra. Most of the unknown electrolytes were identi- fied correctly with the use of the mixture search algo- rithm. Both the anion and cation were correctly identified for 10 of the 16 unknowns in the case of single electro- lytes; one of the two ions was correctly identified in the other six unknowns. For the mixtures of two electrolytes, both electrolytes were correctly identified in four of the eight unknown mixtures. In the other four mixtures, one electrolyte was correctly identified in three of the four, whereas three of the four ions were correctly identified
3,05r
. . . . . " ' , % , , \ . / / / ' "
12 - - K3C6HSO7 • 0.08 -0.15
• O.20 / 1100 1300 1500 1700 1900 1100 1300 1500 1700
W a v e l e n g t h (nm) W a v e l e n g t h (,am)
-0.02
-0.04
'l t
<1 -0,o8 C v . . . . . KHCO3
.0"01810 o
i 0.00 ~ ..... ,,'=-'"~--~_.7
1300 1500 1700 1900 1100 1300 1500 1700 1900
W a v e l e n g t h (nm) W a v e l e n g t h (nm)
0.6 r
- - Na2C4H404 0.05 - - - N~2S03
~o.oc E ~ ~ , " ....... i .0.05
.0.1o
.0.15 1100 1300 1500 1700
W a v e l e n g t h (nm)
- - AgNO3
o • 0.2
0.o <3
- - CuIN03)2
0,2
0.0}
1300 1500 1700 1900 Wavelength (nm)
0.2 [ ~ - - NiCI2 Mg(NO312
H " ' , / / ' .0.11
.01100'2 1300 1500 1700 19C0 1100 1300 1500 1700 1900
W a v e l e n g t h (nm] W a v e l e n g t h (nm)
FIG. 4. Near-IR difference spectra of paired electrolytes to be identi- fied by spectral library search: (A) NaNO3 and Pb(NO3)2; (B) K3C6HsO 7 and NHaBr; (C) NaC2H3Oz and KHCO3; (D) MnCI2 and NHaNO3; (E) Na2CaH404 and Na2SO3; (F) Cu(NO3) 2 and HCI; (G) AI(NO3) 3 and KC1; and (H) Mg(NO~)2 and NiCI 2.
in the forth. For the incorrect cases, very similar electro- lytes were selected, with one of the ions identified cor- rectly. Therefore, a near-IR spectral library of aqueous solutions of electrolytes can be used as a very fast and simple approach for the identification of electrolytes.
The identification of electrolytes with the use of near- IR spectra is based on the changes in the spectra of water caused by electrolytes (both anions and cations). Most of the ions do not absorb in the infrared. Rather, they affect the hydrogen bonding the water molecules. Since similar electrolytes (ions) cause similar changes in the spectra of water, similar (instead of exact) electrolytes may be se-
TABLE IV. Results for searching mixtures of three electrolytes in aqueous solutions.
1st search 2nd search 3rd search
Ni(NO3)2, CuC12, Li2SO4 CuBr 2, 1st Ni(NO3)2, 1st Li2SO 4, 1st CuC12, 2nd
K3C6HsO7, (NH4)2SO4, KBr K3C6HsO7, 1st NH4C1, 1st (NH4)2SO4, 1st (NH4)2SO4, 8th (NHa)zSO4, 2nd CaBr 2, 2nd
APPLIED SPECTROSCOPY 447
lected. In terms of the unknown ions investigated in this study, 26 of the 32 ions in the single electrolyte unknown cases were identified, and 27 of the 32 ions in the two component electrolyte cases were identified.
C O N C L U S I O N
Near-IR spectra of aqueous solutions of electrolytes have been used for the identification of electrolytes by library searching. Both single and multiple electrolytes can be identified from the spectra of their solutions. Most of the unknown electrolytes were identified correctly. For others, very similar electrolytes were selected with one ion identified correctly. Searching a near-IR spectral li- brary of aqueous solutions of electrolytes can be used as a simple and fast approach for the identification of elec- trolytes.
ACKNOWLEDGMENT
Jie Lin wishes to express his appreciation to the Society for Analyt- ical Chemists at Pittsburgh for sponsoring an ACS Analytical Division Graduate Fellowship for the summer of 1993.
1. M. R. Nyden, Appl. Spectrosc. 40, 868 (1986).
2. M. R. Nyden, J. E. Pallister, D. T. Sparks, and A. Salari, Appl. Spectrosc. 41, 63 (1987).
3. C. R Wang and T. L. Isenhour, Appl. Spectrosc. 41, 185 (1987). 4. E B. Harrington and T. L. Isenhour, Appl. Spectrosc. 41, 449
(1987). 5. R B. Harrington and T. L. Isenhour, Anal. Chem. 60, 449 (1988). 6. S.-C. Lo and C. W. Brown, Appl. Spectrosc. 45, 1621 (1991). 7. S.-C. Lo and C. W. Brown, Appl. Spectrosc. 45, 1628 (1991). 8. S.-C. Lo and C. W. Brown, Appl. Spectrosc. 46, 790 (1992). 9. C. W. Brown and S. M. Donahue, Appl. Spectrosc. 42, 347 (1988).
10. C. W. Brown, A. E. Okafor, S. M. Donahue, and S.-C. Lo, Appl. Spectrosc. 49, 1022 (1995).
1l. G. R. Choppin and K. Buijs, J. Chem. Phys. 39, 2042 (1963). 12. O. D. Bonner and G. B. Woolsey, J. Phys. Chem. 72, 899 (1968). 13. W. C. McCabe and H. E Fisher, J. Phys. Chem. 74, 2990 (1970). 14. T. Hirschfeld, Appl. Spectrosc. 39, 740 (1985). 15. E. Watson, Jr., and E. H. Baughman, Spectroscopy 2, 44 (1987). 16. E. H. Baughman and E. Watson, Jr., 1987 Pittsburgh Conference
on Analytical Chemistry and Applied Spectroscopy, Atlantic City, New Jersey, Paper 221.
17. A. Grant, A. M. C. Davies, and T. Bilverstone, Analyst 114, 819 (1989).
18. M. K. Phelan, C. H. Barlow, J. J. Kelly, T. M. Jinguji, and J. B. Callis, Anal Chem. 61, 1419 (1989).
19. J. Lin and C. W. Brown, Appl. Spectrosc. 46, 1809 (1992). 20. J. Lin and C. W. Brown, Appl. Spectrosc. 47, 239 (1993). 21. J. Lin and C. W. Brown, Anal Chem. 65, 287 (1993). 22. J. Lin and C. W. Brown, Environ. Sci. Technol. 27, 1611 (1993). 23. H. Yamatera, B. Fitzpatrick, and Gilbert Gordon, J. Mol. Spectrosc.
14, 268 (1964).
448 Volume 50, Number 4, 1996