Embed Size (px)
Citation preview

JOURNAL OF BACTERIOLOGY, Aug. 1967, p. 333-343Copyright © 1967 American Society for Microbiology
Vol. 94, No. 2Printed in U.S.A.
Identification of Fatty Acids and AliphaticHydrocarbons in Sarcina lutea by GasChromatography and Combined Gas
Chromatography-Mass SpectrometryT. G. TORNABENE,' E. GELPI, AND J. OR6
Department of Chemistry and Department of Biology, University of Houston, Houston, Texas 77004
Received for publication 17 April 1967
The composition and nature of the fatty acids and hydrocarbons of Sarcinalutea were elucidated by gas chromatography and by combined gas chromatogra-phy-mass spectrometry. The distribution of fatty acids found in S. lutea showedtwo families of pairs, or dyads, of saturated monocarboxylic acids (C12-C18) withand without methyl branching. These pairs of fatty acids showed a pattern of isoand anteiso structures for C13, C15, and C17, and iso and normal structures forC12, C14, and C16. Only the C18 showed unsaturation. The distribution of hydro-carbons in the range C22-C29 showed two families of tetrads of unsaturated ali-phatic hydrocarbons all showing methyl branching. Each tetrad was composed offour isomers identified as two iso olefins and two anteiso olefins. The only dif-ference between the tetrads pertaining to different families was found in the relativegas chromatographic retention times of the last two components of each group.
The hydrocarbons and fatty acids of Sarcinalutea have been described by Huston and Albro(2, 10, 11). In their investigations, the extractablelipid material was analyzed by thin-layer and gaschromatography and by infrared spectrophotom-etry. In the present report, the identification ofthe fatty acids and hydrocarbons of S. lutea isbased on data obtained by a new technique ofcombined gas chromatography-mass spectrom-etry. Although the identity of some of the fattyacids was confirmed, the nature of some of thefatty acids and of most of the hydrocarbons wasfound to be significantly different from thatpreviously reported.
MATERIALS AND METHODSCulture conditions. S. lutea (ATCC 533) was culti-
vated in Erlenmeyer flasks containing Trypticase SoyBroth, pH 7.0 (BBL). The cultures were placed inwater baths adjusted to 25 C and were continuouslyaerated for 48 hr. The cells were collected in plastictubes in an RC-2 Servall centrifuge, washed threetimes in a 0.15 M NaCl solution, frozen, and thendried over P205 under vacuum.
Extractions. The method used to extract, fraction-ate, and analyze the hyorocarbons and fatty acidsfrom bacteria is described in an accompanying report
1 Present address: Division of Biosciences, NationalResearch Council, Ottawa, Canada.
(25). A 1.5-g amount of dried cells was placed in anall-glass Soxhlet-type apparatus and extracted with50 ml of a benzene-methanol mixture (3:1) for 8 hr.The extract was transferred to a beaker, and the sol-vent was removed by evaporation at 40 C under astream of purified nitrogen.
Column fractionation. The extracts were fraction-ated on silica gel columns into three fractions: then-heptane fraction, containing the aliphatic hydro-carbons (alkanes, olefins, etc.); the benzene fraction,saved for future analysis; and the methanol fraction,containing the fatty acids and glycerides, amongother lipids. The n-heptane eluate collected from thesilica gel column was divided into two subfractions.One subfraction was saved for pigment analysis. Theother subfraction was transferred to a glass column(1 by 30 cm). The column was provided with a sin-tered-glass disc and was filled to a depth of 10 cmwith alumina that had been previously activated at340 C for 24 hr, and washed with 10 ml of n-heptane.The aliphatic hydrocarbons, relatively free from pig-ments, were eluted with n-heptane.
Preparation of derivatives. The fatty acids wereliberated from the glycerides of the methanol fractionby alkaline hydrolysis (17). Methyl esters of the fattyacids were prepared for gas chromatography andmass spectrometry as previously described (10).
Thin-layer chromatography. Glass plates werespread with Silica Gel G (Stahl) and heat-activatedfor 2 hr at 120 C. The plates were developed in un-lined tanks by the ascending method with petroleum
333
Dow
nloa
ded
from
http
s://j
ourn
als.
asm
.org
/jour
nal/j
b on
19
Dec
embe
r 20
21 b
y 46
.71.
168.
129.

TORNABENE, GELPI, ANDOR6J
ether-diethyl ether-glacial acetic acid (90:10:1) andbenzene-n-heptane (9:1) as solvents. The componentswere observed by means of tracer studies (26). Theplates were exposed to Ansco-non-screen X-ray filmfor 1-week periods. They were also sprayed with asaturated solution of potassium dichromate in sul-furic acid and were charted.The pigment spot (presumably a carotenoid pig-
ment) was eluted with benzene from the plate andwas saved for spectrophotometric and mass spectro-metric analysis.
Spectrophotometric analysis. The eluted pigmentwas dissolved in n-heptane, and the absorption spec-trum determined on a Beckman DB spectrophotome-ter equipped with a Sargent recorder, model SRL.
Hydrogenation. A portion of the n-heptane eluatefrom a silica gel column was hydrogenated catalyti-cally (Pt) to reduce the pigment and any unsaturatedhydrocarbons present. After reduction the hydrogen-ated compounds were removed from the catalystby passing the product through a silica gel columnas before and eluting with n-heptane.
Infrared analysis. Infrared spectra of the n-heptanefractions before and after hydrogenation were re-corded with an IR 10 infrared spectrophotometer.
Gas chromatography and mass spectrometry. Allaliphatic hydrocarbons and fatty acid methyl esterswere analyzed on a F & M Model 810 gas chromato-graph equipped with a flame ionization detector andan LKB 9000 gas chromatograph-mass spectrometer.All samples were prepared for analysis as previouslydescribed (18). The chromatographic analyses werecarried out in several stainless-steel capillary columns:(i) a column 31 meters by 0.025 cm (inner diameter)coated with 10% Apiezon L (a high-temperaturegrease purchased from Applied Science Laboratory,Inc., State College, Pa.), at a nitrogen pressure of1,430 g/cm2; (ii) a column 91 meters by 0.076 cm(inner diameter) coated with Polysev (m-bis m-(phenoxy-phenoxy)-phenoxy benzene; Applied Sci-ence Laboratory, Inc.), at a nitrogen pressure of 700g/cm2; (iii) a column 310 meters by 0.070 cm (innerdiameter) coated with Polysev, at a nitrogen pressureof 933 g/cm2; (iv) a column 155 meters by 0.076 cm(inner diameter) coated with Igepal CO 990 (nonyl-phenoxy polyoxyethylene ethyl alcohol; GeneralAniline and Film Corp., New York, N.Y.), at a nitro-gen pressure of 933 g/cm2.The mass spectra were taken as each component
emerged from the column. Ionizing energies usedwere 70 ev for the fatty acid methyl esters and 20 evfor the aliphatic hydrocarbons. The remaining con-ditions were the same as previously described (18).Mass spectrometric analysis of pigments. Samples
of the pigment that was eluted from the thin-layerchromatograph plate with benzene were sent to Var-ian Corp., Analytical Instrument Division, PaloAlto, Calif. The samples were transferred with a smallamount of benzene to a capillary tube. The benzenewas removed from the sample by evaporation invacuum. The sample was then introduced into an M-66 mass spectrometer with the use of the solid sampleprobe. Mass spectra were taken at probe tempera-tures of 100, 125, 150, 175, 200, and 225 C.
RESULTS
Lipid composition. The cells of S. lutea driedover P205 were found to contain on the averageabout 1.45% of total extractable lipid material.The amount of aliphatic hydrocarbons in the n-heptane eluate from the alumina column (thisexcludes the pigment) was found to be about0.25% of the dried cell mass. These values are inclose agreement with those reported (1.30% andabout 0.27%, respectively) by Huston and Albro(10).Gas chromatography and mass spectrometry of
fatty acid methyl esters. Figures 1 and 2 show twotypical gas chromatographic patterns of the fattyacid methyl esters from S. lutea. Fifteen of thepeaks (numbered from 1 to 15) were identifiedby both gas chromatography and mass spectrom-etry. Their identities are listed in Table 1. Withthe exception of oleic and linoleic acids, all theother fatty acids analyzed were found to besaturated. Typical mass spectra for the com-pounds corresponding to peaks 7, 8, and 10 areshown in Fig. 3. The patterns shown in Fig. 1(Igepal CO 990) and Fig. 2 (Apiezon L) cor-relate well with each other. They also agree withthe results of mass spectrometry, which showedthat no major unsaturated components arepresent.The fatty acids found in S. lutea follow a dis-
tribution pattern having a predominance ofneither even- nor odd-numbered carbon chains.However, careful inspection of the peaks in thechromatograms of Fig. 1 and 2 and their identityas listed in Table 1 shows the existence of pairsof dyads of fatty acids grouped in two distinctfamilies. One of these families is made of fattyacids with an even number of carbon atoms, thepairs being iso and normal C12, C14, and C16saturated acids; the other family is made of fattyacids with an odd number of carbon atoms, thepairs being iso and anteiso C13, C15, and C17saturated acids. Some of the C18 and other fattyacids were present in amounts too small to allowproper characterization. As indicated earlier, ofall the fatty acids identified, the only unsaturatesfound were the common oleic and linoleic acids.As seen from Fig. 1 and 2, the two predomi-
nant fatty acids of S. lutea are iso and anteisopentadecanoic acids, which are probably relatedto the sarcinic acid (branched C15) reported byAkashi and Saito (1). When comparing variousfatty acid methyl ester chromatograms and massspectra, we found that the iso- and anteiso-C15reported here were identical with the C15 fattyacids of Bacillus cereus and Staphylococcusaureus (in preparation).
Control analytical runs in which all the steps
334 J. BACTERIOL.
Dow
nloa
ded
from
http
s://j
ourn
als.
asm
.org
/jour
nal/j
b on
19
Dec
embe
r 20
21 b
y 46
.71.
168.
129.

IDENTIFICATION OF FATTY ACIDS AND HYDROCARBONS
7'
,,W .l I S3~~~~31
STARTED AT 120C TEMP., C80 2I00
lK 10
200
30 40
20010 20 30 40 50 60 70 80
TIME (MINUTES)FIG. 1. Gas chromatographic separation of the fatty
acid methyl esters of Sarcina lutea on stainless-steeltubing (155 meters by 0.076 cm) coated with IgepalCO-990. Nitrogen pressure, 933 g/cm2; no split. F &M 810 apparatus equipped with a flame ionization de-tector. Range, 102; attenuation, 1. Temperature pro-grammed at approximately 6 degrees per minute from120 to 200 C, and held isothermally. From 1.5 g ofextracted cells, KIoo of the sample was injected.
8
cm,7
C,,W
1~~~~609
LU 12
LUS 245 269
4 8 12 16 20 24 28 32 36 40
TIME (MINUTES)FIG. 2. Gas chromatographic separation of fatty
acid methyl esters of Sarcina lutea on stainless-steeltubing (31 meters by 0.025 cm) coated with 10% Apie-zon L. Nitrogen pressure, 1,430 g/cm2; no split. Range,102; attentuation, 1. Temperature programmed atapproximately 6 degrees per minute from 125 to 300 C,and held isothermally. From 1.5 g of extracted cells;}too of the sample injected.
TABLE 1. Fatty acids of Sarcina lutea
Peak no. Identification"
I i12:02 12:03 i13:04 ai 13:05 i14:06 14:07 i15:08 ai 15:09 i16:010 16:011 i 17:012 ai 17:013 18:014 18:115 18:2
a Symbols: i = iso; ai = anteiso. The first num-ber represents the chain length; the second numberrepresents the number of unsaturations.
of the procedure were followed in the absenceof sample, and in which analyses of the mediaand solvents were carried out, showed eithernegligible or no measurable quantities of saponi-fiable material.
Interpretation of the mass spectra. The smallpeaks preceding the iso-laureate (peak 1) gaveeither inconclusive or complex spectra; theiridentification has not been further attempted.The interpretation of the fragmentation patternsof fatty acid methyl esters for purposes of iden-tification has been reported by Beynon (3) andRyhage and Stenhagen (21). Only the data mostpertinent to the fatty acids of S. lutea will bediscussed here. These data are exemplified by thefragmentation patterns of the compounds in thechromatographic peaks 7, 8, and 10 correspond-ing to iso-C15, anteiso-C15, and n-C16 fattyacids. The mass spectra are shown in Fig. 3.The major mass peak in spectra of this type
(fatty acid methyl esters) is usually formed atm/e 74 (unless the a-carbon is substituted), andcorresponds to the fragment ion (CH-O1-C=CH2)+. This fragment ion is produced by a
OHcyclic rearrangement involving the migration ofa y-hydrogen atom to the carboxyl oxygen ofthe ester group with a concerted cleavage (4,16). The next intense peak is found at m/e 87,(CH3-O--C-CHr--CH2)+, and is formed by a
simple y cleavage of the chain (8). The majorityof the remaining intense peaks are similar oxy-gen-containing fragments formed by simple
VOL. 94, 1967 335
U.'
0n
C-,LUI
I
50
Dow
nloa
ded
from
http
s://j
ourn
als.
asm
.org
/jour
nal/j
b on
19
Dec
embe
r 20
21 b
y 46
.71.
168.
129.

TORNABENE, GELPI, AND OR6 J. BACrERIOL.
FATTY ACID METHYL ESTERS10( 7
87 iso-C15.5c
43 256'28 55143 M-43 M
69 101 129 | I 1 85Y i9 M-31I. [-29 M15
30 50 70 90 110, 130 150 170 190 210 230 250 270m/e
100 74
I (74)a87 anteiso-C15SOF M-57
I 43 57 M4
32969
70 l : 1143
,l I85 .ji M 15X 2
.11 115 ~~~ ~~~~~~~~~~~12157 '~'Ii.I530 50 70 90 11O 130 150 170 190 210 230 250 270
m/e10 (_ 74
I.iD1g)5s 69ils,ilXl3xl7l71en2D6454I4fF]9.50.. _*_If
30 50 70 90 110 130 150 170 190 210 230 250 270mM
FIG. 3. Mass spectra of compounds 7, 8, and 10 were obtained with an LKB 9000 gas chromatograph as eachof the components emerged from capillary tubing (91 meters by 0.076 cm) coated withl Polysev. The componentswere ionized by electron impact at 70 ev as they entered the ion source. Each peak was scanned within the rangeof 0.0 to 400 mass units in 10 sec. The spectra were recorded by means of an oscillograph recorder with the chartspeed set at 10 cm/sec.
cleavage of the chain at each of the successivecarbon groups; m/e: 101, 115, 129, 143, 157,etc. The ion at m/e 143, (CH3-O--C--(CH2)6)+,
which gives a relatively high-intensity peak inthe mass spectra of long-chain fatty acid esters,originates through a simple 7,8 cleavage. Toaccount for its higher probability, Beynon sug-gested a rearranged dicyclic structure (3).
In the upper end of the spectrum (Fig. 3),there are three distinct peaks whose m/e valuescorrespond to M-43, M-31, and M-29 (M is themass of the molecular ion). The peak at M-31 isproduced by the loss of the methoxy radicalwith rentention of the positive charge on thelarge fragment containing the carboxyl group.The M-43 peak, as well as the peak at M-29,originate through an expulsion mechanism ofpropyl and ethyl groups, respectively, as estab-lished by deuterium labeling experiments (22).
With regard to the branched isomers of thesecompounds, it is important to emphasize thatthe introduction of an alkyl side chain at a car-bon atom other than C-2 does not have anygreat effect on the overall appearance of thespectrum, except for an increased tendency ofthe alkyl chain to fragment at the carbon atombearing the additional substituent. The presenceof a methyl side chain is readily determined bymeans of the peak formed at M-15, which isabsent in the normal compounds. Comparefragmentation patterns of compounds 7 and 8with that of compound 10 (Fig. 3).
In our case, there was no evidence of any ap-preciable change in the central portion of thefragmentation pattern between the normal andthe methyl-branched compounds. This can beaccounted for by the methyl substituent being inan iso or anteiso position, so that only the lowerand higher end of the spectra will show any
336
Z-I-J
1-Z
I-:Z
Dow
nloa
ded
from
http
s://j
ourn
als.
asm
.org
/jour
nal/j
b on
19
Dec
embe
r 20
21 b
y 46
.71.
168.
129.
VOL. 94, 1967 IDENTIFICATION OF FATTY ACIDS AND HYDROCARBONS
changes; the region between m/e 74 and M-57remains undisturbed.The characterization of the iso branching in
those molecules is at first unclear because thepeak originated by the loss of the isopropylradical (m/e 43) coincides with the M-43 peakoriginated by the expulsion mechanism of thepropyl group mentioned above (see Fig. 3). Thebest clue to the position of the iso methyl branchis obtained from the presence of a peak at anm/e corresponding to the formation of a keteneion (m/e 209 peak X in compound 7 of Fig. 3)which is derived from the branched structurethrough the loss of methanol (22). The loss ofwater from the ketene ion gives a peak at m/e209 - 18 = m/e 191 (peak Y in compound 7of Fig. 3). Although of very low intensity, bothpeaks X and Y are reliable, since they are com-pletely absent in the spectra of normal fattyacids.
In the case of anteiso long-chain methyl esters,the problem is somewhat simpler; there is a peakat M-57 (compound 8 of Fig. 3), due to loss ofthe isobutyl radical, which is much higher thanthe corresponding peak in a normal fatty acidester. The ketene ion appears here at m/e 195(peak X of compound 8 of Fig. 3), and by lossof water gives rise to a peak at m/e 177 (peak Yof compound 8 of Fig. 3). A pronounced featureis the higher intensity of the M-29 peak relativeto that of the M-31 (loss of the methoxy radical).This is expected since there are now two differ-ent processes contributing to the formation ofthe M-29 ion (the expulsion process mentionedbefore and a single-bond cleavage next to themethyl substituent).Gas chromatography and mass spectrometry of
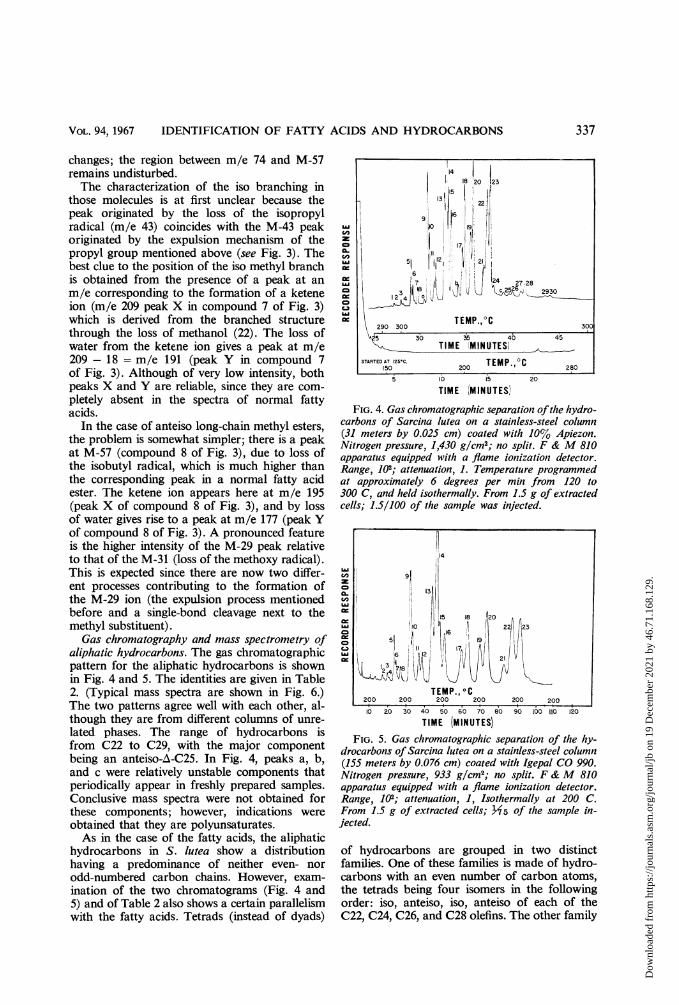
aliphatic hydrocarbons. The gas chromatographicpattern for the aliphatic hydrocarbons is shownin Fig. 4 and 5. The identities are given in Table2. (Typical mass spectra are shown in Fig. 6.)The two patterns agree well with each other, al-though they are from different columns of unre-lated phases. The range of hydrocarbons isfrom C22 to C29, with the major componentbeing an anteiso-A-C25. In Fig. 4, peaks a, b,and c were relatively unstable components thatperiodically appear in freshly prepared samples.Conclusive mass spectra were not obtained forthese components; however, indications wereobtained that they are polyunsaturates.As in the case of the fatty acids, the aliphatic
hydrocarbons in S. lutea show a distributionhaving a predominance of neither even- norodd-numbered carbon chains. However, exam-ination of the two chromatograms (Fig. 4 and5) and of Table 2 also shows a certain parallelismwith the fatty acids. Tetrads (instead of dyads)
zCL-2c
CDCLc.=
1=
FIG. 4. Gas chromatographic separation ofthe hydro-carbons of Sarcina lutea on a stainless-steel column(31 meters by 0.025 cm) coated with 10% Apiezon.Nitrogen pressure, 1,430 g/cm2; no split. F & M 810apparatus equipped with a flame ioniizationt detector.Range, 102; attenuation, 1. Temperature programmedat approximately 6 degrees per min from 120 to300 C, and held isothermally. From 1.5 g of extractedcells; 1.5/100 of the sample was injected.
TEMP., OC200 200
40 50 60 70 E
TIME (MINUTES)FIG. 5. Gas chromatographic separation of the hy-
drocarbons of Sarcina lutea on a stainless-steel column(155 meters by 0.076 cm) coated with Igepal CO 990.Nitrogen pressure, 933 g/cm2; no split. F & M 810apparatus equipped with a flame ionization detector.Range, 102; attenuation, 1, Isothermally at 200 C.From 1.5 g of extracted cells; 345 of the sample in-jected.
of hydrocarbons are grouped in two distinctfamilies. One of these families is made of hydro-carbons with an even number of carbon atoms,the tetrads being four isomers in the followingorder: iso, anteiso, iso, anteiso of each of theC22, C24, C26, and C28 olefins. The other family
337
Dow
nloa
ded
from
http
s://j
ourn
als.
asm
.org
/jour
nal/j
b on
19
Dec
embe
r 20
21 b
y 46
.71.
168.
129.

TORNABENE, GELPI, AND OR6
OLEFINIC HYDROCARBONS
13) iso-A-C2511
8-.- ~~~~~~M-28
OC 0 j do 130 50 70 O 2 230 250 270 290 310 330 350
50 70 90 o110 130 150 170 190 21 60 250 2.7 290 310 330 350
Manteiso-A-Cl25
1ll 1ltl, JI I'1 0 4. I..0 L.7--
EO ID I20 21 O 127
J I. 2O ' 3 30 1
50 70 90 30 130 150 li '0 S0 230 250 270 290 310 330 350
aniteiso-A-C,0 hi
Jh.1II.111 lI{ I,..............L,... E ,L ,I ,,,M-29iii., ), , ..........1.50 70 90 110 130 150 17 90 210 230 290 270 290 30 330 350
iso-A-C5
..., ll -,,.,,. Ill,..1. ... ... ,1~ ~ *,5O 70 90 11.013050 170 DO 210 230 250270
m/e290 S0 330
FIG. 6. Mass spectra of compounds 13, 14, 15, and 16 were obtained with an LKB 9000 gas chromatographais the components were eluted from capillary tubing (91 meters by 0.076 cm) coated with Polysev. The com-ponents were ionized by electron impact at 20 ev as they entered the ion source. Each peak was scannedwithin the range of 0.0 to 400 mass units in 10 sec. The spectra were recorded by means of an oscillograph re-corder with the chart set at 10 cm/sec.
is made of hydrocarbons with an odd number ofcarbon atoms, the tetrads being four isomers inthe following order: iso, anteiso, anteiso, andiso of each of the C23, C25, and C27 olefins.
Only traces of two C29 alkenes (iso and anteiso)were found, although it is possible that withincreased sensitivity the four isomers couldhave been detected.
338 J. BACrERIOL.
-i
54
eil°
e50z
IC
z-5wa;
-JwIC100
50
:.L .111[ I 1. 'H,
II
,
M-28
Dow
nloa
ded
from
http
s://j
ourn
als.
asm
.org
/jour
nal/j
b on
19
Dec
embe
r 20
21 b
y 46
.71.
168.
129.
VOL. 94, 1967 IDENTIFICATION OF FATTY ACIDS AND HYDROCARBONS
TABLE 2. Hydrocarbons of Sarcina lutea
Hydrocarbon Peak no. Identificationa
C22
C23
C24
C25
C26
C27
C28
C29
1
234
5678
9101112
13141516
17181920
21222324
25262728
2930
iso-A-C22anteiso-A-C22
iso-A-C22anteiso-A-C22
iso-A-C23anteiso-A-C23anteiso-A-C23
iso-A-C23
iso-A-C24anteiso-A-C24
iso-A-C24anteiso-A-C24
iso-A-C25anteiso-A-C25anteiso-A-C25
iso-A-C25
iso-A-C26anteiso-A-C26
iso-A-C26anteiso-A-C26
iso-A-C27anteiso-A-C27anteiso-A-C27
iso-A-C27
iso-A-C28anteiso-A-C28
iso-A-C28anteiso-A-C28
iso-A-C29anteiso-A-C29
a Symbols: A = double bond.
This constitutes a remarkable distribution,with a unique order, of hydrocarbons. Thefollowing characteristic features were found: (i)all the components were identified as branchedhydrocarbons with methyl substituents at eitheriso or anteiso positions; (ii) all were identified asmonounsaturated olefins (monoenes); (iii) thecomponents appeared in groups of four, with allfour components of the same group (tetrad)having the same molecular mass (thereforebeing isomers); and (iv) the four isomers in thegroups with an odd number of carbon atomswere found to emerge from the gas chromato-graphic columns very close together, whereas thefour isomers in the groups with an even numberof carbon atoms were better resolved and sepa-rated clearly into two pairs.The identification of these hydrocarbons as
branched monounsaturated olefins was made
possible or was greatly facilitated by use of anLKB 9000 gas chromatograph mass spectrome-ter. Of the 18 times that S. Iutea was grown tostudy lipid formation, culture conditions (25),etc., the lipid fractions were analyzed eight timesby gas chromatography-mass spectrometry withessentially identical results each time.
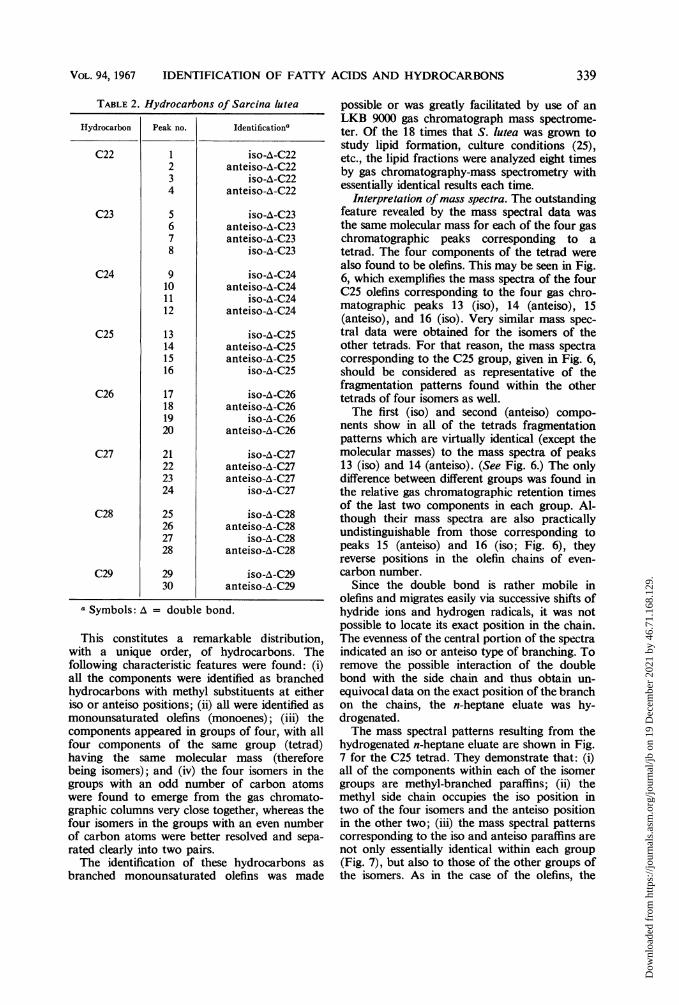
Interpretation ofmass spectra. The outstandingfeature revealed by the mass spectral data wasthe same molecular mass for each of the four gaschromatographic peaks corresponding to atetrad. The four components of the tetrad werealso found to be olefins. This may be seen in Fig.6, which exemplifies the mass spectra of the fourC25 olefins corresponding to the four gas chro-matographic peaks 13 (iso), 14 (anteiso), 15(anteiso), and 16 (iso). Very similar mass spec-tral data were obtained for the isomers of theother tetrads. For that reason, the mass spectracorresponding to the C25 group, given in Fig. 6,should be considered as representative of thefragmentation patterns found within the othertetrads of four isomers as well.The first (iso) and second (anteiso) compo-
nents show in all of the tetrads fragmentationpatterns which are virtually identical (except themolecular masses) to the mass spectra of peaks13 (iso) and 14 (anteiso). (See Fig. 6.) The onlydifference between different groups was found inthe relative gas chromatographic retention timesof the last two components in each group. Al-though their mass spectra are also practicallyundistinguishable from those corresponding topeaks 15 (anteiso) and 16 (iso; Fig. 6), theyreverse positions in the olefin chains of even-carbon number.
Since the double bond is rather mobile inolefins and migrates easily via successive shifts ofhydride ions and hydrogen radicals, it was notpossible to locate its exact position in the chain.The evenness of the central portion of the spectraindicated an iso or anteiso type of branching. Toremove the possible interaction of the doublebond with the side chain and thus obtain un-equivocal data on the exact position of the branchon the chains, the n-heptane eluate was hy-drogenated.The mass spectral patterns resulting from the
hydrogenated n-heptane eluate are shown in Fig.7 for the C25 tetrad. They demonstrate that: (i)all of the components within each of the isomergroups are methyl-branched paraffins; (ii) themethyl side chain occupies the iso position intwo of the four isomers and the anteiso positionin the other two; (iii) the mass spectral patternscorresponding to the iso and anteiso paraffins arenot only essentially identical within each group(Fig. 7), but also to those of the other groups ofthe isomers. As in the case of the olefins, the
339
Dow
nloa
ded
from
http
s://j
ourn
als.
asm
.org
/jour
nal/j
b on
19
Dec
embe
r 20
21 b
y 46
.71.
168.
129.

TORNABENE, GELPI, AND ORO J. BACTERIOL.
HYDROGENATED HYDROCARBONS
50[-iso- U25 M4
I8000 120 40' 60 180 200220240' ~~~~~~~~~~~I M-15 M
4 60 8 6 i140 10 2 20 26002~O280 3003S20 ' 340' 361
100
40 60 80' 100 120 140 160 180 200 220 240 260 280 30'2 4 6I0[ o anteiso C25 M-29
5011000|(ffi) anteiso C25 M-29l~~~~~~~~M5715
l ~~Wl M5 I|M-I J
40 60 80 100 120 140 160 160 200 220 240 260 280 300 320 340 36C
10 Ii iso C25 M-43 M28, 30 323,.,40
40~~~~~s600 10 l * 0 Ito IS 200 2I 240 26 2W 30 320 4 36
60 60 00 120 140 10o 160
mle200 220 240 260
FIG. 7. Mass spectra of the hydrogenated hydrocarbons. All conditions are the same as in Fig. 6.
spectra of the C25 paraffins presented in Fig. 7are representative of the spectra found for all ofthe other groups of hydrogenated hydrocarbons.From these data, it can be shown that the
first component in the olefin tetrads of S. lutea isalways an iso olefin, and the second, an anteisoolefin; the third, an iso olefin in the even-num-bered carbon chains, corresponds to an anteisoolefin in the odd-numbered chains (see Table 2).In accordance with these results, the four peakswithin each group of olefin isomers would beexpected to collapse into two peaks in the gaschromatogram upon hydrogenation of thesample. The fact that this does not take placeand that there is an almost identical reproduci-bility of the gas chromatographic pattern afterhydrogenation of the sample indicates (i) thatthe double bond does not play a significant rolein the resolution of each of the isomers and (ii)that it is necessary to provide for some configur-ational differences between each of the iso andanteiso isomers, in order to explain the unusual
resolution encountered. The possibility of havingiso or anteiso configurations on both ends of themolecule cannot be excluded, since this wouldnot change the overall mass spectral pattern. Onthe other hand, the clear differentiation of isoand anteiso fragmentation patterns indicates thatthe coexistence of iso and anteiso methyl branch-ing in any one of the molecules is not possible.Therefore, any near-terminal methyl disubstitu-tions on the olefins must be of the same type,either both iso or both anteiso.More work will have to be done to locate the
position of the double bond and to determine thepossible presence of some doubly near-terminalmethyl-substituted isomers. The possibility ofhaving a disubstituted molecule is attractive,since it would explain the variation in retentiontimes of the isomers through diastereoisomericforms.
Thin-layer chromatography. The analyticalresults obtained by thin-layer chromatographyon the migration and distribution of lipids of S.
340
H
zi
J-Jw
Zzi
a:
2800 3600 320 340 3W5A
-iW:
Dow
nloa
ded
from
http
s://j
ourn
als.
asm
.org
/jour
nal/j
b on
19
Dec
embe
r 20
21 b
y 46
.71.
168.
129.

VOL. 94, 1967 IDENTIFICATION OF FATTY ACIDS AND HYDROCARBONS
lutea were in accordance with those previouslyreported (2). An audioradiogram from a thin-layer chromatography plate analysis of the hy-drocarbons and fatty acids from cells grown inthe presence of 50 ,uc of palmitate-1-14C wasobtained (26). The hydrocarbons and fatty acidmethyl esters were identified by RF values andby elution and reanalysis by gas chromatogra-phy. The results were in agreement with the gaschromatographic and mass spectrometric resultsdescribed above.
Infrared spectra of n-heptane eluates. It will berecalled that the n-heptane eluate from silica gelchromatography contains not only the hydro-carbons but also the pigments. Infrared spectralanalyses of the n-heptane eluate and the hy-drogenated n-heptane eluate are shown in Fig. 8.The absorption for the n-heptane eluate between
3,650 to 2,600 cm-l and 1,740 cm7-, owing tostretching vibrations of OH and C==O, respec-tively, was attributed to the carotenoid pig-ments that were present. The absorption at otherwave numbers shows that olefins are present, asindicated by the double-bond stretching fre-quency around 1,640 cm-l and the absorptionsfrom 600 to 1,000 cm-'. The bands around 605,820, and 975 cm-' are indications of cis olefins,trisubstituted olefins, and trans-disubstitutedolefins, most of which belong to the carotenoidpigments. The infrared spectra of the hydrogen-ated n-heptane eluent (Fig. 8) confirms thehydrogenation of all the olefins by the deletionof the absorptions in question.
Pigments. The pigments eluted from a thin-layer plate were identified as carotenoids by theiryellowish-orange appearance (13, 19, 20), their
35.WAVE.ENGTH IN M1CRONS3 3.5 A 4.5 5 5.5 6 .5 7 7.5 8 9 10 11 12 14 16 If 20 25 30 *0
04
_
LI
z
4
4
rI_
2,5
I-4 "
T--r--A ---.I -j- vtI IlL f.wm2im.
.. .;-.A t- son
A_1XIIT750I.~~~~~~~~~~~~~~~~~~~~~~~~~~~~~~~~~~~~~~~~~~~~4
.I. T.77 .. I2000 800 ,11600
t.1.I - t.1. I..I 1:]I a, 3000
n-HEPTANE ELUATE
1 '400 200
HYDROGENATED WAVENHMUt CM'm-WEPTANE EWATE
FIG. 8. Itfrared tranismissioJz spectra of the ni-heptante eluate anld thecorded oni ani IR 10 inifrared spectrophotometer.
hydrogeniated In-heptan7e ehiate re-
341
l00
90
.-- ,:
vi -
0
600 500 AOO 300:T
WAVENUMBER CM'
Dow
nloa
ded
from
http
s://j
ourn
als.
asm
.org
/jour
nal/j
b on
19
Dec
embe
r 20
21 b
y 46
.71.
168.
129.

TORNABENE, GELPI, ANDOROJ
RF values on thin-layer plates, and by their posi-tive color test with 30% SbCI3 in chloroform (7).Identification was also based on recent informa-tion published on S. lutea (2) and on the cor-relation of spectrophotometric studies (Fig. 9)with those already reported (5, 12, 19, 23, 24).The carotenoid absorbing at 480, 451, and 423m,u was identified by Takeda and Ohta (23, 24)as a new xanthophyll, which they called sarcena-xanthine. On the other hand, Dyer (9) reportedthat trans-,3-carotene has a maximal absorptionat 452 and 478 m,u. Although the mass spectralanalysis is far from complete, we have obtainedresults which are in accordance with the highmolecular mass number 704 recently reported(15). Our fragmentation pattern suggests thepresence of at least one oxygen atom, which is inline with the infrared analysis previously men-tioned. Such a mass unit number is significantlydifferent from some compounds previously pro-posed in a review by Liaaen Jensen (13), andthrows some doubt on the previous identificationof some of the carotenoids in S. lutea (19, 23, 24).As indicated by recent investigations (6, 14, 15),more work will have to be done for the completeidentification of some of the "carotenoid" pig-ments.
DIscussIoN
The distribution patterns of the fatty acids andhydrocarbons of S. lutea are unique. The formerconstitute two families of pairs or dyads ofsaturated fatty acids (C12-C18) with and with-out methyl branching, and the latter constitutetwo families of tetrads of unsaturated aliphatichydrocarbons (C22-C29) all showing methylbranching.Comparison of the fatty acids with the hydro-
n
0
a.
cL
320 360 400 440 480 520 S60 600
WAVELENGTH (mr)
FIG. 9. Spectrophotometric analysis of the pigmenteluted from a thin-layer chromatographic plate. Thepigment was suspended in n-heptane.
carbons yields the following observations. Foreach dyad or pair of isomers of fatty acids, thereis a tetrad or quadruplet of isomers of hydrocar-bons. Whereas the range of carbon numbers forthe fatty acids is approximately from 12 to 18,the range for the hydrocarbons is approximatelyfrom 22 to 28, the difference being uniformly 10,as if indicating that the hydrocarbons are derivedfrom the acids by the addition of 10 carbon atoms.Whereas the major component of the fatty acidsis an anteiso-C15, the major component of thehydrocarbons is an anteiso-C25. Whereas essen-tially all the fatty acids are saturated (exceptoleic and linoleic), all the identified hydrocarbonsare unsaturated, showing in all cases one doublebond.These relationships appear to indicate that the
hydrocarbons are generated by a unique pathwaywhich involves the fatty acids or some commonprecursors to both types of compounds. Work isin progress to determine by means of derivativesand combined gas chromatography-mass spec-trometry the position of the double bond and theexact configuration of the hydrocarbons. Anaccompanying paper describes the use of radio-active precursors to ascertain the metabolic path-ways for biosynthesis of fatty acids and hydro-carbons in S. lutea (26).
ACKNOWLEDGMENTSThis investigation was supported by grants NsG-
257 and NGR-44-005-020 from the National Aeronau-tics and Space Administration.
LITERATURE CITED1. AKASHI, S., AND K. SAITO. 1960. A branched-
saturated C,5 acid (sarcinic acid) from Sarcinaphospholipids and a similar acid from severalmicrobial lipids. J. Biochem. (Tokyo) 47:222-229.
2. ALBRO, P. W., AND C. K. HUSTON. 1964. Lipidsof Sarcina lutea. II. Hydrocarbon content ofthe lipid extracts. J. Bacteriol. 88:981-986.
3. BEYNON, J. H. 1960. Mass spectrometry and itsapplications to organic chemistry, p. 379-386.Elsevier, Amsterdam.
4. BJEMANN, K. 1962. Mass spectrometry. Organicchemical applications, p. 119. McGraw-HillBook Co., Inc., New York.
5. BROWN, J. W. 1961. Composition of fractionsprepared from Sarcina lutea protoplasts. Bio-chim. Biophys. Acta 52:368-374.
6. BROWN, 0. R., AND J. B. CLARK. 1966. Pigmentsof Nocardia corallina. J. Bacteriol. 92:1844-1845.
7. CARR, F. H., AND E. A. PRICE. 1926. Color reac-tion attributed to vitamin A. Biochem. J.20:497-501.
8. DINH-NGUYEN, N., R. RYHAGE, S. STALLBERG-STENHAGEN, AND E. STENHAGEN. 1961. Massspectrometric studies. VIII. A study of the frag-
I I a I I I I I-- --- . -- . . . --- ---
342 J. BACTERIOL.
Dow
nloa
ded
from
http
s://j
ourn
als.
asm
.org
/jour
nal/j
b on
19
Dec
embe
r 20
21 b
y 46
.71.
168.
129.

VOL. 94, 1967 IDENTIFICATION OF FATTY ACIDS AND HYDROCARBONS
mentation of normal long-chain methyl estersand hydrocarbons under electron impact withthe aid of D-substituted compounds. ArkivKemi 18:393-399.
9. DYER, J. R. 1965. Applications of absorptionspectroscopy of organic compounds, p. 16.Prentice Hall, Inc., Englewood Cliffs, N.J.
10. HUSTON, C. K., AND P. W. ALBRO. 1964. Lipidsof Sarcina lutea. I. Fatty acid composition ofthe extractable lipids. J. Bacteriol. 88:425-432.
11. HUSTON, C. K., P. W. ALBRO, AND G. G. GRIN-DEY. 1965. Lipids of Sarcina lutea. III. Com-position of the complex lipids. J. Bacteriol.89:768-775.
12. KLEINKAUF, H. 1966. Carotine and carotinoidsyntheses in Rhizobium lupini-mutanten. Arch.Mikrobiol. 53:154-158.
13. LIAAEN JENSEN, S. 1965. Biosynthesis and functionof carotenoid pigments in microorganisms.Ann. Rev. Microbiol. 19:163-182.
14. LIAAEN JENSEN, S. 1966. Recent studies on thestructure and distribution of carotenoids inphotosynthetic bacteria. In T. W. Goodwin,[ed.], Biochemistry of chloroplasts, AcademicPress, New York, Vol. I: 437-441.
15. LIAAEN JENSEN, S., 0. B. WEEKS, R. H. C. STRANG,AND D. THIRKELL. 1967. Identity of the C50-carotenoid dehydrogenans-P439 and Sarcina-xanthin. Nature 214:379-380.
16. McLAFFERTY, F. W. 1959. Mass spectrometricanalysis. Molecular rearrangements. AnalChem. 31:82-87.
17. NEsBIrr, J. A., III, AND W. J. CENNARZ. 1965.Comparison of lipids and lipopolysaccharidesfrom the bacillary and L forms of Proteus P18.J. Bacteriol. 89:1020-1025.
18. ORO, H., T. G. TORNABENE, D. W. NOONER,AND E. GELPI. 1967. Aliphatic hydrocarbonsand fatty acids of some marine and freshwatermicroorganisms. J. Bacteriol. 93:1811-1818.
19. PORTER, J. R. 1947. Bacterial chemistry and physi-ology, p. 421-439. John Wiley & Sons, Inc.,New York.
20. ROBINSON, T. 1964. The organic constituents ofhigher plants, p. 148-153. Burgess PublishingCo., Minneapolis.
21. RYHAGE, R., AND E. STENHAGEN. 1963. Massspectrometry of long-chain esters, p. 399-452.In F. W. McLafferty [ed.], Mass spectrometryof organic ions. Academic Press, Inc., NewYork.
22. RYHAGE, R., AND E. STENHAGEN. 1960. Massspectrometric studies. V. Methyl esters ofmonoalkyl-substituted acids with ethyl or
longer side chain and methyl esters of di- andpolyalkyl-substituted acids. Arkiv Kemi 15:332-362.
23. TAKEDA, Y., AND T. OHTA. 1940. Uber die Iden-tifizerung der eingelnen Carotinoide von
Mycobacterium phlei. Z. Physiol. Chem. 265:233-236.
24. TAKEDA, Y., AND T. OHTA. 1941. A new bacterialcarotenoid, sarcinaxanthine. Z. Physiol. Chem.268:1-II.
25. TORNABENE, T. G., E. 0. BENNETr, AND J. OR6.1967. Fatty acid and aliphatic hydrocarboncomposition of Sarcina lutea grown in threedifferent media. J. Bacteriol. 94:344-348.
26. TORNABENE, T. G., AND J. OR6. 1967. 14C incor-poration into the fatty acids and aliphatic hy-drocarbons of Sarcina lutea. J. Bacteriol.94:349-358.
343
Dow
nloa
ded
from
http
s://j
ourn
als.
asm
.org
/jour
nal/j
b on
19
Dec
embe
r 20
21 b
y 46
.71.
168.
129.