Embed Size (px)
Citation preview
Identification of High Risk Areas
RAOP-MED WP4
Evaluation of Oil Spillage
RAOP-MED WP5
East Mediterranean Sea
HAZMAT
27.10.15
WP4 Scope of Work
• Identify the high risk areas in the east Mediterranean Sea
• Map the high risk areas obtained

Definitions
• Grid cell has been defined as 0.1° X 0.1° (app. 9 km X 9 km).
• High risk has been defined as a frequency of at least once in 100 years for an oil spill.
Six Generic Scenarios
• Vessel-vessel collision
• Vessel-rig collision
• Spill from vessels (for reasons other than collision)
• Spill from oil rigs (for any reason other than collision)
• Spill due to disconnection during oil discharge from an oil rig
• Spills from maritime connection
Vessel-Vessel Collision
• Vessel traffic density - number of vessels (ships and tankers) passing through a grid cell during a one year period (2013)
• Vessel traffic density has been received from IOLR.
Vessel-Vessel Collision
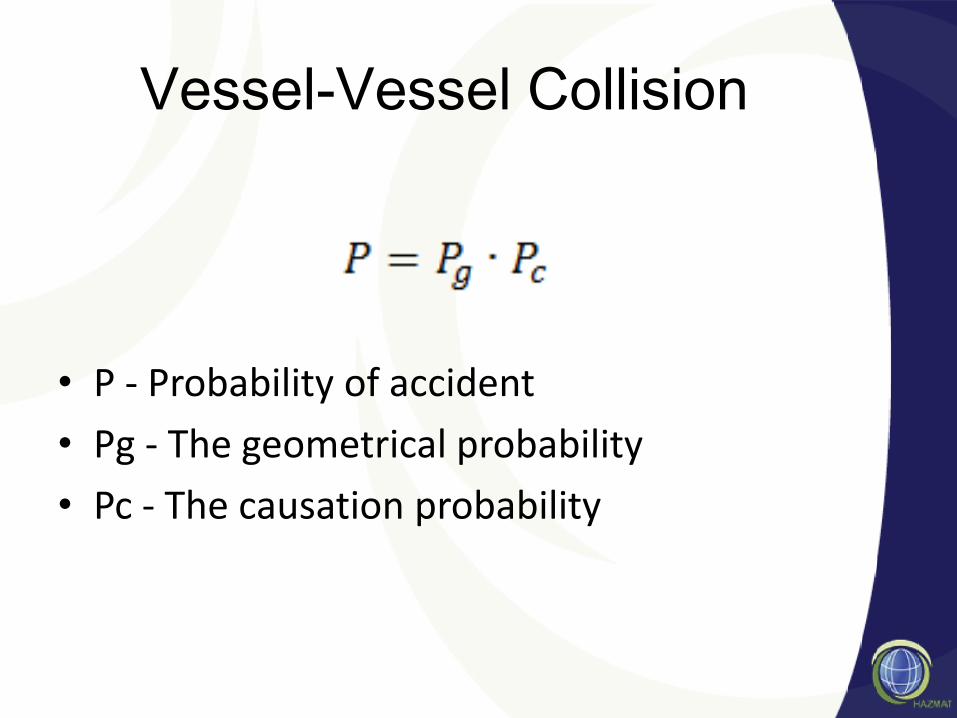
• P - Probability of accident
• Pg - The geometrical probability
• Pc - The causation probability
Vessel-Vessel Collision
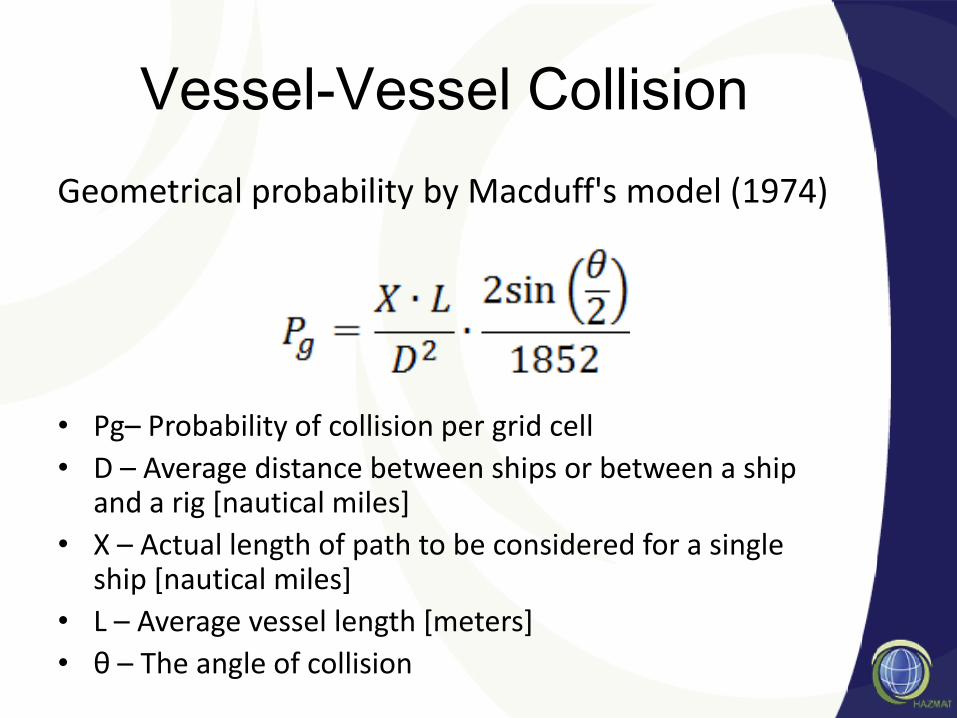
Geometrical probability by Macduff's model (1974)
• Pg– Probability of collision per grid cell
• D – Average distance between ships or between a ship and a rig [nautical miles]
• X – Actual length of path to be considered for a single ship [nautical miles]
• L – Average vessel length [meters]
• θ – The angle of collision
Vessel-Vessel Collision
• The causation probability Pc
• Probability of causing or failing to avoid the accident
Oil Spill from Rigs
• Vessel-Rig collision
• Spills due to: – Blowouts
– Helicopter accidents
– Structure failures
• Spill due to disconnection during oil loading from an oil / condensate rig to a tanker
Oil Spill from Maritime
Connections
• Israeli contingency plan is currently being updated
• Full bore rupture from a flexible hose – for example during the connection to the
maritime connection
• Full bore rupture from the offshore pipeline – for example due to maintenance work
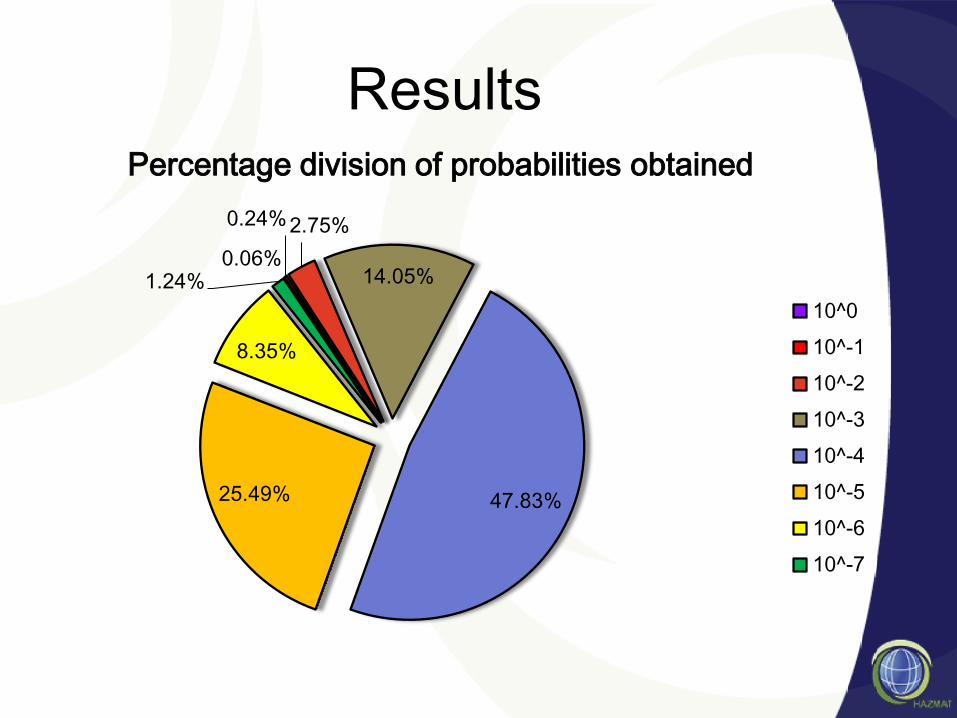
Results
0.06%
0.24% 2.75%
14.05%
47.83% 25.49%
8.35%
1.24%
Percentage division of probabilities obtained
10^0
10^-1
10^-2
10^-3
10^-4
10^-5
10^-6
10^-7
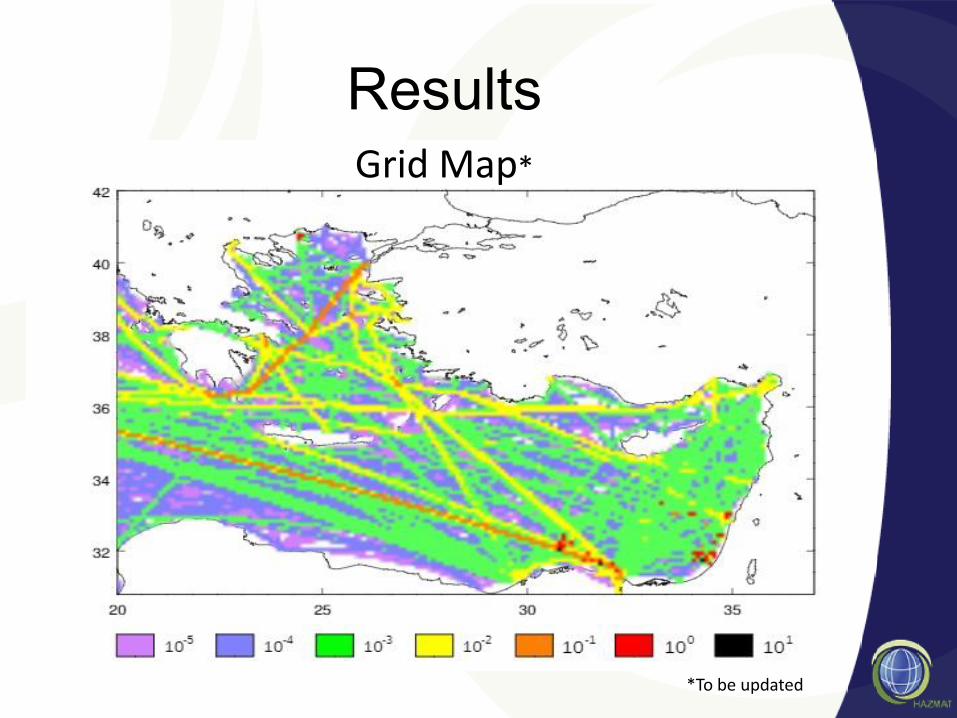
Results Grid Map*
*To be updated
WP5 Scope of Work
• Evaluate the oil spills in the east Mediterranean Sea by size and type

Six Generic Scenarios
• Vessel-vessel collision
• Vessel-rig collision
• Spill from vessels (for reasons other than collision)
• Spill from oil rigs (for any reason other than collision)
• Spill due to disconnection during oil discharge from an oil rig
• Spills from maritime connection

Vessel-Vessel Collision
• According to REMPEC , it has been found that only 50% of the collision accidents will cause an oil spill (regardless of spill size)
Vessel-Vessel Collision
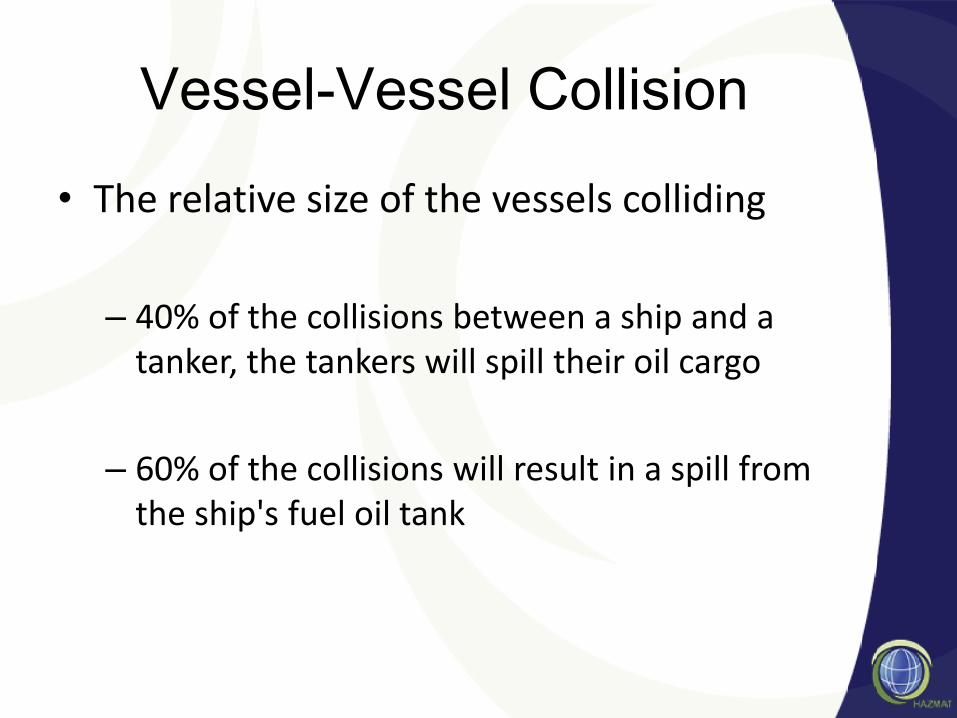
• The relative size of the vessels colliding
– 40% of the collisions between a ship and a tanker, the tankers will spill their oil cargo
– 60% of the collisions will result in a spill from the ship's fuel oil tank

Vessel-Vessel Collision
• Tankers cargo according to global product demand of the different oil types
7%
25%
7%
29%
11%
11%
10%
Global Product Demand
Naphta
Gasoline
Jet/Kerosene
Diesel/Gasoil
Residual fuel
Other
LPG (gas- not relevant)
Vessel-Vessel Collision
• Fuel oil tank :
– Marine diesel oil
– HFO (heavy fuel oil)
Oil Spill from Rigs
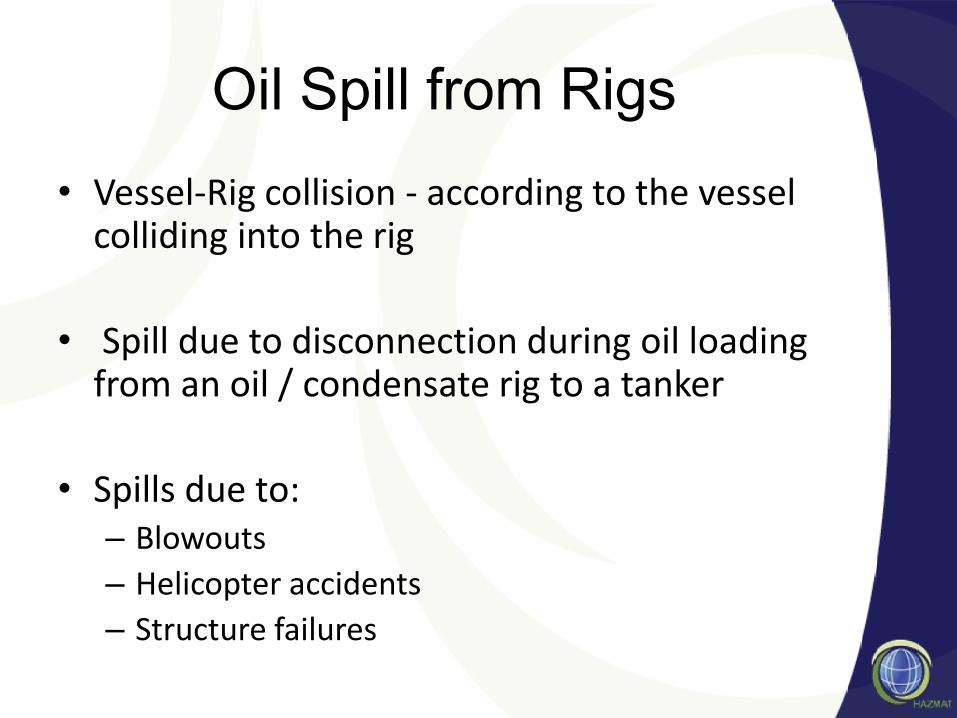
• Vessel-Rig collision - according to the vessel colliding into the rig
• Spill due to disconnection during oil loading from an oil / condensate rig to a tanker
• Spills due to: – Blowouts
– Helicopter accidents
– Structure failures

Oil Spill from Maritime
Connections
• Israeli contingency plan is currently being updated
• Full bore rupture from a flexible hose – for example during the connection to the
maritime connection
• Full bore rupture from the offshore pipeline – for example due to maintenance work
Results
0
100
200
300
400
500
600
700
800
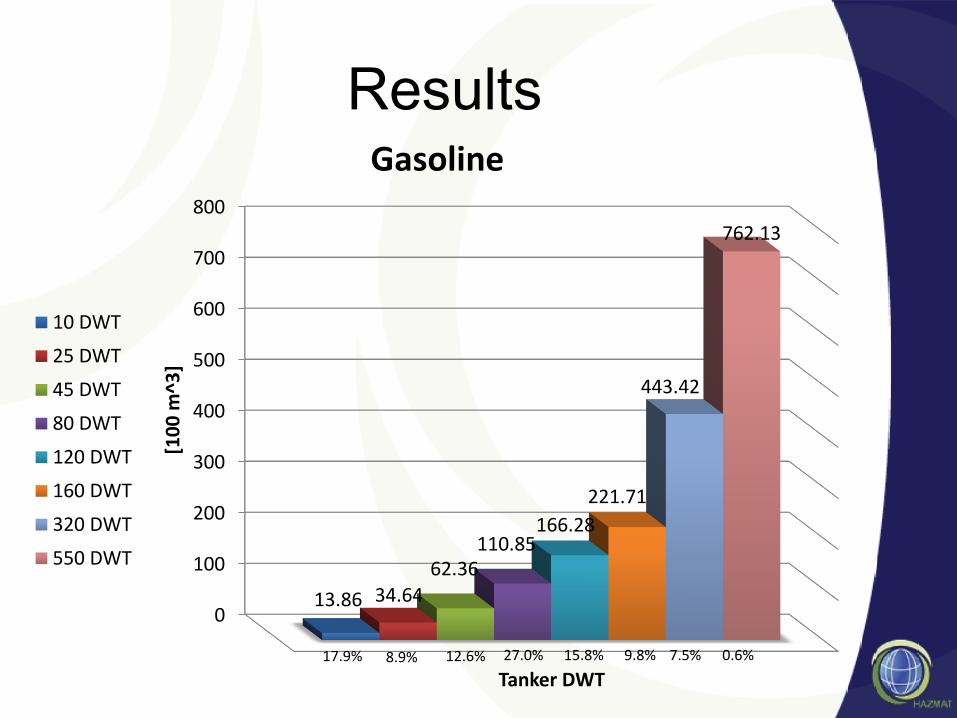
13.86 34.64 62.36
110.85 166.28
221.71
443.42
762.13
[10
0 m
^3]
Tanker DWT
Gasoline
10 DWT
25 DWT
45 DWT
80 DWT
120 DWT
160 DWT
320 DWT
550 DWT
17.9% 8.9% 27.0% 12.6% 15.8% 9.8% 7.5% 0.6%
Results
0
100
200
300
400
500
600
700
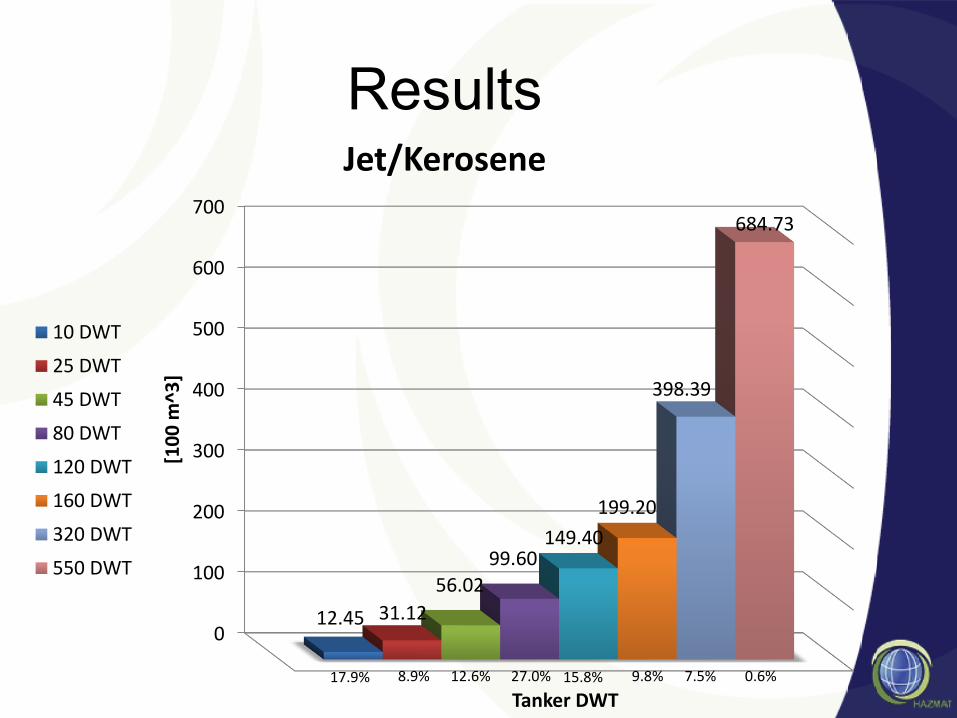
12.45 31.12
56.02
99.60 149.40
199.20
398.39
684.73
[10
0 m
^3]
Tanker DWT
Jet/Kerosene
10 DWT
25 DWT
45 DWT
80 DWT
120 DWT
160 DWT
320 DWT
550 DWT
17.9% 8.9% 27.0% 12.6% 15.8% 9.8% 7.5% 0.6%

Results
0
100
200
300
400
500
600
700
12.32 30.81 55.45
98.58 147.87
197.16
394.32
677.74
[10
0 m
^3]
Tanker DWT
Diesel/Gasoil
10 DWT
25 DWT
45 DWT
80 DWT
120 DWT
160 DWT
320 DWT
550 DWT
17.9% 8.9% 27.0% 12.6% 15.8% 9.8% 7.5% 0.6%
Results
0
100
200
300
400
500
600
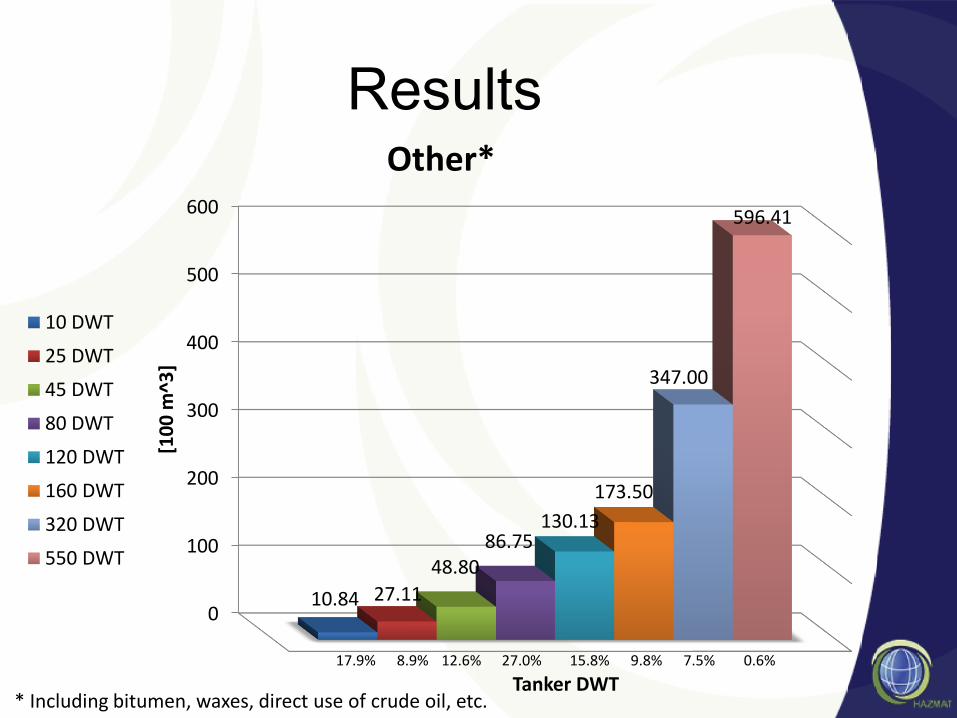
10.84 27.11
48.80 86.75
130.13
173.50
347.00
596.41
[10
0 m
^3]
Tanker DWT
Other*
10 DWT
25 DWT
45 DWT
80 DWT
120 DWT
160 DWT
320 DWT
550 DWT
17.9% 8.9% 27.0% 12.6% 15.8% 9.8% 7.5% 0.6%
* Including bitumen, waxes, direct use of crude oil, etc.
Results
• The average oil spill amount from a vessel’s fuel oil tank is 1650m3 (70% HFO, 30%MDO)
• the amount estimated in oil discharge from rig is 1679 ton (about 2000m3)
• According to the Israeli contingency plan (2007) the maximum amount to be spilled in maritime connection scenario is about 8500 ton oil (crude oil).