Embed Size (px)
Citation preview

Identi�cation of Mild Cognitive ImpairmentSubtypes Predicting Conversion to Alzheimer’sDisease Using a Heterogeneous Mixture LearningMasataka Kikuchi ( [email protected] )
Osaka University School of Medicine Graduate School of Medicine: Osaka Daigaku Daigakuin IgakukeiKenkyuka Igakubu https://orcid.org/0000-0002-9562-841XKaori Kobayashi
Osaka UniversitySakiko Itoh
Osaka UniversityKensaku Kasuga
Niigata UniversityAkinori Miyashita
Niigata UniversityTakeshi Ikeuchi
Niigata UniversityEiji Yumoto
NEC corporationYasuto Fushimi
NEC corporationToshihiro Takeda
Osaka University School of Medicine Graduate School of Medicine: Osaka Daigaku Daigakuin IgakukeiKenkyuka IgakubuShirou Manabe
Osaka University School of Medicine Graduate School of Medicine: Osaka Daigaku Daigakuin IgakukeiKenkyuka IgakubuKenichi Kamijo
NEC corporationYasushi Matsumura
Osaka University School of Medicine Graduate School of Medicine: Osaka Daigaku Daigakuin IgakukeiKenkyuka Igakubu
Research

Keywords: Alzheimer Disease, Mild Cognitive Impairment, Decision Trees
Posted Date: December 17th, 2020
DOI: https://doi.org/10.21203/rs.3.rs-129455/v1
License: This work is licensed under a Creative Commons Attribution 4.0 International License. Read Full License
1
Identification of mild cognitive impairment subtypes predicting 1
conversion to Alzheimer’s disease using a heterogeneous mixture 2
learning 3
4
Masataka Kikuchi1, Kaori Kobayashi1,2, Sakiko Itoh1, Kensaku Kasuga3, Akinori 5
Miyashita3, Takeshi Ikeuchi3, Eiji Yumoto4, Yasuto Fushimi2, Toshihiro Takeda5, Shirou 6
Manabe5, Alzheimer’s Disease Neuroimaging Initiative#, Kenichi Kamijo2, Yasushi 7
Matsumura5 8
9
1 Department of Genome Informatics, Graduate School of Medicine, Osaka University, 10
Osaka, Japan 11
2 Medical Solutions Division, NEC Corporation, Tokyo, Japan 12
3 Department of Molecular Genetics, Brain Research Institute, Niigata University, 13
Niigata, Japan 14
4 Biometrics Research Laboratories, NEC Corporation, Tokyo, Japan 15
5 Department of Medical Informatics, Graduate School of Medicine, Osaka University, 16
Osaka, Japan 17
# The data used in preparation of this article were obtained from the Alzheimer’s 18
Disease Neuroimaging Initiative (ADNI) database (adni.loni.usc.edu). As such, the 19
investigators within the ADNI contributed to the design and implementation of the 20
ADNI and/or provided data but did not participate in the analysis or writing of this 21
report. A complete listing of ADNI investigators can be found at 22
http://adni.loni.usc.edu/wp-content/uploads/how_to_ 23
apply/ADNI_Acknowledgement_List.pdf. 24
25
To whom correspondence should be addressed: 26
Masataka Kikuchi 27
2-2 Yamadaoka, Suita, Osaka 565-0871, Japan 28
Phone No.: +81-6-6210-8363 29
Fax No.: +81-6-6210-8365 30
Email Address: [email protected] (M.K.) 31
32
2
Abstract 1
Background 2
Mild cognitive impairment (MCI) is a high-risk condition for conversion to 3
dementias, including Alzheimer's disease (AD) dementia. However, individuals with 4
MCI show heterogeneity in patterns of pathology, and MCI does not always convert to 5
AD dementia. Detailed subtyping of MCI and accurate prediction of the patients in whom 6
MCI will convert to AD dementia may support new trial designs and enable evaluation 7
of the efficacy of drugs within small numbers of patients during clinical trials. 8
Methods 9
We constructed a decision tree model by the heterogeneous mixture learning 10
(HML) method, integrating cerebrospinal fluid (CSF) biomarker data, structural MRI 11
data, APOE genotype data, and a recorded age at examination. The decision tree model 12
was applied to predict conversion to AD dementia and to identify subtypes of MCI. After 13
the test performances of HML models were assessed, MCI subjects were classified into 14
some subtypes based on a decision tree. Then, we characterized each MCI subtype in 15
terms of the degree of CSF biomarker abnormalities and brain atrophy, declines of 16
cognitive functions, and gene expression alterations derived from peripheral blood 17
samples. 18
3
Results 1
We identified five subtypes of MCI using the HML approach and categorized 2
them into three groups: those similar to CN subjects with low conversion rates; those with 3
intermediate conversion rates; and those similar to patients with AD with high conversion 4
rates. Furthermore, the subtypes with intermediate conversion rates were separated into 5
the subtype with CSF biomarker abnormalities or the subtype with brain atrophy. The 6
results from the CSF inflammation marker and gene expression analysis suggested the 7
occurrence of aberrant inflammatory immune responses in the CSF and blood of the 8
subjects in the subtypes with CSF biomarker abnormalities. 9
Conclusion 10
The subtypes that were identified in this study exhibited varying conversion rates 11
to AD as well as differing levels of biological features. Focusing on specific subtypes in 12
which conversion to AD can be predicted with the most accuracy could enable more 13
efficient clinical trials to be conducted. 14
15
Keywords: 16
Alzheimer Disease, Mild Cognitive Impairment, Decision Trees 17
18
4
Background 1
Worldwide, 46.8 million people are affected by dementias, including AD 2
dementia, which is characterized by the deposition of amyloid-beta (Aβ) protein and tau 3
protein [1]. Overcoming dementia is an urgent issue because the number of affected 4
individuals is increasing. 5
Experimental drugs for AD have failed to prevent or slow cognitive decline in 6
people with AD in clinical trials or have shown adverse effects [2]. Although these drugs 7
do not demonstrate excellent clinical efficacy in patients with late-stage AD, they can 8
potentially be effective for the treatment of patients with early-stage AD or MCI. However, 9
individuals with MCI show heterogeneity in patterns of pathology, and MCI does not 10
always convert to AD dementia. Detailed subtyping of MCI and accurate prediction of 11
the patients in whom MCI will convert to AD dementia may support new trial designs 12
and enable evaluation of the efficacy of drugs within small numbers of patients during 13
clinical trials. 14
MCI can be classified into four clinical subtypes [3]. This classification system 15
divides MCI into amnestic and non-amnestic MCI, with further division into a group with 16
a single impairment in the cognitive domain (single-domain MCI) and a group with 17
multiple impairments (multiple-domain MCI). In particular, amnestic MCI, regardless of 18
5
whether it is single- or multiple-domain MCI, converts to dementia, mainly AD dementia, 1
at a rate of 10% to 15% per year [4]. Recent studies based on neuropsychological tests 2
have also identified some subtypes of MCI [5, 6]. However, clinical diagnoses and 3
neuropsychological testing often include subjective factors. In addition to subjective 4
factors, assessment of objective factors such as brain imaging data, biomarker data, and 5
genomic data may enable more precise determination of a subtype of MCI that converts 6
to AD dementia. 7
In this study, we applied the HML method to identify subtypes of MCI. HML 8
divides individuals into similar groups based on the brain volumes from five brain regions, 9
CSF biomarker including Aβ and tau, and genomic data of apolipoprotein E (APOE) 10
gene obtained from individuals and generates appropriate predictive models for each 11
group (e.g., models for determining whether an individual is a patient with AD dementia 12
or a healthy individual). We characterized the subtypes of MCI identified by HML and 13
examined conversion to AD dementia for each subtype over a given period. 14
15
Materials and methods 16
Dataset 17
The data used in this study were obtained from the Alzheimer's Disease 18
6
Neuroimaging Initiative (ADNI) [7]. The ADNI was launched in 2003 as a public-private 1
partnership led by Principal Investigator Michael W. Weiner, MD. The primary goal of 2
the ADNI has been to test whether serial magnetic resonance imaging (MRI), positron 3
emission tomography (PET), analysis of other biological markers, and clinical and 4
neuropsychological assessments can be combined to measure the progression of MCI and 5
early AD. The ADNI database contains data from a large number of cognitively normal 6
(CN), MCI, and AD subjects recruited from over 50 different centres in the US and 7
Canada, with follow-up assessments performed every 6 months. Institutional review 8
boards approved the study procedures across participating institutions. Written informed 9
consent was obtained from all subjects. 10
This study considered the data of 941 subjects comprising 156 AD dementia 11
patients (at baseline; same hereinafter), 480 MCI subjects, and 305 CN subjects. All 12
subjects had CSF biomarker data, structural MRI data, APOE genotype data, and a 13
recorded age at examination. The AD dementia patients and the MCI subjects were 14
diagnosed mainly by neuropsychological tests (Mini–Mental State Examination (MMSE), 15
Clinical Dementia Rating-Sum of Boxes (CDR-SB), and Wechsler Memory Scale 16
Logical Memory II). Based on the above criteria, the AD dementia patients that were 17
analysed in this study refer to AD dementia or Alzheimer’s clinical syndrome, which were 18
7
clinically diagnosed without the pathological markers such as Aβ and tau proteins. For 1
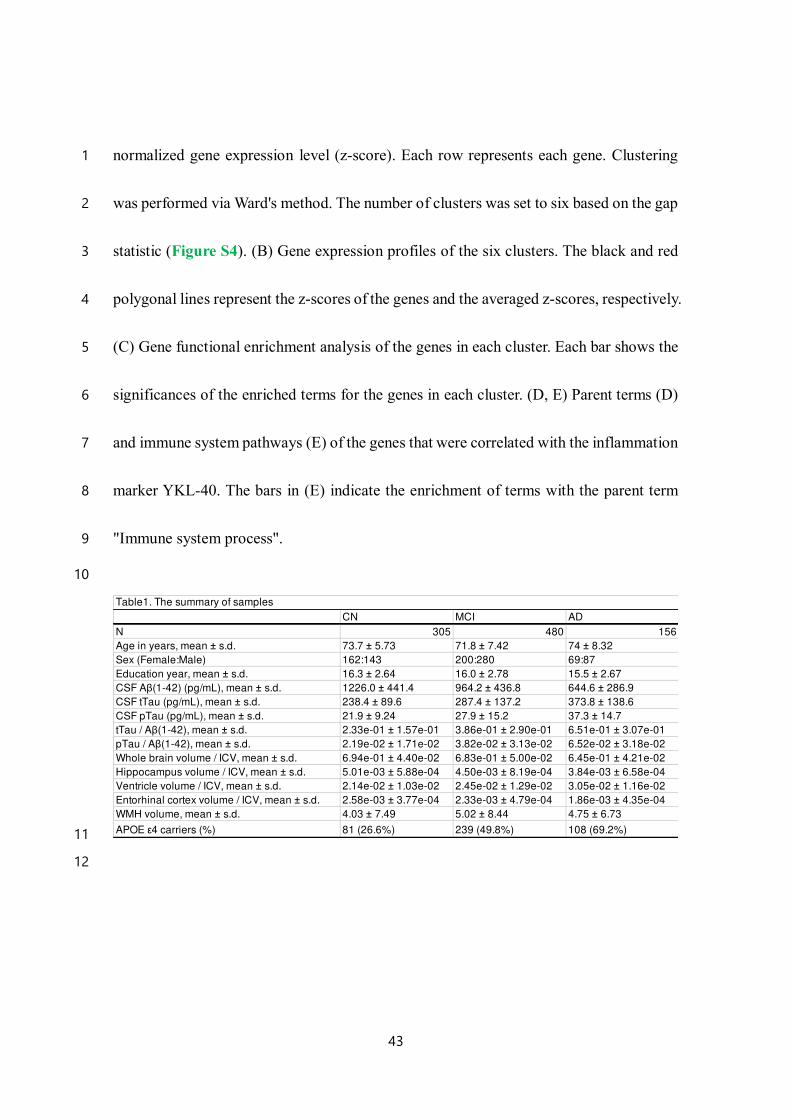
this study, we used a subset of the ADNI dataset called ADNIMERGE. Table 1 shows a 2
summary of each group. 3
4
CSF biomarkers 5
The CSF biomarkers comprised the following five markers: Aβ(1-42) peptide 6
levels, total tau (tTau) protein levels, phosphorylated tau (pTau) protein levels, the 7
tTau/Aβ(1-42) ratio, and the pTau/Aβ(1-42) ratio. The levels of Aβ(1-42), tTau, and pTau 8
were analysed by Roche Elecsys® immunoassays (Roche Diagnostics GmbH, Penzberg, 9
Germany). The tTau/Aβ(1-42) ratio and pTau/Aβ(1-42) ratio were calculated by the levels 10
of the above three CSF biomarkers. The CSF biomarkers are quantitative variables, but 11
the level of each is often represented by a string containing an inequality sign when the 12
biomarker level reaches the upper limit or is below the detection limit of immunoassays. 13
Here, we treated ">1700" for Aβ(1-42) as 1,700 pg/mL and ">1300" for tTau as 1,300 14
pg/mL. Similarly, "<8" and ">120" for pTau were transformed into 8 pg/mL and 120 15
pg/mL, respectively. 16
17
Structural MRI 18
8
Structural MRI was used to assess the following five markers: whole-brain 1
volume, ventricular volume, hippocampal volume, entorhinal cortex volume, and white 2
matter hyperintensity (WMH) volume. These volumes were normalized as fractions of 3
the intracranial volume. Cortical reconstruction and volumetric segmentation were 4
performed with the FreeSurfer image analysis suite. WMH volumes were calculated 5
based on coregistered T1-, T2-, and proton density-weighted structural MRI images. 6
7
APOE genotype 8
APOE genotyping was performed on DNA samples of each subject’s blood cells 9
using an APOE genotyping kit. APOE includes 3 alleles (ε2, ε3, and ε4) and 6 genotypes 10
(ε22, ε23, ε24, ε33, ε34, and ε44). We assessed the number of ε4 alleles, as the ε4 allele 11
is known as a risk factor for AD. 12
13
HML model 14
We applied HML to obtain a decision tree for MCI subtyping. HML is a type of 15
hierarchical mixture of experts [8-10] that integrates multiple learners using a decision 16
tree. HML divides individuals into similar groups based on various datasets of the 17
individuals and generates appropriate predictive models for each group. As described 18

9
below, HML simultaneously estimates the parameters for a decision tree and the 1
prediction models using the expectation-maximization (EM) algorithm based on 2
factorized information criterion (FIC), which is an estimator specific to HML 3
(Supplementally information). Using HML has several advantages, including the 4
following: (1) the decision tree facilitates understanding of how individuals are classified 5
into their subtypes, and (2) HML naturally prunes more complex brunches of a decision 6
tree by the contribution of FIC, providing a decision tree with higher interpretability 7
compared to them from the other methods based on decision tree. A program for HML 8
was provided by NEC Corporation. 9
10
Decision tree 11
A decision tree in HML was created in which the gating nodes were non-leaf 12
nodes and the expert nodes were leaf nodes (Figure S1). The i-th gating node 𝑔𝑖 assigns 13
an individual as input data 𝑥(𝑛) to an appropriate expert node for prediction based on 14
the rule 𝑥[𝛾𝑖] < 𝑡𝑖, where 𝛾𝑖 and 𝑡𝑖 are the index of a variable and a threshold in a 15
gating node 𝑔𝑖, respectively. A binary logistic regression model was used in the expert 16
nodes. The prediction model in the j-th expert node is presented in the following equation: 17
𝑝(𝑦𝑁|𝑥𝑁, 𝜙𝑗) = 11 + 𝑒𝑥𝑝(−𝜙𝑗𝑇𝑥𝑁) . (1) 18
10
Let us denote the regression target as 𝑦𝑁 = 𝑦(1), … , 𝑦(𝑁) , where 𝑦(𝑛) corresponds to 1
𝑥(𝑛) and 𝜙𝑗 indicates a weight vector of parameters in the j-th expert node. 2
3
Estimation of parameters by EM-like iterative optimization 4
To obtain a decision tree model via HML, we needed the parameters for the 5
gating nodes (i.e., 𝑔, 𝛾, and 𝑡) and the expert nodes (i.e., 𝜙). These parameters were 6
estimated by EM-like iterative optimization (Algorithm 1 in Supplementally 7
information). The variational distribution, which is derived from FIC, in the E-step has 8
a regularization effect and penalizes the expert nodes that contribute to the formation of 9
complex tree structure and that have more variables with small effects (Supplementally 10
information). Therefore, HML automatically selects an optimal decision tree and optimal 11
model parameters to maximize FIC [9, 10]. 12
13
Test performance 14
We used the datasets from 156 AD dementia patients and 305 CN subjects as 15
training and validation datasets to determine a decision tree and model parameters via 16
HML (Figure S2). The data for four-fifths of the AD dementia patients and CN subjects 17
were used as a training dataset. The remaining data were used as a validation dataset to 18

11
fine-tune the model parameters. The regression target was 𝑦(𝑛) = 1 when a subject is 1
AD and 𝑦(𝑛) = 0 when a subject is CN. Of 480 MCI subjects, the dataset from the 396 2
MCI subjects who were followed for more than three years was used as test data. The 3
regression target was 𝑦(𝑛) = 1 when an MCI subject converted to AD dementia within 4
three years and 𝑦(𝑛) = 0 otherwise. 5
Using the training dataset, we first set the tree depth d to a value ranging from 6
three to six. Then, we estimated parameters via HML. As we mentioned above, HML 7
optimizes the parameters based on the EM-like iterative optimization. It is well known 8
that the EM iterative optimization generally converges to a local optimum depending on 9
an initial value and is not guaranteed to converge to the global optimum. To avoid a local 10
optimum, we generated 500 models with different initial values at each depth. We next 11
applied the validation dataset to the 2,000 models (= 4 depths × 500 models) generated 12
from the training data and adopted the decision tree model with the highest accuracy in 13
the validation dataset as the model with optimal parameters (Figure S2). We finally 14
calculated the test performances of the model using the test data. These procedures were 15
repeated for 5-fold cross-validation (CV). 16
An HML decision tree model generated from the training data classified the MCI 17
subjects into AD dementia patients (the predicted ADs) or CN subjects (the predicted 18
12
CNs). For test performance, the predicted ADs in whom MCI converted to AD dementia 1
within three years were defined as true positives (TPs). The predicted ADs in whom MCI 2
did not convert were defined as false positives (FPs). In the same way, the predicted CNs 3
who developed AD dementia within three years and those who did not develop AD 4
dementia were defined as false negatives (FNs) and true negatives (TNs), respectively. 5
We calculated sensitivity, specificity, precision, and accuracy using the four outcomes as 6
follows: 7
𝑆𝑒𝑛𝑠𝑖𝑡𝑖𝑣𝑖𝑡𝑦 = 𝑇𝑃𝐹𝑁 + 𝐹𝑃 , 8
𝑆𝑝𝑒𝑐𝑖𝑓𝑖𝑐𝑖𝑡𝑦 = 𝑇𝑁𝐹𝑃 + 𝑇𝑁 , 9
𝑃𝑟𝑒𝑐𝑖𝑠𝑖𝑜𝑛 = 𝑇𝑃𝑇𝑃 + 𝐹𝑃 , 10
𝐴𝑐𝑐𝑢𝑟𝑎𝑐𝑦 = 𝑇𝑃 + 𝑇𝑁𝑇𝑃 + 𝐹𝑃 + 𝑇𝑁 + 𝐹𝑁. 11
The AD conversion in each MCI subject is presented as a time-to-event value, that is, the 12
number of days from age at baseline to age at onset. In this study, we defined the data for 13
the MCI subjects in whom MCI did not convert to AD dementia during follow-up period 14
as censoring data. The log-rank test was performed to evaluate the difference in 15
conversion between the predicted ADs and the predicted CNs or among the MCI subtypes. 16
The conversion rate at time t (CRt) was given by the following: 17
𝐶𝑅𝑡 = 1 − (𝐶𝑅𝑡−1 𝑛𝑡 − 𝑐𝑡𝑛𝑡 ), 18
13
where nt is number at risk at time t and ct is the number of the individuals converted to 1
AD dementia during the period from time t-1 to time t. 2
3
Classification and regression tree (CART) 4
The test performances by CART were calculated using the same 5
training/validation/test datasets with HML (Figure S2). We set the tree depth d to a value 6
ranging from three to six. A function GridSearchCV provided by the Python scikit-learn 7
package [11] optimized the following parameters in CART: the maximum depth of the 8
tree (3, 4, 5, and 6); the criterion ("the Gini impurity" or "the information gain"); the 9
minimum number of samples required to be at a leaf node (1,…,11); the minimum number 10
of samples required to split an internal node (2,…,11); the random state (0,…,101); the 11
strategy used to choose the split at each node ("best" or "random"). We adopted the model 12
with the highest accuracy in a validation dataset and calculated the test performances of 13
the adopted model using the test dataset. 14
15
Composite scores of cognitive domains 16
We used the composite scores of four cognitive domains (memory, executive 17
function, language, and visuospatial function) in a bi-factor model [12, 13]. The 18

14
composite score for memory was calculated based on the following tests: the word lists 1
for the three forms of the Alzheimer's Disease Assessment Scale-Cognitive Subscale 2
(ADAS-Cog), the word lists for the two forms of the Rey Auditory Verbal Learning Test 3
(RAVLT), the three word recall items from the MMSE, and Logical Memory scores. The 4
composite score for executive function was calculated based on the following tests: the 5
category fluency tests for animals and vegetables, the Trail-Making Test (Parts A and B), 6
the Digit Span Backwards test, the Wechsler Adult Intelligence Scale-Revised (WAIS-R) 7
Digit Symbol Substitution Test, and tests for five clock drawing items (circle, symbol, 8
numbers, hands, time). The composite score for language was calculated based on the 9
following tests: a neuropsychological battery including three language-related tests, the 10
MMSE including eight language tasks, the ADAS-Cog including three different language 11
tasks, and the Montreal Cognitive Assessment (MoCA) including six language items. The 12
composite score for visuospatial function was calculated based on the following tests: a 13
neuropsychological battery including five tests related to copying a clock, the 14
constructional praxis test in the ADAS-Cog, and the copy design test in the MMSE. 15
Detailed protocols are available for download at https://ida.loni.ucla.edu/. 16
The Tukey’s HSD test was used to verify the difference between the scores at 17
baseline in the two subtypes and was applied as a multiple comparison procedure. We 18
15
performed linear mixed model (LMM) analyses to compare the associations between 1
MCI subtypes and follow-up time. Subtype 2, which is mentioned in the following result 2
sections, was used as the reference. The independent variables included the subtypes, 3
follow-up time, and the interactions between subtypes and follow-up time. The covariates 4
included age, sex, and education years. The composite scores for cognitive function were 5
used as dependent variables. The random factors included the intercept and follow-up 6
time. Separate models were run for the four cognitive functions. We used the false 7
discovery rate (FDR) method to correct for multiple testing. 8
9
CSF markers for neuronal injury and the inflammatory response 10
We analysed the CSF levels of the neuronal injury marker Visinin-like-protein-11
1 (VILIP-1), the synaptic dysfunction markers Synaptosomal-associated protein, 25kDa 12
(SNAP-25) and Neurogranin (NGRN), and the inflammation marker YKL-40. The levels 13
of VILIP-1, SNAP-25 and NGRN were analysed with the Erenna® immunoassay system 14
(Singulex Inc., Alameda, CA, USA). The levels of YKL-40 were analysed with a 15
MicroVue YKL-40 ELISA (Quidel, San Diego, CA). We analysed the marker levels at 16
baseline in 62 MCI subjects. 17
18
16
Gene expression analysis 1
Gene expression profiles were measured with an Affymetrix Human Genome 2
U219 Array using peripheral blood samples from ADNI subjects. Raw expression values 3
obtained directly from CEL files were pre-processed using the robust multichip average 4
(RMA) normalization method. The Affymetrix Human Genome U219 Array contains 5
530,467 probes for 49,293 transcripts. All probe sets were mapped and annotated with 6
reference to the human genome (hg19). Probe sets without gene symbol names, control 7
probe sets, and non-specific probe sets were excluded from our analysis. The expression 8
levels of genes with multiple probe sets were averaged in each subject. We analysed the 9
gene expression levels in 239 MCI subjects. The gene expression levels were measured 10
in 92 subjects at baseline. We also added 147 subjects if the status at the measurement 11
visit of a gene expression was MCI (without conversion to AD dementia or reversion to 12
CN) in order to analyse as many subjects as possible. ANOVA was used to test differences 13
in the gene expression levels among subtypes. Differentially expressed genes (DEGs) 14
were selected as the genes whose differences in expression had non-adjusted p-values < 15
0.05. We first set the significance level of the FDR-adjusted p-value to < 0.05, but we 16
found no genes at this significance level. We adopted a significance level based on a non-17
adjusted p-value to assess the overall alterations in gene expression by gene functional 18
17
enrichment analysis. Next, we classified the DEGs into clusters using agglomerative 1
hierarchical clustering based on Ward’s method and the Euclidean distance. The number 2
of clusters was set to six based on the gap statistic [14]. Gene functional enrichment 3
analysis of the DEGs was performed using the Metascape database 4
(http://metascape.org/) [15]. 5
We performed linear regression analysis to examine the association between CSF 6
YKL-40 levels and gene expression levels. In this analysis, we used CN subjects, AD 7
dementia patients and MCI subjects. These subjects were measured for gene expression 8
and CSF YKL-40 at the same visit. The following subjects were analysed: 23 CN subjects, 9
18 MCI subjects, and 19 AD dementia patients. The independent variable was the CSF 10
YKL-40 level. The covariates included the ratio of absorbance at 260 nm and 280 nm, 11
the ratio of absorbance at 260 nm and 230 nm, the RNA integrity number, the microarray 12
plate number, the APOE ε4 dose, the disease status (CN, MCI, AD), age, sex, and 13
education. Gene expression levels were used as dependent variables. The genes correlated 14
with CSF YKL-40 were selected as the genes with non-adjusted p-values < 0.05. 15
16
Results 17
Test performance of a decision tree model obtained by HML 18
18
We generated decision tree models via HML using the dataset from 156 AD 1
dementia patients and 305 CN subjects, and assessed the test performance of the models 2
using the dataset from 396 MCI subjects by 5-fold CV (see Materials and methods, 3
Figure S2). The data for four-fifths of the AD dementia patients and CN subjects were 4
used as a training dataset. The remaining data were used as a validation dataset to fine-5
tune the model parameters. Using the training dataset, we tried decision trees with four 6
depths ranging from three to six and generated 500 models based on the different initial 7
conditions at each depth. Next, we applied the validation dataset to the 2,000 models (= 8
4 depths × 500 models) generated from the training data. We selected the decision tree 9
model with the highest accuracy in the validation dataset as the model with optimal 10
parameters. We further used the data for 396 MCI subjects as test data to evaluate the 11
decision tree model and calculated the test performance of the model. These procedures 12
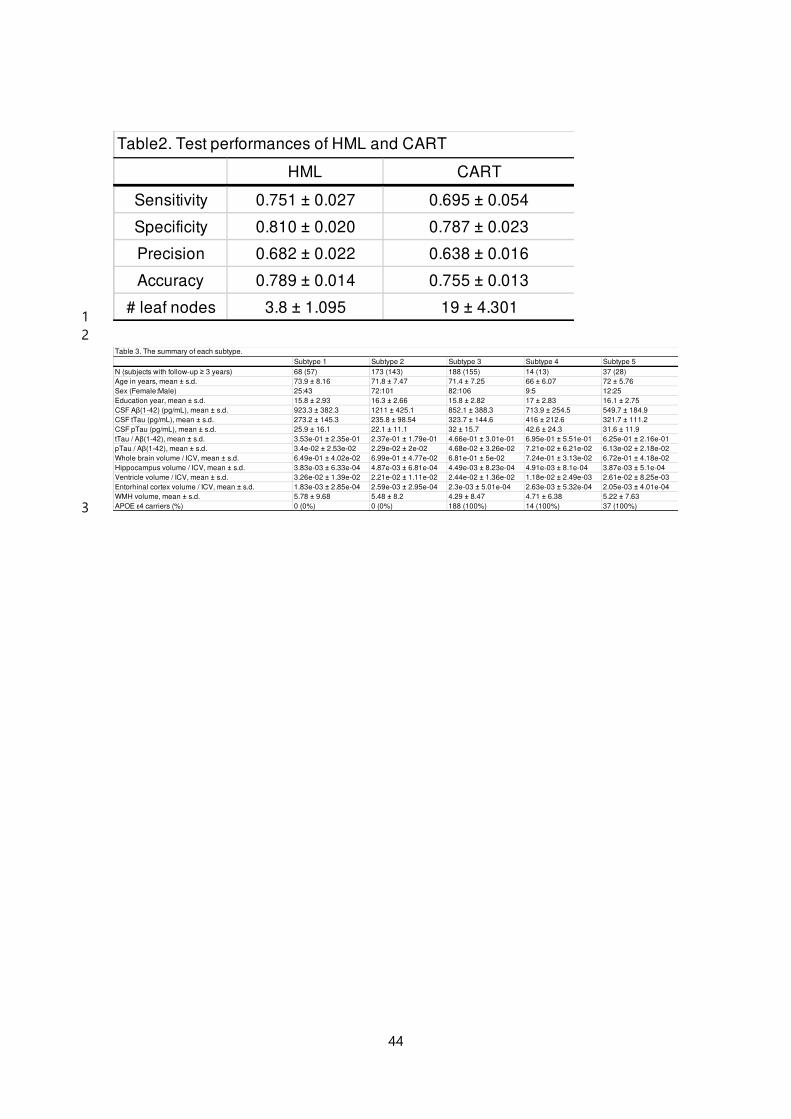
were repeated for 5-fold CV. The results from 5-fold CV showed a sensitivity of 13
0.751±0.027, a specificity of 0.810±0.020, a precision of 0.682±0.022, and an accuracy 14
of 0.789±0.014. In the same way, we also used the CART method, which is known as a 15
traditional decision tree method, and compared the test performance. The comparison of 16
the models obtained from the two methods showed that the models from the HML had 17
higher accuracy than those from CART (Table 2). In addition, the comparison of model 18
19
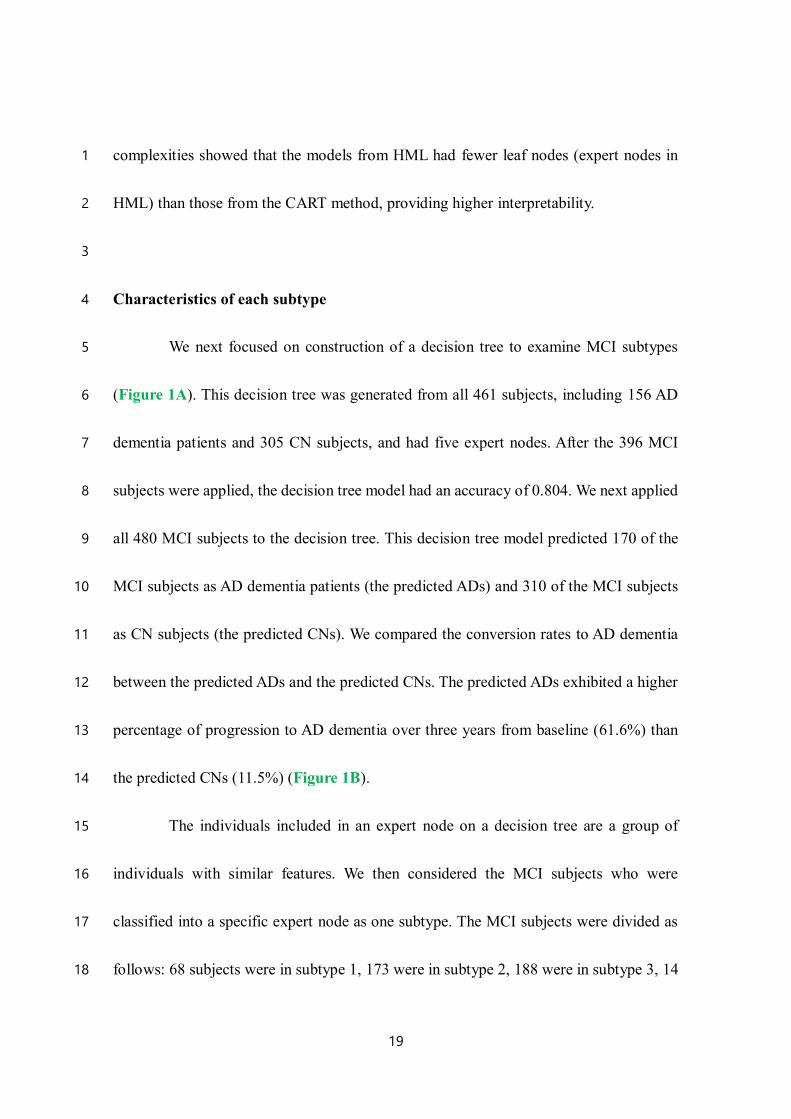
complexities showed that the models from HML had fewer leaf nodes (expert nodes in 1
HML) than those from the CART method, providing higher interpretability. 2
3
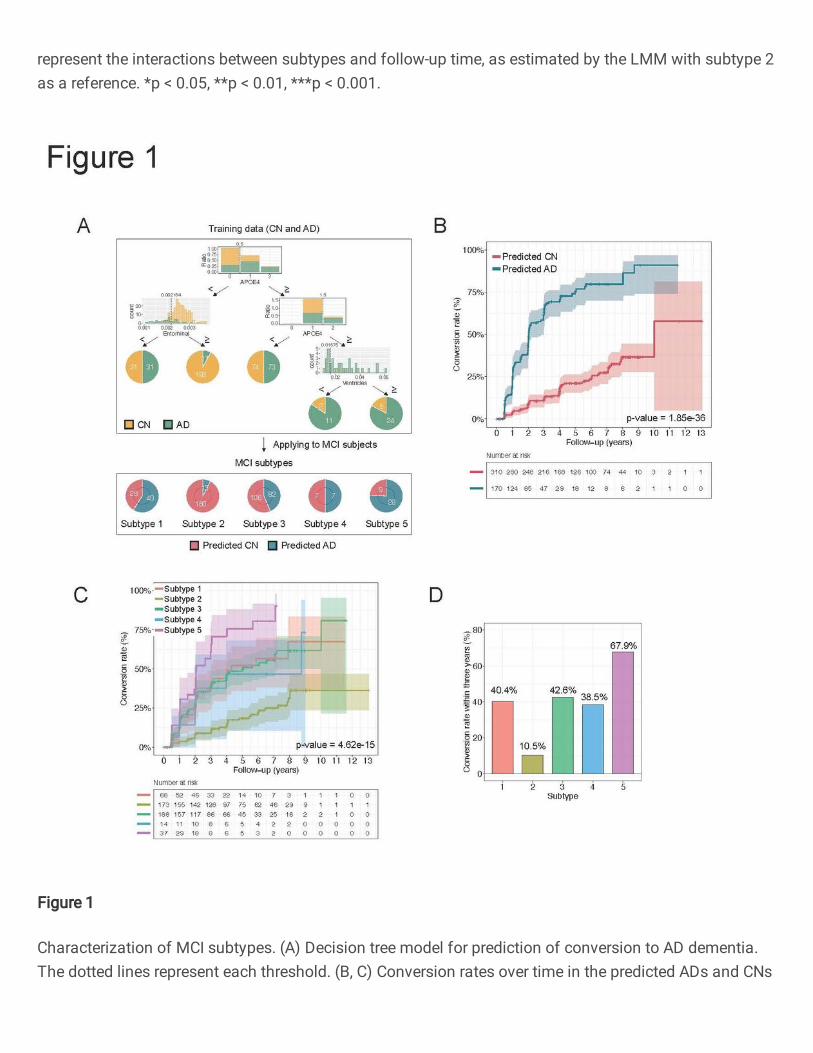
Characteristics of each subtype 4
We next focused on construction of a decision tree to examine MCI subtypes 5
(Figure 1A). This decision tree was generated from all 461 subjects, including 156 AD 6
dementia patients and 305 CN subjects, and had five expert nodes. After the 396 MCI 7
subjects were applied, the decision tree model had an accuracy of 0.804. We next applied 8
all 480 MCI subjects to the decision tree. This decision tree model predicted 170 of the 9
MCI subjects as AD dementia patients (the predicted ADs) and 310 of the MCI subjects 10
as CN subjects (the predicted CNs). We compared the conversion rates to AD dementia 11
between the predicted ADs and the predicted CNs. The predicted ADs exhibited a higher 12
percentage of progression to AD dementia over three years from baseline (61.6%) than 13
the predicted CNs (11.5%) (Figure 1B). 14
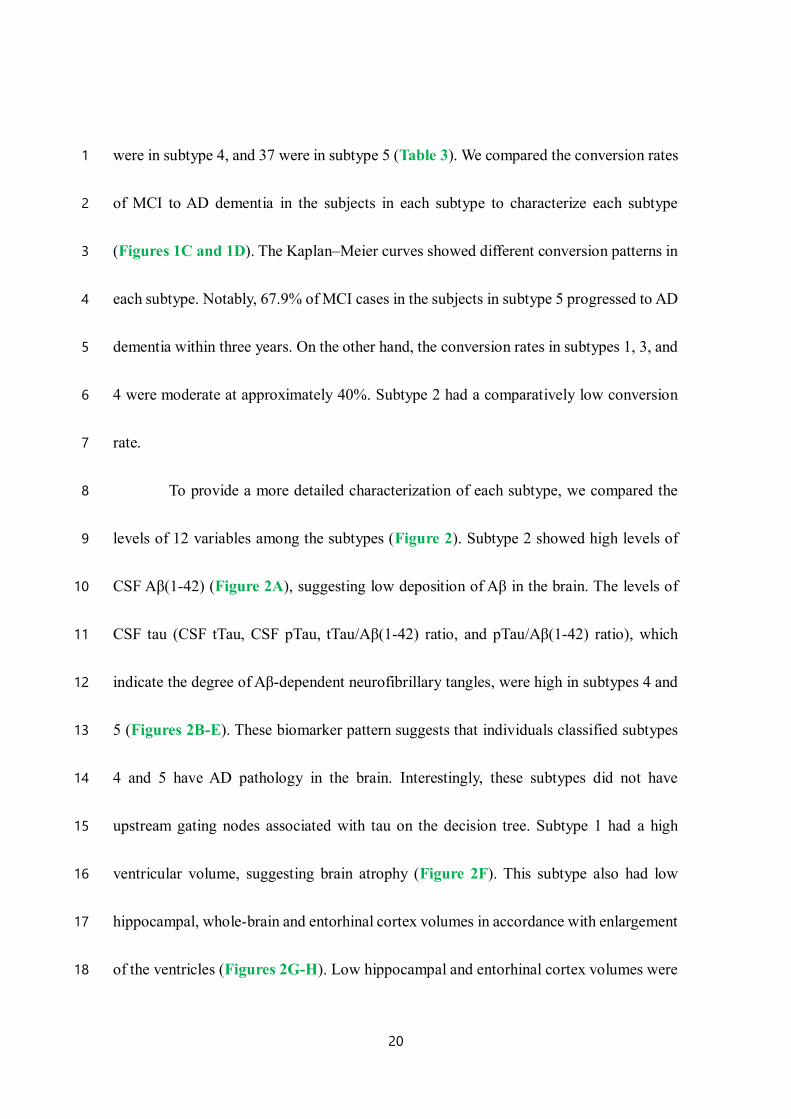
The individuals included in an expert node on a decision tree are a group of 15
individuals with similar features. We then considered the MCI subjects who were 16
classified into a specific expert node as one subtype. The MCI subjects were divided as 17
follows: 68 subjects were in subtype 1, 173 were in subtype 2, 188 were in subtype 3, 14 18
20
were in subtype 4, and 37 were in subtype 5 (Table 3). We compared the conversion rates 1
of MCI to AD dementia in the subjects in each subtype to characterize each subtype 2
(Figures 1C and 1D). The Kaplan–Meier curves showed different conversion patterns in 3
each subtype. Notably, 67.9% of MCI cases in the subjects in subtype 5 progressed to AD 4
dementia within three years. On the other hand, the conversion rates in subtypes 1, 3, and 5
4 were moderate at approximately 40%. Subtype 2 had a comparatively low conversion 6
rate. 7
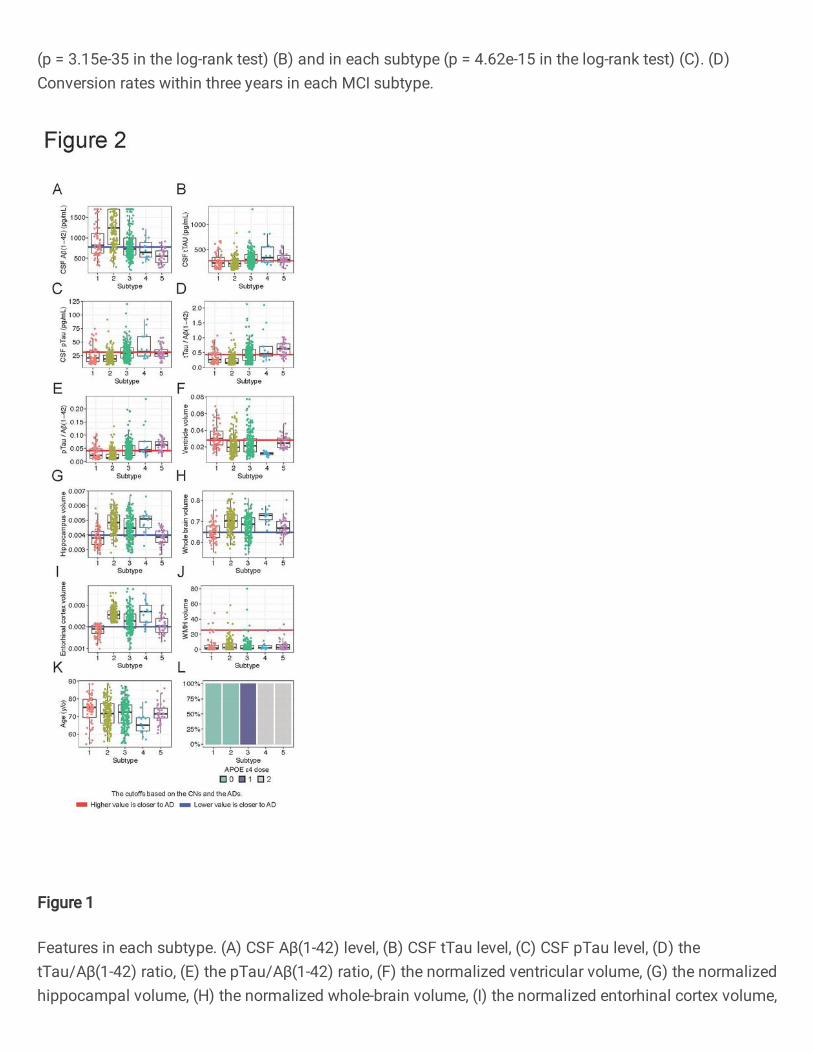
To provide a more detailed characterization of each subtype, we compared the 8
levels of 12 variables among the subtypes (Figure 2). Subtype 2 showed high levels of 9
CSF Aβ(1-42) (Figure 2A), suggesting low deposition of Aβ in the brain. The levels of 10
CSF tau (CSF tTau, CSF pTau, tTau/Aβ(1-42) ratio, and pTau/Aβ(1-42) ratio), which 11
indicate the degree of Aβ-dependent neurofibrillary tangles, were high in subtypes 4 and 12
5 (Figures 2B-E). These biomarker pattern suggests that individuals classified subtypes 13
4 and 5 have AD pathology in the brain. Interestingly, these subtypes did not have 14
upstream gating nodes associated with tau on the decision tree. Subtype 1 had a high 15
ventricular volume, suggesting brain atrophy (Figure 2F). This subtype also had low 16
hippocampal, whole-brain and entorhinal cortex volumes in accordance with enlargement 17
of the ventricles (Figures 2G-H). Low hippocampal and entorhinal cortex volumes were 18
21
also observed in subtype 5 (Figures 2G and 2I). Regarding WMH volumes, which reflect 1
white matter lesions caused by cerebral ischaemia, there were no differences among the 2
subtypes (Figure 2J), implying that most MCI subjects in this study did not present with 3
vascular dementia. Comparison of ages showed that subtypes 1 and 4 included relatively 4
older and younger MCI subjects, respectively (Figure 2K). Not surprisingly, the MCI 5
subjects in subtypes 1 and 2 did not have APOE ε4 alleles, which are genetic risk factors, 6
and all of the subjects in subtypes 3, 4, and 5 had one or two APOE ε4 alleles because the 7
decision tree had the gating nodes with APOE ε4 alleles (Figure 2L). 8
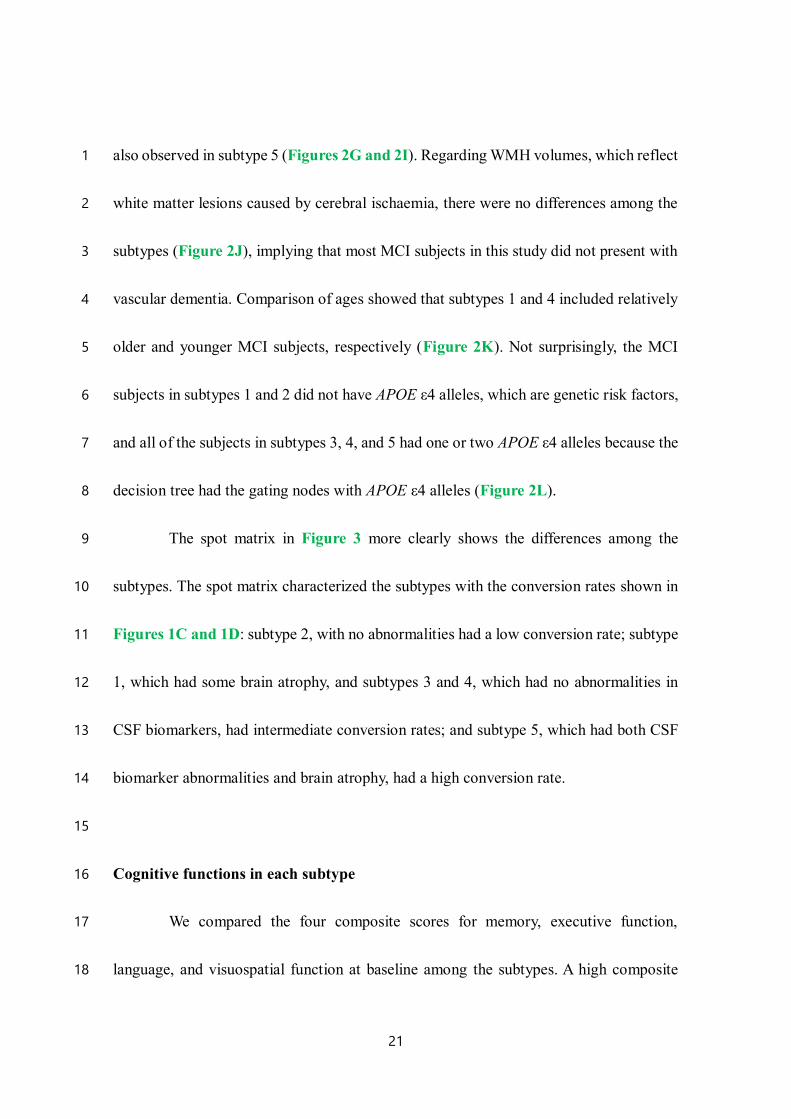
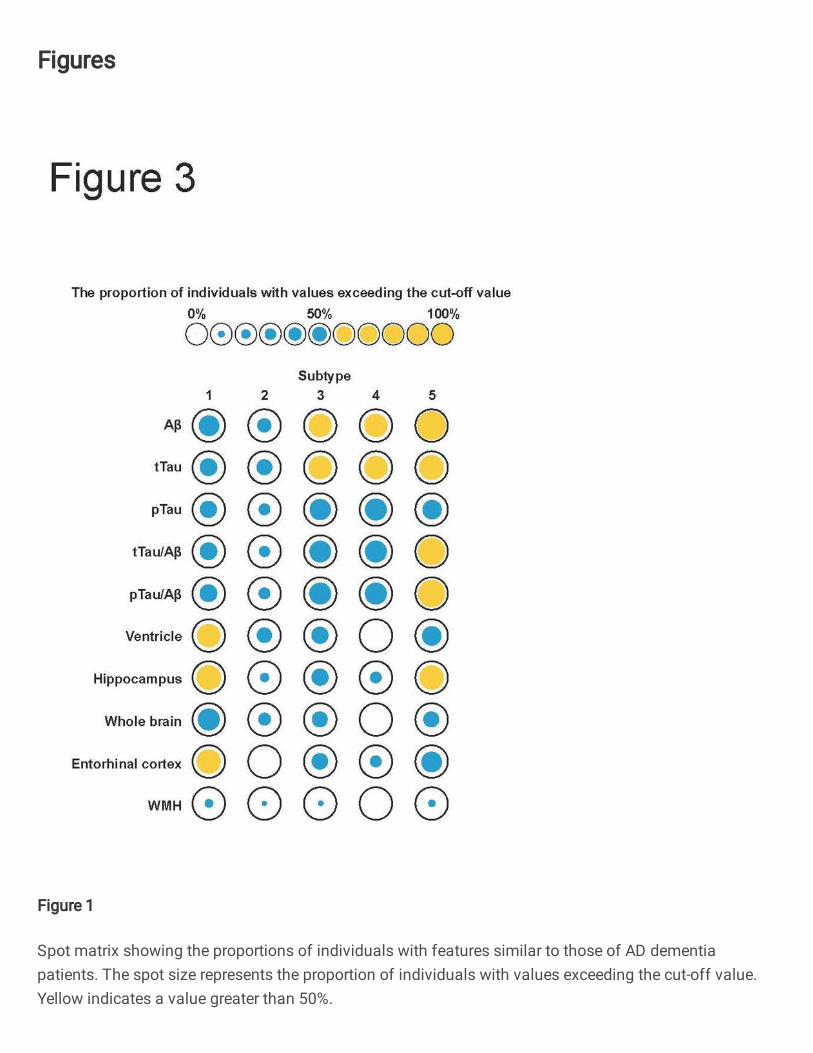
The spot matrix in Figure 3 more clearly shows the differences among the 9
subtypes. The spot matrix characterized the subtypes with the conversion rates shown in 10
Figures 1C and 1D: subtype 2, with no abnormalities had a low conversion rate; subtype 11
1, which had some brain atrophy, and subtypes 3 and 4, which had no abnormalities in 12
CSF biomarkers, had intermediate conversion rates; and subtype 5, which had both CSF 13
biomarker abnormalities and brain atrophy, had a high conversion rate. 14
15
Cognitive functions in each subtype 16
We compared the four composite scores for memory, executive function, 17
language, and visuospatial function at baseline among the subtypes. A high composite 18

22
score in each cognitive domain indicates high cognitive function. Comparisons among 1
subtypes showed that the scores for memory, executive function, and language of the 2
subjects in subtype 2 were basically significantly higher than those of the subjects in the 3
other subtypes (Figures 4A, 4D, and 4G). The scores for visuospatial function did not 4
show significant differences among the subtypes (Figure 4J). We next examined the 5
trajectories of these scores during the follow-up time. Figures 4B, 4E, 4H, and 4K shows 6
the temporal changes in each subtype. Individual cognitive declines are illustrated in 7
Figure S3. We performed LMM analyses with subtype 2 (no abnormalities) as the 8
reference to compare the association between follow-up time and each score. The scores 9
of memory and executive function in subtypes 1, 3, 4, and 5 declined significantly more 10
steeply than those in subtype 2 over time. Subtypes 1 and/or 4 did not show significant 11
associations for the language and visuospatial function scores. Subtype 5 consistently 12
showed the most rapid decreases in all scores. In addition, subtype 1 exhibited slower 13
declines than subtypes 3, 4, and 5, particularly for the memory and executive function 14
scores. These results show that the rate of exacerbation of cognitive decline differs 15
depending on the subtype. 16
17
Neuronal dysfunction and inflammatory responses in each subtype 18
23
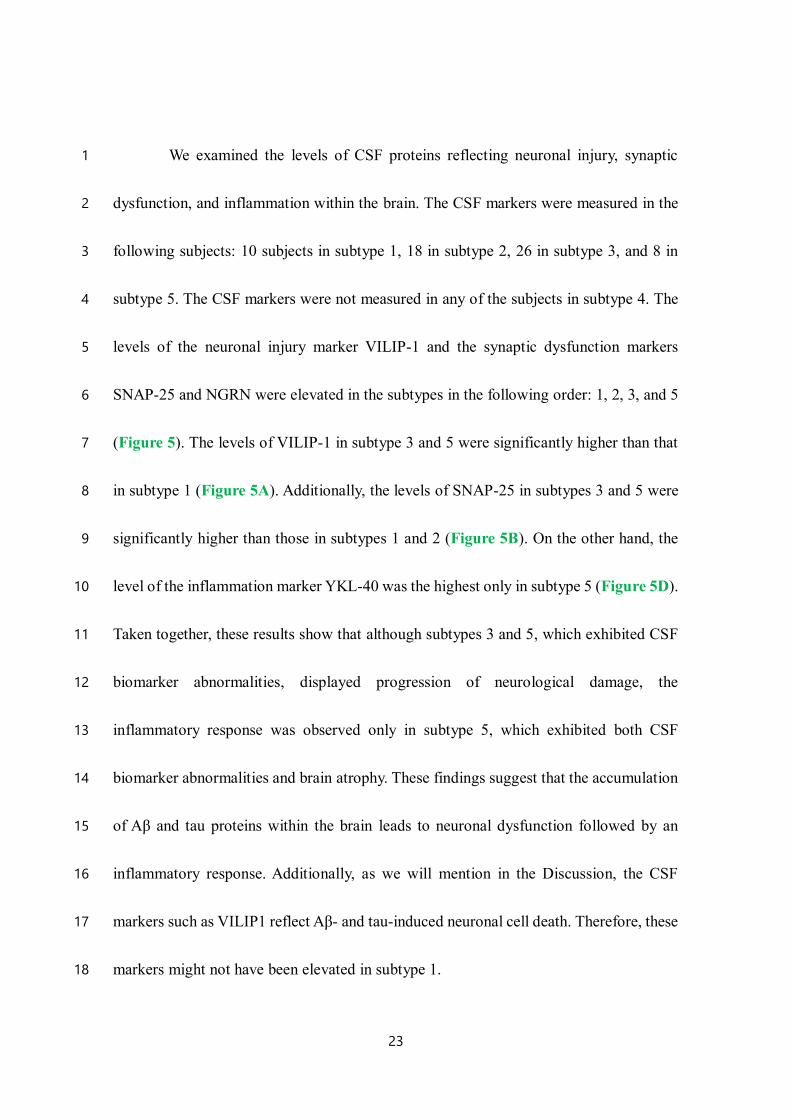
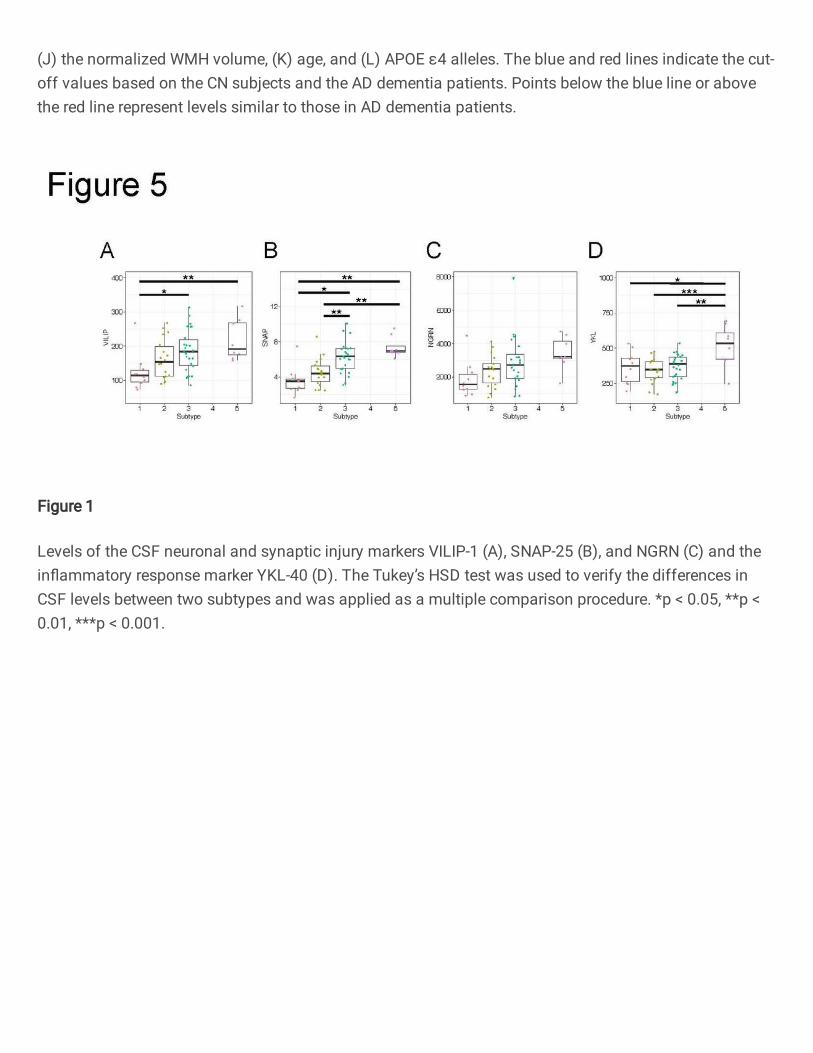
We examined the levels of CSF proteins reflecting neuronal injury, synaptic 1
dysfunction, and inflammation within the brain. The CSF markers were measured in the 2
following subjects: 10 subjects in subtype 1, 18 in subtype 2, 26 in subtype 3, and 8 in 3
subtype 5. The CSF markers were not measured in any of the subjects in subtype 4. The 4
levels of the neuronal injury marker VILIP-1 and the synaptic dysfunction markers 5
SNAP-25 and NGRN were elevated in the subtypes in the following order: 1, 2, 3, and 5 6
(Figure 5). The levels of VILIP-1 in subtype 3 and 5 were significantly higher than that 7
in subtype 1 (Figure 5A). Additionally, the levels of SNAP-25 in subtypes 3 and 5 were 8
significantly higher than those in subtypes 1 and 2 (Figure 5B). On the other hand, the 9
level of the inflammation marker YKL-40 was the highest only in subtype 5 (Figure 5D). 10
Taken together, these results show that although subtypes 3 and 5, which exhibited CSF 11
biomarker abnormalities, displayed progression of neurological damage, the 12
inflammatory response was observed only in subtype 5, which exhibited both CSF 13
biomarker abnormalities and brain atrophy. These findings suggest that the accumulation 14
of Aβ and tau proteins within the brain leads to neuronal dysfunction followed by an 15
inflammatory response. Additionally, as we will mention in the Discussion, the CSF 16
markers such as VILIP1 reflect Aβ- and tau-induced neuronal cell death. Therefore, these 17
markers might not have been elevated in subtype 1. 18
24
1
Identification of subtype-signature gene pathways 2
To examine the molecular biological features of each subtype, we performed 3
gene expression analysis among the subtypes using peripheral blood samples from ADNI 4
subjects. Gene expression levels were measured in 49 subjects in subtype 1, 174 in 5
subtype 2, 146 in subtype 3, 10 in subtype 4, and 23 in subtype 5. We found 1,080 genes 6
that were differentially expressed among subtypes by ANOVA. Agglomerative 7
hierarchical clustering classified these genes into six clusters (Figure 6A and 6B). The 8
gene expression profiles predominantly displayed dynamic alterations in gene expression 9
in subtypes 4 and 5. The genes in cluster 4 (n=109) were markedly downregulated in 10
subtype 5. The genes in cluster 4 were significantly associated with lysosomes and 11
autophagy (Figure 6C). Autophagy regulates lysosomal digestion to break down 12
damaged or unnecessary organelles and proteins. Additionally, autophagy regulates 13
excess inflammatory immune responses [16, 17], which corresponds to the increased 14
inflammation marker levels shown in Figure 5D. The genes in cluster 6 were prominently 15
upregulated in subtype 4 and moderately upregulated in subtype 5 and were obviously 16
related to B cell activation (Figure 6C). The genes in cluster 3 represented were 17
upregulated in subtype 4 and downregulated in subtype 5. The genes in cluster 3 were 18
25
significantly associated with terms related to the immune response, such as 1
"Immunoglobulin production mediated immune response", in addition to RNA 2
localization (Figure 6C). These results showed that the expression levels of genes in 3
immune response pathways were drastically changed in subtypes 4 and 5 and that 4
pathways evoked by immune responses such as autophagy were also altered in subtype 5
5. In the above analysis, although we could not analyse the level of the inflammation 6
marker YKL-40 in subtype 4 because this marker was not measured in the subjects of this 7
subtype, our results suggested the occurrence of aberrant immune responses in the blood 8
of the subjects in subtype 4 similar to that occurring in the subjects in subtype 5. However, 9
we could not directly relate the events in the blood and CSF. We then searched the genes 10
whose expression levels correlated with the levels of YKL-40 (see Materials and 11
Methods). Overall, the expression levels of 952 genes were found to be associated with 12
the levels of YKL-40. Interestingly, these genes were predominantly associated with 13
immune system process (Figures 6D and 6E). This result implies that the inflammation 14
arising in the CSF or brain propagates to the blood and triggers immune responses. These 15
associations may indirectly reflect events within the brains of the subjects. 16
17
Discussion 18
26
We constructed a decision tree model to predict the conversion of MCI to AD 1
dementia within three years via the HML approach. Our decision tree model predicted 2
the MCI subjects in whom MCI converted to AD dementia with higher accuracy than an 3
existing decision tree algorithm (Table 2). Furthermore, the decision tree model divided 4
the MCI subjects into five subtypes based on the characteristics of that data (Figure 1A). 5
Detailed analysis showed a relationship between the speed of transition to AD for each 6
subtype and its biological characteristics. 7
8
The identified subtypes revealed varying conversion rates to AD dementia as 9
well as differing levels of CSF biomarkers and brain atrophy (Figures 1C, 1D, 2, and 3). 10
The MCI subjects were mainly categorized into three groups in terms of AD conversion: 11
those similar to CN subjects with low conversion rates (subtype 2); those with 12
intermediate conversion rates (subtypes 1, 3, and 4); and those similar to AD dementia 13
patients with high conversion rates (subtype 5). Furthermore, the subtypes with 14
intermediate conversion rates were separated into subtypes with CSF biomarker 15
abnormalities (subtypes 3 and 4) and a subtype with brain atrophy (subtype 1). One of 16
the differences among these subtypes was the presence or absence of APOE ε4 alleles. 17
APOE ε4 alleles have been found to lead to Aβ and tau accumulation in the brain [18-21], 18

27
consistent with our results. As expected, the trajectory analysis of cognitive functions 1
showed that subtype 5, which had both CSF biomarker abnormalities and brain atrophy, 2
had the steepest declines over the follow-up time (Figures 4B, 4E, 4H, and 4K). On the 3
other hand, we observed different exacerbation rates for each score in subtypes 1, 3, and 4
4, even though these subtypes had similar conversion rates. 5
In the AT(N) system for classifying biological AD, where A is amyloid, T is tau, 6
and N is neurodegeneration [22], the MCI subjects in subtype 1 were A-T-N+, and the 7
subjects in subtypes 3 and 4 were A+T+N-. A recent study from the Alzheimer’s 8
Biomarkers in Daily Practice (ABIDE) project reported that the A+T+N- classification 9
has a higher percentage of APOE ε4 carriers than the A-T-N+ classification [23]. 10
Additionally, an Amsterdam cohort study has shown that cognitive functions vary among 11
different AT(N) profiles [24]. Subtypes 3, 4, and 5 are likely to develop AD because they 12
display CSF Aβ and tau abnormalities defining the Alzheimer’s continuum. On the other 13
hand, subtype 1 may include MCI subjects with suspected non-AD pathophysiology 14
(SNAP) that is marked by neurodegeneration without Aβ deposition within the brain [25]. 15
A part of the MCI subjects in subtype 1 may develop dementias other than AD in the 16
future. One of the pathologies of SNAP, such as that associated with the A-T-N+ 17
classification, that can be considered is limbic-predominant age-related TDP-43 18
28
encephalopathy (LATE) [26]. Stratification of subjects with MCI using biomarkers for 1
other neurodegenerative diseases, including the TDP-43 protein, would provide more 2
clarity regarding the heterogeneity of MCI. 3
4
Subtype 1 showed relatively low levels of CSF markers for neuronal and 5
synaptic injury (VILIP-1 and SNAP-25) despite advanced brain atrophy (Figures 5A and 6
5B). Previous studies have shown that the CSF level of VILIP-1 is associated with the 7
CSF Aβ and p-tau levels, suggesting that VILIP-1 is a marker of neuronal degeneration 8
related to Aβ and tau pathologies [27, 28]. In addition, a comparison of CSF VILIP-1 9
levels among CN subjects, MCI subjects, and AD dementia patients showed that VILIP-10
1 levels increased year-over-year only in MCI subjects; they did not increase in the CN 11
subjects and AD dementia patients [29]. The VILIP-1 levels in the CSF may increase 12
during inflammation and neurodegeneration triggered by Aβ and tau, but they may 13
decrease after neurons have already died and brain atrophy has occurred. Based on the 14
findings of these studies, we concluded that subtype 1 did not exhibit increases in the 15
levels of these neuronal degeneration markers because there were no prominent CSF 16
biomarker abnormalities. Additionally, our results suggested that the MCI subjects in 17
subtype 1 convert to the other dementia as discussed above because they did not show 18

29
relatively CSF biomarker abnormalities specific to AD pathologies. 1
2
Subtypes 3 and 5 showed high levels of CSF markers for neuronal and synaptic 3
injury such as VILIP-1 and SNAP-25 (Figures 5A and 5B). The levels of these markers 4
gradually increased with the dose of APOE ε4, consistent with the findings of recent 5
studies reporting associations between these markers and APOE ε4 [30, 31]. On the other 6
hand, the levels of the inflammation marker YKL-40 in the CSF were increased only in 7
subtype 5 among the subtypes except for subtype 4 (Figure 5D). Additionally, gene 8
expression analysis using blood tissues also showed that genes associated with the 9
inflammatory immune response were up- or downregulated specifically in subtype 4 and 10
5 (Figure 6C). To clarify the potential link between the CSF and the blood, we examined 11
the genes with blood expression levels that correlated with the CSF YKL-40 level and 12
found that they were enriched in inflammatory immune response pathways (Figures 6D 13
and 6E). However, the direct relationship between CSF and blood is unclear. The blood-14
brain barrier (BBB) and the blood-CSF barrier play roles as boundaries between the blood 15
and the brain or CSF. The BBB strictly regulates the passage of select blood molecules 16
through various channels into the brain. It has been considered that the central nervous 17
system, including the brain, has immune privilege (which protects it from inflammation 18
30
and the immune response) because of the existence of the BBB. However, recent studies 1
have shown that the immune privilege of the brain is not always assured [32, 33]. In 2
neurodegenerative diseases, including AD, the BBB is impaired, exhibiting increased 3
permeability [34, 35]. The increased permeability of the BBB enables transmission of 4
peripheral inflammation to the brain [34, 36]. In addition, inflammatory cytokines and 5
chemokines released from activated microglia and astrocytes can stimulate peripheral 6
immune cells through a disrupted BBB [37]. This evidence suggests that the events in the 7
CSF and brain propagate to the blood via the disrupted BBB, and vice versa. Furthermore, 8
it is well known that inflammatory mediators enhance autophagic activity [38, 39], which 9
corresponds with the alterations in gene expression in the autophagy pathway in subtype 10
5. In summary, BBB impairment may progress in MCI subjects in subtypes 5. 11
12
Our study has several limitations. First, we were not able to analyse all MCI 13
patients in some analyses. For example, the MCI subjects in subtype 4 did not have the 14
CSF markers for neuronal, synaptic injury, and inflammation markers. Second, although 15
we examined the comprehensive mRNA levels in the blood, the levels of mRNA in the 16
blood may change depending on lifestyle and other factors. To verify our results, detailed 17
analysis using animal models is necessary. 18
31
1
Conclusion 2
In this study, we demonstrated that HML is useful for the classification of MCI 3
subjects. Our study found some subtypes with characteristics similar to those of typical 4
AD and identified subtypes in whom MCI was likely to convert to other 5
neurodegenerative diseases. These findings imply that inclusion of additional 6
pathological information can enable more precise prediction of the onset or progression 7
of a wide variety of neurodegenerative diseases. Moreover, we developed a decision tree 8
model to predict conversion to AD dementia. Although there is room for improvement in 9
the overall performance of the model, focusing on specific subtypes in which conversion 10
to AD dementia can be predicted with the most accuracy (e.g., subtype 5, in which the 11
prediction was made with high precision) and targeting of individuals with MCI that are 12
classified as AD dementia patients by the prediction model for that subtype (i.e., the 13
predicted ADs) could enable more efficient clinical trials to be conducted. 14
15
Abbreviations 16
Mild cognitive impairment (MCI); Alzheimer's disease (AD); Cerebrospinal 17
fluid (CSF); Heterogeneous mixture learning (HML); Apolipoprotein E (APOE); 18
32
Amyloid-beta (Aβ); Expectation-maximization (EM) algorithm; Alzheimer's Disease 1
Neuroimaging Initiative (ADNI); Magnetic resonance imaging (MRI); Positron emission 2
tomography (PET); Cognitively normal (CN); Mini–Mental State Examination (MMSE); 3
Clinical Dementia Rating-Sum of Boxes (CDR-SB); Total tau (tTau); Phosphorylated tau 4
(pTau); White matter hyperintensity (WMH); Alzheimer's Disease Assessment Scale-5
Cognitive Subscale (ADAS-Cog); Rey Auditory Verbal Learning Test (RAVLT); 6
Wechsler Adult Intelligence Scale-Revised (WAIS-R); Montreal Cognitive Assessment 7
(MoCA); Linear mixed model (LMM); False discovery rate (FDR); Visinin-like-protein-8
1 (VILIP-1); Synaptosomal-associated protein, 25kDa (SNAP-25); Neurogranin 9
(NGRN); Differentially expressed genes (DEGs); Cross-validation (CV); Classification 10
and regression tree (CART); Blood-brain barrier (BBB) 11
12
Acknowledgements 13
We thank all the participants and staff of ADNI. 14
15
Authors’ contributions 16
Study design: M.K. and Y.M.; data cleaning: M.K., K.Kobayashi, and S.I.; HML 17
analysis: M.K. and K.Kobayashi; CART analysis: M.K., K.Kobayashi, and S.I.; 18
33
computational analysis: M.K.; paper writing: M.K.; paper review and supervision: 1
K.Kasuga, A.M., T.I., E.Y., Y.F., T.T., S.M., K.Kamijo, and Y.M.. The authors read and 2
approved the final manuscript. 3
4
Funding 5
This work was supported by a Grant-in-Aid for Scientific Research (grant number 6
20K15778 to M.K.) from the Ministry of Education, Culture, Sports, Science and 7
Technology (MEXT); the Japan Agency for Medical Research and Development 8
(AMED) (grant number JP20dk0207045 to M.K. and T.I., JP20ek0109392 to M.K., and 9
JP20dm0207073 to T.I.). The funders had no role in the study design, data collection, 10
decision to publish, or preparation of the manuscript. 11
12
Availability of data and materials 13
The data used during this study are available from the ADNI database 14
(https://ida.loni.ucla.edu/). 15
16
Ethics approval and consent to participate 17
This study was approved by the Ethics Committee of Osaka University. 18
34
1
Consent for publication 2
Consent for publication has been granted by ADNI administrators. 3
4
Conflicts of interest 5
The Department of Genome Informatics is a joint research department established 6
with sponsorship by the NEC Corporation. K.Kobayashi., E.Y., Y.F., and K.Kamijo. are 7
employees of NEC Corporation. The funder (NEC Corporation) provided support to 8
authors in the form of salaries (K.Kobayashi., E.Y., Y.F., and K.Kamijo.) but did not have 9
any additional roles in the study design, data collection, decision to publish. All other 10
authors declare no competing interests. 11
12
References 13
1. World Alzheimer Report 2015: The Global Impact of Dementia. 14
https://www.alz.co.uk/research/world-report-2015. 15
2. Cummings J, Lee G, Ritter A, Sabbagh M, Zhong K. Alzheimer's disease drug 16
development pipeline: 2019. Alzheimers Dement (N Y). 2019;5:272-93. 17
3. Petersen RC, Morris JC. Mild cognitive impairment as a clinical entity and 18
35
treatment target. Arch Neurol. 2005;62(7):1160-3; discussion 7. 1
4. Farias ST, Mungas D, Reed BR, Harvey D, DeCarli C. Progression of mild 2
cognitive impairment to dementia in clinic- vs community-based cohorts. Arch Neurol. 3
2009;66(9):1151-7. 4
5. Machulda MM, Lundt ES, Albertson SM, Kremers WK, Mielke MM, Knopman 5
DS, et al. Neuropsychological subtypes of incident mild cognitive impairment in the 6
Mayo Clinic Study of Aging. Alzheimers Dement. 2019;15(7):878-87. 7
6. Blanken AE, Jang JY, Ho JK, Edmonds EC, Han SD, Bangen KJ, et al. Distilling 8
Heterogeneity of Mild Cognitive Impairment in the National Alzheimer Coordinating 9
Center Database Using Latent Profile Analysis. JAMA Netw Open. 2020;3(3):e200413. 10
7. Mueller SG, Weiner MW, Thal LJ, Petersen RC, Jack C, Jagust W, et al. The 11
Alzheimer's disease neuroimaging initiative. Neuroimaging Clin N Am. 2005;15(4):869-12
77, xi-xii. 13
8. Jordan MI, Jacobs RA. Hierarchical Mixtures of Experts and the Em Algorithm. 14
Neural Comput. 1994;6(2):181-214. 15
9. Fujimaki R, Morinaga S. Factorized Asymptotic Bayesian Inference for Mixture 16
Modeling. In: Neil DL, Mark G, editors. Proceedings of the Fifteenth International 17
Conference on Artificial Intelligence and Statistics; Proceedings of Machine Learning 18
36
Research: PMLR; 2012. p. 400--8. 1
10. Eto R, Fujimaki R, Morinaga S, Tamano H. Fully-Automatic Bayesian Piecewise 2
Sparse Linear Models. Jmlr Worksh Conf Pro. 2014;33:238-46. 3
11. Pedregosa F, Varoquaux G, Gramfort A, Michel V, Thirion B, Grisel O, et al. 4
Scikit-learn: Machine Learning in Python. J Mach Learn Res. 2011;12:2825-30. 5
12. Gibbons LE, Carle AC, Mackin RS, Harvey D, Mukherjee S, Insel P, et al. A 6
composite score for executive functioning, validated in Alzheimer's Disease 7
Neuroimaging Initiative (ADNI) participants with baseline mild cognitive impairment. 8
Brain Imaging Behav. 2012;6(4):517-27. 9
13. Crane PK, Carle A, Gibbons LE, Insel P, Mackin RS, Gross A, et al. 10
Development and assessment of a composite score for memory in the Alzheimer's Disease 11
Neuroimaging Initiative (ADNI). Brain Imaging Behav. 2012;6(4):502-16. 12
14. Tibshirani R, Walther G, Hastie T. Estimating the number of clusters in a data 13
set via the gap statistic. J Roy Stat Soc B. 2001;63:411-23. 14
15. Zhou Y, Zhou B, Pache L, Chang M, Khodabakhshi AH, Tanaseichuk O, et al. 15
Metascape provides a biologist-oriented resource for the analysis of systems-level 16
datasets. Nat Commun. 2019;10(1):1523. 17
16. Giegerich AK, Kuchler L, Sha LK, Knape T, Heide H, Wittig I, et al. Autophagy-18
37
dependent PELI3 degradation inhibits proinflammatory IL1B expression. Autophagy. 1
2014;10(11):1937-52. 2
17. Lee JP, Foote A, Fan H, Peral de Castro C, Lang T, Jones SA, et al. Loss of 3
autophagy enhances MIF/macrophage migration inhibitory factor release by 4
macrophages. Autophagy. 2016;12(6):907-16. 5
18. Bi X, Yong AP, Zhou J, Ribak CE, Lynch G. Rapid induction of intraneuronal 6
neurofibrillary tangles in apolipoprotein E-deficient mice. Proc Natl Acad Sci U S A. 7
2001;98(15):8832-7. 8
19. DeMattos RB, Cirrito JR, Parsadanian M, May PC, O'Dell MA, Taylor JW, et al. 9
ApoE and clusterin cooperatively suppress Abeta levels and deposition: evidence that 10
ApoE regulates extracellular Abeta metabolism in vivo. Neuron. 2004;41(2):193-202. 11
20. Tiraboschi P, Hansen LA, Masliah E, Alford M, Thal LJ, Corey-Bloom J. Impact 12
of APOE genotype on neuropathologic and neurochemical markers of Alzheimer disease. 13
Neurology. 2004;62(11):1977-83. 14
21. Small SA, Duff K. Linking Abeta and tau in late-onset Alzheimer's disease: a 15
dual pathway hypothesis. Neuron. 2008;60(4):534-42. 16
22. Jack CR, Jr., Bennett DA, Blennow K, Carrillo MC, Feldman HH, Frisoni GB, 17
et al. A/T/N: An unbiased descriptive classification scheme for Alzheimer disease 18

38
biomarkers. Neurology. 2016;87(5):539-47. 1
23. Altomare D, de Wilde A, Ossenkoppele R, Pelkmans W, Bouwman F, Groot C, 2
et al. Applying the ATN scheme in a memory clinic population: The ABIDE project. 3
Neurology. 2019;93(17):e1635-e46. 4
24. Ebenau JL, Timmers T, Wesselman LMP, Verberk IMW, Verfaillie SCJ, Slot 5
RER, et al. ATN classification and clinical progression in subjective cognitive decline: 6
The SCIENCe project. Neurology. 2020;95(1):e46-e58. 7
25. Jack CR, Jr., Knopman DS, Weigand SD, Wiste HJ, Vemuri P, Lowe V, et al. An 8
operational approach to National Institute on Aging-Alzheimer's Association criteria for 9
preclinical Alzheimer disease. Ann Neurol. 2012;71(6):765-75. 10
26. Nelson PT, Dickson DW, Trojanowski JQ, Jack CR, Boyle PA, Arfanakis K, et 11
al. Limbic-predominant age-related TDP-43 encephalopathy (LATE): consensus working 12
group report. Brain. 2019;142(6):1503-27. 13
27. Sutphen CL, McCue L, Herries EM, Xiong C, Ladenson JH, Holtzman DM, et 14
al. Longitudinal decreases in multiple cerebrospinal fluid biomarkers of neuronal injury 15
in symptomatic late onset Alzheimer's disease. Alzheimers Dement. 2018;14(7):869-79. 16
28. Zhang H, Ng KP, Therriault J, Kang MS, Pascoal TA, Rosa-Neto P, et al. 17
Cerebrospinal fluid phosphorylated tau, visinin-like protein-1, and chitinase-3-like 18
39
protein 1 in mild cognitive impairment and Alzheimer's disease. Transl Neurodegener. 1
2018;7:23. 2
29. Kester MI, Teunissen CE, Sutphen C, Herries EM, Ladenson JH, Xiong C, et al. 3
Cerebrospinal fluid VILIP-1 and YKL-40, candidate biomarkers to diagnose, predict and 4
monitor Alzheimer's disease in a memory clinic cohort. Alzheimers Res Ther. 5
2015;7(1):59. 6
30. Wang S, Zhang J, Pan T. APOE ε4 is associated with higher levels of CSF SNAP-7
25 in prodromal Alzheimer's disease. Neurosci Lett. 2018;685:109-13. 8
31. Wang L, Zhang M, Wang Q, Jiang X, Li K, Liu J. APOE ε4 Allele Is Associated 9
with Elevated Levels of CSF VILIP-1 in Preclinical Alzheimer's Disease. Neuropsychiatr 10
Dis Treat. 2020;16:923-31. 11
32. McManus RM, Heneka MT. Role of neuroinflammation in neurodegeneration: 12
new insights. Alzheimers Res Ther. 2017;9(1):14. 13
33. Forrester JV, McMenamin PG, Dando SJ. CNS infection and immune privilege. 14
Nat Rev Neurosci. 2018;19(11):655-71. 15
34. Takeda S, Sato N, Ikimura K, Nishino H, Rakugi H, Morishita R. Increased 16
blood-brain barrier vulnerability to systemic inflammation in an Alzheimer disease mouse 17
model. Neurobiol Aging. 2013;34(8):2064-70. 18
40
35. Nelson AR, Sweeney MD, Sagare AP, Zlokovic BV. Neurovascular dysfunction 1
and neurodegeneration in dementia and Alzheimer's disease. Biochim Biophys Acta. 2
2016;1862(5):887-900. 3
36. Hoogland IC, Houbolt C, van Westerloo DJ, van Gool WA, van de Beek D. 4
Systemic inflammation and microglial activation: systematic review of animal 5
experiments. J Neuroinflammation. 2015;12:114. 6
37. Goldeck D, Witkowski JM, Fülop T, Pawelec G. Peripheral Immune Signatures 7
in Alzheimer Disease. Curr Alzheimer Res. 2016;13(7):739-49. 8
38. Deretic V, Saitoh T, Akira S. Autophagy in infection, inflammation and immunity. 9
Nat Rev Immunol. 2013;13(10):722-37. 10
39. Uddin MS, Stachowiak A, Mamun AA, Tzvetkov NT, Takeda S, Atanasov AG, 11
et al. Autophagy and Alzheimer's Disease: From Molecular Mechanisms to Therapeutic 12
Implications. Front Aging Neurosci. 2018;10:04. 13
14
Figure legends 15
16
Figure 1. Characterization of MCI subtypes. 17
(A) Decision tree model for prediction of conversion to AD dementia. The dotted lines 18
41
represent each threshold. (B, C) Conversion rates over time in the predicted ADs and CNs 1
(p = 3.15e-35 in the log-rank test) (B) and in each subtype (p = 4.62e-15 in the log-rank 2
test) (C). (D) Conversion rates within three years in each MCI subtype. 3
4
Figure 2. Features in each subtype. 5
(A) CSF Aβ(1-42) level, (B) CSF tTau level, (C) CSF pTau level, (D) the tTau/Aβ(1-42) 6
ratio, (E) the pTau/Aβ(1-42) ratio, (F) the normalized ventricular volume, (G) the 7
normalized hippocampal volume, (H) the normalized whole-brain volume, (I) the 8
normalized entorhinal cortex volume, (J) the normalized WMH volume, (K) age, and (L) 9
APOE ε4 alleles. The blue and red lines indicate the cut-off values based on the CN 10
subjects and the AD dementia patients. Points below the blue line or above the red line 11
represent levels similar to those in AD dementia patients. 12
13
Figure 3. Spot matrix showing the proportions of individuals with features similar 14
to those of AD dementia patients. 15
The spot size represents the proportion of individuals with values exceeding the cut-off 16
value. Yellow indicates a value greater than 50%. 17
18
42
Figure 4. Cognitive functions in each subtype. 1
(A, D, G, J) Comparisons of cognitive functions at baseline among subtypes. The Tukey’s 2
HSD test was used to verify the differences in scores between two subtypes and was 3
applied as a multiple comparison procedure. (B, E, H, K) Longitudinal changes in 4
cognitive functions by subtype. Each trajectory indicates the linear regression lines. The 5
error bars represent the 95% confidence intervals. (C, F, I, L) Temporal cognitive decline 6
compared with subtype2. The bar plots represent the interactions between subtypes and 7
follow-up time, as estimated by the LMM with subtype 2 as a reference. *p < 0.05, **p 8
< 0.01, ***p < 0.001. 9
10
Figure 5. Levels of the CSF neuronal and synaptic injury markers VILIP-1 (A), 11
SNAP-25 (B), and NGRN (C) and the inflammatory response marker YKL-40 (D). 12
The Tukey’s HSD test was used to verify the differences in CSF levels between two 13
subtypes and was applied as a multiple comparison procedure. *p < 0.05, **p < 0.01, 14
***p < 0.001. 15
16
Figure 6. Gene expression analysis using peripheral blood samples. 17
(A) Heatmap and hierarchical clustering of 1,080 DEGs. The colour represents the 18
43
normalized gene expression level (z-score). Each row represents each gene. Clustering 1
was performed via Ward's method. The number of clusters was set to six based on the gap 2
statistic (Figure S4). (B) Gene expression profiles of the six clusters. The black and red 3
polygonal lines represent the z-scores of the genes and the averaged z-scores, respectively. 4
(C) Gene functional enrichment analysis of the genes in each cluster. Each bar shows the 5
significances of the enriched terms for the genes in each cluster. (D, E) Parent terms (D) 6
and immune system pathways (E) of the genes that were correlated with the inflammation 7
marker YKL-40. The bars in (E) indicate the enrichment of terms with the parent term 8
"Immune system process". 9
10
11
12
CN MCI AD
N 305 480 156
Age in years, mean ± s.d. 73.7 ± 5.73 71.8 ± 7.42 74 ± 8.32
Sex (Female:Male) 162:143 200:280 69:87
Education year, mean ± s.d. 16.3 ± 2.64 16.0 ± 2.78 15.5 ± 2.67
CSF Aβ(1-42) (pg/mL), mean ± s.d. 1226.0 ± 441.4 964.2 ± 436.8 644.6 ± 286.9
CSF tTau (pg/mL), mean ± s.d. 238.4 ± 89.6 287.4 ± 137.2 373.8 ± 138.6
CSF pTau (pg/mL), mean ± s.d. 21.9 ± 9.24 27.9 ± 15.2 37.3 ± 14.7
tTau / Aβ(1-42), mean ± s.d. 2.33e-01 ± 1.57e-01 3.86e-01 ± 2.90e-01 6.51e-01 ± 3.07e-01
pTau / Aβ(1-42), mean ± s.d. 2.19e-02 ± 1.71e-02 3.82e-02 ± 3.13e-02 6.52e-02 ± 3.18e-02
Whole brain volume / ICV, mean ± s.d. 6.94e-01 ± 4.40e-02 6.83e-01 ± 5.00e-02 6.45e-01 ± 4.21e-02
Hippocampus volume / ICV, mean ± s.d. 5.01e-03 ± 5.88e-04 4.50e-03 ± 8.19e-04 3.84e-03 ± 6.58e-04
Ventricle volume / ICV, mean ± s.d. 2.14e-02 ± 1.03e-02 2.45e-02 ± 1.29e-02 3.05e-02 ± 1.16e-02
Entorhinal cortex volume / ICV, mean ± s.d. 2.58e-03 ± 3.77e-04 2.33e-03 ± 4.79e-04 1.86e-03 ± 4.35e-04
WMH volume, mean ± s.d. 4.03 ± 7.49 5.02 ± 8.44 4.75 ± 6.73
APOE ε4 carriers (%) 81 (26.6%) 239 (49.8%) 108 (69.2%)
Table1. The summary of samples
44
1
2
3
HML CART
Sensitivity 0.751 ± 0.027 0.695 ± 0.054
Specificity 0.810 ± 0.020 0.787 ± 0.023
Precision 0.682 ± 0.022 0.638 ± 0.016
Accuracy 0.789 ± 0.014 0.755 ± 0.013
# leaf nodes 3.8 ± 1.095 19 ± 4.301
Table2. Test performances of HML and CART
Subtype 1 Subtype 2 Subtype 3 Subtype 4 Subtype 5
N (subjects with follow-up ≥ 3 years) 68 (57) 173 (143) 188 (155) 14 (13) 37 (28)
Age in years, mean ± s.d. 73.9 ± 8.16 71.8 ± 7.47 71.4 ± 7.25 66 ± 6.07 72 ± 5.76
Sex (Female:Male) 25:43 72:101 82:106 9:5 12:25
Education year, mean ± s.d. 15.8 ± 2.93 16.3 ± 2.66 15.8 ± 2.82 17 ± 2.83 16.1 ± 2.75
CSF Aβ(1-42) (pg/mL), mean ± s.d. 923.3 ± 382.3 1211 ± 425.1 852.1 ± 388.3 713.9 ± 254.5 549.7 ± 184.9
CSF tTau (pg/mL), mean ± s.d. 273.2 ± 145.3 235.8 ± 98.54 323.7 ± 144.6 416 ± 212.6 321.7 ± 111.2
CSF pTau (pg/mL), mean ± s.d. 25.9 ± 16.1 22.1 ± 11.1 32 ± 15.7 42.6 ± 24.3 31.6 ± 11.9
tTau / Aβ(1-42), mean ± s.d. 3.53e-01 ± 2.35e-01 2.37e-01 ± 1.79e-01 4.66e-01 ± 3.01e-01 6.95e-01 ± 5.51e-01 6.25e-01 ± 2.16e-01
pTau / Aβ(1-42), mean ± s.d. 3.4e-02 ± 2.53e-02 2.29e-02 ± 2e-02 4.68e-02 ± 3.26e-02 7.21e-02 ± 6.21e-02 6.13e-02 ± 2.18e-02
Whole brain volume / ICV, mean ± s.d. 6.49e-01 ± 4.02e-02 6.99e-01 ± 4.77e-02 6.81e-01 ± 5e-02 7.24e-01 ± 3.13e-02 6.72e-01 ± 4.18e-02
Hippocampus volume / ICV, mean ± s.d. 3.83e-03 ± 6.33e-04 4.87e-03 ± 6.81e-04 4.49e-03 ± 8.23e-04 4.91e-03 ± 8.1e-04 3.87e-03 ± 5.1e-04
Ventricle volume / ICV, mean ± s.d. 3.26e-02 ± 1.39e-02 2.21e-02 ± 1.11e-02 2.44e-02 ± 1.36e-02 1.18e-02 ± 2.49e-03 2.61e-02 ± 8.25e-03
Entorhinal cortex volume / ICV, mean ± s.d. 1.83e-03 ± 2.85e-04 2.59e-03 ± 2.95e-04 2.3e-03 ± 5.01e-04 2.63e-03 ± 5.32e-04 2.05e-03 ± 4.01e-04
WMH volume, mean ± s.d. 5.78 ± 9.68 5.48 ± 8.2 4.29 ± 8.47 4.71 ± 6.38 5.22 ± 7.63
APOE ε4 carriers (%) 0 (0%) 0 (0%) 188 (100%) 14 (100%) 37 (100%)
Table 3. The summary of each subtype.
Figures
Figure 1
Spot matrix showing the proportions of individuals with features similar to those of AD dementiapatients. The spot size represents the proportion of individuals with values exceeding the cut-off value.Yellow indicates a value greater than 50%.
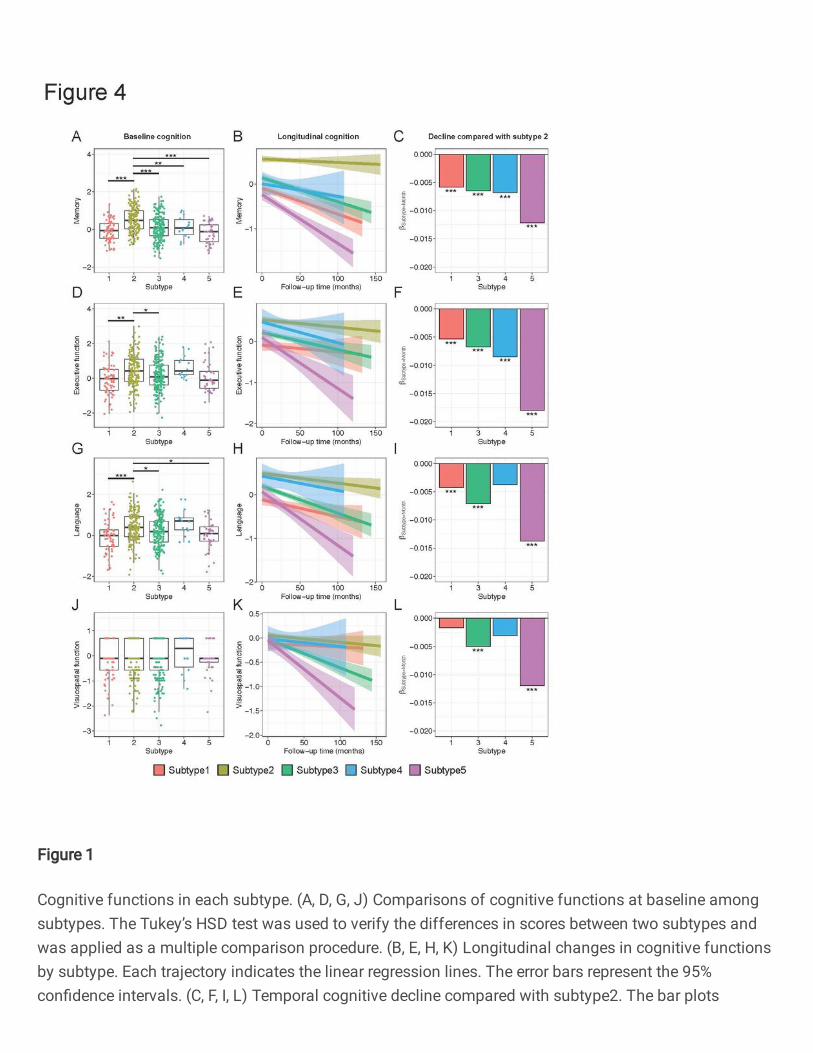
Figure 1
Cognitive functions in each subtype. (A, D, G, J) Comparisons of cognitive functions at baseline amongsubtypes. The Tukey’s HSD test was used to verify the differences in scores between two subtypes andwas applied as a multiple comparison procedure. (B, E, H, K) Longitudinal changes in cognitive functionsby subtype. Each trajectory indicates the linear regression lines. The error bars represent the 95%con�dence intervals. (C, F, I, L) Temporal cognitive decline compared with subtype2. The bar plots
represent the interactions between subtypes and follow-up time, as estimated by the LMM with subtype 2as a reference. *p < 0.05, **p < 0.01, ***p < 0.001.
Figure 1
Characterization of MCI subtypes. (A) Decision tree model for prediction of conversion to AD dementia.The dotted lines represent each threshold. (B, C) Conversion rates over time in the predicted ADs and CNs
(p = 3.15e-35 in the log-rank test) (B) and in each subtype (p = 4.62e-15 in the log-rank test) (C). (D)Conversion rates within three years in each MCI subtype.
Figure 1
Features in each subtype. (A) CSF Aβ(1-42) level, (B) CSF tTau level, (C) CSF pTau level, (D) thetTau/Aβ(1-42) ratio, (E) the pTau/Aβ(1-42) ratio, (F) the normalized ventricular volume, (G) the normalizedhippocampal volume, (H) the normalized whole-brain volume, (I) the normalized entorhinal cortex volume,
(J) the normalized WMH volume, (K) age, and (L) APOE ε4 alleles. The blue and red lines indicate the cut-off values based on the CN subjects and the AD dementia patients. Points below the blue line or abovethe red line represent levels similar to those in AD dementia patients.
Figure 1
Levels of the CSF neuronal and synaptic injury markers VILIP-1 (A), SNAP-25 (B), and NGRN (C) and thein�ammatory response marker YKL-40 (D). The Tukey’s HSD test was used to verify the differences inCSF levels between two subtypes and was applied as a multiple comparison procedure. *p < 0.05, **p <0.01, ***p < 0.001.
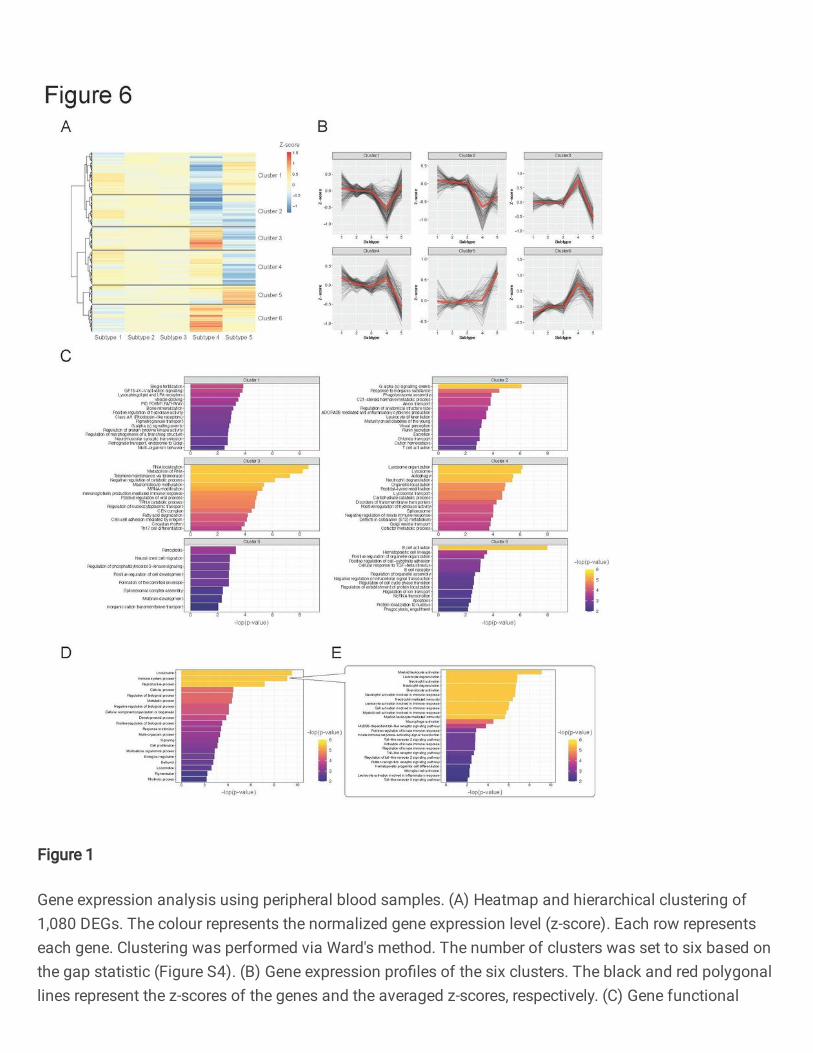
Figure 1
Gene expression analysis using peripheral blood samples. (A) Heatmap and hierarchical clustering of1,080 DEGs. The colour represents the normalized gene expression level (z-score). Each row representseach gene. Clustering was performed via Ward's method. The number of clusters was set to six based onthe gap statistic (Figure S4). (B) Gene expression pro�les of the six clusters. The black and red polygonallines represent the z-scores of the genes and the averaged z-scores, respectively. (C) Gene functional

enrichment analysis of the genes in each cluster. Each bar shows the signi�cances of the enriched termsfor the genes in each cluster. (D, E) Parent terms (D) and immune system pathways (E) of the genes thatwere correlated with the in�ammation marker YKL-40. The bars in (E) indicate the enrichment of termswith the parent term "Immune system process".
Supplementary Files
This is a list of supplementary �les associated with this preprint. Click to download.
Supplementaryinformation.docx