Embed Size (px)
Citation preview

HEMATOPOIESIS AND STEM CELLS
Identification of novel regulators of hematopoietic stem cell development throughrefinement of stem cell localization and expression profilingMaria I. Mascarenhas,1 Aimee Parker,1 Elaine Dzierzak,2 and Katrin Ottersbach1
1Department of Haematology, Cambridge Institute for Medical Research, University of Cambridge, Cambridge, United Kingdom; and 2Erasmus Stem CellInstitute, Department of Cell Biology, Erasmus Medical Center, Rotterdam, The Netherlands
The first adult-repopulating hematopoi-etic stem cells (HSCs) are detectedstarting at day 10.5 of gestation in theaorta-gonads-mesonephros (AGM) re-gion of the mouse embryo. Despite theimportance of the AGM in initiating HSCproduction, very little is currently knownabout the regulators that control HSCemergence in this region. We have there-fore further defined the location of HSCsin the AGM and incorporated this informa-tion into a spatial and temporal compara-
tive gene expression analysis of the AGM.The comparisons included gene expres-sion profiling (1) in the newly identifiedHSC-containing region compared with theregion devoid of HSCs, (2) before andafter HSC emergence in the AGM microen-vironment, and (3) on populations en-riched for HSCs and their putative precur-sors. Two genes found to be up-regulatedat the time and place where HSCs are firstdetected, the cyclin-dependent kinase in-hibitor p57Kip2/Cdkn1c and the insulin-
like growth factor 2, were chosen for fur-ther analysis. We demonstrate here thatthey play a novel role in AGM hematopoi-esis. Interestingly, many genes involvedin the development of the tissues sur-rounding the dorsal aorta are also up-regulated during HSC emergence, sug-gesting that the regulation of HSCgeneration occurs in coordination withthe development of other organs. (Blood.2009;114:4645-4653)
Introduction
Hematopoietic stem cells (HSCs) are at the center of thehematopoietic system. Their proliferative and multilineagedifferentiation potential endows them with the capacity toregenerate every blood cell type throughout the entire life of aperson. For this reason, they are subject to tight regulatoryprocesses to ensure an adequate supply of blood cells withoutthe risk of HSC depletion or the development of blood-relatedmalignancies.
Insight into the basic mechanisms of HSC regulation can begained from the study of how these cells are first generated andexpanded during development. The first cells that display adultHSC characteristics in transplantation assays are detected atembryonic day (E) 10.5 in a region of the embryo that includesthe developing dorsal aorta, gonads, and mesonephros (AGMregion).1 Subdissections have localized this first HSC activity tothe dorsal aorta and the associated vitelline and umbilicalvessels.2 Subsequently, adult HSC-type cells are also found inthe yolk sac and the placenta.1,3,4 It is currently unclear whyHSCs are harbored in multiple sites during development andwhether they have multiple origins. After E12, HSC numbersstart declining in the AGM as the fetal liver (FL) becomescolonized and an adult-type hematopoietic system is furtherestablished (reviewed in Dzierzak and Speck5).
Little is known about how HSCs are first generated in the AGM.In particular, the identification of the direct precursors of HSCs, thedefinition of the components of the regulatory microenvironment,and the discovery of cell-intrinsic regulators are issues that haveonly recently started to be addressed. There is now good evidenceto suggest that HSCs in the AGM are either of endothelial origin or
transit through an endothelial-like state during their generation.6,7
These hemogenic endothelial cells are thought to give rise tointra-aortic clusters of cells, which appear to be the first sign ofHSC emergence in the dorsal aorta (reviewed in Ottersbach andDzierzak8). Other reports suggest that there are HSC precursors inthe ventral mesenchyme underneath the aorta that can give rise toHSCs, possibly via an endothelial-like intermediate.9,10 Indeed,these suggestions of either a mesenchymal or endothelial origin forhematopoietic cells are not necessarily mutually exclusive. Rather,as supported from recent studies using the embryonic stem cellsystem, they represent sequential steps in the same pathway.11
Even less is known about the architecture of the HSC regulatorymicroenvironment in the AGM. Comparison of the gene repertoireexpressed by AGM-derived supportive and nonsupportive stromalcell lines has led to the identification of novel HSC regulators.12-14
Although expression studies on these cell lines provide someinformation into the hematopoietic supportive microenvironment,the gene repertoire of primary AGM tissue has not been examined.
With the aim to identify novel in vivo regulators of AGMhematopoiesis, we analyzed and compared the gene expressionprofiles of 3 different spatially and temporally isolated AGMprimary tissue/cell preparations: (1) regions within the aorta that door do not contain HSCs, (2) whole dorsal aortae before and afterHSC emergence, and (3) cell populations enriched for HSCs andtheir putative precursors. We present here the list of up- anddown-regulated genes and functional data suggesting that the cellcycle regulator p57Kip2 (Cdkn1c) and the growth factor insulin-like growth factor 2 (Igf2) are important regulators of AGMhematopoiesis.
Submitted June 26, 2009; accepted September 6, 2009. Prepublished onlineas Blood First Edition paper, September 30, 2009; DOI 10.1182/blood-2009-06-230037.
The online version of this article contains a data supplement.
The publication costs of this article were defrayed in part by page chargepayment. Therefore, and solely to indicate this fact, this article is herebymarked ‘‘advertisement’’ in accordance with 18 USC section 1734.
© 2009 by The American Society of Hematology
4645BLOOD, 19 NOVEMBER 2009 � VOLUME 114, NUMBER 21
For personal use only.on January 4, 2019. by guest www.bloodjournal.orgFrom
Methods
Mice and tissue preparations
To obtain embryos, timed matings were set up between male wild-type(C57BL/10 � CBA)F1, Ly-6A GFP,15 or line 72 human �-globin16 trans-genic and wild-type (C57BL/10 � CBA)F1 females, and between femalep57Kip2�/�17 and C57BL/6 males homozygous for the Ly5.1 isoform. Theday of vaginal plug observation was considered E0. On the appropriate dayof gestation, females were killed and the embryos removed for dissectionsor morphologic analyses. All animals were housed according to institutionalguidelines and experiments complied with the animal welfare laws. Animalstudies were approved by the United Kingdom Home Office.
Long-term repopulation assays
Embryonic tissues were dissociated by collagenase treatment as describedpreviously.18 Single-cell suspensions were coinjected intravenously with2 � 105 spleen cells into irradiated mice (split dose of 9 Gy). Donor cellcontribution to the peripheral blood was determined at 1 and 4 months aftertransplantation and recipients were considered positive when the donormarker showed at least 10% contribution to the peripheral blood bysemiquantitative polymerase chain reaction (PCR) or 5% by Ly5 isoform-specific fluorescence-activated cell sorting (FACS) analysis.
Gene expression analysis
Embryonic tissues were dissected, pooled, and dissociated directly in TrizolReagent (Invitrogen), or Ly-6A green fluorescent protein–positive (GFP�)cells were sorted from single-cell suspensions on a FACSVantage (BDBiosciences) directly into Trizol Reagent (total of 17 000 GFP� from E9aortae and 48 000 GFP� cells from E11 aortae). Total RNA was isolatedaccording to the manufacturer’s instructions, DNase treated, and mRNAamplified by either 1 round (for unsorted embryonic tissues) or 2 rounds(for sorted cell populations) of linear T7-mediated amplification asdescribed previously.19 Amplified RNA probes were labeled with eithercyanin 3 (Cy3)– or Cy5-conjugated deoxyuridine triphosphate nucleotidesduring the reverse-transcription reaction and labeled probes hybridizedovernight at 42°C to 15K mouse cDNA arrays obtained from the Nether-lands Cancer Institute. Dye-swap and self-self hybridization experimentswere included as controls. Microarrays were scanned with a ScanArrayExpress Microarray Scanner (PerkinElmer) and spot signals quantifiedusing the Imagene 5 software (Biodiscovery). Normalization, analysis ofvariance, and K means clustering were performed using the SpotfireDecision Site software (TIBCO Spotfire). Detailed descriptions of theprotocols and the raw and normalized data are deposited at the EuropeanBioinformatics Institute’s microarray data depository ArrayExpress (http://www.ebi.ac.uk/microarray-as/ae) under the accession number E-TABM-659.20 Biologic processes that are enriched in the total up-regulated ordown-regulated population were determined using the freely accessiblesoftware DAVID (National Institute of Allergy and Infectious Diseases,http://david.abcc.ncifcrf.gov/summary.jsp) with all of the genes printed onthe array serving as background.
RT-PCR, in situ hybridization, and immunohistochemistry
For the examination of the expression of Igf2 and its receptors in thedifferent embryonic tissues by reverse-transcription–PCR, previously pub-lished primer sequences were used.21 Mouse �-actin (Actb) primer se-quences are forward: CCTGAACCCTAAGGCCAACCG, reverse: GCT-CATAGCTCTTCTCCAGGG. DNA fragments for the synthesis ofriboprobes for in situ hybridization experiments were generated by RT-PCRfrom E11 AGM cDNA using the following primers: Th, forward: ATTG-GAGGCTGTGGTATTCG, reverse: GGGTAGCATAGAGGCCCTTC;Cryab, forward: AGCTGCTGCTGAAGGAGTTG, reverse: CCAGACAC-CTGTTTCCTTGG; p57Kip2, forward: CTGACCTCAGACCCAATTCC,reverse: GATGCCCAGCAAGTTCTCTC. The Igf2 riboprobe was gener-ated from a plasmid containing an Igf2 fragment encompassing nucleo-
tides 1749-2169 (accession number NM 010514).22 Riboprobe synthesis, insitu hybridization experiments, and immunohistochemistry with antibodiesagainst CD34 (BD Biosciences) and p57Kip2 (Santa Cruz Biotechnology)were carried out as previously described.4
AGM explant cultures and colony-forming assays
E11 AGMs were dissected and cultured at the air/liquid interface in M5300myelocult (StemCell Technologies) supplemented with 10�5 M hydrocorti-sone (Sigma-Aldrich) in the presence or absence of recombinant mouseIgf2 (R&D Systems) at the indicated concentrations. After 3 days, AGMswere pooled, dissociated by collagenase treatment, and plated in triplicateas 10 000, 50 000, and 100 000 cells/mL in M3434 methylcellulose me-dium (StemCell Technologies). Colonies were scored after 7 days. Freshlydissected, uncultured E11 AGMs were also dissociated and plated inmethylcellulose medium for comparison. As there was some variation intotal colony numbers between experiments, we converted the colonycomposition into percentages for each individual experiment and calculatedthe average, standard deviation, and P values from those individualpercentages.
Results
HSCs are enriched in the middle third of the E11 dorsal aorta
To facilitate the identification of new regulators, our initial aim wasto further define the region within the AGM where HSCs arelocated. Upon examination of sections prepared from E11 Ly-6AGFP transgenic embryos, which express the green fluorescentprotein (GFP) in all embryonic HSCs,4,15 it was noted thatintra-aortic clusters were particularly abundant in the segment ofthe dorsal aorta adjacent to where the vitelline artery joins thedorsal aorta (Figure 1A clusters marked with asterisks; vitellineartery indicated by white arrow). Therefore, the aorta was cut into3 equal parts: rostral (r), middle with the vitelline artery maintainedfor orientation (m) and caudal (c; Figure 1B). The caudal androstral parts were pooled (c � r). The vitelline artery was removedfrom the middle region and the HSC activity in the c � r andm samples was determined by transplantation assay. As expectedfrom the distribution of hematopoietic clusters, HSCs were foundexclusively in the middle region of the aorta (Figure 1C). Theexpression profile of the caudal and rostral part was then comparedwith that of the HSC-rich middle region of the dorsal aorta.
Because of possible sensitivity issues and to add a temporalcomponent to the expression analysis, 2 other sample sets werealso prepared. The first sample set consisted of dorsal aortae fromE9/E10 embryos (25-30 somite pairs [SPs]), when no HSCs can yetbe detected by direct transplantation into adult recipients, and fromE11 embryos (45-52 SPs), after HSCs have emerged in that tissue.2
Aortae were dissected with the immediate surrounding mesen-chyme and their expression profiles compared. In this approach,gene expression changes in pre-HSCs/HSCs as well as theirmicroenvironment can be monitored.
The second temporal sample set was designed to focusspecifically on the expression changes that take place aspre-HSCs mature to become adult-repopulating HSCs. Enrichedpopulations of HSCs and their putative precursors were isolatedfrom Ly-6A GFP transgenic embryos. At E11, GFP� cells can bedetected in numerous endothelial cells of the dorsal aorta, wherethey are preferentially located on the ventral and lateral sides(Figure 1A). Individual GFP� cells can also be found in thecirculation and within the intra-aortic clusters. Endothelial cellsof the vitelline artery are also highly GFP�. Although no HSCactivity can be detected in the E9 aorta by direct transplantation
4646 MASCARENHAS et al BLOOD, 19 NOVEMBER 2009 � VOLUME 114, NUMBER 21
For personal use only.on January 4, 2019. by guest www.bloodjournal.orgFrom

into adult recipients, a limited number of Ly-6A GFP� cells canalready be observed. These are initially restricted to the ventralside (data not shown), where HSC activity is thought tooriginate. The number of GFP� cells increases from 0.7% at E9to 3% in the E11 aorta, suggesting a direct lineage relationship(pre-HSCs3 HSCs) between the Ly-6A GFP� cells at these2 time points. Ly-6A GFP� cells were sorted from E9 and E11aortae for gene expression analysis.
The E11 aorta shows an up-regulation in genes involved inseveral different developmental processes
Probes from the 3 different sample sets were hybridized to 15Kmouse cDNA arrays. The cDNA library that is spotted on thesearrays was constructed from whole embryos and tissues fromdifferent stages and is therefore particularly enriched in developmen-tally relevant genes.23 Differentially expressed genes with aP value of .01 or less were identified through analysis of varianceusing the Spotfire Decision Site software package. The number ofgenes found to be “up-regulated” (ie, more highly expressed in E11whole aortae [WA], E11 Ly-6A GFP� cells, and in the middleregion of the E11 aorta [mAo]) and “down-regulated” (ie, morehighly expressed in the E9 aorta, E9 Ly-6A GFP� cells, and in therostral and caudal parts of the E11 aorta) is summarized in the2 Venn diagrams in Figure 2, and the individual genes are listed insupplemental Table 1 (available on the Blood website; see theSupplemental Materials link at the top of the online article). Wealso analyzed the data with the limma software package (Walterand Eliza Hall Institute of Medical Research, http://bioinf.wehi.edu.au/limma)24 and identified a very similar set of genes(data not shown). More genes were found to be differentially
expressed in the 2 temporal sample sets (E11WA and E11GFP)compared with the expression analysis of the different parts of theE11 aorta (E11mAo), and the overlap between the 2 temporalsample sets was approximately 30%. The genes found to becommonly up- or down-regulated in all 3 comparisons are listed inTable 1. The proteins encoded by the commonly up-regulated geneshave a variety of different biologic functions and include, forexample, 2 enzymes (Them4 and Rnaset2b), 2 ATPase subunits, asmall heat shock protein (Cryab), a translation initiation factor(Eif3f), and 2 cell cycle regulators (Ccnd1 and p57Kip2/Cdkn1c).Approximately one-third of the commonly down-regulated genescode for proteins that are involved in gene regulation.
The functional annotation enrichment analysis tool from thefreely accessible software DAVID was used to determine whichbiologic processes are enriched in the total up-regulated anddown-regulated gene populations. Strikingly, the majority ofbiologic functions enriched in the down-regulated population arepart of nucleic acid metabolism, DNA replication, transcription,translation, and further downstream steps of protein folding andposttranslational modifications (supplemental Figure 1). This maybe due to many cells and tissues reaching their final differentiatedstate as development proceeds. Enriched in the up-regulatedpopulation are processes associated with development and morpho-genesis such as cell death, adhesion, and migration (Figure 3).Apart from these more general developmental processes, anenrichment for genes specific to tissues known to develop in andaround the dorsal aorta was found. This includes vascular develop-ment, muscle development, neurogenesis, and, most importantly,hematopoiesis.
Within the list of up-regulated genes, we looked for thosepreviously implicated in hematopoiesis (supplemental Table 2).Included were genes known to be important for developmentalhematopoiesis, such as Runx1, Gata1, and Gata3.25-28 Surprisingly,we also identified genes such as Foxo3,29 Id1,30,31 and Mll532,33 thathave been implicated as yet only in adult hematopoietic processes.It will be interesting to determine whether these genes also play arole in AGM hematopoiesis. Among the genes commonly up-regulated in the 2 temporal sample sets were many globin-codinggenes (supplemental Table 1).
p57Kip2 knockout mice display prolonged HSC activity in theAGM
To validate that regulators of AGM hematopoiesis were indeedbeing picked up by the expression screens, one of the genescommonly up-regulated in all 3 approaches (Table 1) was chosen
Figure 1. HSC localization. (A) Transverse cryosection of an E11 Ly-6A GFP� embryo (GFP in green) costained for the endothelial marker CD34 (red, Cy5; mounted withVectashield; Vector Laboratories) showing the dorsal aorta with intra-aortic clusters marked by asterisks and the joining vitelline artery indicated by a white arrow. Ventral,down. DA indicates dorsal aorta; and VA, vitelline artery. Pictures were taken on a Zeiss LSM510NLO/FCS confocal microscope with a 40�/1.3 NA objective and images wereanalyzed with Zeiss LSM image software (both from Carl Zeiss BV). (B) Subdissection of an embryonic day (E) 11 dorsal aorta. Ventral, left; rostral, top. r indicates rostral; m,middle; and c, caudal. Aortae were dissected under a Nikon SMZ800 dissection microscope (Nikon), pictures were taken with a Pixera Pro 150ES camera (Pixera), and imageswere analyzed with the Pixera Viewfinder software (Pixera). (C) Percentage of mice reconstituted with the different parts of the E11 dorsal aorta (rostral and caudal partspooled) after transplantation into irradiated mice. The number of pooled, transplanted tissues (ie, m or r � c) is indicated as embryo equivalent (ee) and the number ofrepopulated mice/number of mice injected is indicated for each bar.
Figure 2. Number of differentially expressed genes. Venn diagrams showing (left)the number of genes more highly expressed in the E11 whole aorta (E11WA), E11Ly-6A GFP� cells (E11GFP), and the middle part of the E11 aorta (E11mAo), and(right) the number of genes showing the opposite expression pattern.
AGM GENE EXPRESSION ANALYSIS 4647BLOOD, 19 NOVEMBER 2009 � VOLUME 114, NUMBER 21
For personal use only.on January 4, 2019. by guest www.bloodjournal.orgFrom

for further analysis. The cyclin-dependent kinase inhibitor p57Kip2was selected, as it is known to be highly expressed in adult HSCs,where it has been implicated in controlling cell proliferation.34,35
We first confirmed the expression pattern suggested by themicroarray experiments, using in situ hybridization (Figure 4).There was almost no expression of p57Kip2 in the mesenchymesurrounding the E9 dorsal aorta (Figure 4A). More rostrally,p57Kip2 expression was detected in the nephrogenic chords(Figure 4B), but these would have been removed during thedissection of the aorta. In contrast, strong p57Kip2 expression wasvisible in the mesenchyme surrounding the E11 dorsal aorta withhigher expression below the ventral aspect of the aorta (Figure 4C).In light of our finding that HSCs are enriched in the central part ofthe aorta, p57Kip2 expression was also analyzed along the lengthof the AGM. Compared with the middle region of the aorta (Figure4E), p57Kip2 expression was markedly reduced in the caudal androstral regions of the AGM (Figure 4D and F, respectively).Although most of the high expression is several cell layers removedfrom the aorta, some was observed just underneath the endotheliallayer (Figure 4G asterisk) and weaker staining was occasionallydetected in endothelial cells (Figure 4G arrows).
To determine a functional role for p57Kip2, knockout micewere analyzed for AGM HSC activity. p57Kip2 is an imprintedgene that is expressed solely from the maternal allele during mousedevelopment. Heterozygous embryos in which the maternallyderived allele is mutated (p57Kip2�/�m) are phenotypically indistin-guishable from homozygous knockout embryos.17 We confirmedthat there was no p57Kip2 expression in AGMs from p57Kip2�/�m
embryos (compare Figure 4I with H), and used embryos of thisgenotype in all subsequent experiments. The 2 related cyclin-
dependent kinase inhibitors p21Cip1 and p27Kip1 can, in sometissues, compensate for the absence of p57Kip2. We detected littleor no expression of p21Cip1 or p27Kip1 around the p57Kip2�/�
E11 aorta, and did not observe an up-regulation in their expressionwhen p57Kip2 was deleted (supplemental Figure 2).
When AGMs were dissected from E11 p57Kip2�/� andp57Kip2�/�m embryos and directly transplanted, no difference inreconstitution of irradiated adult recipients was found (Figure 4J).However, whereas HSC activity starts declining in wild-typeAGMs at E12.5, it remained high in p57Kip2�/�m AGMs. There areat least 3 possible explanations for this observation: (1) HSCsproliferate more in the absence of p57Kip2, (2) their migrationfrom the AGM is delayed in mutant embryos, or (3) they areproduced for a longer time in p57Kip2�/�m AGMs. As there was noincrease in HSCs at E11, it is unlikely that p57Kip2�/�m HSCsproliferate more. Others have demonstrated that cytoplasmicp57Kip2 can interact with the actin filament-regulating LIM-domain–containing, protein kinase and sequester it in the nucleus.36
This interaction is thought to result in increased cell motility. Weexamined the subcellular localization of p57Kip2 protein inwild-type AGM cells and found several cells in which p57Kip2 wasdetectable in the cytoplasm (Figure 4K white arrowheads).
Although p57Kip2 is known to be highly expressed in adultHSCs34 and our microarray expression analysis also detected it inHSC-enriched populations, the widespread high expression seen inE11 subaortic mesenchymal tissue suggests that it may play a rolein the regulatory microenvironment. Two cell lineages make up atleast part of this region: (1) myogenic progenitors that migratefrom the somites to the dorsal aorta to form the smooth musclelayer37 and (2) neural crest–derived sympathoadrenal precursors
Table 1. Genes differentially expressed in all 3 comparisons
GenBank ID22 Gene name Gene symbol Accession no.
Genes commonly up-regulated
BG062951 Eukaryotic translation initiation factor 3, subunit F Eif3f NM025344
BG069380 Thioesterase superfamily member 4 Them4 NM029431
BG071234 Formin binding protein 1 Fnbp1 NM019406
BG071313 Cyclin-dependent kinase inhibitor 1C (p57Kip2) Cdkn1c NM009876
BG075084 Crystallin, alpha B Cryab NM009964
BG075879 Proteolipid protein (myelin) 1 Plp1 NM011123
BG076602 Cut-like homeobox 1 (Cux1), transcript variant 2 Cux1 NM198602
BG077799 ATPase, H� transporting, lysosomal V0 subunit C Atp6v0c NM009729
BG078776 ATPase, H� transporting, lysosomal V0 subunit E Atp6v0e NM025272
BG079781 Ribonuclease T2B Rnaset2b NM026611
BG083088 Cyclin D1 Ccnd1 NM007631
BG086406 Angiotensin II receptor, type 2 Agtr2 NM007429
BG066003 Unknown
C78810 Unknown
Genes commonly down-regulated
BG063141 NudC domain containing 1 Nudcd1 NM026149
BG064241 Protein phosphatase 1, regulatory (inhibitor) subunit 15b Ppp1r15b NM133819
BG064278 Nucleosome assembly protein 1-like 1 Nap1l1 NM015781
BG065281 Glia maturation factor, beta Gmfb NM022023
BG067688 Heterogeneous nuclear ribonucleoprotein A3 Hnrnpa3 NM146130
BG069073 Transformer 2 alpha homolog (Drosophila) Tra2a NM198102
BG072727 Bmi1 polycomb ring finger oncogene Bmi1 NM007552
BG077079 A disintegrin and metallopeptidase domain 17 Adam17 NM009615
BG082860 WD repeat domain 77 Wdr77 NM027432
BG085072 WAP 4-disulfide core domain 2 Wfdc2 NM026323
BG086014 High mobility group nucleosomal binding domain 1 Hmgn1 NM008251
AW542440 Unknown
BG070468 Unknown
BG069520 Unknown
BG070685 Unknown
4648 MASCARENHAS et al BLOOD, 19 NOVEMBER 2009 � VOLUME 114, NUMBER 21
For personal use only.on January 4, 2019. by guest www.bloodjournal.orgFrom

that form the sympathetic ganglia and the adrenal gland (reviewedin Huber38). �B crystallin (Cryab), a marker of myogenic progeni-tor cells, and tyrosine hydroxylase (Th), a marker of the sympathoa-drenal precursor cells, were found to be up-regulated in ourexpression analysis (Table 1 and supplemental Table 1). Interest-ingly, expression analysis for these marker genes showed that bothcell populations are expanded in p57Kip2�/�m AGMs (compareFigure 4Li,Mi with L,M). It remains to be determined how this mayinfluence HSC behavior in the AGM.
Igf2 and its receptors are expressed in embryonichematopoietic tissues
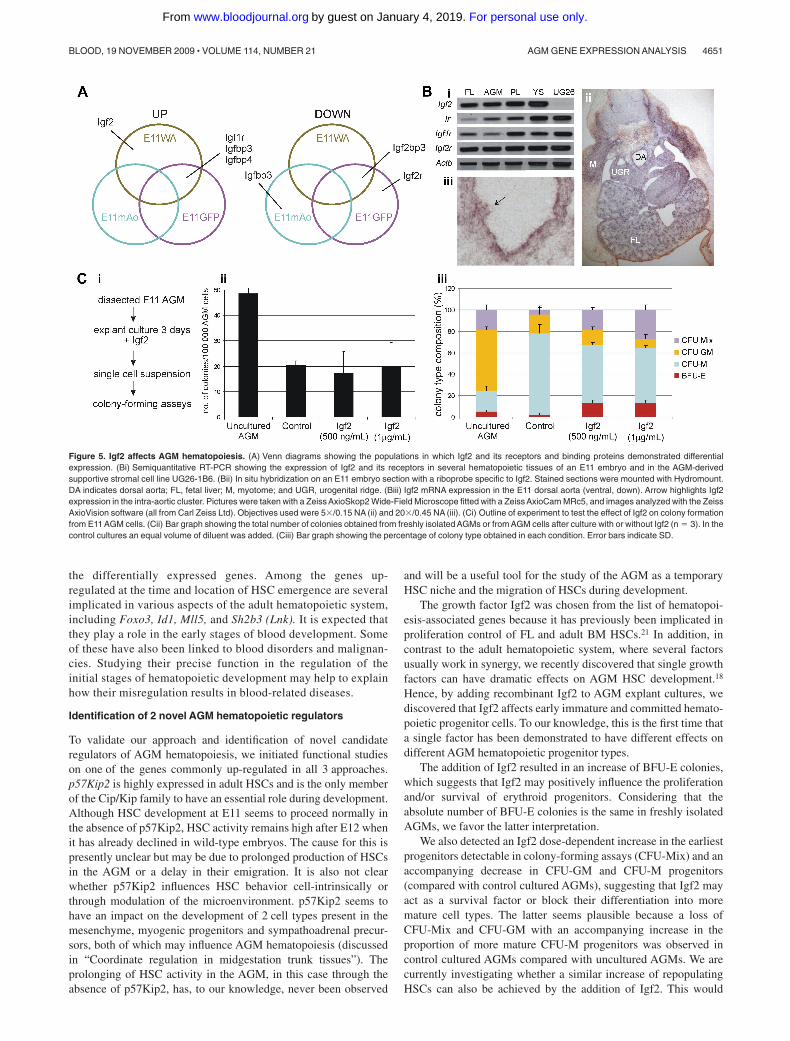
Recently, we observed that single growth factors, such as interleu-kin 3 and bone morphogenic protein 4, have a positive effect onAGM HSC expansion.12,18 Growth factor signaling pathways werehighlighted in our functional enrichment analysis (data not shown),including the Igf2 pathway. Igf2 was up-regulated in the E11WApopulation, and 2 of its 3 receptors as well as several of itsregulatory binding proteins were also differentially expressed(Figure 5A). Moreover, Igf2 and p57Kip2 are oppositely imprintedand suggested to act antagonistically in some tissues.39
RT-PCR was performed to confirm that Igf2 is expressed in theE11 AGM (Figure 5Bi). In addition to Igf2, we also detected
transcripts for all of its 3 receptors in the E11 AGM. Igf2r seems tobe expressed more highly than the other 2 receptors. Other tissuesknown to contain HSCs at E11, namely the yolk sac, the FL, andthe placenta, were also examined. Igf2 and Igf2r transcripts werefound at similarly high levels as in the AGM, whereas Ir and Igf1rshowed different expression levels in these tissues. The E11 AGMstromal cell clone UG26-1B6, previously demonstrated to serve asa good in vitro model for the AGM HSC supportive microenviron-ment,40 showed high-level expression of all 3 Igf2 receptors, but noexpression of Igf2 (Figure 5Bi). In situ hybridization performed forIgf2 transcripts on E11 embryo sections detected high levels ofexpression in several different tissues, including the myotome, theFL, and the AGM (Figure 5Bii). Within the region of the dorsalaorta, Igf2 was expressed in the endothelial and smooth musclelayer and in the intra-aortic clusters (Figure 5Biii arrow).
Igf2 affects hematopoietic stem/progenitor growth and/ormaintenance in the AGM
To investigate whether Igf2 affectsAGM hematopoiesis,AGM explantswere cultured in the presence or absence of recombinant Igf2. After3 days, AGM explants were dissociated and hematopoietic progenitorcontent was evaluated by in vitro colony-forming assays (Figure 5Ci).Although the total number of colonies obtained from E11 AGM cells
Figure 3. Functional enrichment in the total up-regulatedgene population. List of biologic processes significantly enriched(P � .05) in the up-regulated gene population. The number ofdifferentially expressed genes representative of a particular pro-cess is given in brackets.
AGM GENE EXPRESSION ANALYSIS 4649BLOOD, 19 NOVEMBER 2009 � VOLUME 114, NUMBER 21
For personal use only.on January 4, 2019. by guest www.bloodjournal.orgFrom

was not affected by increasing Igf2 concentrations (Figure 5Cii), theanalysis of colony types revealed differential effects of Igf2 on indi-vidual blood lineages (Figure 5Ciii). A striking effect was seen oncolony-forming unit–Mix (CFU-Mix) progenitors, the most stem cell–like progenitor detectable in these in vitro colony-forming assays. Theirpercentage increased by 4.5-fold (4% to 18%; P � .01) upon theaddition of 500 ng/mL of Igf2 and further to almost 7-fold (27%;P � .003) when the concentration of added Igf2 was doubled. Thisdose-dependent expansion of CFU-Mix colonies seemed to occur at theexpense of CFU–granulocyte-macrophage (CFU-GM) and CFU-macrophage (CFU-M) colonies. The percentage of CFU-M progenitorswas reduced from 76% to 51% (P � .03), whereas CFU-GM progenitorfrequency decreased from 17% to 8% (P � .1), although the latterchange failed to reach significance levels. Igf2 (both concentrations)also increased the percentage of erythroid burst-forming unit (BFU-E)progenitors by 7-fold (2% to 14%; P � .004). Taken together, these dataseem to suggest that Igf2 has a positive effect on immature progenitorsand the erythroid lineage, whereas it has a negative impact on moremature members of the granulocyte/monocyte lineage. To gain moreinsight into the mechanism by which Igf2 might exert these effects onprogenitors, we also determined the CFU-C content in freshly isolatedE11 AGMs. Remarkably, the total CFU-C content of fresh AGMs wasmore than double that of cultured AGMs (Figure 5Cii); however, thismay at least in part be due to circulating progenitors still being presentinside the aorta at the time of dissection, although these would getwashed out during the culture step. The colony composition alsodiffered from that of cultured AGMs (Figure 5Ciii). The most strikingdifference was seen in the percentage of CFU-GMs (57% freshAGM vs17% cultured control AGMs; P � .004) and CFU-Ms (20% vs 76%;
P � .002). Although the percentages of CFU-Mix and BFU-E coloniesare lower in freshAGMs compared with Igf2-treated (1 �g/mL)AGMs,the absolute number of BFU-E colonies per 100 000 cells is the same(2.5 vs 2.7) and that of CFU-Mix colonies increased (9.2 vs 5.4). Thissuggests that hematopoietic progenitor cells in the AGM start todifferentiate during the culture step and that Igf2 may act as amaintenance factor.
Discussion
Refinement of HSC location
Through subdissections of the E11 dorsal aorta, we have furtherrefined the location of HSCs and shown that they are enriched inthe middle region of the aorta near the junction of this vesselwith the vitelline artery. The reason for this preferential locationmay be due to differences in the microenvironment along thelength of the aorta. Alternatively, it is reasonable to suspect thatthe disturbance in blood flow at the junction of these 2 majorvessels promotes HSC emergence. Two reports have recentlyhighlighted the importance of blood flow and the associatedbiomechanical forces in HSC development.41,42 We have incor-porated this new HSC localization information into the design ofa comprehensive gene expression analysis of the dorsal aorta.Combined analyses of both spatial gene expression changes (indifferent parts of the aorta that do or do not support HSCs), aswell as temporal gene expression changes (comparing tissuesbefore and after HSC emergence) showed substantial overlap in
Figure 4. p57Kip2 expression and function in the AGM. Analysis of p57Kip2 expression by in situ hybridization in E9 wild-type (A-B), E11 wild-type (C-H), and E11p57Kip2�/�m (I) embryos. (D) Caudal section; (F) rostral section. (G) Close-up of an E11 aorta with endothelial expression highlighted by arrows and subaortic expression withan asterisk. Stained sections were mounted with Hydromount. Ventral, down. DA indicates dorsal aorta; HG, hindgut; LB, lung bud; NC, nephrogenic chord; and VA, vitellineartery. (J) Graph showing percentage of mice repopulated with E11 and E12 AGMs (1 ee) from wild-type or p57Kip2 mutant embryos. The number of repopulated mice/totalmice injected is indicated above each bar. (K) Cytospin of E11 AGM cells stained with an antibody for p57Kip2 (green, Alexa488) and mounted with Vectashield. Nuclear 4,6diamidino-2-phenylindole staining in blue. White arrowheads indicate cells with cytoplasmic p57Kip2. Expression analysis by in situ hybridization for Cryab (L,Li) and Th (M,Mi)on wild-type (L-M) and p57Kip2�/�m (Li,Mi) E11 embryos. Stained sections were mounted with Hydromount (National Diagnostics). All pictures were taken with a ZeissAxioSkop2 Wide-Field Microscope fitted with a Zeiss AxioCam MRc5, and images analyzed with the Zeiss AxioVision software (all from Carl Zeiss Ltd). Objectives used were5�/0.15 NA (C,H-I), 10�/0.25 NA (A-B,D-F,L,Li,M,Mi), 20�/0.45 NA (G), and 40�/0.65 NA (K).
4650 MASCARENHAS et al BLOOD, 19 NOVEMBER 2009 � VOLUME 114, NUMBER 21
For personal use only.on January 4, 2019. by guest www.bloodjournal.orgFrom
the differentially expressed genes. Among the genes up-regulated at the time and location of HSC emergence are severalimplicated in various aspects of the adult hematopoietic system,including Foxo3, Id1, Mll5, and Sh2b3 (Lnk). It is expected thatthey play a role in the early stages of blood development. Someof these have also been linked to blood disorders and malignan-cies. Studying their precise function in the regulation of theinitial stages of hematopoietic development may help to explainhow their misregulation results in blood-related diseases.
Identification of 2 novel AGM hematopoietic regulators
To validate our approach and identification of novel candidateregulators of AGM hematopoiesis, we initiated functional studieson one of the genes commonly up-regulated in all 3 approaches.p57Kip2 is highly expressed in adult HSCs and is the only memberof the Cip/Kip family to have an essential role during development.Although HSC development at E11 seems to proceed normally inthe absence of p57Kip2, HSC activity remains high after E12 whenit has already declined in wild-type embryos. The cause for this ispresently unclear but may be due to prolonged production of HSCsin the AGM or a delay in their emigration. It is also not clearwhether p57Kip2 influences HSC behavior cell-intrinsically orthrough modulation of the microenvironment. p57Kip2 seems tohave an impact on the development of 2 cell types present in themesenchyme, myogenic progenitors and sympathoadrenal precur-sors, both of which may influence AGM hematopoiesis (discussedin “Coordinate regulation in midgestation trunk tissues”). Theprolonging of HSC activity in the AGM, in this case through theabsence of p57Kip2, has, to our knowledge, never been observed
and will be a useful tool for the study of the AGM as a temporaryHSC niche and the migration of HSCs during development.
The growth factor Igf2 was chosen from the list of hematopoi-esis-associated genes because it has previously been implicated inproliferation control of FL and adult BM HSCs.21 In addition, incontrast to the adult hematopoietic system, where several factorsusually work in synergy, we recently discovered that single growthfactors can have dramatic effects on AGM HSC development.18
Hence, by adding recombinant Igf2 to AGM explant cultures, wediscovered that Igf2 affects early immature and committed hemato-poietic progenitor cells. To our knowledge, this is the first time thata single factor has been demonstrated to have different effects ondifferent AGM hematopoietic progenitor types.
The addition of Igf2 resulted in an increase of BFU-E colonies,which suggests that Igf2 may positively influence the proliferationand/or survival of erythroid progenitors. Considering that theabsolute number of BFU-E colonies is the same in freshly isolatedAGMs, we favor the latter interpretation.
We also detected an Igf2 dose-dependent increase in the earliestprogenitors detectable in colony-forming assays (CFU-Mix) and anaccompanying decrease in CFU-GM and CFU-M progenitors(compared with control cultured AGMs), suggesting that Igf2 mayact as a survival factor or block their differentiation into moremature cell types. The latter seems plausible because a loss ofCFU-Mix and CFU-GM with an accompanying increase in theproportion of more mature CFU-M progenitors was observed incontrol cultured AGMs compared with uncultured AGMs. We arecurrently investigating whether a similar increase of repopulatingHSCs can also be achieved by the addition of Igf2. This would
Figure 5. Igf2 affects AGM hematopoiesis. (A) Venn diagrams showing the populations in which Igf2 and its receptors and binding proteins demonstrated differentialexpression. (Bi) Semiquantitative RT-PCR showing the expression of Igf2 and its receptors in several hematopoietic tissues of an E11 embryo and in the AGM-derivedsupportive stromal cell line UG26-1B6. (Bii) In situ hybridization on an E11 embryo section with a riboprobe specific to Igf2. Stained sections were mounted with Hydromount.DA indicates dorsal aorta; FL, fetal liver; M, myotome; and UGR, urogenital ridge. (Biii) Igf2 mRNA expression in the E11 dorsal aorta (ventral, down). Arrow highlights Igf2expression in the intra-aortic cluster. Pictures were taken with a Zeiss AxioSkop2 Wide-Field Microscope fitted with a Zeiss AxioCam MRc5, and images analyzed with the ZeissAxioVision software (all from Carl Zeiss Ltd). Objectives used were 5�/0.15 NA (ii) and 20�/0.45 NA (iii). (Ci) Outline of experiment to test the effect of Igf2 on colony formationfrom E11 AGM cells. (Cii) Bar graph showing the total number of colonies obtained from freshly isolated AGMs or from AGM cells after culture with or without Igf2 (n � 3). In thecontrol cultures an equal volume of diluent was added. (Ciii) Bar graph showing the percentage of colony type obtained in each condition. Error bars indicate SD.
AGM GENE EXPRESSION ANALYSIS 4651BLOOD, 19 NOVEMBER 2009 � VOLUME 114, NUMBER 21
For personal use only.on January 4, 2019. by guest www.bloodjournal.orgFrom

mean that Igf2 might act to maintain the HSC pool in the AGM.Other investigations are focusing on whether some of the Igf2-binding proteins we have identified are modulating the effects ofIgf2 in the AGM. They can exert enhancing or inhibiting effects onIgf2 depending on cellular context, concentration, and type ofbinding protein (reviewed in Holly and Perks43), which mayexplain why they were detected among the up-regulated anddown-regulated genes. In addition, they may also directly affectHSCs, as it has been reported for human IGFBP2.44 Interestingly,Igfbp3 and Igfbp4 have been shown to be more highly expressed inHSC-supportive AGM-derived stromal cell lines compared withnonsupportive cell lines.14
Igf2 is not produced by the HSC-supportive stromal cell lineUG26-1B6. This is in contrast to the FL where Igf2 is secreted byCD3� stromal cells and is responsible for their supportive capac-ity.21 Our detection of Igf2 expression within the intra-aorticclusters could indicate that Igf2 exerts its effects either in anautocrine fashion or via the microenvironment (because all 3 recep-tors are expressed on UG26-1B6 cells). In vivo, additional Igf2may also be produced from the AGM microenvironment becausewe detected its expression also in the endothelial and the smoothmuscle layer of the aorta. Signaling occurs mainly through Igf1r,which is up-regulated in the whole aorta as well as in theHSC-enriched population. Igf2 binding to the nonsignaling Igf2rregulates its bioavailability, targeting Igf2 for internalization anddegradation, which may explain why Igf2r was among the down-regulated genes.
Coordinate regulation in midgestation trunk tissues
Using the bioinformatics package DAVID, we carried out ananalysis of the biologic functions that are enriched in the totalup-regulated gene population. It was intriguing to see that theexpression of genes specific to other tissues that surround the aortaalso increased at the time of HSC emergence. These includedvascular genes, genes of the sympathetic nervous system, andgenes expressed in (smooth) muscle cells. The fact that they areconcomitantly up-regulated and that these other tissues develop insuch close proximity to the aorta suggests that some regulators maybe involved in the development of several different organs, as iscertainly the case with some well-known developmental signalingpathways such as Wnt and Notch and, as shown here, p57Kip2.
However, this coregulation may also indicate that these tissuesinfluence each other’s development. There is an intimate connec-tion between the vascular and the developing hematopoieticsystem, with specialized endothelial cells believed to be the directprecursors of HSCs in the AGM.6,7 Furthermore, it has also beendemonstrated in avian embryos that at the peak of HSC productionin the AGM, the hemogenic endothelium at the ventral side of thedorsal aorta is starting to be replaced by somite-derived endothe-lium, which may trigger the release of HSCs into the aortic lumenand is likely to cause the decline in HSCs in the AGM starting fromE12.45,46 Similarly, lateral plate mesoderm-derived smooth musclecells located ventrally to the dorsal aorta are also being replaced bysmooth muscle precursors of somitic origin.37,47 How this mayinfluence HSC production in the AGM is currently unclear. Wedged
between the endothelial and smooth muscle cells is a single layer ofpericytes. These share many regulators and markers with smoothmuscle cells and have received a lot of attention recently as theyhave been shown to contain mesenchymal stromal cells (MSCs),which are important components of the adult HSC niche.48,49 Cellswith MSC potential have also been detected in the AGM at the timeof HSC emergence.50 However, whether these localize to thepericyte layer and form part of the AGM HSC supportive nicheremains to be shown.
Neural crest cells migrate from the neural tube to the dorsalaorta at the time of HSC generation where they differentiate intocells of the sympathetic nervous system (reviewed in Huber38).Catecholamines, which are released from cells of the sympatheticnervous system, have recently been shown to induce adult HSCproliferation and migration.51,52 It will be interesting to determinewhether they influence HSC production and migration duringdevelopment.
In summary, we have carried out an extensive gene expressionanalysis of the AGM at the time of HSC emergence. In theup-regulated gene sets, we have identified several hematopoieticregulators as well as genes involved in the development of tissuessurrounding the aorta. p57Kip2 and Igf2 were verified as regulatorsof AGM hematopoiesis and we are currently concentrating onseveral other candidate genes and their impact on HSC generationand/or expansion in the AGM.
Acknowledgments
We thank Dr Pumin Zhang for the p57Kip2 knockout mice; Karinvan der Horn and Fredrik Wallberg for cell sorting services; DrNatalia Ivanova for technical advice on RNA amplification;Richard Francis and especially Dr George Garinis for help andadvice on bioinformatics; Suzanne van Nobelen and Dr NielsGaljart for the mouse Igf2 plasmid; Bahar Mirshekar-Syahkal,Gillian Kimber, and other members of the labs for technicalassistance; and Dr Berthold Gottgens and Dr Anthony Green forhelpful comments on the manuscript.
This work was supported by the Kay Kendall Leukemia Fund(KKL276, K.O.), the Medical Research Council (PhD studentship,M.I.M.), Dutch Organization for Scientific Research (916.36.601,E.D.), and the National Institutes of Health (R37DK054077, E.D.).
Authorship
Contribution: M.I.M. performed research and analyzed data; A.P.performed research; E.D. designed experiments, analyzed data, andwrote the paper; and K.O. designed experiments, performedresearch, and wrote the paper.
Conflict-of-interest disclosure: The authors declare no compet-ing financial interests.
Correspondence: Katrin Ottersbach, Department of Haematol-ogy, Cambridge Institute for Medical Research, University ofCambridge, Hills Rd, Cambridge CB2 0XY, United Kingdom;e-mail: [email protected].
References
1. Medvinsky A, Dzierzak E. Definitive hematopoi-esis is autonomously initiated by the AGM region.Cell. 1996;86(6):897-906.
2. de Bruijn MF, Speck NA, Peeters MC, Dzierzak E.Definitive hematopoietic stem cells first develop
within the major arterial regions of the mouse em-bryo. EMBO J. 2000;19(11):2465-2474.
3. Gekas C, Dieterlen-Lievre F, Orkin SH, MikkolaHK. The placenta is a niche for hematopoieticstem cells. Dev Cell. 2005;8(3):365-375.
4. Ottersbach K, Dzierzak E. The murine placentacontains hematopoietic stem cells within the vas-cular labyrinth region. Dev Cell. 2005;8(3):377-387.
5. Dzierzak E, Speck NA. Of lineage and legacy: the
4652 MASCARENHAS et al BLOOD, 19 NOVEMBER 2009 � VOLUME 114, NUMBER 21
For personal use only.on January 4, 2019. by guest www.bloodjournal.orgFrom

development of mammalian hematopoietic stemcells. Nat Immunol. 2008;9(2):129-136.
6. Chen MJ, Yokomizo T, Zeigler BM, Dzierzak E,Speck NA. Runx1 is required for the endothelialto haematopoietic cell transition but not thereaf-ter. Nature. 2009;457(7231):887-891.
7. Zovein AC, Hofmann JJ, Lynch M, et al. Fate trac-ing reveals the endothelial origin of hematopoieticstem cells. Cell Stem Cell. 2008;(6):3:625-636.
8. Ottersbach K, Dzierzak E. The endothelium: thecradle of definitive hematopoiesis? In: Godin I,Cumano A, eds. Hematopoietic Stem Cell Devel-opment. Austin, TX: Landes Bioscience. 2006:80-91.
9. Bertrand JY, Giroux S, Golub R, et al. Character-ization of purified intraembryonic hematopoieticstem cells as a tool to define their site of origin.Proc Natl Acad Sci U S A. 2005;102(1):134-139.
10. North TE, de Bruijn MF, Stacy T, et al. Runx1 ex-pression marks long-term repopulating hemato-poietic stem cells in the midgestation mouse em-bryo. Immunity. 2002;16(5):661-672.
11. Lancrin C, Sroczynska P, Stephenson C, Allen T,Kouskoff V, Lacaud G. The haemangioblast gen-erates haematopoietic cells through a haemo-genic endothelium stage. Nature. 2009;457(7231):892-895.
12. Durand C, Robin C, Bollerot K, Baron MH,Ottersbach K, Dzierzak E. Embryonic stromalclones reveal developmental regulators of defini-tive hematopoietic stem cells. Proc Natl Acad SciU S A. 2007;104(52):20838-20843.
13. Ohneda O, Ohneda K, Nomiyama H, et al.WECHE: a novel hematopoietic regulatory factor.Immunity. 2000;12(2):141-150.
14. Oostendorp RA, Robin C, Steinhoff C, et al.Long-term maintenance of hematopoietic stemcells does not require contact with embryo-derived stromal cells in cocultures. Stem Cells.2005;23(6):842-851.
15. de Bruijn MF, Ma X, Robin C, Ottersbach K,Sanchez MJ, Dzierzak E. Hematopoietic stemcells localize to the endothelial cell layer in themidgestation mouse aorta. Immunity. 2002;16(5):673-683.
16. Strouboulis J, Dillon N, Grosveld F. Developmen-tal regulation of a complete 70-kb human beta-globin locus in transgenic mice. Genes Dev.1992;6(10):1857-1864.
17. Zhang P, Liegeois NJ, Wong C, et al. Altered celldifferentiation and proliferation in mice lackingp57KIP2 indicates a role in Beckwith-Wiedemannsyndrome. Nature. 1997;387(6629):151-158.
18. Robin C, Ottersbach K, Durand C, et al. An unex-pected role for IL-3 in the embryonic developmentof hematopoietic stem cells. Dev Cell. 2006;11(2):171-180.
19. Ivanova NB, Dimos JT, Schaniel C, Hackney JA,Moore KA, Lemischka IR. A stem cell molecularsignature. Science. 2002;298(5593):601-604.
20. European Bioinformatics Institute. ArrayExpress.http://www.ebi.ac.uk/microarray-as/ae/. AccessedOctober 14, 2009.
21. Zhang CC, Lodish HF. Insulin-like growth factor 2expressed in a novel fetal liver cell population is agrowth factor for hematopoietic stem cells. Blood.2004;103(7):2513-2521.
22. National Center for Biotechnology Information.GenBank. http://www.ncbi.nlm.nih.gov/Genbank.Accessed October 14, 2009.
23. Tanaka TS, Jaradat SA, Lim MK, et al. Genome-wide expression profiling of mid-gestation pla-centa and embryo using a 15,000 mouse devel-opmental cDNA microarray. Proc Natl Acad SciU S A. 2000;97(16):9127-9132.
24. Smyth GK. Linear models and empirical bayesmethods for assessing differential expression inmicroarray experiments. Stat Appl Genet MolBiol. 2004;3:Article3.
25. Fujiwara Y, Browne CP, Cunniff K, Goff SC, OrkinSH. Arrested development of embryonic red cellprecursors in mouse embryos lacking transcrip-tion factor GATA-1. Proc Natl Acad Sci U S A.1996;93(22):12355-12358.
26. Okuda T, van Deursen J, Hiebert SW, GrosveldG, Downing JR. AML1, the target of multiple chro-mosomal translocations in human leukemia, isessential for normal fetal liver hematopoiesis.Cell. 1996;84(2):321-330.
27. Pandolfi PP, Roth ME, Karis A, et al. Targeted dis-ruption of the GATA3 gene causes severe abnor-malities in the nervous system and in fetal liverhaematopoiesis. Nat Genet. 1995;11(1):40-44.
28. Wang Q, Stacy T, Binder M, Marin-Padilla M,Sharpe AH, Speck NA. Disruption of the Cbfa2gene causes necrosis and hemorrhaging in thecentral nervous system and blocks definitive he-matopoiesis. Proc Natl Acad Sci U S A. 1996;93(8):3444-3449.
29. Tothova Z, Kollipara R, Huntly BJ, et al. FoxOsare critical mediators of hematopoietic stem cellresistance to physiologic oxidative stress. Cell.2007;128(2):325-339.
30. Jankovic V, Ciarrocchi A, Boccuni P, DeBlasio T,Benezra R, Nimer SD. Id1 restrains myeloid com-mitment, maintaining the self-renewal capacity ofhematopoietic stem cells. Proc Natl Acad SciU S A. 2007;104(4):1260-1265.
31. Perry SS, Zhao Y, Nie L, Cochrane SW, Huang Z,Sun XH. Id1, but not Id3, directs long-term re-populating hematopoietic stem-cell maintenance.Blood. 2007;110(7):2351-2360.
32. Heuser M, Yap DB, Leung M, et al. Loss of MLL5results in pleiotropic hematopoietic defects, re-duced neutrophil immune function, and extremesensitivity to DNA demethylation. Blood. 2009;113(7):1432-1443.
33. Madan V, Madan B, Brykczynska U, et al. Im-paired function of primitive hematopoietic cells inmice lacking the mixed-lineage-leukemia ho-molog MLL5. Blood. 2009;113(7):1444-1454.
34. Passegue E, Wagers AJ, Giuriato S, AndersonWC, Weissman IL. Global analysis of proliferationand cell cycle gene expression in the regulationof hematopoietic stem and progenitor cell fates.J Exp Med. 2005;202(11):1599-1611.
35. Santaguida M, Schepers K, King B, et al. JunBprotects against myeloid malignancies by limitinghematopoietic stem cell proliferation and differen-tiation without affecting self-renewal. Cancer Cell.2009;15(4):341-352.
36. Yokoo T, Toyoshima H, Miura M, et al. p57Kip2regulates actin dynamics by binding and translo-cating LIM-kinase 1 to the nucleus. J Biol Chem.2003;278(52):52919-52923.
37. Esner M, Meilhac SM, Relaix F, Nicolas JF,Cossu G, Buckingham ME. Smooth muscle of thedorsal aorta shares a common clonal origin withskeletal muscle of the myotome. Development.2006;133(4):737-749.
38. Huber K. The sympathoadrenal cell lineage:specification, diversification, and new perspec-tives. Dev Biol. 2006;298(2):335-343.
39. Caspary T, Cleary MA, Perlman EJ, Zhang P,Elledge SJ, Tilghman SM. Oppositely imprintedgenes p57(Kip2) and igf2 interact in a mousemodel for Beckwith-Wiedemann syndrome.Genes Dev. 1999;13(23):3115-3124.
40. Oostendorp RA, Harvey KN, Kusadasi N, et al.Stromal cell lines from mouse aorta-gonads-mesonephros subregions are potent supportersof hematopoietic stem cell activity. Blood. 2002;99(4):1183-1189.
41. Adamo L, Naveiras O, Wenzel PL, et al. Biome-chanical forces promote embryonic haematopoi-esis. Nature. 2009;459(7250):1131-1135.
42. North TE, Goessling W, Peeters M, et al. Hema-topoietic stem cell development is dependent onblood flow. Cell. 2009;137(4):736-748.
43. Holly J, Perks C. The role of insulin-like growthfactor binding proteins. Neuroendocrinology.2006;83(3-4):154-160.
44. Huynh H, Iizuka S, Kaba M, et al. Insulin-likegrowth factor-binding protein 2 secreted by a tu-morigenic cell line supports ex vivo expansion ofmouse hematopoietic stem cells. Stem Cells.2008;26(6):1628-1635.
45. Pouget C, Gautier R, Teillet MA, Jaffredo T.Somite-derived cells replace ventral aortic he-mangioblasts and provide aortic smooth musclecells of the trunk. Development. 2006;133(6):1013-1022.
46. Sato Y, Watanabe T, Saito D, et al. Notch medi-ates the segmental specification of angioblasts insomites and their directed migration toward thedorsal aorta in avian embryos. Dev Cell. 2008;14(6):890-901.
47. Wasteson P, Johansson BR, Jukkola T, et al. De-velopmental origin of smooth muscle cells in thedescending aorta in mice. Development. 2008;135(10):1823-1832.
48. Crisan M, Yap S, Casteilla L, et al. A perivascularorigin for mesenchymal stem cells in multiple hu-man organs. Cell Stem Cell. 2008;3(3):301-313.
49. Sacchetti B, Funari A, Michienzi S, et al. Self-renewing osteoprogenitors in bone marrow sinu-soids can organize a hematopoietic microenvi-ronment. Cell. 2007;131(2):324-336.
50. Mendes SC, Robin C, Dzierzak E. Mesenchymalprogenitor cells localize within hematopoieticsites throughout ontogeny. Development. 2005;132(5):1127-1136.
51. Katayama Y, Battista M, Kao WM, et al. Signalsfrom the sympathetic nervous system regulatehematopoietic stem cell egress from bone mar-row. Cell. 2006;124(2):407-421.
52. Spiegel A, Shivtiel S, Kalinkovich A, et al. Cat-echolaminergic neurotransmitters regulate migra-tion and repopulation of immature human CD34�cells through Wnt signaling. Nat Immunol. 2007;8(10):1123-1131.
AGM GENE EXPRESSION ANALYSIS 4653BLOOD, 19 NOVEMBER 2009 � VOLUME 114, NUMBER 21
For personal use only.on January 4, 2019. by guest www.bloodjournal.orgFrom

online September 30, 2009 originally publisheddoi:10.1182/blood-2009-06-230037
2009 114: 4645-4653
Maria I. Mascarenhas, Aimée Parker, Elaine Dzierzak and Katrin Ottersbach expression profilingdevelopment through refinement of stem cell localization and Identification of novel regulators of hematopoietic stem cell
http://www.bloodjournal.org/content/114/21/4645.full.htmlUpdated information and services can be found at:
(3532 articles)Hematopoiesis and Stem Cells Articles on similar topics can be found in the following Blood collections
http://www.bloodjournal.org/site/misc/rights.xhtml#repub_requestsInformation about reproducing this article in parts or in its entirety may be found online at:
http://www.bloodjournal.org/site/misc/rights.xhtml#reprintsInformation about ordering reprints may be found online at:
http://www.bloodjournal.org/site/subscriptions/index.xhtmlInformation about subscriptions and ASH membership may be found online at:
Copyright 2011 by The American Society of Hematology; all rights reserved.of Hematology, 2021 L St, NW, Suite 900, Washington DC 20036.Blood (print ISSN 0006-4971, online ISSN 1528-0020), is published weekly by the American Society
For personal use only.on January 4, 2019. by guest www.bloodjournal.orgFrom