Embed Size (px)
Citation preview
Submitted 17 October 2018Accepted 3 May 2019Published 19 July 2019
Corresponding authorsShuwang Ge,[email protected] Xu, [email protected]
Academic editorCheorl-Ho Kim
Additional Information andDeclarations can be found onpage 8
DOI 10.7717/peerj.7067
Copyright2019 Miraji et al.
Distributed underCreative Commons CC-BY 4.0
OPEN ACCESS
Identification of primary genes inglomeruli compartment ofimmunoglobulin A nephropathy bybioinformatic analysisMohammed Khamis Miraji*, Yichun Cheng*, Shuwang Ge and Gang XuDepartment of Nephrology, Tongji Hospital affiliated to Tongji Medical College, Huazhong University ofScience and Technology, Wuhan, Hubei, China
*These authors contributed equally to this work.
ABSTRACTThe current study is aimed to explore the specific genes which are responsible for themanifestation of Immunoglobulin A nephropathy (IgAN). Gene expression profilesGSE37460, GSE93798 and GSE104948 were analyzed using biological informaticsmethods to identify differentially expressed genes (DEGs) in IgAN glomeruli sampleswhich were then compared to normal control samples. Subsequently, the DEGs wereoverlapped to explore genes with significant expression in at least two profiles. Finally,the enrichment analysis was conducted and the protein-protein interaction (PPI)network was constructed for the overlapping DEGs. A total of 28 genes were up-regulated and 10 genes were down-regulated. The up-regulated genes including CD44and FN1 were chiefly involved in extracellular matrix receptors interaction pathway.In addition, CX3CR1 and CCL4 were associated with chemokine signaling pathway.ITGB2, PTPRC, FN1, and FCER1G were hub genes with a high degree of interactionin the PPI network. Therefore, this study identified many significant genes associatedwith extracellular matrix expansion and inflammatory mechanism which may be thenovel biomarker and target candidates in IgAN.
Subjects Bioinformatics, Immunology, NephrologyKeywords Gene expression profiling, Immunoglobulin A Nephropathy, Protein–proteininteraction, Down-regulation, Up-regulation
INTRODUCTIONImmunoglobulin A nephropathy (IgAN) is the most common type of biopsy-provenprimary glomerulonephritis and highly prevails in Asia, especially in China where itaccounts for 58.2% of the glomerulonephritis cases (Donadio & Grande, 2002). Theoutcome of IgAN is highly variable, 15∼40% of the patients with IgAN progressivelydevelop to end-stage renal disease (ESRD) within 20 years after diagnosis (Barbour et al.,2013). Therefore, IgAN has been a health concern throughout the world.
Pathogenic steps of the IgAN include deposition of IgA immune complexes, mesangialcells proliferation, and over-production of extracellularmatrix components and infiltrationof the inflammatory cells in the kidney tissues. Although these pathogenic steps of IgANhave been studied for decades (Wyatt & Julian, 2013), their mechanism is still unclear.
How to cite this article Miraji MK, Cheng Y, Ge S, Xu G. 2019. Identification of primary genes in glomeruli compartment ofimmunoglobulin A nephropathy by bioinformatic analysis. PeerJ 7:e7067 http://doi.org/10.7717/peerj.7067
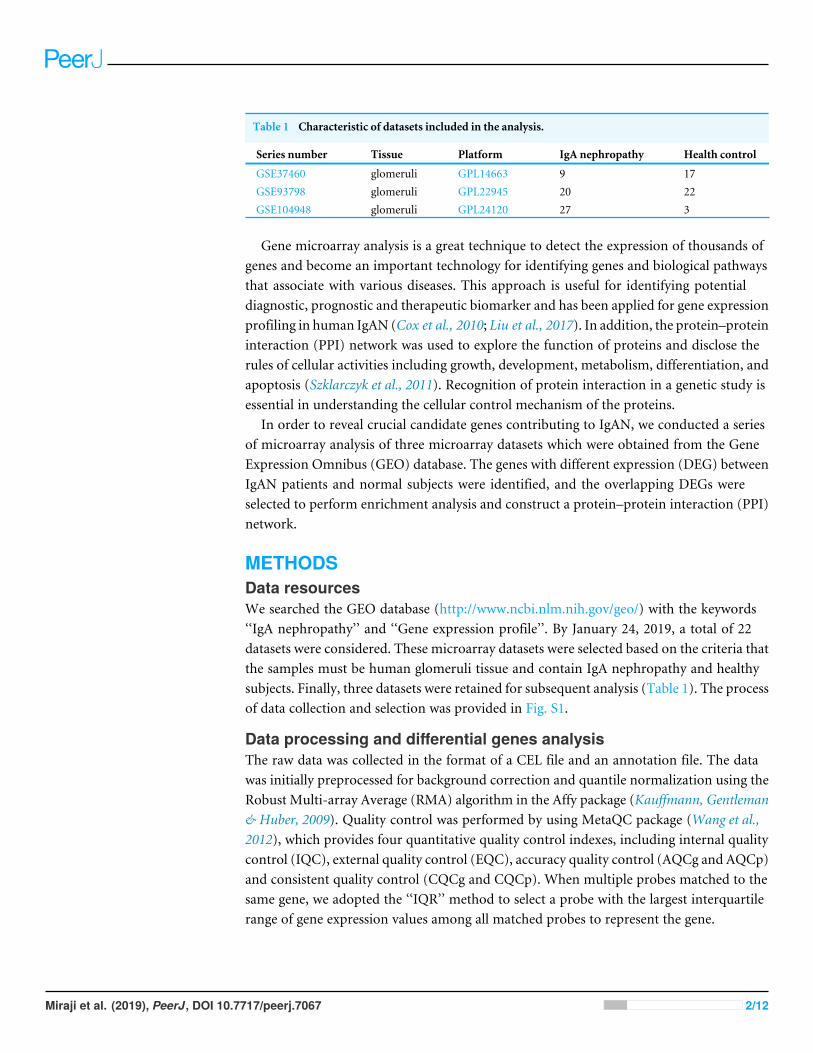
Table 1 Characteristic of datasets included in the analysis.
Series number Tissue Platform IgA nephropathy Health control
GSE37460 glomeruli GPL14663 9 17GSE93798 glomeruli GPL22945 20 22GSE104948 glomeruli GPL24120 27 3
Gene microarray analysis is a great technique to detect the expression of thousands ofgenes and become an important technology for identifying genes and biological pathwaysthat associate with various diseases. This approach is useful for identifying potentialdiagnostic, prognostic and therapeutic biomarker and has been applied for gene expressionprofiling in human IgAN (Cox et al., 2010; Liu et al., 2017). In addition, the protein–proteininteraction (PPI) network was used to explore the function of proteins and disclose therules of cellular activities including growth, development, metabolism, differentiation, andapoptosis (Szklarczyk et al., 2011). Recognition of protein interaction in a genetic study isessential in understanding the cellular control mechanism of the proteins.
In order to reveal crucial candidate genes contributing to IgAN, we conducted a seriesof microarray analysis of three microarray datasets which were obtained from the GeneExpression Omnibus (GEO) database. The genes with different expression (DEG) betweenIgAN patients and normal subjects were identified, and the overlapping DEGs wereselected to perform enrichment analysis and construct a protein–protein interaction (PPI)network.
METHODSData resourcesWe searched the GEO database (http://www.ncbi.nlm.nih.gov/geo/) with the keywords‘‘IgA nephropathy’’ and ‘‘Gene expression profile’’. By January 24, 2019, a total of 22datasets were considered. These microarray datasets were selected based on the criteria thatthe samples must be human glomeruli tissue and contain IgA nephropathy and healthysubjects. Finally, three datasets were retained for subsequent analysis (Table 1). The processof data collection and selection was provided in Fig. S1.
Data processing and differential genes analysisThe raw data was collected in the format of a CEL file and an annotation file. The datawas initially preprocessed for background correction and quantile normalization using theRobust Multi-array Average (RMA) algorithm in the Affy package (Kauffmann, Gentleman& Huber, 2009). Quality control was performed by using MetaQC package (Wang et al.,2012), which provides four quantitative quality control indexes, including internal qualitycontrol (IQC), external quality control (EQC), accuracy quality control (AQCg and AQCp)and consistent quality control (CQCg and CQCp). When multiple probes matched to thesame gene, we adopted the ‘‘IQR’’ method to select a probe with the largest interquartilerange of gene expression values among all matched probes to represent the gene.
Miraji et al. (2019), PeerJ, DOI 10.7717/peerj.7067 2/12
Identification of the overlap DEGs between three microarray datasetsThe processed data was used to run the linear Model for Microarray (LIMMA) packagein R (Ritchie et al., 2015). The model was applied to identify differentially expressedgenes between IgAN patients and healthy subjects in each dataset. The multiple testingcorrection was carried out to control the false discovery rate (FDR) with the applicationof the Benjamini–Hochberg procedure (Benjamini & Hochberg, 1995). The genes with thecorrected p value <0.05 and |log2FC|>1 were considered as DEGs. Then we examinedthe overlaps of the top 100 ranked genes across the three series. Genes with significantlydifferential expression in at least two datasets were selected as common genes. In order toevaluate the reliability of the above DEGs, we also performed a meta-analysis by the Fishermethod and the maximum P-value method in MetaDE package (Wang et al., 2012).
Enrichment analysis of the overlapped DEGsThe function and pathway enrichment analysis of the overlapped differentially expressedgeneswere carried out using the onlineweb resourceDatabase for Annotation, Visualizationand Integration Discovery (DAVID, http://david.abcc.ncifcrf.gov). DAVID was used toconduct Gene Ontology (GO) and Kyoto Encyclopedia of Genes and Genomes (KEGG)pathway analysis in up-regulated and down-regulated overlapping DEGs independently.The p< 0.1 and gene count (number of enriched genes in a specific function or a pathway)>2 were considered the significant threshold values for the GO terms and pathway termsenrichment in the DEGs.
Construction of the PPI networkTo understand the interactions of the overlapped DEGs at the molecular level, weconstructed the PPI network using the Search Tool for the Retrieval of Interacting Genesdatabase (STRING, http://string.embl.de/) (Szklarczyk et al., 2011). The protein pairs witha confidence score >0.6 were considered to be significant. PPI network was visualized usingCytoscape software (http://cytoscape.org/) (Smoot et al., 2011).
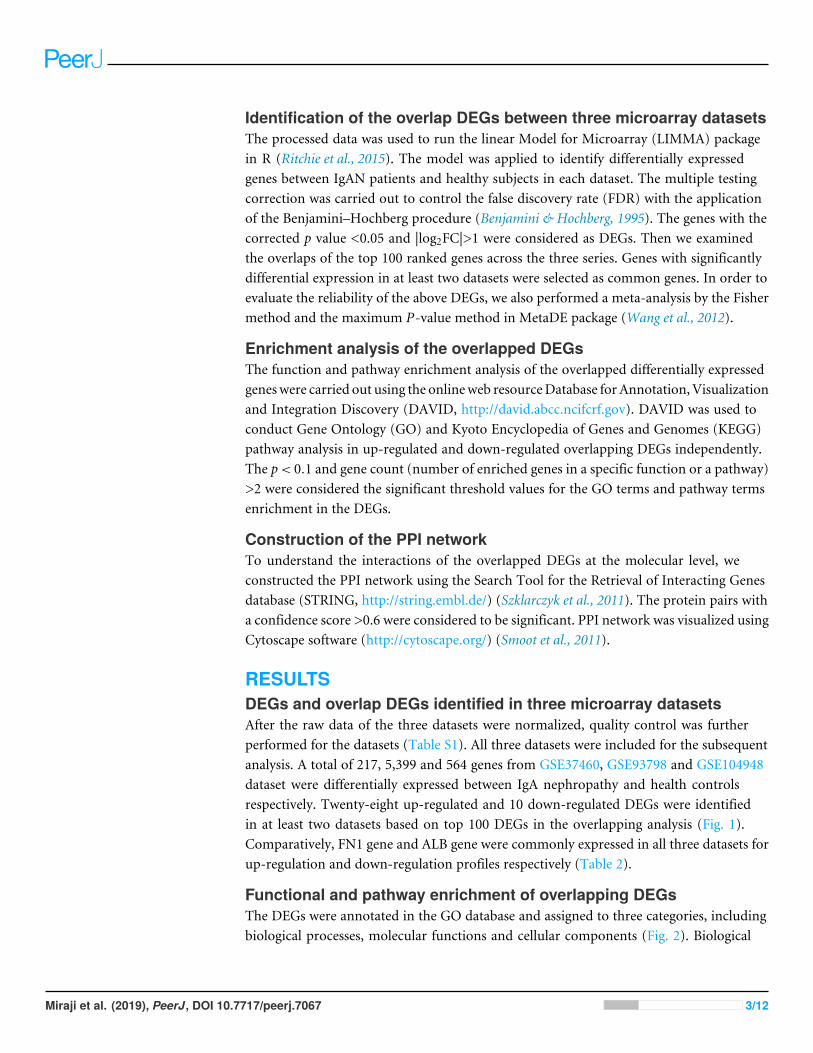
RESULTSDEGs and overlap DEGs identified in three microarray datasetsAfter the raw data of the three datasets were normalized, quality control was furtherperformed for the datasets (Table S1). All three datasets were included for the subsequentanalysis. A total of 217, 5,399 and 564 genes from GSE37460, GSE93798 and GSE104948dataset were differentially expressed between IgA nephropathy and health controlsrespectively. Twenty-eight up-regulated and 10 down-regulated DEGs were identifiedin at least two datasets based on top 100 DEGs in the overlapping analysis (Fig. 1).Comparatively, FN1 gene and ALB gene were commonly expressed in all three datasets forup-regulation and down-regulation profiles respectively (Table 2).
Functional and pathway enrichment of overlapping DEGsThe DEGs were annotated in the GO database and assigned to three categories, includingbiological processes, molecular functions and cellular components (Fig. 2). Biological
Miraji et al. (2019), PeerJ, DOI 10.7717/peerj.7067 3/12
Figure 1 A Venn diagram showing the differentially expressed genes in GSE37460, GSE93978, andGSE104948. (A) Up-regulated genes. (B) Down-regulated genes.
Full-size DOI: 10.7717/peerj.7067/fig-1
process enrichment analysis indicated that up-regulated DEGs were mainly involved in celladhesion, leukocyte migration, and inflammatory response. Down-regulated DEGs weremainly involved in positive regulation of transcription from RNA polymerase II promoter,skeletal muscle cell differentiation and negative regulation of transcription from RNApolymerase II promoter. Cellular component analysis showed that up-regulated DEGswere mainly involved in the extracellular region, collagen trimer and extracellular space.Down-regulated DEGs were mainly involved in a nucleus. The molecular function analysisshowed that up-regulated DEGs were mainly involved in protein binding receptor bindingand collagen binding. Down-regulated DEGs were mainly involved in sequence-specificDNA binding, transcriptional activator activity, and DNA binding.
In addition, the up-regulated DEGs were significantly enriched in 12 pathways suchas NF-kappa B signaling pathway including LYN, LY96, CCL4, CD14; ECM-receptorinteraction pathway including CD44, COL6A3, COL1A2, FN1 and Amoebiasis pathwayincluding COL1A2, ITGB2, CD14, FN1 (Table 3). No significant pathways were involvedwith down-regulated DEGs.
PPI network of overlapping DEGsThe resultant network contained 29 nodes and 60 edges (Fig. 3). Furthermore, theoverlapped DEGs such as ITGB2, PTPRC, FN1, and FCER1G in the PPI network wereidentified as hub genes.
DISCUSSIONIgA nephropathy is the leading form of glomerulonephritis worldwide (Wyatt & Julian,2013). Many studies have been conducted to explore the pathogenesis of IgAN (Robert etal., 2015; Suzuki et al., 2011), however, the mechanism underlying IgAN progression hasnot been fully elucidated. In this study, we identified candidate genes critical to IgAN by
Miraji et al. (2019), PeerJ, DOI 10.7717/peerj.7067 4/12
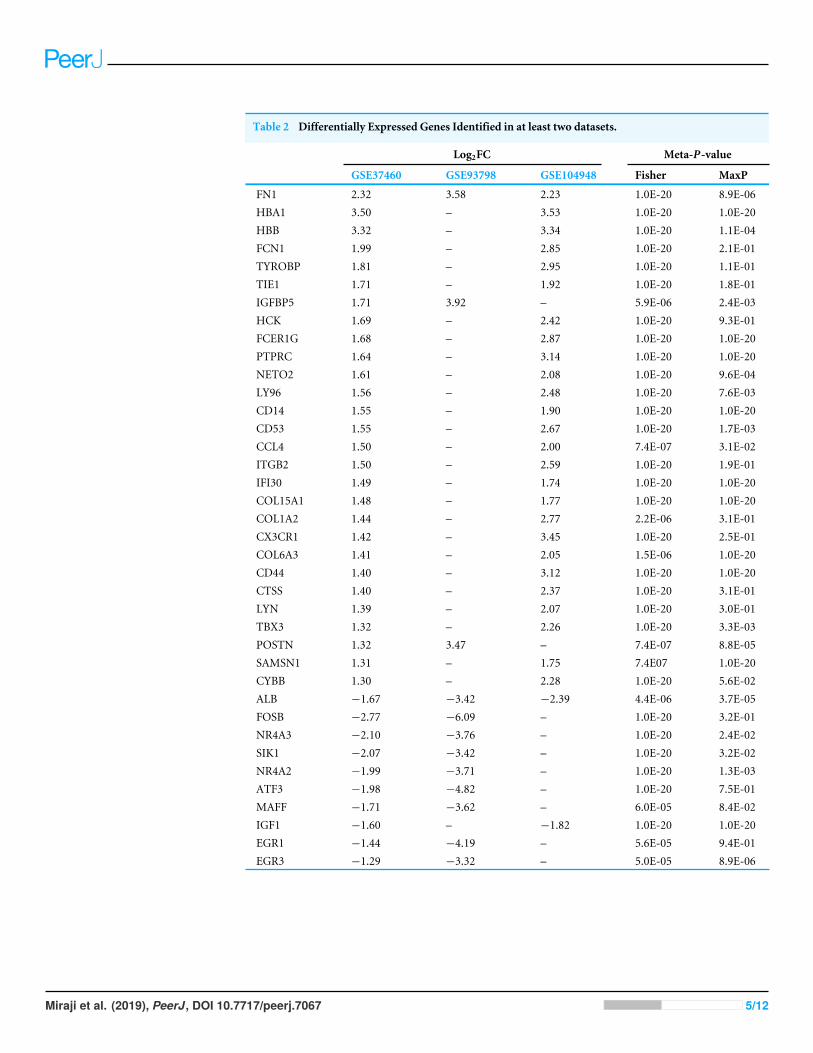
Table 2 Differentially Expressed Genes Identified in at least two datasets.
Log2FC Meta-P-value
GSE37460 GSE93798 GSE104948 Fisher MaxP
FN1 2.32 3.58 2.23 1.0E-20 8.9E-06HBA1 3.50 – 3.53 1.0E-20 1.0E-20HBB 3.32 – 3.34 1.0E-20 1.1E-04FCN1 1.99 – 2.85 1.0E-20 2.1E-01TYROBP 1.81 – 2.95 1.0E-20 1.1E-01TIE1 1.71 – 1.92 1.0E-20 1.8E-01IGFBP5 1.71 3.92 – 5.9E-06 2.4E-03HCK 1.69 – 2.42 1.0E-20 9.3E-01FCER1G 1.68 – 2.87 1.0E-20 1.0E-20PTPRC 1.64 – 3.14 1.0E-20 1.0E-20NETO2 1.61 – 2.08 1.0E-20 9.6E-04LY96 1.56 – 2.48 1.0E-20 7.6E-03CD14 1.55 – 1.90 1.0E-20 1.0E-20CD53 1.55 – 2.67 1.0E-20 1.7E-03CCL4 1.50 – 2.00 7.4E-07 3.1E-02ITGB2 1.50 – 2.59 1.0E-20 1.9E-01IFI30 1.49 – 1.74 1.0E-20 1.0E-20COL15A1 1.48 – 1.77 1.0E-20 1.0E-20COL1A2 1.44 – 2.77 2.2E-06 3.1E-01CX3CR1 1.42 – 3.45 1.0E-20 2.5E-01COL6A3 1.41 – 2.05 1.5E-06 1.0E-20CD44 1.40 – 3.12 1.0E-20 1.0E-20CTSS 1.40 – 2.37 1.0E-20 3.1E-01LYN 1.39 – 2.07 1.0E-20 3.0E-01TBX3 1.32 – 2.26 1.0E-20 3.3E-03POSTN 1.32 3.47 – 7.4E-07 8.8E-05SAMSN1 1.31 – 1.75 7.4E07 1.0E-20CYBB 1.30 – 2.28 1.0E-20 5.6E-02ALB −1.67 −3.42 −2.39 4.4E-06 3.7E-05FOSB −2.77 −6.09 – 1.0E-20 3.2E-01NR4A3 −2.10 −3.76 – 1.0E-20 2.4E-02SIK1 −2.07 −3.42 – 1.0E-20 3.2E-02NR4A2 −1.99 −3.71 – 1.0E-20 1.3E-03ATF3 −1.98 −4.82 – 1.0E-20 7.5E-01MAFF −1.71 −3.62 – 6.0E-05 8.4E-02IGF1 −1.60 – −1.82 1.0E-20 1.0E-20EGR1 −1.44 −4.19 – 5.6E-05 9.4E-01EGR3 −1.29 −3.32 – 5.0E-05 8.9E-06
Miraji et al. (2019), PeerJ, DOI 10.7717/peerj.7067 5/12
Pe
rc
en
tag
e o
f g
en
es
(%
)
ce
ll a
dh
es
ion
leu
ko
cy
te m
igra
tio
n
ex
tra
ce
llu
lar m
atr
ix o
rg
an
iza
tio
n
lip
op
oly
sa
cc
ha
rid
e-m
ed
iate
d s
ign
alin
g p
ath
wa
y
infl
am
ma
tory
re
sp
on
se
co
lla
ge
n c
ata
bo
lic
pro
ce
ss
toll-lik
e r
ec
ep
tor 4
sig
na
lin
g p
ath
wa
y
inte
grin
-m
ed
iate
d s
ign
alin
g p
ath
wa
y
inn
ate
im
mu
ne
re
sp
on
se
po
sit
ive
re
gu
lati
on
of
tum
or n
ec
ro
sis
fa
cto
r p
ro
du
cti
on
blo
od
co
ag
ula
tio
n
ce
llu
lar d
efe
ns
e r
es
po
ns
e
ne
utr
op
hil c
he
mo
tax
is
inte
rfe
ro
n-g
am
ma
-m
ed
iate
d s
ign
alin
g p
ath
wa
y
ex
tra
ce
llu
lar m
atr
ix d
isa
ss
em
bly
sig
na
l tr
an
sd
uc
tio
n
ce
ll s
urfa
ce
re
ce
pto
r s
ign
alin
g p
ath
wa
y
an
tig
en
pro
ce
ss
ing
an
d p
re
se
nt
ex
tra
ce
llu
lar r
eg
ion
co
lla
ge
n t
rim
er
ex
tra
ce
llu
lar s
pa
ce
pro
tein
ac
eo
us
ex
tra
ce
llu
lar m
atr
ix
ex
tra
ce
llu
lar m
atr
ix
ce
ll s
urfa
ce
ex
tra
ce
llu
lar e
xo
so
me
inte
gra
l c
om
po
ne
nt
of
pla
sm
a m
em
bra
ne
pro
tein
bin
din
g
co
lla
ge
n b
ind
ing
0
2 0
4 0
6 0
8 0
1 0 0
A B
Biological process
Cellular component
Molecular function
Pe
rc
en
tag
e o
f g
en
es
(%
)
po
sit
ive
re
gu
lati
on
of
tra
ns
crip
tio
n f
ro
m R
NA
po
lym
era
se
II
pro
mo
ter
sk
ele
tal
mu
sc
le c
ell d
iffe
re
nti
ati
on
ne
ga
tiv
e r
eg
ula
tio
n o
f tr
an
sc
rip
tio
n f
ro
m R
NA
po
lym
era
se
II
pro
mo
ter
tra
ns
crip
tio
n f
ro
m R
NA
po
lym
era
se
II
pro
mo
ter
tra
ns
crip
tio
n f
ac
tor a
cti
vit
y,
se
qu
en
ce
-s
pe
cif
ic D
NA
bin
din
g
nu
cle
us
se
qu
en
ce
-s
pe
cif
ic D
NA
bin
din
g
tra
ns
crip
tio
na
l a
cti
va
tor a
cti
DN
A b
ind
ing
0
2 0
4 0
6 0
8 0
1 0 0
Figure 2 GO term of overlapped differentially expressed genes. Blue bars, biological process; green bars,cellular component; red bars, molecular function. (A) Up-regulated genes. (B) Down-regulated genes.
Full-size DOI: 10.7717/peerj.7067/fig-2
Table 3 Pathways significantly enriched by up-regulated differentially expressed genes.
ID Term Count P value Genes
hsa04064 NF-kappa B signaling pathway 4 0.002 LYN, LY96, CCL4, CD14hsa04512 ECM-receptor interaction 4 0.002 CD44, COL6A3, COL1A2, FN1hsa05146 Amoebiasis 4 0.003 COL1A2, ITGB2, CD14, FN1hsa05144 Malaria 3 0.009 ITGB2, HBA1, HBBhsa05152 Tuberculosis 4 0.014 FCER1G, ITGB2, CTSS, CD14hsa04062 Chemokine signaling pathway 4 0.016 LYN, HCK, CX3CR1, CCL4hsa05133 Pertussis 3 0.020 LY96, ITGB2, CD14hsa04666 Fc gamma R-mediated phagocytosis 3 0.024 PTPRC, LYN, HCKhsa04974 Protein digestion and absorption 3 0.026 COL6A3, COL1A2, COL15A1hsa04620 Toll-like receptor signaling pathway 3 0.037 LY96, CCL4, CD14hsa04650 Natural killer cell mediated cytotoxicity 3 0.048 FCER1G, ITGB2, TYROBPhsa04611 Platelet activation 3 0.054 LYN, COL1A2, FCER1Ghsa04145 Phagosome 3 0.069 ITGB2, CTSS, CD14hsa05143 African trypanosomiasis 2 0.092 HBA1, HBB
combining three datasets from GEO database and presented the potential pathways thatmay play an important role in IgAN.
Our bioinformatic analysis demonstrated that fibronectin (FN1) is overexpressed inIgAN glomeruli. The fibronectin is an essential element of the extracellular matrix. Inpathological conditions, fibronectin could act as a seed for the deposition of ECM proteinsaround somatic cells, leading to sclerosis or fibrosis of tissue (Brotchie & Wakefield, 1990).Besides, some animal experiments have shown that fibronectin is associated with theprogression of kidney disease (Kubosawa & Kondo, 1998; Shui et al., 2006). In patientswith glomerulonephritis, increased plasma and urinary fibronectin levels were observed
Miraji et al. (2019), PeerJ, DOI 10.7717/peerj.7067 6/12
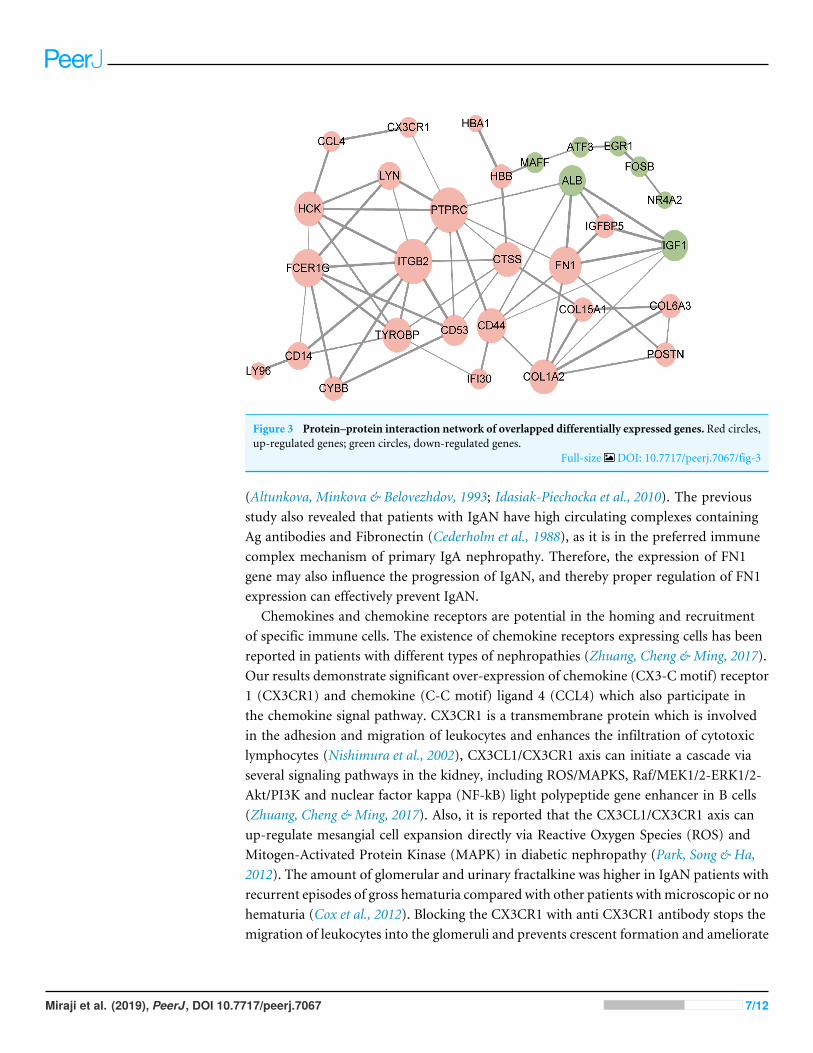
Figure 3 Protein–protein interaction network of overlapped differentially expressed genes. Red circles,up-regulated genes; green circles, down-regulated genes.
Full-size DOI: 10.7717/peerj.7067/fig-3
(Altunkova, Minkova & Belovezhdov, 1993; Idasiak-Piechocka et al., 2010). The previousstudy also revealed that patients with IgAN have high circulating complexes containingAg antibodies and Fibronectin (Cederholm et al., 1988), as it is in the preferred immunecomplex mechanism of primary IgA nephropathy. Therefore, the expression of FN1gene may also influence the progression of IgAN, and thereby proper regulation of FN1expression can effectively prevent IgAN.
Chemokines and chemokine receptors are potential in the homing and recruitmentof specific immune cells. The existence of chemokine receptors expressing cells has beenreported in patients with different types of nephropathies (Zhuang, Cheng & Ming, 2017).Our results demonstrate significant over-expression of chemokine (CX3-C motif) receptor1 (CX3CR1) and chemokine (C-C motif) ligand 4 (CCL4) which also participate inthe chemokine signal pathway. CX3CR1 is a transmembrane protein which is involvedin the adhesion and migration of leukocytes and enhances the infiltration of cytotoxiclymphocytes (Nishimura et al., 2002), CX3CL1/CX3CR1 axis can initiate a cascade viaseveral signaling pathways in the kidney, including ROS/MAPKS, Raf/MEK1/2-ERK1/2-Akt/PI3K and nuclear factor kappa (NF-kB) light polypeptide gene enhancer in B cells(Zhuang, Cheng & Ming, 2017). Also, it is reported that the CX3CL1/CX3CR1 axis canup-regulate mesangial cell expansion directly via Reactive Oxygen Species (ROS) andMitogen-Activated Protein Kinase (MAPK) in diabetic nephropathy (Park, Song & Ha,2012). The amount of glomerular and urinary fractalkine was higher in IgAN patients withrecurrent episodes of gross hematuria compared with other patients withmicroscopic or nohematuria (Cox et al., 2012). Blocking the CX3CR1 with anti CX3CR1 antibody stops themigration of leukocytes into the glomeruli and prevents crescent formation and ameliorate
Miraji et al. (2019), PeerJ, DOI 10.7717/peerj.7067 7/12
renal function (Feng et al., 1999), thus inhibiting deterioration of renal function to ESRD inIgAN. On the other hand, CCL4 is the chemokine with specificity for CCR5 receptors. Thed32–CCR5 polymorphism played a significant role in the progression of primary IgAN,with the nl/nl genotype being an independent protective factor for late progression towardsend-stage renal disease (Berthoux et al., 2006). Up-regulation of CCR5 is demonstrated inthe kidney and its expression is related to the increase in proteinuria (Navarro-Gonzalez etal., 2011). Therefore, we believe that these chemokines and chemokine receptors may playan important role in the pathogenesis of IgAN and a large number of studies should beconducted to clear the mechanism in the future.
The PPI network shows that some hub genes have high interaction with other genes,comparatively. High interaction of these genes demonstrates their potential participationin the manifestation and progression of IgAN. ITGB2 gene is the most interactive hubgene in the network, and it is up-regulated, enriched in an inflammatory response and celladhesion. ITGB2 gene is on chromosome 21 (21q22.3) and encodes integrin β2 protein(CD11b/CD18) (Yassaee et al., 2016). Upon inflammatory stimuli, CD11b/CD18 is rapidlyactivated via a conformational switch to mediate leukocyte migration from circulationto the inflamed tissue by binding to ICAM-1 (Hynes, 2002). Recent studies revealed thatinhibition of the CD11b/CD18 could prevent the acute kidney injury and the progressionof acute kidney injury to chronic kidney disease (Dehnadi et al., 2017; Yago et al., 2015). Ofnote, the infiltration of the inflammatory cell is an important characteristic in IgAN (Wyatt& Julian, 2013). Therefore, inflammatory response and cell adhesion via CD11b/CD18may have a significant effect in IgAN pathogenesis initiation.
The observation of the ALB gene in the PPI network is peculiar. The ALB is encodingalbumin which is chiefly found in urinary protein. The ALB possesses high connectivityin the PPI network despite the gene being down-regulated with no significant pathway.These observations have resulted from the fact that kidney tubular epithelial cells arepathologically exposed to massive urinary proteins in patients with glomerular diseases(Remuzzi & Bertani, 1998). The experimental evidence demonstrated that urinary proteins,which include albumin, are involved in the mechanism of tubulointerstitial fibrosis(Eddy, 2004; Remuzzi & Bertani, 1998). The ALB gene was down-regulated because in thisbioinformatic analysis we use only the glomeruli tissues.
Although bioinformatics technology is a great method to identify the candidate genescontributing to diseases, many limitations still remain in this study. First, microarray datawas downloaded from the GEO database instead of that developed by our research group.Second, the number of datasets and the sample size used in the analysis are small. Besides,the clinical data of the patients are not available, thus some confounding factors like age,sex, and renal function were not controlled in the analysis. Despite these limitations, ourfindings still have important implications for the molecular mechanisms of IgAN andfurther research is required to validate the results obtained in our study.
CONCLUSIONIn conclusion, the network analysis identified several primary genes for IgAN.Comparatively, FN1 and ALB are the most common genes among all the genes in the
Miraji et al. (2019), PeerJ, DOI 10.7717/peerj.7067 8/12
three profiles. In depth functional studies on these common genes may improve ourunderstanding of the pathological processes of IgAN. However, these findings requireexperimental confirmation for future use.
ADDITIONAL INFORMATION AND DECLARATIONS
FundingThis work was financially supported by the Major Research plan of the National NaturalScience Foundation of China (Grant No. 91742204), international (regional) cooperationand exchange projects, (NSFC-DFG, Grant No. 81761138041), the National NaturalScience Foundation of China (Grants 81470948, 81670633, 81570667), the National KeyResearch and Development Program (Grants 2016YFC0906103) and the National KeyTechnology R&D Program (Grant 2013BAI09B06, 2015BAI12B07). The funders had norole in study design, data collection and analysis, decision to publish, or preparation of themanuscript.
Grant DisclosuresThe following grant information was disclosed by the authors:National Natural Science Foundation of China: 91742204.International (regional) cooperation and exchange projects: 81761138041.National Natural Science Foundation of China: 81470948, 81670633, 81570667.National Key Research and Development Program: 2016YFC0906103.The National Key Technology R&D Program: 2013BAI09B06, 2015BAI12B07.
Competing InterestsThe authors declare there are no competing interests.
Author Contributions• Mohammed Khamis Miraji and Yichun Cheng conceived and designed the experiments,analyzed the data, prepared figures and/or tables, authored or reviewed drafts of thepaper, approved the final draft.
• Shuwang Ge and Gang Xu conceived and designed the experiments, approved the finaldraft.
Data AvailabilityThe following information was supplied regarding data availability:
We used three gene expression profiles (GSE37460, GSE93798 and GSE104948) fromthe Gene Expression Omnibus database of NCBI.
Supplemental InformationSupplemental information for this article can be found online at http://dx.doi.org/10.7717/peerj.7067#supplemental-information.
Miraji et al. (2019), PeerJ, DOI 10.7717/peerj.7067 9/12
REFERENCESAltunkova I, Minkova V, Belovezhdov N. 1993. Role of fibronectin in immune glomeru-
lonephritis. Nephron 63:438–444 DOI 10.1159/000187249.Barbour SJ, Cattran DC, Kim SJ, Levin A,Wald R, HladunewichMA, Reich HN.
2013. Individuals of Pacific Asian origin with IgA nephropathy have an increasedrisk of progression to end-stage renal disease. Kidney International 84:1017–1024DOI 10.1038/ki.2013.210.
Benjamini Y, Hochberg Y. 1995. Controlling the false discovery rate: a practical andpowerful approach to multiple testing. Journal of the Royal Statistical Society1:289–300.
Berthoux FC, Berthoux P, Mariat C, Thibaudin L, Afiani A, Linossier MT. 2006. CC-chemokine receptor five gene polymorphism in primary IgA nephropathy: the 32bp deletion allele is associated with late progression to end-stage renal failure withdialysis. Kidney International 69:565–572 DOI 10.1038/sj.ki.5000106.
Brotchie H,Wakefield D. 1990. Fibronectin structure function and significance inwound healing. Australasian Journal of Dermatology 31:47–56DOI 10.1111/j.1440-0960.1990.tb00650.x.
Cederholm B,Wieslander J, Bygren P, Heinegård D. 1988. Circulating complexes con-taining IgA and fibronectin in patients with primary IgA nephropathy. Proceedingsof the National Academy of Sciences of the United States of America 85:4865–4868DOI 10.1073/pnas.85.13.4865.
Cox SN, Sallustio F, Serino G, Loverre A, Pesce F, Gigante M, Zaza G, Stifanelli PF,Ancona N, Schena FP. 2012. Activated innate immunity and the involvement ofCX3CR1-fractalkine in promoting hematuria in patients with IgA nephropathy.Kidney International 82:548–560 DOI 10.1038/ki.2012.147.
Cox SN, Sallustio F, Serino G, Pontrelli P, Verrienti R, Pesce F, Torres DD, Ancona N,Stifanelli P, Zaza G, Schena FP. 2010. Altered modulation of WNT-beta-cateninand PI3K/Akt pathways in IgA nephropathy. Kidney International 78:396–407DOI 10.1038/ki.2010.138.
Dehnadi A, Benedict Cosimi A, Neal Smith R, Li X, Alonso JL, Means TK, ArnaoutMA. 2017. Prophylactic orthosteric inhibition of leukocyte integrin CD11b/CD18prevents long-term fibrotic kidney failure in cynomolgus monkeys. Nature Commu-nications 8:13899 DOI 10.1038/ncomms13899.
Donadio JV, Grande JP. 2002. IgA nephropathy. New England Journal of Medicine347:738–748 DOI 10.1056/NEJMra020109.
Eddy AA. 2004. Proteinuria and interstitial injury. Nephrology, Dialysis, Transplantation19:277–281 DOI 10.1093/ndt/gfg533.
Feng Y, Chen S, Garcia GE, Xia Y, SianaMA, Botti P, Wilson CB, Harrison JK,Bacon KB. 1999. Prevention of crescentic glomerulonephritis by immunoneu-tralization of the fractalkine receptor CX3CR1. Kidney International 56:612–620DOI 10.1046/j.1523-1755.1999.00604.x.
Miraji et al. (2019), PeerJ, DOI 10.7717/peerj.7067 10/12
Hynes RO. 2002. Integrins: bidirectional, allosteric signaling machines. Cell 110:673–687DOI 10.1016/S0092-8674(02)00971-6.
Idasiak-Piechocka I, Oko A, Pawliczak E, Kaczmarek E, Czekalski S. 2010. Elevatedurinary fibronectin excretion predicts poor outcome in patients with primarychronic glomerulonephritis. Nephron Clinical Practice 116:c47–c52DOI 10.1159/000314550.
Kauffmann A, Gentleman R, HuberW. 2009. arrayQualityMetrics—a bioconductorpackage for quality assessment of microarray data. Bioinformatics 25:415–416DOI 10.1093/bioinformatics/btn647.
Kubosawa H, Kondo Y. 1998. Alterations in the distribution of plasma fibronectin andthe ultrastructure of podocytes in the peripheral glomerular loops in nephrotic rats.Virchows Archiv 433:449–455 DOI 10.1007/s004280050273.
Liu P, Lassen E, Nair V, Berthier CC, SuguroM, Sihlbom C, Kretzler M, Betsholtz C,Haraldsson B, JuW, Ebefors K, Nystrom J. 2017. Transcriptomic and proteomicprofiling provides insight into mesangial cell function in IgA nephropathy. Journal ofthe American Society of Nephrology 28:2961–2972 DOI 10.1681/ASN.2016101103.
Navarro-Gonzalez JF, Mora-Fernandez C, Muros de Fuentes M, Garcia-Perez J. 2011.Inflammatory molecules and pathways in the pathogenesis of diabetic nephropathy.Nature Reviews Nephrology 7:327–340 DOI 10.1038/nrneph.2011.51.
NishimuraM, Umehara H, Nakayama T, Yoneda O, Hieshima K, Kakizaki M, DohmaeN, Yoshie O, Imai T. 2002. Dual Functions of Fractalkine/CX3C Ligand 1 inTrafficking of Perforin+/Granzyme B+ Cytotoxic Effector Lymphocytes ThatAre Defined by CX3CR1 Expression. Journal of Immunology 168:6173–6180DOI 10.4049/jimmunol.168.12.6173.
Park J, Song KH, Ha H. 2012. Fractalkine increases mesangial cell proliferation throughreactive oxygen species and mitogen-activated protein kinases. TransplantationProceedings 44:1026–1028 DOI 10.1016/j.transproceed.2012.03.045.
Remuzzi G, Bertani T. 1998. Pathophysiology of progressive nephropathies. NewEngland Journal of Medicine 339:1448–1456DOI 10.1056/NEJM199811123392007.
Ritchie ME, Phipson B,WuD, Hu Y, Law CW, ShiW, Smyth GK. 2015. limma powersdifferential expression analyses for RNA-sequencing and microarray studies. NucleicAcids Research 43:e47 DOI 10.1093/nar/gkv007.
Robert T, Berthelot L, Cambier A, Rondeau E, Monteiro RC. 2015.Molecular insightsinto the pathogenesis of IgA nephropathy. Trends in Molecular Medicine 21:762–775DOI 10.1016/j.molmed.2015.10.003.
Shui HA, Ka SM, Lin JC, Lee JH, Jin JS, Lin YF, Sheu LF, Chen A. 2006. Fibronectinin blood invokes the development of focal segmental glomerulosclerosis in mousemodel. Nephrology, Dialysis, Transplantation 21:1794–1802DOI 10.1093/ndt/gfl113.
Smoot ME, Ono K, Ruscheinski J, Wang PL, Ideker T. 2011. Cytoscape 2.8: newfeatures for data integration and network visualization. Bioinformatics 27:431–432DOI 10.1093/bioinformatics/btq675.
Miraji et al. (2019), PeerJ, DOI 10.7717/peerj.7067 11/12
Suzuki H, Kiryluk K, Novak J, Moldoveanu Z, Herr AB, RenfrowMB,Wyatt RJ,Scolari F, Mestecky J, Gharavi AG, Julian BA. 2011. The pathophysiology ofIgA nephropathy. Journal of the American Society of Nephrology 22:1795–1803DOI 10.1681/ASN.2011050464.
Szklarczyk D, Franceschini A, KuhnM, Simonovic M, Roth A, Minguez P, Doerks T,StarkM,Muller J, Bork P, Jensen LJ, VonMering C. 2011. The STRING databasein 2011: functional interaction networks of proteins, globally integrated and scored.Nucleic Acids Research 39:D561–D568 DOI 10.1093/nar/gkq973.
Wang X, Kang DD, Shen K, Song C, Lu S, Chang LC, Liao SG, Huo Z, Tang S,Ding Y, Kaminski N, Sibille E, Lin Y, Li J, Tseng GC. 2012. An R package suitefor microarray meta-analysis in quality control, differentially expressed geneanalysis and pathway enrichment detection. Bioinformatics 28:2534–2536DOI 10.1093/bioinformatics/bts485.
Wyatt RJ, Julian BA. 2013. IgA nephropathy. New England Journal of Medicine368:2402–2414 DOI 10.1056/NEJMra1206793.
Yago T, Petrich BG, Zhang N, Liu Z, Shao B, Ginsberg MH,McEver RP. 2015. Blockingneutrophil integrin activation prevents ischemia-reperfusion injury. Journal ofExperimetnal Medicine 212:1267–1281 DOI 10.1084/jem.20142358.
Yassaee VR, Hashemi-Gorji F, Boosaliki S, Parvaneh N. 2016.Mutation spectra of theITGB2 gene in Iranian families with leukocyte adhesion deficiency type 1. HumanImmunology 77:191–195 DOI 10.1016/j.humimm.2015.11.019.
Zhuang Q, Cheng K, Ming Y. 2017. CX3CL1/CX3CR1 Axis, as the therapeuticpotential in renal diseases: friend or foe? Current Gene Therapy 17:442–452DOI 10.2174/1566523218666180214092536.
Miraji et al. (2019), PeerJ, DOI 10.7717/peerj.7067 12/12