Embed Size (px)
Citation preview
Mol. Cells, Vol. 24, No. 1, pp. 16-26 Identification of QTLs for Some Agronomic Traits in Rice Using an Introgression Line from Oryza minuta
Md Lutfor Rahman, Sang Ho Chu, Min-Sun Choi, Yong Li Qiao, Wenzhu Jiang, Rihua Piao, Sakina Khanam1, Young-Il Cho, Ji-Ung Jeung2, Kshirod K. Jena2, and Hee-Jong Koh*
Department of Plant Science and Research Institute of Agriculture and Life Sciences, Seoul National University, Seoul 151-921, Korea; 1 Department of Biological and Environmental Science, Kobe University, Kobe 657-8501, Japan; 2 IRRI- Korea Office, National Institute of Crop Science, Rural Development Administration, Suwon 441-100, Korea. (Received September 8, 2006; Accepted April 17, 2007) Wild progenitor species provide potential gene sources for complex traits such as yield and multiple resistances to biotic and abiotic stresses, and thus are expected to contribute to sustainable food supplies. An introgression line ‘IR71033-121-15’ was derived from a wild species Oryza minuta (2n = 48, BBCC, Acc No. 101141) at IRRI. Introgression analysis using 530 SSR and STS markers revealed that at least 14 chromosomal segments distrib-uted over 12 chromosomes had been introgressed from O. minuta. An F2:3 population from the cross between IR71033 and Junambyeo (a Korean japonica cultivar) consisting of 146 lines was used for quantitative trait loci (QTL) analysis of 16 agronomic traits. A total of 36 single-locus QTLs (S-QTLs) and 45 digenic epistasis (E-QTLs) were identified. In spite of it’s inferiority of O. minuta for most of the traits studied, its alleles contrib-uted positively to 57% of the QTLs. The other QTLs originated from either parent, IR71033 or Junambyeo. QTLs for phenotypically correlated traits were mostly detected on introgressed segments. Fourteen QTLs cor-responded to QTLs reported earlier, indicating that these QTLs are stable across genetic backgrounds. Twenty-two QTLs controlling yield and its components had not been detected in previous QTL studies. Of these, thirteen consisted of potentially novel alleles from O. minuta. QTLs from O. minuta introgression could be new sources of natural variation for the genetic im-provement of rice. Keywords: Alien Introgression; Oryza minuta; Quantita-tive Trait Loci (QTL); Rice; Sequence Tagged Site (STS) Markers. * To whom correspondence should be addressed. Tel: 82-2-880-4541; Fax: 82-2-873-2056 E-mail: [email protected]
Introduction Though wild species themselves are agronomically poor, they may possess useful genes such as resistance to disease and insect pests, tolerance to environmental stresses or im-proved yield potential. There is still great potential for de-veloping new rice varieties by incorporating useful genes from wild species (Brar, 2004). To date, a large number of QTLs, derived from interspecific crosses and associated with various traits including yield and its components, quality traits, environmental stress tolerance, and disease and insect resistances, have been identified in rice (Aluko et al., 2004; Brondani et al., 2002; Jin et al., 2005; Mon-cada et al., 2001; Multani et al., 2003; Suh et al., 2005; Thomson et al., 2003; Tian et al., 2006; Xiong et al., 1999; Yoon et al., 2006). However, most of these QTLs were identified using AA genome species as donor parents in wide hybridization, due to the ease of gene transfer by con-ventional hybridization and selection. Introgressions from distantly related genomes other than AA genomes are usu-ally difficult because of low crossability and hence failure to raise hybrid plants. This difficulty can be avoided by embryo rescue with subsequent backcrossing (Brar and Khush, 1997). Several useful genes have been successfully transferred from distantly related species such as O. offici-nalis (CC), O. australiensis (EE) and O minuta (BBCC) using advanced techniques of tissue culture and chromo-some manipulation (Ishii et al., 1994; Jena et al., 1992; 2003; Liu et al., 2002). The mechanism of gene transfer may involve restricted reciprocal recombination detectable only at the molecular level (Jena and Kochert, 1991).
An allotetraploid (2n = 48, BBCC, Acc No. 101141) ge- nome species, O. minuta is endemic to the Philippines and Papua New Guinea. This wild species belongs to the O. officinalis complex and has useful genes for resistances to brown plant hopper, sheath blight and blast (Brar and
Moleculesand
Cells©KSMCB 2007
Md Lutfor Rahman et al. 17 Table 1. Comparison of agronomic traits between parents.
Attribute Trait IR71033 IR31917 Junambyeo O. minuta* Gigantism Tillers per plant (No.) 22.2 13 16 35
Panicles per plant (No.) 14 12.4 12.8 22 Culm length (cm) 75.2 51 72 42 Flag leaf length (cm) 42.1 38.6 26 26
Pigmentation SPAD value 36.7 41.1 41.9 21.8 Photoperiod sensitivity Days to heading (days) 84 104 76 165
Days to maturity (days) 102 155 123 205 Panicle and spikelet Panicle length (cm) 30.16 21.5 20.7 16.5
Spikelets per panicle (No.) 181 59 151 - Spikelet fertility (%) 95.3 51.6 98.7 - Awn length (cm) 0 0.52 0 2.5
Grain shape and weight Grain length (mm) 10.95 9.08 7.16 3.78 Grain width (mm) 2.7 2.54 3.45 1.3 Grain length to width ratio 4.05 3.57 2.07 2.9 Grain thickness (mm) 2.18 1.91 2.31 0.85 1000-grain weight (g) 30.1 24.2 26.8 - * Data collected from glass house. Khush, 1997). However there have been few attempts to transfer insect and disease resistances from O. minuta to cultivated rice, O. sativa (Amante et al., 1998). QTL analy-sis can provide information relevant to agronomic traits by using molecular markers to identify specific regions of the genome affecting a given trait (Lee et al., 2006; Tanksley, 1993). However, attempts to transfer QTLs from O. minuta to cultivars have been restricted by incompatibility between unrelated genomes.
We used an advanced backcross line IR71033-121-15 from a cross between O. sativa subsp. indica IR31917-45-3-2 and a wild species, O. minuta, as a donor parent; it was developed and made available at the IRRI. Although IR71033-121-15 resembled its recurrent parent, several of its traits were different from those of IR31917-45-3-2. In the present study, we report the mapping and characteriza-tion of QTLs underlying traits of agronomic importance using an F2:3 population derived from a cross between IR71033-121-15 and Junambyeo. Materials and Methods Plant materials The mapping population used in this study was an F2 population derived from a cross between IR71033-121-15 and Junambyeo (a Korean elite japonica cultivar). IR71033-121-15 was bred by backcrossing IR31917-45-3-2 three times to O. minuta and aided by embryo rescue and generation advance. Though IR71033 mostly resembled the recurrent parent IR31917, it differed from IR31917 in several important agronomic traits including tiller number, panicle number, culm length, flag leaf
length, days to heading, days to maturity, spikelet fertility, panicle length, spikelet number per panicle, grain shape and weight (Table 1). These differences may have originated from the introgression of O. minuta. The 146 F2 plants were grown at one plant per hill in paddy field. Leaves from each plant were collected at the maximum tillering stage and used for DNA extraction. Field cultivation and trait evaluation The 146 F3 lines, together with the parents IR71033 and Junambyeo, were planted in the field at one plant per hill at a distance of 30 × 15 cm using con-ventional transplanting methods during the summer of 2006, at the Experimental Farm of Seoul National University, Suwon, Korea. Each F3 line had two replications in randomized blocks, and each plot size was 1.5 m2. A total of 16 traits were evaluated in the 146 lines. Days to heading (DTH) were evaluated as the number of days from sowing in the field until 50% of the panicles in the 10 plants headed, and days to maturity (DTMT) were evalu-ated as the number of days until 50% of the panicles of all the plants were a golden color. Because of late heading, some plants were moved into a green house with 12 h light. The 10 plants in the middle of each plot were chosen for the evaluation of seven traits: tiller number (TN) was measured at the maximum tillering stage, and the SPAD values of the uppermost fully spread leaves were measured using a Minolta Chlorophyll Meter SPAD-502 (Minolta Camera Co., Japan) on the same day as TN. Culm length (CL) was measured in centimeters from the soil surface to the neck of the tallest tiller. Panicle number (PN) was calculated as the number of panicles per plant. Spikelets per panicle (SPP) were counted as the number of spikelets of the biggest panicle in a plant. Spikelet fertility (SF) was calculated as the number of fer-tile spikelets per panicle divided by the total number of spikelets
18 QTLs for Agronomic Traits Using an Oryza minuta Introgression Line
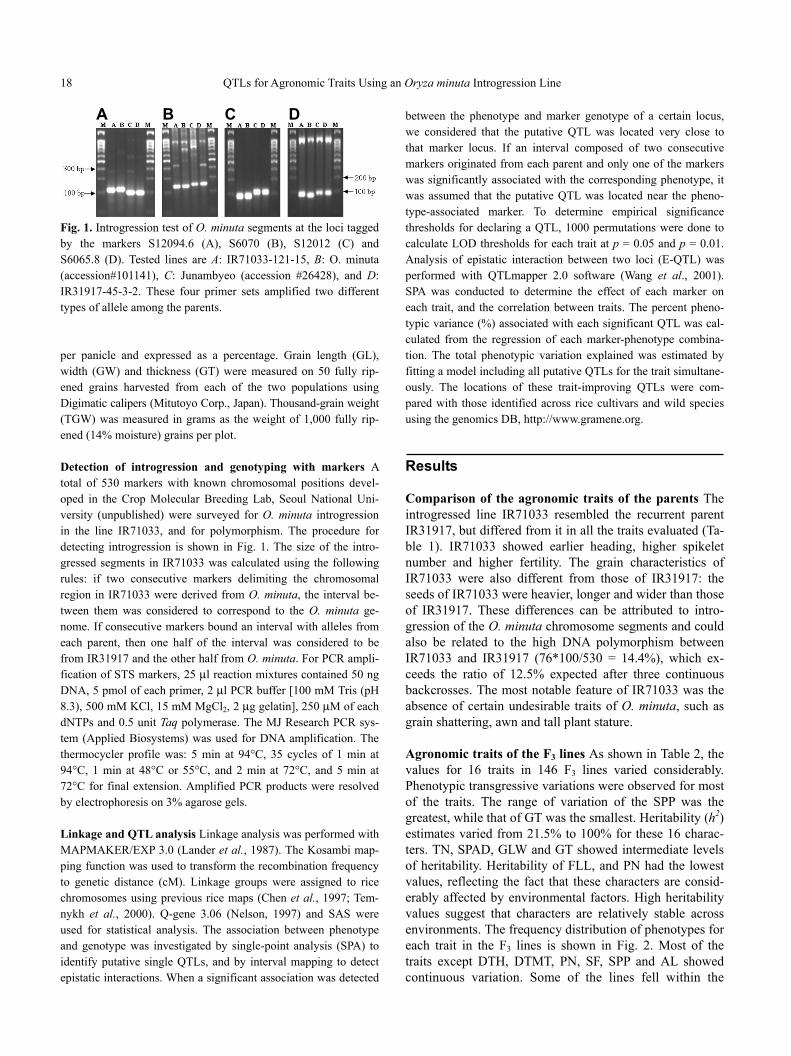
A B C D Fig. 1. Introgression test of O. minuta segments at the loci tagged by the markers S12094.6 (A), S6070 (B), S12012 (C) and S6065.8 (D). Tested lines are A: IR71033-121-15, B: O. minuta (accession#101141), C: Junambyeo (accession #26428), and D: IR31917-45-3-2. These four primer sets amplified two different types of allele among the parents. per panicle and expressed as a percentage. Grain length (GL), width (GW) and thickness (GT) were measured on 50 fully rip-ened grains harvested from each of the two populations using Digimatic calipers (Mitutoyo Corp., Japan). Thousand-grain weight (TGW) was measured in grams as the weight of 1,000 fully rip-ened (14% moisture) grains per plot. Detection of introgression and genotyping with markers A total of 530 markers with known chromosomal positions devel-oped in the Crop Molecular Breeding Lab, Seoul National Uni-versity (unpublished) were surveyed for O. minuta introgression in the line IR71033, and for polymorphism. The procedure for detecting introgression is shown in Fig. 1. The size of the intro-gressed segments in IR71033 was calculated using the following rules: if two consecutive markers delimiting the chromosomal region in IR71033 were derived from O. minuta, the interval be-tween them was considered to correspond to the O. minuta ge-nome. If consecutive markers bound an interval with alleles from each parent, then one half of the interval was considered to be from IR31917 and the other half from O. minuta. For PCR ampli-fication of STS markers, 25 μl reaction mixtures contained 50 ng DNA, 5 pmol of each primer, 2 μl PCR buffer [100 mM Tris (pH 8.3), 500 mM KCl, 15 mM MgCl2, 2 μg gelatin], 250 μM of each dNTPs and 0.5 unit Taq polymerase. The MJ Research PCR sys-tem (Applied Biosystems) was used for DNA amplification. The thermocycler profile was: 5 min at 94°C, 35 cycles of 1 min at 94°C, 1 min at 48°C or 55°C, and 2 min at 72°C, and 5 min at 72°C for final extension. Amplified PCR products were resolved by electrophoresis on 3% agarose gels. Linkage and QTL analysis Linkage analysis was performed with MAPMAKER/EXP 3.0 (Lander et al., 1987). The Kosambi map-ping function was used to transform the recombination frequency to genetic distance (cM). Linkage groups were assigned to rice chromosomes using previous rice maps (Chen et al., 1997; Tem-nykh et al., 2000). Q-gene 3.06 (Nelson, 1997) and SAS were used for statistical analysis. The association between phenotype and genotype was investigated by single-point analysis (SPA) to identify putative single QTLs, and by interval mapping to detect epistatic interactions. When a significant association was detected
between the phenotype and marker genotype of a certain locus, we considered that the putative QTL was located very close to that marker locus. If an interval composed of two consecutive markers originated from each parent and only one of the markers was significantly associated with the corresponding phenotype, it was assumed that the putative QTL was located near the pheno-type-associated marker. To determine empirical significance thresholds for declaring a QTL, 1000 permutations were done to calculate LOD thresholds for each trait at p = 0.05 and p = 0.01. Analysis of epistatic interaction between two loci (E-QTL) was performed with QTLmapper 2.0 software (Wang et al., 2001). SPA was conducted to determine the effect of each marker on each trait, and the correlation between traits. The percent pheno-typic variance (%) associated with each significant QTL was cal-culated from the regression of each marker-phenotype combina-tion. The total phenotypic variation explained was estimated by fitting a model including all putative QTLs for the trait simultane-ously. The locations of these trait-improving QTLs were com-pared with those identified across rice cultivars and wild species using the genomics DB, http://www.gramene.org. Results Comparison of the agronomic traits of the parents The introgressed line IR71033 resembled the recurrent parent IR31917, but differed from it in all the traits evaluated (Ta-ble 1). IR71033 showed earlier heading, higher spikelet number and higher fertility. The grain characteristics of IR71033 were also different from those of IR31917: the seeds of IR71033 were heavier, longer and wider than those of IR31917. These differences can be attributed to intro-gression of the O. minuta chromosome segments and could also be related to the high DNA polymorphism between IR71033 and IR31917 (76*100/530 = 14.4%), which ex-ceeds the ratio of 12.5% expected after three continuous backcrosses. The most notable feature of IR71033 was the absence of certain undesirable traits of O. minuta, such as grain shattering, awn and tall plant stature. Agronomic traits of the F3 lines As shown in Table 2, the values for 16 traits in 146 F3 lines varied considerably. Phenotypic transgressive variations were observed for most of the traits. The range of variation of the SPP was the greatest, while that of GT was the smallest. Heritability (h2) estimates varied from 21.5% to 100% for these 16 charac-ters. TN, SPAD, GLW and GT showed intermediate levels of heritability. Heritability of FLL, and PN had the lowest values, reflecting the fact that these characters are consid-erably affected by environmental factors. High heritability values suggest that characters are relatively stable across environments. The frequency distribution of phenotypes for each trait in the F3 lines is shown in Fig. 2. Most of the traits except DTH, DTMT, PN, SF, SPP and AL showed continuous variation. Some of the lines fell within the

Md Lutfor Rahman et al. 19 Table 2. Agronomic traits of 146 F3 lines.
Traita Skewness Kurtosis Mean ± SD Range Heritability (%) DTH (days) 1.36 0.97 84 ± 18.9 67−146 97.6 DTMT (days) 0.92 0.41 119 ± 19.4 85−174 97.2 TN (no) 0.97 2.50 14.8 ± 3.18 8.0−27.8 51.1 PN (no) 0.74 0.81 12 ± 2.06 7.2−18.8 45.8 CL (cm) -0.16 0.06 75.1 ± 9.5 50.3−97.3 90.5 PL (cm) -0.24 0.11 25.9 ± 2.92 18−33 92.7 FLL (cm) 0.34 0.66 28.4 ± 5.03 15.6−42.9 21.5 SPAD 0.53 1.37 37.3 ± 2.7 30.1−48.4 46.0 SPP (no) -0.37 0.46 105.9 ± 44.3 2.7−239.3 90.4 SF (%) -1.52 1.97 66.5 ± 20.8 2.5−98.7 99.9 AL (cm) 1.3 0.56 0.9 ± 1.32 0−4.5 100 GL (mm) -0.07 0.21 9.0 ± 0.63 7.2−10.9 99.9 GW (mm) -0.01 0.08 2.9 ± 0.23 2.33−3.54 95.2 GLW 0.53 1.02 3.0 ± 0.36 2.08−4.19 71.0 GT (mm) 0.88 2.63 2.02 ± 0.11 1.76−2.55 59.5 GWT(g) 0.09 0.02 26.5 ± 3.12 18.2−34.6 96.2
a DTH, days to heading; DTMT, days to maturity; TN, tiller number; PN, panicle number; CL, culm length; PL, panicle length; FLL, flag leaf length; SPAD, SPAD value; SPP, spikelet per panicle; SF, spikelet fertility; AL, awn length; GL, grain length; GW, grain width; GLW, grain length to width ratio; GT, grain thickness; GWT, 1,000 grains weight.
range of the parents for the traits SF, TN, GL, GW and GLW. However, transgressive segregations were observed for the other traits and were especially pronounced for the higher values of CL, DTH, DTMT, PL, SPP, GT and TGW.
Significant positive correlations were found between DTH & DTMT, PL & TGW, PL & SPP, SF & SPP and GT & GW (Table 3). On the other hand negative correlations were found between DTH & SPP, SF & DTH, and DTMT with SPP & SF. Significant correlations were also detected between the traits associated with grain morphology, GL, GW, GLW, and GT. For most of the correlations, the direc-tions (+ or −) and degree of correlation were similar to those obtained in previous studies (Thomson et al., 2003; Xiao et al., 1998; Yoon et al., 2006).
Construction of a framework linkage map A total of 530 STS and RM markers were used to survey polymor-phism between parents. 338 (63.8%) markers showed polymorphism between the recurrent parent IR31917 and O. minuta, 266 (48.3%) markers showed polymorphism between the introgression line IR71033 and the japonica cultivar Junambyeo, and 76 (14.4%) markers showed polymorphism between the introgressed line IR71033 and the recurrent parent IR31917. Introgression analysis re-vealed that at least 14 chromosomal segments throughout the 12 chromosomes were introgressed from O. minuta to IR71033. Using the F2 population containing 146 indi-viduals, a framework linkage map with 149 markers was constructed to identify the QTLs governing morphologi-cal, pigmentation, photoperiod sensitivity and grain-related
traits (Fig. 3). The map covered 1825.9 cM for the 12 chromosomes with an average interval of 12.0 cM be-tween adjacent markers. The order of the markers in each chromosome was consistent with the Nipponbare/Ka-salath map (Harushima et al., 1998). Significant segrega-tion distortion was observed at 41 marker loci (27%) of the 149 markers used, at a significance level of p < 0.05. Some of the distorted markers were randomly distributed along the chromosomes, but they mostly occurred in clus-ters of at least three adjacent loci; these were located on chromosomes, 3, 4, 6, 11, 12 (data not shown). Identification of putative QTLs The significant QTLs identified for the 16 agronomic traits are summarized in Table 4. A total of 36 QTLs were identified by single-point analysis (SPA) and one to five QTLs were detected for each trait. The phenotypic variation explained (PVE) by the QTLs ranged from 8.0% to 33.5%. Most of the QTLs were located in the same or adjacent regions (Fig. 3).
For days to heading (dth), QTLs were identified on chromosome 6 and 8, accounting for 24.1% of the pheno-typic variation. For these QTLs, the IR71033 alleles con-tributed to early heading at these loci. One QTL dtmt6 on chromosome 6 was significantly associated with days to maturity. The IR71033 allele decreased days to maturity and the PVE explained by this QTL was 33.5%. dth and dtmt were clustered in the same position.
One QTL for tiller number (tn) was identified on chro-mosome 3, accounting for 14.1% of the phenotypic varia-tion. The IR71033 allele was associated with increasing

20 QTLs for Agronomic Traits Using an Oryza minuta Introgression Line Table 3. Correlation coefficients between traits in F3 lines derived from crossing IR71033 and Junambyeo.
Traita DTH DTMT TN PN CL PL FLL SPAD SPP SF AL GL GW GLW GTDTH DTMT 0.82** TN -0.06 -0.14 PN 0.33** 0.25** 0.02 CL -0.07 -0.08 0.01 -0.10 PL -0.29** -0.31** -0.15* -0.19** 0.28** FLL 0.09 -0.01 0.04 0.05 0.15* 0.18* SPAD 0.06 0.19* -0.09 -0.07 -0.03 -0.03 -0.11 SPP -0.48** -0.43** -0.07 -0.31** 0.31** 0.54** 0.18* -0.01 SF -0.59** -0.48** -0.13 -0.21** 0.15 0.34** -0.03 0.02 0.73** AL 0.07 0.04 0.04 -0.06 -0.02 0.11 0.11 0.19* -0.07 -0.04 GL -0.23** -0.29** 0.01 -0.05 0.27** 0.56** 0.21* -0.06 0.31** 0.34** 0.16* GW 0.02 -0.03 -0.04 -0.07 -0.08 0.01 -0.08 0.01 0.03 0.10 0.03 -0.13 GLW -0.15* -0.15* 0.02 0.22 0.23* 0.33** 0.18* -0.03 0.17* 0.14 0.07 0.71** -0.78** GT 0.25** 0.18* -0.07 0.19* -0.04 0.01 0.04 0.13 -0.11 -0.07 0.01 0.02 0.52** -0.33** 1000-GT -0.14 -0.22** -0.05 -0.07 0.09 0.46** 0.07 0.03 0.17* 0.24** 0.09 0.52** 0.53** -0.05 0.57**Refer to Table 2 for abbreviations. * and ** indicate significant difference at 0.05 and 0.01 level, respectively. Fig. 2. Frequency distribution of 16 traits in the 146 F3 lines (P1: IR71033-121-15, P2: Junambyeo).

Md Lutfor Rahman et al. 21 Fig. 3. Distribution of QTLs on the molecular linkage map as detected by the Q-genes with circles indicating centromeric regions, black solid bars representing introgressed segments from O. minuta, and italic markers indicating O. minuta-specific introgression QTL (Refer to Table 2 for abbreviations.). tiller number at this locus. QTLs for panicle number (pn), which explained 15.5% of phenotypic variation, were de-tected on chromosomes 4 and 6. The IR71033 allele on chromosome 4 originating from O. minuta increased PN, while the allele on chromosome 6 decreased it. For culm length (cl), QTLs cl6, cl7 and cl12 were mapped on chro-mosomes 6, 7 and 12. Of these, cl12 originated from O. minuta. QTLs located on chromosome 6, 7 and 8 were identified for panicle length (pl). These QTLs accounted for 25.1% PVE, and of these the wild allele at pl6 increased panicle length. For flag leaf length (fll), we detected QTLs on chromosomes 8 and 9. For chlorophyll content, QTLs on chromosome 2 and 12.
For spikelets per panicle (spp), we identified a QTL, which explained 19.3% of phenotypic variation, on chro-mosome 6. The introgressed O. minuta allele increased spikelets per panicle at spp6. One QTL for spikelet fertility (sf) on chromosome 6 was identified and accountd for 19.3% of phenotypic variation. For awn length (al), three QTLs were detected, on chromosome 4, 5 and 9. Total phe-notypic variation explained by the QTLs was 15.5%. The wild allele increased the awn length at two loci, al5 and al9, while Junambyeo increased awn length at al4 locus.
For grain length (gl), five QTLs, on chromosome 3, 5, 6, 7 and 9, were identified; these explained 42% of the pheno-typic variation. The introgressed O. minuta allele increased grain length at gl3, gl6, gl7 and gl9 while the IR71033 al-
lele increased grain length at gl5. QTLs for grain width (gw) were identified on chromosome 2 and 5, which ac-counted for 24.5% of the phenotypic variation. Ther IR71033 allele contributed to low grain width. For the grain length to width ratio (glw), three QTLs, on chromo-some 2, 3 and 6 were identified, which accounted for 34.3% of the phenotypic variation. The introgressed O. minuta allele increased the grain length to width ratio at all of these loci. One QTL for grain thickness was identified on chromosome 12, which accounted for 27.1% for the phenotypic variation. The introgressed O. minuta allele increased grain thickness at gt12. For 1000-grain weight (tgw), four QTLs were detected. The phenotypic variation explained by the QTLs was 27.1%. The wild allele in-creased grain weight at tgw3, tgw7 and tgw11 but IR71033 allele decreased at tgw2 locus. Epistatic interaction between randomly paired two-loci (E-QTLs) A total of 45 significant (p < 0.001) E-QTLs including 4 intra-chromosomal E-QTLs were iden-tified between random markers (Table 5) for most of the traits; (Table 5). Total phenotypic variation explained by the E-QTLs ranged from 7.3% to 42.8%. Of these, only one E-QTL was detected between significant QTLs, namely gl3 and gl6. And 24 E-QTLs contained only one significant QTL on either side. The other 20 E-QTLs did not include any of significant QTLs.

22 QTLs for Agronomic Traits Using an Oryza minuta Introgression Line Table 4. Quantitative trait loci (QTL) identified for 16 traits based on single-point analysis in F3 lines.
PermutationaTrait QTL Chr Linked Marker LOD
95% 99%P PVE
(%) Allelic effect
Days to heading dth6 6 S6050 10.5 2.6 3.3 0.0000 28.1 -15.2 dth8** 8 S80112 4.03 2.4 3.2 0.0001 11.9 -2.7 Total 34.1 Days to maturity dtmt6** 6 S6050 12.9 2.6 3.3 0.0000 33.5 -16.9 Tiller number tn3 3 S302 4.79 2.6 3.7 0.0000 14.1 1.35 Panicle number pn4 4 S4087 3.23 2.5 3.1 0.0007 9.7 1.15 pn6 6 S6070 3.39 2.5 3.0 0.0005 10.1 -0.7 Total 15.5 Culm length cl6** 6 S60100 3.44 2.5 3.2 0.0004 10.3 3.55 cl7** 7 S7048 3.71 2.4 3.1 0.0002 11.1 4.15 cl12* 12 S12094 2.79 2.5 3.2 0.0019 8.4 4.05 Total 20.4 Panicle length pl6 6 S6070 6.7 2.6 3.4 0.0000 19.1 1.9 pl7 7 S7048 4.18 2.4 2.9 0.0001 12.4 1.25 pl8 8 S8016.3 3.12 2.5 3.1 0.0009 9.4 0.8 Total 25.1 Flag leaf length fl8** 8 S8020 2.66 2.4 3.1 0.0027 8.1 1.55 fl9* 9 S9083 2.68 2.3 2.8 0.0024 8.0 1.65 Total 13.8 SPAD chlcn2** 2 S2043 3.23 2.4 3.2 0.0007 9.7 1.1 chcln12* 12 S12071 2.95 2.4 3.1 0.0013 8.9 1.4 Total 15.5 Spikelet per panicle spp6 6 S6065 6.8 2.6 3.2 0.0000 19.3 28.5 Spikelet fertility sf6* 6 S6065 6.77 2.5 3.5 0.0000 19.2 13.6 Awn length al4 4 S4070 7.16 2.7 3.4 0.0000 20.2 -0.85 al5* 5 S5041 4.09 2.4 3.5 0.0001 12.1 0.49 al9 9 S9083 2.88 2.3 3.2 0.0016 8.8 0.43 Total 25.5 Grain length gl3* 3 S3076 6.11 2.6 3.5 0.0000 17.5 0.33 gl5** 5 S5095 4.31 2.5 3.3 0.0001 12.7 0.29 gl6* 6 S6065 3.77 2.5 3.1 0.0002 11.2 0.33 gl7* 7 S7081 6.19 2.4 3.0 0.0000 17.7 0.36 gl9* 9 S9083 2.68 2.4 3.0 0.0024 8.11 0.23 Total 42.0 Grain width gw2** 2 S2057 5.06 2.5 3.1 0.0000 14.8 -0.12 gw5 5 S5033 4.53 2.4 3.2 0.0000 13.3 -0.11 Total 24.5 Grain length/width glw2* 2 S2054 3.77 2.4 3.1 0.0002 11.2 0.18 glw3 3 S3076 4.39 2.5 3.3 0.0001 12.7 0.15 glw5 5 S5041 5.19 2.5 3.2 0.0000 15.1 0.17 Total 34.3 Grain thickness gt12* 12 S12012-26 9.9 2.5 3.5 0.0000 27.1 0.08 1,000-grain weight tgw2** 2 S2057 3.59 2.5 3.4 0.0002 10.7 -0.12 tgw3 3 S3076 2.8 2.6 3.2 0.0019 8.45 0.14 tgw7* 7 S7081 2.95 2.5 3.3 0.0012 8.88 0.12 tgw11* 11 S11064 2.66 2.4 3.2 0.0025 8.05 0.13
Total 27.1
* Potentially novel allele from O. minuta introgression, ** Novel allele from indica parent. PVE = Percent variation explained. a Empirical significance thresholds for declaring a QTL at p = 0.05 and p = 0.01.

Md Lutfor Rahman et al. 23 Table 5. Epistatic interactions between linked markers that affect traits in the F3 lines.
Trait a Chr Marker (i) Chr Marker (j) LOD Ai Di Aj Dj AAij ADij DAij DDij R2 (%)DTH 6 S6050-S6065 6 S60107-S60109 16.0 18.6*** 42.8DTMT 6 S6050-S6065 8 S8060-58075 22.6 15.5*** 34.4TN 3 S302-S3010 8 S8090-S80106 9.3 -0.6* 1.9** -1.9* 24.1 4 S4087-S40100 5 S5045-S5048 11.0 -1.5** 17.3PN 1 S1027-S1035 4 S4087-S40100 9.0 -1.3*** 14.1 5 S5048-S5060 5 S50112-S50116 8.4 -0.9* -1.0*** 1.1*** 1.3** 20.4 6 S6070-S6084 10 S1005-S10013 9.4 1.1** 1.4* 15.8CL 5 S5041-S5048 7 S7042-S7048 8.7 -5.3** 13.9PL 3 S3046-S3059 6 S6065-S6070 8.9 -1.9*** 28.4 4 S4019-S4041 5 S50101-S50112 7.9 -0.8* 1.6*** 13.1SPAD 1 S10135-S10140 2 S2034.6-S2043 9.0 -1.1* -0.8* -1.1* -0.8* -1.1 2.2** 25.4SPP 3 S30120-S30128 6 S6070-S6084 12.2 -26.1*** 20.7** 24.6 6 S6070-S6084 11 S11091-S11104 11.7 -31.8*** 27.4SF 3 S30120-S30128 6 S6070-S6084 12.1 -7.5** -12.1*** 11.7*** -8.2** 33.6 6 S6070-S6084 11 S11078-S11091 9.8 -5.6* 7.2 7 S7042-S7048 10 S10023-S10035 18.1 8.5** -8.8*** 6.0* -10.2* 15.4AL 2 S2034.6-S2043 4 S4041-S4056.1 8.1 -0.3** -0.4* 0.4** -0.3* -0.5** 0.4* -0.6** 23.9 4 S4060.2-S4070 12 S12097-S12109 15.3 -0.9** 0.6* 22.9 5 S5033.6-S5041 5 S50112-S50116 8.1 -0.5** 8.1 1 S1027.3-S1042 11 S1104-S11011 8.0 -0.1* 0.2* -0.2* -0.3** 0.2* -0.2* -0.3** 10.1 1 S1065-S1091.2 5 S5064-S5092 10.8 -0.4*** 0.2* 13.1GL 1 S1027-S1042 11 S11104-S11110 8.0 -0.1* 0.2** -0.3*** 0.2* -0.1* -0.3** 9.6 1 S1091-S10110 5 S5064.-S5092 11.7 -0.5*** 0.2** 0.3** 21.2 3 S3076-S3091 6 S6065-S6070 12.3 -0.3*** -0.2** 0.3* 14.7 5 S5064-S5092 11 S1106.5-S11027 11.6 -0.4*** 11.4 7 S7050-S7061 10 S10072-S10083 10.4 -0.3*** -0.2* 0.4** 12.6 9 S9083-S9090 12 S12091-S12094 12.1 -0.3*** -0.2* 7.21GW 1 S10157-S10160 2 S2013-S2020 7.6 8.7 2 S2093-S20109 10 S10013-S10023 11.2 0.1*** -0.1* 0.1** 0.1*** 13.4 3 S3010-S3020 5 S5033-S5041 11.4 0.1*** 14.9 5 S5020-S5033 6 S6040-S6050 11.9 0.2** -0.1* 16.5GLW 2 S2081-S2093 3 S3076-S3091 10.1 -0.1* -0.2*** 0.1* 0.1* 17.5 3 S3010-S3020 3 S3076-S3091 9.6 -0.2*** 0.1** 16.7 4 S407-S4019.6 5 S5033-S5041 11.9 -0.1* -0.2*** -0.1** 18.2 5 S5033-S5041 11 S11078-S11091 10.2 -0.2*** 11.7GT 1 S10140-S10157 2 S2020-S2034 11.2 0.1*** 0.1*** -0.1* 14.1 3 S30120-S30128 12 S12097-S12109 9.8 0.1*** -0.1* 34.3 5 S500-S5012 12 S12011-S12012 15.8 -0.1*** 21.5TGW 1 S1058-S1065 11 S11055-S11064 8.9 -1.2* 1.4** 7.3 2 S2054-S2057 11 S11045-S11055 9.9 1.5*** 0.9* 1.1* 0.9** 11.8 2 S2057-S2081 11 S11091-S11104 11.2 1.1*** 1.5*** 7.5 2 S2057-S2081 12 S12094-S12097 12.4 1.7*** -1.2** 12.9 3 S3076-S3091 12 S12094-S12097 14.9 -1.8*** -1.3** 14.9 4 S407.1-S4019 7 S7081-S7084 9.4 -1.7** 10.1 8 S8003.6-S80016 10 S10013-S10023 10.3 1.7** 11.3a Refer to Table 2 for abbreviations. Bold markers indicate single QTLs identified by single point analysis (SPA) as in Table 4. *, **, *** denote significance levels of p = 0.05, 0.01, 0.001 respectively. R2 = Total phenotypic variation due to different epistatic interactions.

24 QTLs for Agronomic Traits Using an Oryza minuta Introgression Line Table 6. List of the QTLs identified in this study that occupy similar chromosomal regions to QTLs reported in previous studies.
Traits QTLs Previous studies sharing similar chromosomal regions with the QTLs in the present study
Days to heading
dth6
‘-’ (Doi et al., 1998, Lin et al., 1998, Ishimura et al., 2001, Mei et al., 2003), qDTH-6 (Yamamoto et al., 2001, Cho et al., 2003), Hd6b (Xing et al., 2001)
Tiller number tn3 ‘-’ (Xu et al.,1995, Kobayashai et al., 2003), tn3-1 (Yan et al., 1998), tp3a (Hua et al., 2002) Panicle number
pn4 pn6
qNOP4-2 (Hittalmani et al., 2003) ‘-’ (Liao et al., 2001, Kobayahi et al., 2003), ppl6.1 (Moncada et al., 2001)
Panicle length
pl6 pl7 pl8
qPL-6 (Yamamoto et al.,2001) ‘-’ (Mei et al., 2003) pl8 (Zhuang et al., 1997)
Awn length
al4 al9
qAL4-2 (Gu et al., 2005) awn9 (Linh et al., 2006)
Spikelet per panicle
spp6
‘-’ (Xiao et al., 1996, Li et al., 1999, Mei et al.,2003; 2005), Snp6b (Tan et al., 1997), spn-6 (Lu et al., 1997), qTS6-1 (Cai et al., 2002), qNSS6 (Yamagishi et al., 2002)
Grain width gw5 ‘-’ (Xu et al., 2000, Ge et al.,2005, Wan et al.,2005), gw5 (Xing et al.,2001)
Grain length/width
glw3 glw5
‘-’ (Xu et al, 2000) ‘-’ (Xu et al.,2000)
1000-grain weight tgw3 gw3b (Yu et al., 1997), qTGW3-1 (Hittalmani et al.,2003)
‘-’ means no symbol for related QTLs published. Discussion We have identified 36 putative QTLs, fourteen of which corresponding to previously reported QTLs and are sum-marized in Table 6. The other 22 QTLs were newly identi-fied in this study. Of these, 13 QTLs (cl12, fl9, chcln12, sf6, al5, gl3, gl6, gl7, gl9, glw2, gt12, tgw7, and tgw11) were from wild introgression and 9 (dth8, dtmt6, cl6, cl7, fl8, chlcn2, gl5, gw2, tgw2) from indica parent IR71033. The 13 QTLs from wild introgression were considered to be located on the introgression segments because, of the two consecutive markers making up the interval, only the marker from wild introgression showed a significant asso-ciation with the corresponding phenotype analyzed by SPA .
Although the wild accession was phenotypically inferior to O. sativa, the O. minuta-derived alleles contributed a desirable effect in the elite cultivar background for 19 QTLs (52.8%) out of the 36 identified here. Of these, six occupied similar chromosomal regions to the QTLs de-scribed in previous studies (Table 6). Beneficial alleles from wild rice have been reported in previous QTL studies using wild rices (Brondani et al., 2002; Jin et al., 2005; Moncada et al., 2001; Thomson et al., 2003; Xiao et al., 1998; Yoon et al., 2006).
The number of QTLs related to O. minuta introgressions might be underestimated due to the fact that some of the chromosomal regions harboring some minor O. minuta introgressions might not have been detected with the mark-ers used here. Similar genomic locations of QTL affecting different traits may be attributable to either pleiotropy of
single genes or tight linkage of several genes that individu-ally influence specific traits. In this study, we found eight chromosomal regions where QTLs for different traits were clustered together, and six of them were on the introgressed segments. In a previous study by Xiao et al. (1996), plei-otropy was suggested for three chromosomal regions that were simultaneously associated with 1,000-grain weight and grains per plant or 1,000-grain weight and grains per plant.
A total of 45 significant E-QTLs were identified for all characters (excluding flag leaf length) studied. Of these, 25 E-QTLs contained at least one significant QTL on either side. Though 20 E-QTLs did not include any of the signifi-cant QTLs that had major effects on the relevant traits, they influenced the trait(s) significantly through interactions, suggesting that epistatic interactions are an important ge-netic basis for complex traits such as yield components. In this regard, when we adopt a marker-assisted selection (MAS) strategy in breeding programs, E-QTLs should be taken into consideration, though the process for MAS might be more complicated.
The results obtained in this study indicate that O. minuta contains QTL alleles that are likely to improve agronomi-cally important traits in elite cultivars. The wild species contain an essentially untapped reservoir of agriculturally important genes that must be harnessed for future use (Ammijaju et al., 2006). We suggest that NILs containing individual introgressions associated with positive QTLs from O. minuta should be further developed from this population and evaluated in a wide range of environments,

Md Lutfor Rahman et al. 25 so that QTL versus environment interactions can be as-sessed. Acknowledgment This research was supported by a grant (Code # 20050401034663) from the BioGreen 21 Program, Rural Development Administration, Republic of Korea. References Aluko, G. C., Martinez, J., Tohme, C., Castano, C., Bergman, C.,
et al. (2004) QTL mapping of grain quality traits from the in-terspecific cross Oryza sativa X O. glaberrima. Theor. Appl. Genet. 109, 630−639.
Amante, A. D., Sitch, L. A., Nelson, R., Dalmacio, R. D., Oliva, N. P., et al. (1998) Transfer of bacterial blight and blast resistance from the tetraploid wild rice Oryza minuta to cultivated rice O. sativa. Theor. Appl. Genet. 84, 345−354.
Ammiraju, J. S. S., Luo, M., Goicoechea, J. L., Wang, W., Kudrna, D., et al. (2006) The Oryza bacterial artificial chromosome li-brary resource: construction and analysis of 12 deep-coverage large-insert BAC libraries that represent the 10 genome types of the genus Oryza. Genome Res. 16, 140−147.
Brar, D. S. (2004) Crop scientists use wide crosses to breed into cultivated rice varieties. Rice Today, 1−2.
Brar, D. S. and Khush, G. S. (1997) Alien introgression in rice. Plant Mol. Biol. 35, 35−47.
Brondani, C., Rangel, P. H. N., Brondani, R. P. V., and Ferreira, M. E. (2002) QTL mapping and introgression of yield-related traits from Oryza glumaepatula to cultivated rice (Oryza sa-tiva) using microsatellite markers. Theor. Appl. Genet. 104, 1192−1203.
Cai, H. W. and Morishima, H. (2002) QTL clusters reflect charac-ter associations in wild and cultivated rice. Theor. Appl. Genet. 104, 1217−1228.
Chen, X., Temnykh, S., Xu, Y., Cho, Y. G., and McCouch, S. R. (1997) Development of a microsatellite framework map pro-viding genome-wide coverage in rice (Oryza sativa L.). Theor. Appl. Genet. 95, 553−567.
Cho, Y. C., Suh, J. P., Choi, I. S., Hong, H. C., Baek, M. K., et al. (2003) QTLs analysis of yield and its related traits in wild rice relative Oryza rufipogon. Treat. Crop. Res. 4, 19−29.
Doi, K., Yoshimura, A., and Iwata, N. (1998) RFLP mapping and QTL analysis of heading date and pollen sterility using back cross population between Oryza sativa L and Oryza glaber-rima Steud. Breed. Sci. 48, 395−399.
Ge, X. J., Xing, Y. Z., Xu, C. G., and He, Y. Q. (2005) QTL analy-sis of cooked garmene rice grain elongation, volume expansion, and water absorption using a recombinant inbred population. Plant Breeding 124, 121−126.
Gu, X. Y., Kianian, S. F., Hareland, G. A., Hoffer, B. L., and Floley, M. E. (2005) Genetic analysis of adaptive syndromes interrelated with seed dormacy in weedy rice (Oryza sativa). Theor. Appl. Genet. 110, 1108−1118.
Harushima, Y., Yano, M., Shomura, A., Sato, M., Shimano, T., et al. (1998) A high-density rice genetic map with 2275 markers using a single F2 population. Genetics 148, 479−494.
Hittalmani, S., Huang, N., Courtois, B., Venuprasad, R., Shashid-
har, H. E., et al. (2003) Identification of QTL for growth and grain yield-related traits in rice across nine locations of Asia. Theor. Appl. Genet. 107, 679−690.
Hua, J. P., Xing, Y. Z., Xu, C. G., Sun, X. L., Yu, S. B., et al. (2002) Genetic dissection of an elite rice hybrid revealed that heterozygotes are not always advantageous for performance. Genetics 162, 1885−1895.
Ishii, T., Brar, D. S., Multani, D. S., and Khush, G. S. (1994) Mo-lecular tagging of genes of brown plant hopper resistance and earliness introduced from Oryza australiensis into cultivar rice, O. sativa. Genome 37, 217−221.
Ishimaru, K., Yano, M., Aoki, N., Ono, K., Hirose, T., et al. (2001) Toward the mapping of physiological and agronomic characters on a rice function map: QTL analysis and comparison between QTLs and expressed sequence tags. Theor. Appl. Genet. 102, 793−800.
Jena, K. K. and Kochert, G. S. (1991) Restriction fragment poly-morphism analysis of CCDD genome species of the genus Oryza. Plant. Mol. Biol. 5, 109−118.
Jena, K. K., Khush, G. S., and Kochert, G. (1992) RFLP analysis of rice (Oryza sativa L) introgression lines. Theor. Appl. Genet. 84, 608−616.
Jena, K. K., Pasula, I. C., Rao, Y. K., Varalaxmi, Y., Krishnaiah, K., et al. (2003) Molecular tagging of a gene fro resistance to brown plant hopper in rice (Oryza sativa L.). Euphytica 129, 81−88.
Jin, F. X., Ling, L., Kang, K. H., and Ahn, S. N. (2005) Mapping Quantitative Trait Loci for grain traits using near isogenic line from a cross between Oryza minuta and O. sativa. Korean J. Breed. 37, 221−228.
Kobayashi, S., Fukata, Y., Sato, T., Osaki, M., and Khush, G. S. (2003) Molecular marker dissection of rice (Oryza sativa L.) plant architecture under temperate and tropical climates. Theor. Appl. Genet. 107, 1350−1356.
Lander, E. S., Green, P., Abrahamson, J., Barlow, M. J., Daly, M. J., et al. (1996) RFLP mapping of QTLs for yield and related characters in rice (Oryza sativa L.). Theor. Appl. Genet. 92, 920−927.
Lee, S. Y., Ahn, J. H., Cha, Y. S., Yun, D. W., Lee, M. C., et al. (2006) Mapping of quantitative trait loci for salt tolerance at the seedling stage in rice. Mol. Cells 22, 192−196.
Li, J. Z., Zheng, X. W., Zhu, L. H., He, P., and Lu, R. L. (1999) Identification and interaction analysis of six agronomic trait loci of rice based on a recombinant inbred population. Acta Bot. Sinica. 41, 1199−1203.
Liao, C. Y., Wu, P., Hu, B., and Yi, K. K. (2001) Effects of genetic background and environment on QTLs and epistasis for rice (Oryza sativa L.) panicle number. Theor. Appl. Genet. 103, 104−111.
Lin, S. Y., Sasaki, T., and Yano, M. (1998) Mapping of quantita-tive trait loci controlling seed dormancy and heading date in rice, Oryza sativa L., using back cross inbred lines. Theor. Appl. Genet. 96, 997−1003.
Linh, L. H., Jin, F. X., Kang, K. H., Lee, Y. T., Kwon, S. J., et al. (2006) Mapping quantitative trait loci for heading date and awn length using an advanced backcross line from a cross be-tween Oryza sativa and O. minuta. Breed. Sci. 56, 341−349.
Liu, G., Lu, G., Zeng, L., and Wang, G. L. (2002) Two broad-spectrum blast resistance genes, Pi9(t) and Pi2(t), are physi-cally linked on rice chromosome 6. Mol. Genet. Genomics 267,

26 QTLs for Agronomic Traits Using an Oryza minuta Introgression Line
472−480. Lu, C. F., Slen, L. H., Tan, Z. B., Xu, Z. B., He, P., et al. (1997)
Comparative mapping of QTLs for agronomic traits of rice across environments by using a double haploid population. Theor. Appl. Genet. 94, 145−150.
Mei, H. W., Luo, L. J., Ying, C. S., Wang, Y. P., Yu, X. Q., et al. (2003) Gene actions of QTLs affecting several agronomic traits resolved in a recombinant inbred rice population and two test cross populations. Theor. Appl. Genet. 107, 89−101.
Mei, H. W., Li, Z. K., Shu, Q. Y., Guo, L. B., Wang, Y. P., et al. (2005) Gene actions of QTLs affecting several agronomic traits resolved in a recombinant inbred rice population and two back cross populations. Theor. Appl. Genet. 110, 649−659.
Moncada, P., Martinez, C. P., Borrero, J., Chatel, M., Gauch, J. H., et al. (2001) Quantitative trait loci for yield and yield compo-nents in an Oryza sativa x Oryza rufipogon BC2F2 population evaluated in an upland environment. Theor. Appl. Genet. 102, 41−52
Multani, D. S., Khush, G. S., Delosreys, B. G., and Brar, D. S. (2003) Alien genes introgression and development of mono-somic alien addition lines from Oryza latifolia Desv to rice, Oryza sativa L. Theor. Appl. Genet. 107, 339−405
Nelson, J. C. (1997) QGENE: software for marker-based genomic analysis and breeding. Mol. Breed. 3, 239−245.
Suh, J., Ahn, S. N., Cho, Y. C., Kang, K. H., Choi, I. M., et al. (2005) Mapping for QTLs for yield traits using an advanced backcross population from a cross between Oryza sativa and O. glaberrima. Korean J. Breed. 37, 214−220.
Tan, Z. B., Shen, L. S., Yuan, Z. L., Lu, C. F., and Chen, Y. (1997) Identification of QTLs for ratooning ability and grain yield traits of rice and analysis of their genetic effects. Acta Agronomica Sinica. 23, 289−295.
Tanksley, S. D. (1993) Mapping polygenes. Ann. Rev. Genet. 27, 205−233.
Temnykh, S., Park, W. D., Ayres, N., Catinhour, S., Hauck, N., et al. (2000) Mapping and genome organization of microsatellite sequences in rice (Oryza sativa L.). Theor. Appl. Genet. 100, 697−712.
Thomson, M. J., Tai, T., McClung, A. M., Lai, X. H., Hinga, M. E., et al. (2003) Mapping quantitative trait loc for yield com-ponents and morphological traits in an advanced backcross population between O. rufipogon and the Oryza sativa cultivar Jefferson. Theor. Appl. Genet. 107, 479−493.
Tian, F., Li, D. J., Qiang, F., Zu, Z. F., Fu, Y. C., et al. (2006) Construction of introgression lines carrying wild rice (Oryza rufipogon Griff.) segments in cultivated rice (Oryza sativa L.) background and characterization of Introgressed segments as-sociated with yield-related traits. Theor. Appl. Genet. 112, 570−580.
Wan, X. Y., Wan, J. M., Weng, J. F., Jiang, L., Bi, J. C., et al. (2005) Stability of QTLs for rice grain dimension and en-dosperm chalkiness characteristics across eight environments.
Theor. Appl. Genet. 110,1334−1346. Wang, D. L., Zhu, J., Li, Z. K., and Paterson, A. H. (2001) A
computer software for mapping quatitative trait loci QTLs with main effects and QTL x environment interactions. Copyright by Zhejiang University, Hangzhou, China.
Xiao, J., Li, J., Yuan, L., and Tanksley, S. D. (1996) Identification of QTLs affecting traits of agronomic importance in a recom-binant inbred population derived from a subspecific rice cross. Theor. Appl. Genet. 92, 230−244.
Xiao, J., Li, J., Grandillo, S., Ahn, S. N., Yuan, L., et al. (1998) Identification of trait improving quantitative trait loci alleles from a wild rice relative, Oryza rufipogon. Genetics 150, 899− 909.
Xing, Y. Z., Xu, C. G., Hua, J. P., Tan, Y. F., and Sun, X. L. (2001) Mapping and isolation of quantitative trait loci controlling plant height and heading date in rice. Acta Bot. Sincia. 43, 721−726.
Xiong, L. Z., Liu, K. D., Dai, X. K., Xu, C. G., and Zhang, Q. (1999) Identification of genetic factors controlling domestica-tion-related traits of rice using an F2 population of a cross be-tween Oryza sativa and O rufipogon. Theor. Appl. Genet. 98, 243−251.
Xu, Y., Shen, Z., Xu, J., Zhu, H., Chen, Y., et al. (1995) Interval mapping of quantitative trait loci by molecular markers in rice (Oryza sativa L). Sci. China 38, 422−428.
Xu, C. G., Yu, S. B., Zhang, Q., Li, J. X., Xing, Y. Z., et al. (2000) Genetic bases of appearance quality of rice grains in Shanyou 63, an elite rice hybrid. Theor. Appl. Genet. 101, 823−829.
Yamagishi, M., Takeuchi, Y., Kono, I., and Yano, M. (2002) QTL analysis for panicle characteristics in temperate japonica rice. Euphytica 128, 219−224.
Yamamoto, T., Taguch, S. F., Ukai, Y., Sasaki, T., and Yano, M. (2001) Mapping quantitative trait loci for days to heading, and culm, panicle and internode lengths in a BC1F3 population us-ing an elite rice variety, Koshikari, as the recurrent parent. Breed. Sci. 51, 63−71.
Yan, J. Q., Zhu, J., He, C. X., Benmoussa, M., and Wu, P. (1998) Quantitative trait loci analysis for the developmental behavior of tiller number in rice (Oryza sativa L.). Theor. Appl. Genet. 97, 267−274.
Yoon, D. B., Kang, K. H., Kim, H. J., Ju, H. G., Kwon, S. J., et al. (2006) Mapping quantitative trait loci for yield components and morphological traits in an advanced backcross population between Oryza grandiglumis and the O. sativa japonica culti-var Hwaseoungbyeo. Theor. Appl. Genet. 112, 1052−1062.
Yu, S. B., Li, J. X., Xu, C. G., Tan, Y. F., Gao, Y. J., et al. (1997) Importance of epistasis as the genetic basis of heterosis in an elite rice hybrid. Proc. Natl. Acad. Sci. USA 94, 9226−92331.
Zhuang, J. Y., Lin, H. X., Lu, J., Qian, H. R., Hittalmani, S., et al. (1997) Analysis of QTL x environment interaction for yield components and plant height in rice. Theor. Appl. Genet. 95, 799−808.