Embed Size (px)
Citation preview

Northeast Fisheries Science Center Reference Document 01-14
October 2001
Identificationof Seasonal Area
Management Zonesfor North Atlantic
Right Whale Conservation
by
Richard L. Merrick, Phillip J. Clapham,Timothy V.N. Cole, Patricia Gerrior,
and Richard M. Pace, III

00-13 Northeast Fisheries Science Center Publications, Reports, and Abstracts for Calendar Year 1999. By L. Garnerand J.A. Gibson. September 2000.
00-14 Report of the 31st Northeast Regional Stock Assessment Workshop (31st SAW): Public Review Workshop. [Bythe 31st Northeast Regional Stock Assessment Workshop.] October 2000.
00-15 Report of the 31st Northeast Regional Stock Assessment Workshop (31st SAW): Stock Assessment ReviewCommittee (SARC) Consensus Summary of Assessments. [By the 31st Northeast Regional Stock AssessmentWorkshop.] October 2000.
00-16 Assessment of the Georges Bank Winter Flounder Stock, 1982-1987. By R.W. Brown, J.M. Burnett, G.A. Begg,and S.X. Cadrin. [A report of Northeast Regional Stock Assessment Workshop No. 28.] December 2000.
00-17 Assessment of the Georges Bank Atlantic Cod Stock for 2000. By L. O'Brien and N.J. Munroe. [A report of the 3rdTransboundary Resources Assessment Committee Meeting.] December 2000.
01-01 Description of the 2000 Oceanographic Conditions on the Northeast Continental Shelf. By M.H. Taylor and C.Bascuñán. February 2001.
01-02 Update Assessment of American Plaice in the Gulf of Maine - Georges Bank Region for 2000. By L. O'Brien andC. Esteves. [A report of Northeast Regional Stock Assessment Workshop No. 32.] February 2001.
01-03 Assessment of the Silver Hake Resource in the Northwest Atlantic in 2000. By J.K.T. Brodziak, E.M. Holmes,K.A. Sosebee, and R.K. Mayo. [A report of Northeast Regional Stock Assessment Workshop No. 32.] March 2001.
01-04 Report of the 32nd Northeast Regional Stock Assessment Workshop (32nd SAW): Public Review Workshop.[By the 32nd Northeast Regional Stock Assessment Workshop.] April 2001.
01-05 Report of the 32nd Northeast Regional Stock Assessment Workshop (32nd SAW): Stock Assessment ReviewCommittee (SARC) Consensus Summary of Assessments. [By the 32nd Northeast Regional Stock AssessmentWorkshop.] April 2001.
01-06 Defining Triggers for Temporary Area Closures to Protect Right Whales from Entanglements: Issues and Op-tions. By P.J. Clapham and R.M. Pace, III. April 2001.
01-07 Proceedings of the 14th Canada-USA Scientific Discussions, January 22-25, 2001, MBL Conference Center,Woods Hole, Massachusetts. By S. Clark and R. O'Boyle, convenors. May 2001.
01-08 TRAC Advisory Report on Stock Status: A Report of the Fourth Meeting of the Transboundary ResourcesAssessment Committee (TRAC), St. Andrews Biological Station, St. Andrews, New Brunswick, April 17-20,2001. [By the 4th Transboundary Resources Assessment Committee Meeting.] July 2001.
01-09 Results of a Field Collection of Biopsy Samples from Coastal Bottlenose Dolphin in the Mid-Atlantic. By J.Nicolas, D.C. Potter, C.W. Potter, and P.E. Rosel. July 2001.
01-10 Assessment of the Georges Bank Atlantic Cod Stock for 2001. By L. O'Brien and N.J. Munroe. [A report of the 4thTransboundary Resources Assessment Committee Meeting.] July 2001.
01-11 Protocol and Guide for Estimating Nucleic Acids in Larval Fish Using a Fluorescence Microplate Reader. ByE.M. Caldarone, M. Wagner, J. St. Onge-Burns, and L.J. Buckley. July 2001.
01-12 Northeast Fisheries Science Center Publications, Reports, and Abstracts for Calendar Year 2000. By L. Garnerand J.A. Gibson. August 2001.
01-13 Elemental Composition of Fish Otoliths: Results of a Laboratory Intercomparison Exercise. By V.S. Zdanowicz.September 2001.
Recent Issues in This Series:

Northeast Fisheries Science Center Reference Document 01-14
U.S. DEPARTMENT OF COMMERCENational Oceanic and Atmospheric Administration
National Marine Fisheries ServiceNortheast Region
Northeast Fisheries Science CenterWoods Hole, Massachusetts
October 2001
Identificationof Seasonal Area Management Zones
for North Atlantic Right Whale Conservation
by
Richard L. Merrick, Phillip J. Clapham, Timothy V.N. Cole,Patricia Gerrior, and Richard M. Pace, III
National Marine Fisheries Serv., 166 Water St., Woods Hole, MA 02543

This series is a secondary scientific literature series designed to assure the long-term documenta-tion and to enable the timely transmission of research results by Center and/or non-Centerresearchers, where such results bear upon the research mission of the Center (see the outside backcover for the mission statement). These documents receive internal scientific review but no technicalor copy editing. The National Marine Fisheries Service does not endorse any proprietary material,process, or product mentioned in these documents.
To obtain additional paper copies of documents in this series, contact the senior Center authorof the desired document. Refer to the title page of the desired document for the senior Center author'sname and mailing address. If there is no Center author, or if there is corporate (i.e., non-individualized) authorship, then contact the Center's Woods Hole Laboratory Library (166 Water St.,Woods Hole, MA 02543).
To access electronic copies of documents in this series, go to http://www.nefsc.nmfs.gov/nefsc/publications/, choose the "Selected, Full-Text, Online Publications" link, then scroll down to thecurrent-year section of the list of titles to find the document.
This report's publication history is as follows: manuscript submitted for review--September 26,2001; manuscript accepted through technical review--October 9, 2001; manuscript accepted throughpolicy review--October 15, 2001; and camera-ready copy submitted for publication--October 15,2001. This report may be cited as:
Merrick, R.L.; Clapham, P.J.; Cole, T.V.N.; Gerrior, P.; Pace, R.M., III. 2001. Identification of seasonal areamanagement zones for North Atlantic right whale conservation. Northeast Fish. Sci. Cent. Ref. Doc. 01-14;18 p. Available from: National Marine Fisheries Service, 166 Water St., Woods Hole, MA 02543-1026.
Northeast Fisheries Science Center Reference Documents

iii
TABLE OF CONTENTS
EXECUTIVE SUMMARY . . . . . . . . . . . . . . . . . . . . . . . . . . . . . . . . . . . . . . . . . . . . . . . . . . . . . . v
INTRODUCTION . . . . . . . . . . . . . . . . . . . . . . . . . . . . . . . . . . . . . . . . . . . . . . . . . . . . . . . . . . . . . 1
METHODS . . . . . . . . . . . . . . . . . . . . . . . . . . . . . . . . . . . . . . . . . . . . . . . . . . . . . . . . . . . . . . . . . . 2Surveys . . . . . . . . . . . . . . . . . . . . . . . . . . . . . . . . . . . . . . . . . . . . . . . . . . . . . . . . . . . . . . . . 2Analysis . . . . . . . . . . . . . . . . . . . . . . . . . . . . . . . . . . . . . . . . . . . . . . . . . . . . . . . . . . . . . . . 2
RESULTS . . . . . . . . . . . . . . . . . . . . . . . . . . . . . . . . . . . . . . . . . . . . . . . . . . . . . . . . . . . . . . . . . . . 4Sightings . . . . . . . . . . . . . . . . . . . . . . . . . . . . . . . . . . . . . . . . . . . . . . . . . . . . . . . . . . . . . . 4Events . . . . . . . . . . . . . . . . . . . . . . . . . . . . . . . . . . . . . . . . . . . . . . . . . . . . . . . . . . . . . . . . . 4Seasonal Area Management Zones . . . . . . . . . . . . . . . . . . . . . . . . . . . . . . . . . . . . . . . . . . 4
DISCUSSION . . . . . . . . . . . . . . . . . . . . . . . . . . . . . . . . . . . . . . . . . . . . . . . . . . . . . . . . . . . . . . . . 5
ACKNOWLEDGMENTS . . . . . . . . . . . . . . . . . . . . . . . . . . . . . . . . . . . . . . . . . . . . . . . . . . . . . . . 6
LITERATURE CITED . . . . . . . . . . . . . . . . . . . . . . . . . . . . . . . . . . . . . . . . . . . . . . . . . . . . . . . . . 7
TABLESTable 1. North Atlantic right whale surveys and sightings by year--1999-2001. . . . . . . . 8Table 2. North Atlantic right whale sightings and events by month. . . . . . . . . . . . . . . . . 8
FIGURESFigure 1. Sightings, events, and buffers for 1999. . . . . . . . . . . . . . . . . . . . . . . . . . . . . . . 9Figure 2. Sightings, events, and buffers for 2000. . . . . . . . . . . . . . . . . . . . . . . . . . . . . . 10Figure 3. Sightings, events, and buffers for 2001. . . . . . . . . . . . . . . . . . . . . . . . . . . . . . 11Figure 4. Frequency of events by size . . . . . . . . . . . . . . . . . . . . . . . . . . . . . . . . . . . . . . 12Figure 5. Overall SAM definition based on 1999-2001 events. . . . . . . . . . . . . . . . . . . . 13Figure 6. Overall SAM definition based on 1999-2001 buffers. . . . . . . . . . . . . . . . . . . 14Figure 7. Annual SAM definitions for 1999-2001. . . . . . . . . . . . . . . . . . . . . . . . . . . . . 15Figure 8. Aggregate SAM zone with 1999-2001 sightings overlaid. . . . . . . . . . . . . . . . 16Figure 9. Two potential SAM zones with 1999-2001 sightings events overlaid . . . . . . 17Figure 10. Seasonal distribution of right whale events with potential SAM
zone overlaid . . . . . . . . . . . . . . . . . . . . . . . . . . . . . . . . . . . . . . . . . . . . . . . . . . . . 18

v
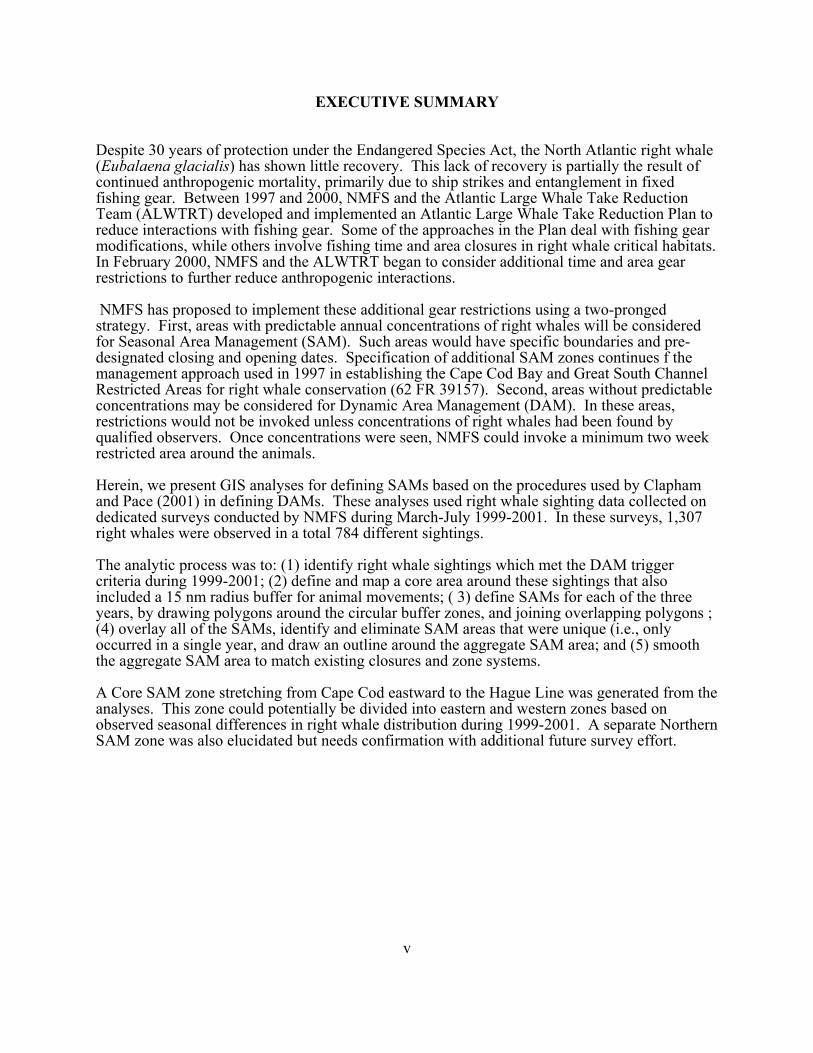
EXECUTIVE SUMMARY
Despite 30 years of protection under the Endangered Species Act, the North Atlantic right whale(Eubalaena glacialis) has shown little recovery. This lack of recovery is partially the result ofcontinued anthropogenic mortality, primarily due to ship strikes and entanglement in fixedfishing gear. Between 1997 and 2000, NMFS and the Atlantic Large Whale Take ReductionTeam (ALWTRT) developed and implemented an Atlantic Large Whale Take Reduction Plan toreduce interactions with fishing gear. Some of the approaches in the Plan deal with fishing gearmodifications, while others involve fishing time and area closures in right whale critical habitats. In February 2000, NMFS and the ALWTRT began to consider additional time and area gearrestrictions to further reduce anthropogenic interactions.
NMFS has proposed to implement these additional gear restrictions using a two-prongedstrategy. First, areas with predictable annual concentrations of right whales will be consideredfor Seasonal Area Management (SAM). Such areas would have specific boundaries and pre-designated closing and opening dates. Specification of additional SAM zones continues f themanagement approach used in 1997 in establishing the Cape Cod Bay and Great South ChannelRestricted Areas for right whale conservation (62 FR 39157). Second, areas without predictableconcentrations may be considered for Dynamic Area Management (DAM). In these areas,restrictions would not be invoked unless concentrations of right whales had been found byqualified observers. Once concentrations were seen, NMFS could invoke a minimum two weekrestricted area around the animals.
Herein, we present GIS analyses for defining SAMs based on the procedures used by Claphamand Pace (2001) in defining DAMs. These analyses used right whale sighting data collected ondedicated surveys conducted by NMFS during March-July 1999-2001. In these surveys, 1,307right whales were observed in a total 784 different sightings.
The analytic process was to: (1) identify right whale sightings which met the DAM triggercriteria during 1999-2001; (2) define and map a core area around these sightings that alsoincluded a 15 nm radius buffer for animal movements; ( 3) define SAMs for each of the threeyears, by drawing polygons around the circular buffer zones, and joining overlapping polygons ;(4) overlay all of the SAMs, identify and eliminate SAM areas that were unique (i.e., onlyoccurred in a single year, and draw an outline around the aggregate SAM area; and (5) smooththe aggregate SAM area to match existing closures and zone systems.
A Core SAM zone stretching from Cape Cod eastward to the Hague Line was generated from theanalyses. This zone could potentially be divided into eastern and western zones based onobserved seasonal differences in right whale distribution during 1999-2001. A separate NorthernSAM zone was also elucidated but needs confirmation with additional future survey effort.


INTRODUCTION
Despite 30 years of protection under the Endangered Species Act, the North Atlantic right whale(Eubalaena glacialis) has shown little recovery. Indeed, recent analyses suggest that survivalrates and population abundance levels have declined (Caswell et al. 1999). Lack of recovery ispartially due to continued anthropogenic mortality, due primarily to ship strikes andentanglement in fixed fishing gear (National Marine Fisheries Service [NMFS] 1991). The1994 amendments to the Marine Mammal Protection Act provided for the development of takereduction plans to reduce interactions with commercial fishing gear. On July 22, 1997, NMFSpublished an Atlantic Large Whale Take Reduction Plan and also interim final regulationsimplementing this Plan (62 FR 39157). The Plan contained a number of approaches to reducinggear interactions. Some dealt with modifications to fishing gear, while others dealt with fishingtime and area closures in critical right whale habitat areas. Since 1997, NMFS and the AtlanticLarge Whale Take Reduction Team (ALWTRT) have monitored right whale-fishing gearinteractions. Significant changes to the gear modifications included in the Plan were made inFebruary 1999 (64 FR 7529) and in December 2000 (65 FR 80368). In February 2000, NMFSand the ALWTRT began to consider additional time and area gear restrictions to further reduceinteractions.
NMFS has proposed to implement these additional gear restrictions using a two-prongedstrategy. First, areas with predictable annual concentrations of right whales will be consideredfor Seasonal Area Management (SAM). Such areas would have specific boundaries and pre-designated . Specification of additional SAM zones continues the management approach used in1997 in establishing the Cape Cod Bay and Great South Channel Restricted Areas for rightwhale conservation (62 FR 39157). Second, areas without predictable concentrations may beconsidered for Dynamic Area Management (DAM). In these areas, restrictions would not beinvoked unless concentrations of right whales had been found by qualified observers. Onceconcentrations were seen, NMFS could invoke a minimum two week restricted area around theanimals.
One of the first steps in developing area closures is to determine a suitable threshold density ofright whales which would trigger implementation of such closures . Following considerablediscussion by the ALWTRT and completion of a research study by NMFS scientists (Claphamand Pace 2001), the threshold density trigger was specified as a minimum of 3 right whaleswithin a 75nm2 area (ca. 0.04 right whales per nm2). Also specified was the size of an areanecessary to contain a right whale’s movements over a 1-2 week period. This was a 15nm radiuszone.
The Clapham and Pace (2001) study was used to design DAM zones. Here we present additionalanalyses for defining SAMs. First, we provide a brief summary of the 1999-2001 NMFS NorthAtlantic right whale survey results. Secondly, we define geographic areas in the Gulf of Maine,based on the trigger and buffer size analyses of Clapham and Pace (2001), that could beconsidered as potential North Atlantic right whale Seasonal Area Management zones.

2
METHODS
Surveys
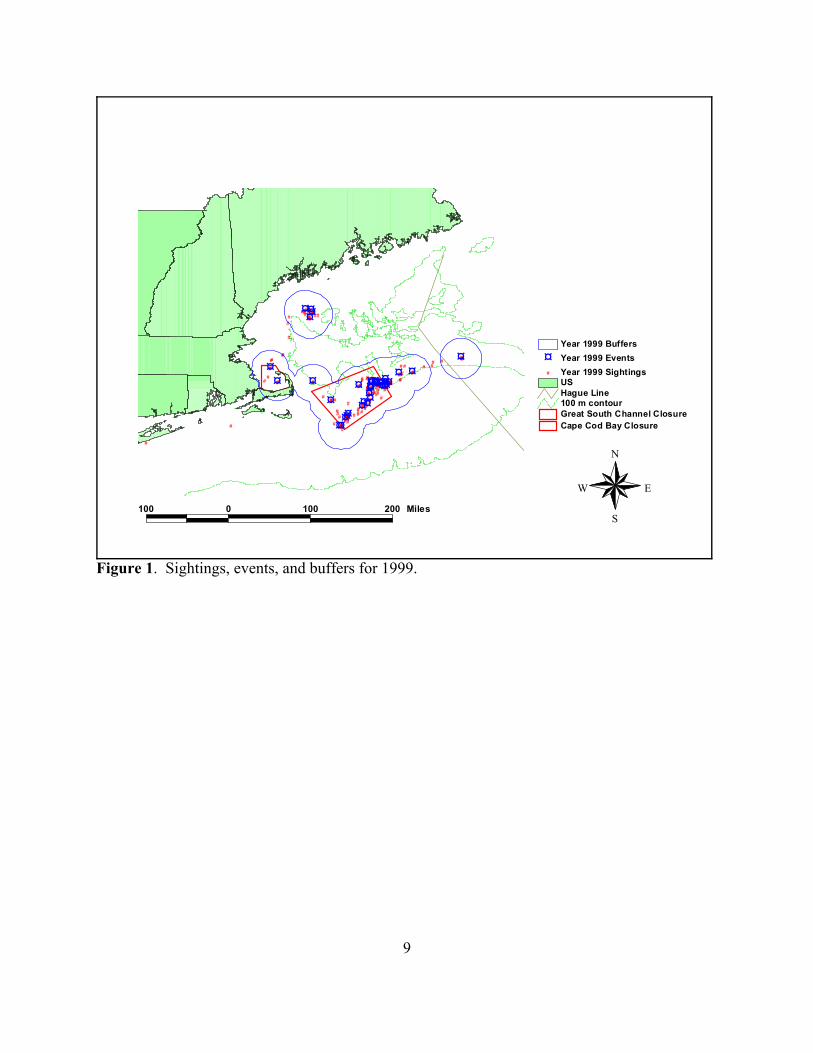
Directed aerial surveys for North Atlantic right whales were conducted by NMFS during March-July, 1999-2001 in the area from south of Nantucket, MA northward to the Bay of Fundy, andfrom the New England coast eastward to the Hague Convention Line (Fig. 1). The surveys wereaccomplished using two high-wing, twin-engine fixed wing aircraft. One was a NOAADeHaviland Twin Otter, and the other was a chartered amphibious Grumman Widgeon (1999) orGoose (2000-2001). Surveys were flown at ca. 230 m (1999-2000) or 310 m (2001) altitude, and100 kts (185 km/hr). Flights were conducted by at least one aircraft on virtually all days whensighting conditions were Beaufort 3 or better, but were not performed when visibility was pooror obscured (snow, rain or fog).
During 1999-2000, flights were either flown along tracklines developed for SCOPEX (SouthChannel Ocean Productivity Experiment; Beardsley et al. 1993; Kenney 1993) in the GreatSouth Channel area, or were directed towards areas of reported or suspected right whaleconcentrations. In 2001, one aircraft flew a monthly series of east-west track lines whichoverlaid the entire study area, while the second aircraft surveyed the Great South Channel areaand other offshore areas.
Survey protocols for the two aircraft were similar. Each typically carried two observers and arecorder (in addition to two pilots). The observers made continuous observations out of bothsides of the aircraft, with all sightings recorded on a laptop computer by the recorder. When rightwhales, other marine mammals, marine turtles, sharks, or fish schools were seen, the observerprovided the recorder with the number of animals observed by species, and other ancillaryinformation . Because the computer software had a direct GPS link, the location, date, and timeof all sightings were automatically recorded when observations were entered. When right whaleswere seen, the aircraft typically broke off the survey path to obtain 35 mm or digital photographsof the animals for photo-identification.
Post-survey, the electronic survey data sets were audited /corrected based on in-flight notes andedited for reasonableness. The data were then reformatted for analysis.
Analysis
Analysis of the right whale sightings data involved the following steps: :
1. Identify those right whale sightings which met the trigger criteria (= events)2. Define and map the core area 3. Define a 15 nm radius buffer around the core4. For each year, draw polygon around the circular buffer zones, and join overlappingpolygons5. Overlay the SAM areas from all three years, eliminate the SAM areas that occurredonly once during the three years, and draw an outline around the remaining SAM areas6. Smooth the remaining areas to account for existing closures and zone systems

3
Sightings from every survey day during 1999-2001 were reviewed to identify events sufficient totrigger a Dynamic Area Management closure. The trigger used was a sighting of three or moreright whales sufficiently close to one another to achieve a density of 0.04 right whales/nm2
(Clapham and Pace 2001). This is equivalent to a minimum of 3 whales within a 75 nm2 area.The latitude, longitude, number of animal involved, and date and time of each event ) wererecorded in a dBase data set, and the events plotted using ARCView 3.1.
Whales sighted in an event were assumed to occupy a circular core area with an average densityof 0.04 right whales/nm2. This core area was mapped by defining a circle around the centroid ofthe event. The core area varied directly with the number of animals sighted. That is, if 3 whaleswere sighted in an event the core area was ca. 75 nm2 (4.9 nm radius), with the area increasing to100 nm2 (5.6 nm radius) for 4 animals, 125 nm2 (6.3 nm radius) for 5 whales, etc.
A 15 nm radius buffer was then drawn around each core area to account for animal movements(Clapham and Pace 2001). An event with 3 animals and a core area of 75 nm2 (4.9 nm radius)would then have a full circular protection zone of 1,244 nm2 (4.9 nm radius + 15nm radius =19.9 nm radius; full protection circular zone area = ( r2 = 1,244 nm2 ) .
SAM zones were mapped for each analysis year (1999-2001) by drawing a simple polygonaround each buffer area. Overlapping or adjoining polygons were joined. This produced threeannual sets of SAM zones.
What distinguishes DAM and SAM is the predictability of whale concentrations. The Cape CodBay and Great South Channel Restricted Areas are examples of SAM zones as they were basedon sightings of right whales reoccurring year after year in these areas. In our analyses, an areawas considered to be a candidate SAM area if right whales were observed in this area duringspring in all three years. If whales were observed in an area in only one year or in differentmonths in different years, then this area was not considered as a candidate SAM area. Weoverlaid all three years of SAM areas, eliminated areas which were applicable to only one year,and drew boundaries around zones for the aggregate of years.
Finally, it was recognized that a number of groundfish and protected species management areasalready exist in the Gulf of Maine. NMFS and the New England Fishery Management Counciltypically use a quarter degree square grid to align these zones (for ease of interpretation). Thefinal boundaries of the SAM areas were therefore reconfigured somewhat so as to align withthese with existing management areas.
Areas of the SAMs were calculated in ARCView 3.1 using the U.S. referenced Albers EqualArea Conical Projection.

4
RESULTS
Sightings
A total of 1,307 right whales were enumerated in 784 sightings during the 1999-2001 NMFSaerial surveys (Table 1). This total does not include sightings by the Center for Coastal Studieswhich surveyed the Cape Cod Bay Restricted Area. As a result, the NMFS surveys contain veryfew sightings of right whales in Cape Cod Bay, even though right whales commonly occur in theBay during late winter-early spring.
Few animals were seen outside of Cape Cod Bay in March (1.8%) or July (5.6%; Table 2). Mostanimals were seen in May (43.8%), June (32.3%) and April (16.4%), due in part to greatersighting effort in these months.
Survey sightings in March-April (Figures 1-3) tended to be in the areas surrounding Cape Cod,MA (e.g., Provincetown Slope). By May, however, right whales were regularly sighted alongthe northern edge of Georges Bank and in the Great South Channel. Animals were consistentlyseen in all three years in these areas and in the Wilkinson Basin through June, with a tendencyfor animals to be seen further north as the season progressed. During April and June in 1999 and2000, right whale concentrations were observed in the Cashes Ledge area. However, similarconcentrations were not found in any month during 2001 (despite survey coverage of the CashesLedge area in three months).
Events
Concentrations of right whales meeting the triggering criteria occurred 149 times during 1999-2001. This included 38, 42, and 69 events in 1999-2001, respectively (Table 1). The number ofevents peaked in May (67 events or 45% ), followed by June (44 events or 30% ) and April (23events or 15%) (Table 2). The fewest events occurred in July (9 events, 6%) and March (6events, 4% %.
The number of whales in events that met the trigger criteria ranged from 3 to 29 (Fig. 4). Theaverage number of whales in an event was 6.2 and average group size varied little among years(5.7 to 6.7; Table 1). Average group size was smallest in March (3.8), and ranged between 5.8and 7.3 during r April through July (Table 2).
Seasonal Area Management Zones
A geographic zone drawn to encompass all 149 events (without buffers) during March-July1999-2001 enclosed a total area of about 10,200 nm2 (Fig 5). Enlarging the zone to include thebuffer areas around the events (Fig. 6) increased the zone size to 17,000 nm2 (Fig. 6).
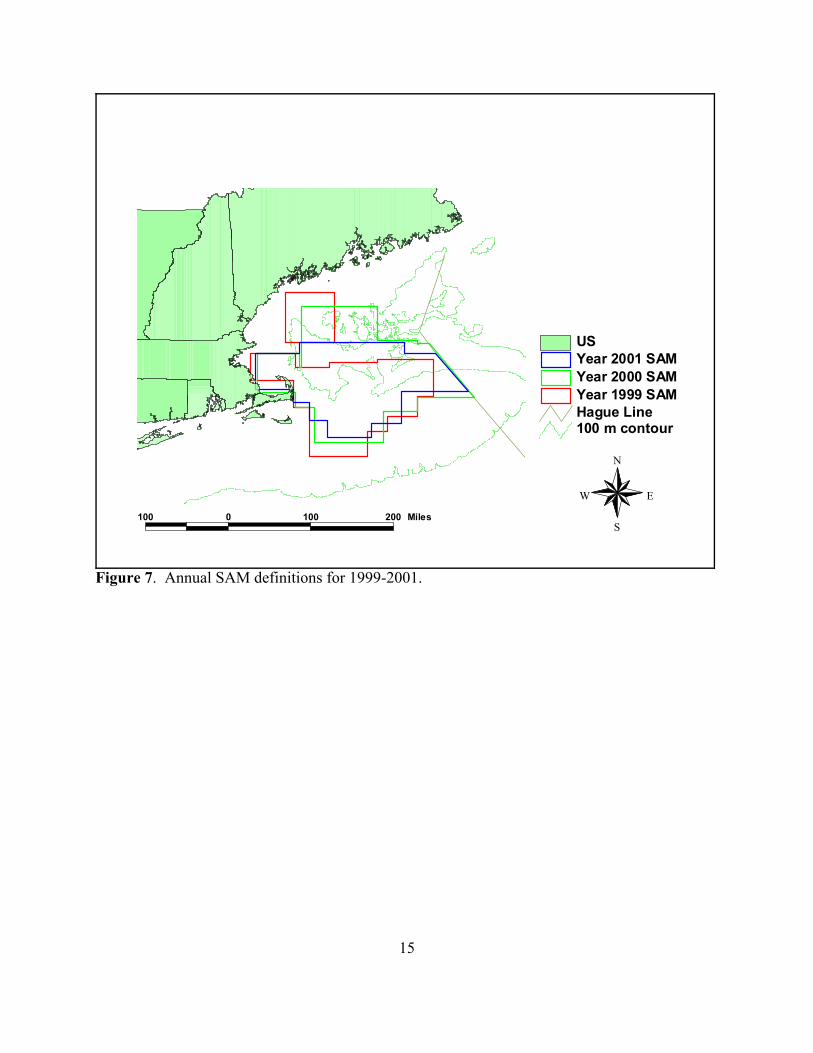
Comparing SAM zones among the three years (Fig. 7) revealed a consistent pattern in habitatuse in areas outside of the Great South Channel and Cape Cod Bay. Whales were consistentlyseen in all three years in the area from Cape Cod eastward to the Hague Line, but onlysporadically occurred to the north (e.g., the Cashes Ledge Area).

5
Aggregating the three annual SAM zones together (but excluding areas where animals were seenonly once in the three years), yielded the aggregate SAM zone shown in Figure 8. Almost all of784 right whale sightings during the 1999-2001 NMFS aerial surveys occurred within thisaggregate zone.
Smoothing and realigning the aggregate SAM boundaries with existing management areas produced two possible SAM zones (Fig. 9). One is the Core zone (ca. 7,000 nm2 ) which extendseastward from Cape Cod to the Hague Line and is where right whales were consistently sightedin all three years. The other area is the Northern zone (ca. 1,700 nm2 ), located to the north of theCore zone, where right whale sightings occurred sporadically in some months in two of the threesurvey years.
The Core zone, in combination with the existing Cape Cod Bay (CCB) and Great South Channel(GSC) Restricted Areas, encompasses 134 (90%) of the 149 events during 1999-2001. Of the 15events not included, 4 were from 1999 (3 April, 1 May), and 11 from 2000 (all June). All eventsfrom 2001 occurred in the combined Core/Restricted Area zone. Of the 784 sightings, only 94(12%) occurred outside of this zone, with 64 of these sightings of single animals.
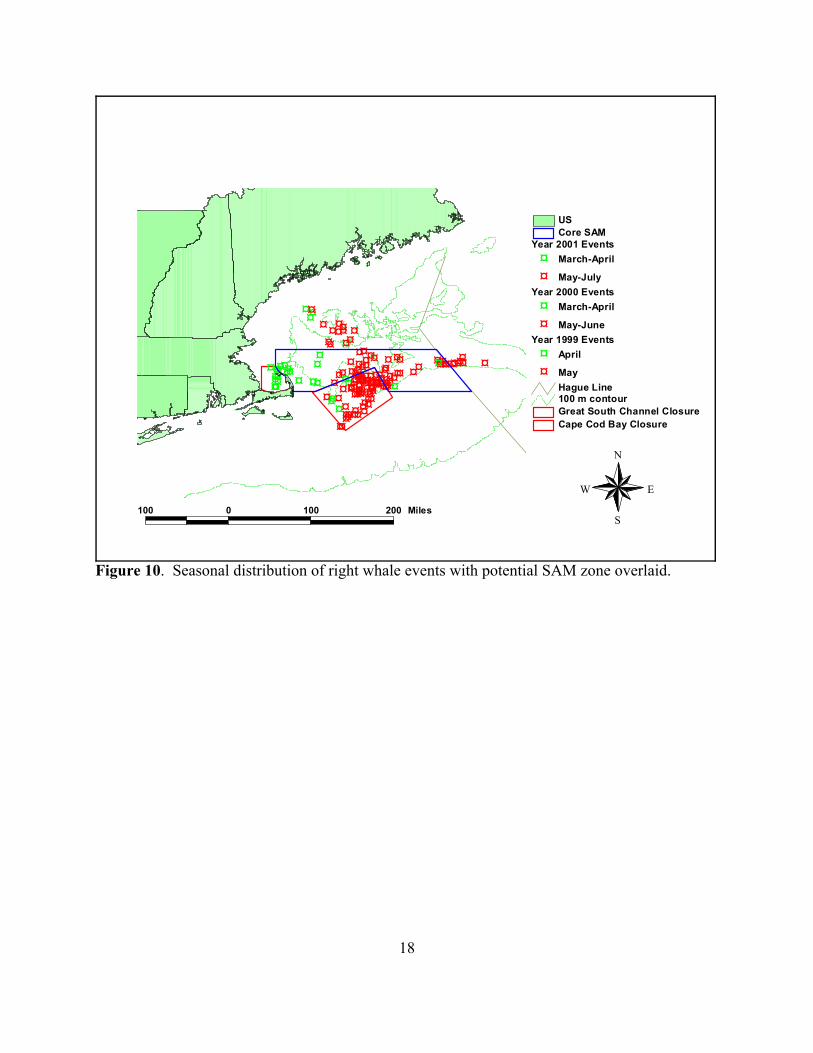
Within the Core zone, right whale events occurred more frequently in the western part of thearea (near Cape Cod Bay and the Great South Channel) in March-April than in May-July (Fig.10). During March-April, 13 of the 15 events outside of the CCB and GSC restricted areasoccurred in the Core SAM zone west of 69.4° W longitude. Conversely, during May-July all ofthe events within the Core SAM zone which were not in the GSC closure, were east of 69.4° Wlongitude. Hence, a possible break point is suggested in the seasonal distribution of right whalesin this area.
DISCUSSION
Apart from Cape Cod Bay and the Great South Channel, there are several other areas in theGeorges Bank/Gulf of Maine region where North Atlantic right whales consistently aggregateeach spring. Despite less complete survey coverage in the Core SAM zone than in the GSC area(Fig. 8), the number of right whale events (49) in the SAM zone during 1999-2001 wascomparable to that in the GSC (66). As such, implementation of the Core SAM zone wouldafford significant additional protection to right whales from interactions with fishing gear andship strikes.
The protection afforded to right whales by the Northern SAM zone is less clear, as it is presentlyuncertain as to whether the events in this zone are reflective of predictable distribution patterns. The 1999-2001 NMFS aerial surveys in this area only detected right whale concentrations inApril-May 1999 and in June 2000. No such concentrations occurred in 2001, despite increasedsurvey effort. Aerial survey work in 2002 and 2003 should help clarify right whale distributionpatterns in the Northern Zone area.
During 199-2001, NMFS survey coverage was adequate in the Core SAM zone and in the GSCarea and was supplemented by excellent survey coverage in the CCB area by the Center forCoastal Studies. Outside of these areas/zones, annual coverage during 1999-2001 included only

6
occasional surveys of reported right whale “hot spots” (e.g., the Cashes Ledge area). Thus, thelack of observations of right whales outside of the well-covered survey areas may be as much afunction of survey effort as it is the absence or presence of right whales. It is hoped that thesurveys planned for 2002-2003 will resolve this issue.
Since all of the aerial survey effort to date has been limited to late March-early July period, thedistribution of right whales in other months has not been captured. While it is well known thatsome right whales are present in Cape Cod Bay and the Georgia-Florida critical habitat areaduring December-March, most right whales are elsewhere at the winter period. Even in mid-summer and early fall when many right whales are concentrated in the Bay of Fundy, largenumber of whales occur elsewhere. New survey efforts need to be conducted in the Gulf ofMaine during the fall-winter period to determine whether right whales are using this habitatduring this time of year.
The lack of synoptic spatial and temporal coverage becomes obvious when sighting observationsare corrected for sighting effort. Such an analysis (R. Pace, unpubl. data) yields a checkerboardof blank cells interspersed with a few cells with observations. One point seems clear, however,high whale densities occur in the GSC in part because of the large sighting effort in this area.Ongoing work at the NEFSC and the New England Aquarium to correct sightings for effort,coupled with additional surveys, should provide improved estimates of right whale habitat use.
Despite several shortcomings with the existing survey data, it is evident that that there are areas(i.e., the Core zone) where right whale persistently aggregate which are outside of the areasofficially designated as critical habitat. Such areas should be considered for inclusion as criticalright whale habitat and as prime candidates for Seasonal Area Management.
ACKNOWLEDGMENTS
We gratefully acknowledge the efforts of the survey teams and pilots (NOAA and private).Without their efforts over the past three years this report would not have been possible toproduce. Surveys were authorized under MMPA/ESA permit 917. We are grateful for thethorough review of an earlier version of this manuscript by Dr. Fred Serchuk.

7
LITERATURE CITED
Beardsley, R., R. Limeburner, P. Cornillon, A. Durbin, E. Durbin, R. Kenney, H. Winn,K. Wishner, and M. Macaulay. 1993. SCOPEX, a Multidisciplinary Study of RightWhale - Ecosystem Interactions. U.S. GLOBEC NEWS Number 3.
Caswell, H., M. Fujiwara, and S. Brault. 1999. Declining survival probability threatens the North Atlantic right whale. Proceedings of the National Academy of Sciences, USA. 96:3308-3313.
Clapham, P. J., and R. M. Pace, III. 2001. Defining Triggers for Temporary Area Closures to Protect Right Whales from Entanglements: Issues and Options. Northeast Fish. Sci. Cent.Ref. Doc. 01-06; 28 p. Available from: National Marine Fisheries Service, 166 WaterStreet, Woods Hole, MA 02543-1026.
Kenney, R.D. 1993. SCOPEX: A multi-disciplinary oceanographic study of Right Whale feeding habitat in the Gulf of Maine. Abstract Tenth Biennial Conf. Biol. Mar. Mamm.:1.
National Marine Fisheries Service. 1991. Final Recovery Plan for the Northern Right Whale (Eubalaena glacialis). Prepared by the Northern Right Whale Recovery Team for theNational Marine Fisheries Service, Silver Spring, MD. 86 p.

8
Table 1. North Atlantic right whale surveys and sightings by year--1999-2001.
Survey Year
1999 2000 2001 Total
Surveys
First survey March 3 March 23 March 22
Last survey June 30 July 6 July 16
Sightings
Right whale sightings 220 241 323 784
Total individual whales 302 350 655 1307
Average number whales per sighting 1.4 1.5 2.0 1.7
Events
Sightings meeting DAM triggercriteria (events)
38 42 69 149
Total individual right whales seen inevents
216 250 462 928
Average number whales per event 5.7 6.0 6.7 6.2
Table 2. North Atlantic right whale sightings and events by month.
Month
March April May June July Total
Sightings
Right whale sightings 19 151 360 211 43 784
Total individual whales 24 215 573 422 73 1307
Average number whalesper sighting
1.3 1.4 1.6 2.0 1.7 1.7
Events
Sightings meeting DAMtrigger criteria (events)
6 23 67 44 9 149
Total individual whalesseen in events
23 143 388 319 55 928
Average number whalesper event
3.8 6.2 5.8 7.3 6.1 6.2
9
#
#
#
###
# ##########
###
# #
#
###
##
##
####
####
###
##
#
# #
#
####### ### ####
##
################################
###
#### #
# #
####
######
####
###
######
###
#
######
# ### #
########
## #####
###
#### #
########### #
######
####
######
##
###############
#
###
#
##
##
¤¤
¤
¤¤ ¤¤
¤
¤¤
¤
¤
¤
¤
¤ ¤
¤
¤¤¤
¤
¤¤¤¤¤¤
¤
¤¤
¤
¤¤¤
¤ ¤¤¤
Cape Cod Bay ClosureGreat South Channel Closure100 m contourHague LineUS
# Year 1999 Sightings¤ Year 1999 Events
Year 1999 Buffers
100 0 100 200 Miles
N
EW
S
Figure 1. Sightings, events, and buffers for 1999.

10
#
#
### ## #
# ######
#
#####
# ## ##
######
## ##
#############
#
##############
#
# ################
#
# # # ###
#
# # ## ############ ##############
#
# #### ###
### # ## ### ###
##
######
#
## # ############## ## #
## #
###### #
## ######
######
######
##
#### ######### # ####
######
# #############
#
¤¤¤
¤¤ ¤
¤
¤ ¤¤¤¤
¤
¤¤
¤¤¤¤
¤¤¤
¤
¤
¤¤¤
¤¤¤ ¤
¤¤¤¤¤
¤¤
¤
¤¤¤
Cape Cod Bay ClosureGreat South Channel Closure100 m contourHague LineUS
# Year 2000 Sightings¤ Year 2000 Events
Year 2000 Buffers
100 0 100 200 Miles
N
EW
S
Figure 2. Sightings, events, and buffers for 2000.

11
#
######
#
#
#
#
##
## #
# #
# # #
## ###
#
#
#
###
#####
###
#
#
#
#
#
#
#####
##
#####
######
#
#
#
## ###
###
##
#
##
#
#
# #
#
#
#
# ##
# ##
###
##
##
##
#
##
##
###
###### #
##
##
#
##
# ##
##
#
# # #
##
#
#
#
# # # # #
######
##
### # ###
#
###
#
#
#
###
##
##
# # ###########
### #
### #
#
## # ##
#
###
##################
#
########## ##
# ##
##
#
#### ###########
##
#
#
#
####
#
#
# #
###
####
###
#
#
#
# #
#
#
# ### # ##
#
##
#
# ## # ## # ## # ##
###
## ### ####### # ##### ##
##
###### #
¤¤
¤
¤¤¤¤
¤¤¤¤¤¤ ¤
¤ ¤ ¤ ¤¤¤ ¤¤¤¤¤ ¤¤¤¤
¤
¤¤ ¤¤ ¤
¤¤¤
¤
¤
¤¤¤¤¤¤
¤
¤¤
¤¤
¤¤¤¤¤ ¤¤ ¤
¤¤¤¤¤
¤ ¤¤
¤
¤
Cape Cod Bay ClosureGreat South Channel Closure100 m contourHague Line
# Year 2001 Sightings¤ Year 2001 Events
Year 2001 BuffersUS
100 0 100 200 Miles
N
EW
S
Figure 3. Sightings, events, and buffers for 2001.

12
Figure 4.–Frequency of events by size

13
¤¤
¤
¤¤ ¤¤
¤
¤¤
¤
¤
¤
¤
¤ ¤
¤
¤¤¤
¤
¤¤¤¤¤¤
¤
¤¤
¤
¤¤¤
¤ ¤¤¤
¤¤¤
¤¤ ¤
¤
¤ ¤¤¤¤
¤
¤¤
¤¤¤¤
¤¤¤
¤
¤
¤¤¤
¤¤¤ ¤ ¤¤¤¤¤
¤¤
¤
¤¤¤
¤¤
¤
¤¤¤¤
¤¤¤¤¤¤ ¤
¤ ¤ ¤ ¤¤¤ ¤¤¤¤¤ ¤¤¤¤
¤
¤¤ ¤¤ ¤
¤¤¤
¤
¤
¤¤¤¤¤¤
¤
¤¤
¤¤
¤¤¤¤¤ ¤¤ ¤
¤¤¤¤¤
¤ ¤¤
¤
¤
Cape Cod Bay ClosureGreat South Channel Closur100 m contourHague Line
¤ Year 1999 Events¤ Year 2000 Events¤ Year 2001 Events
Event Defined SAMUS
100 0 100 200 Miles
N
EW
S
Figure 5. Overall SAM definition based on 1999-2001 events.

14
¤¤
¤
¤¤ ¤¤
¤
¤¤
¤
¤
¤
¤
¤ ¤
¤
¤¤¤
¤
¤¤¤¤¤¤
¤
¤¤
¤
¤¤¤
¤ ¤¤¤
¤¤¤
¤¤ ¤
¤
¤ ¤¤¤¤
¤
¤¤
¤¤¤¤
¤¤¤
¤
¤
¤¤¤
¤¤¤ ¤ ¤¤¤¤¤
¤¤
¤
¤¤¤
¤¤
¤
¤¤¤¤
¤¤¤¤¤¤ ¤
¤ ¤ ¤ ¤¤¤ ¤¤¤¤¤ ¤¤¤¤
¤
¤¤ ¤¤ ¤
¤¤¤
¤
¤
¤¤¤¤¤¤
¤
¤¤
¤¤
¤¤¤¤¤ ¤¤ ¤
¤¤¤¤¤
¤ ¤¤
¤
¤
Cape Cod Bay ClosureGreat South Channel Closure100 m contourHague Line
¤ Year 1999 EventsYear 1999 Buffers
¤ Year 2000 EventsYear 2000 Buffers
¤ Year 2001 EventsYear 2001 BuffersBuffer Based SAMUS
100 0 100 200 Miles
N
EW
S
Figure 6. Overall SAM definition based on 1999-2001 buffers.
15
100 m contourHague LineYear 1999 SAMYear 2000 SAMYear 2001 SAMUS
100 0 100 200 Miles
N
EW
S
Figure 7. Annual SAM definitions for 1999-2001.

16
#
#
#
###
# ##########
###
# #
#
###
#
#
##
####
####
###
##
#
# #
#
####### ### ####
##
################################
###
#### #
# #
####
######
####
###
######
###
#
######
# ####
########
###
####
###
#
### ####
######## #
######
####
######
##
###############
#
###
#
##
##
#
#
### ## #
# ######
#
#####
# ## ##
######
####
#############
#
##############
#
# ################
#
# # # #
##
#
# # ## ############ ##############
#
# ###
# ######
# ## ### ###
##
######
#
## # ############## ## #
## #
###### #
## #
#####
######
######
##
#### ######### # ####
######
# #############
#
#
######
#
#
#
#
##
## #
# #
# # #
## ###
#
#
#
###
#####
###
#
#
#
#
#
#
#####
##
#####
######
#
#
#
## ###
###
##
#
##
#
#
# #
#
#
#
# ##
# ##
###
##
##
##
#
##
##
###
###### #
##
##
#
##
# ##
##
#
# # #
##
#
#
#
# # # # #
######
##
### # ###
#
###
#
#
#
###
##
##
# # ###########
### #
### #
#
## # ##
#
###
##################
#
########## ##
# ##
##
#
#### ###########
##
#
#
#
####
#
#
# #
###
####
###
#
#
#
# #
#
#
# ### # ##
#
##
#
# ## # ## # ## # ##
###
## ### ####### # ##### ##
##
###### #
Cape Cod Bay ClosureGreat South Channel Closure100 m contourHague Line
# Year 1999 Sightings# Year 2000 Sightings# Year 2001 Sightings
1999-2001 SAM CombinedUS
100 0 100 200 Miles
N
EW
S
Figure 8. Aggregate SAM zone with 1999-2001 sightings overlaid.

17
¤¤
¤
¤¤ ¤¤
¤
¤¤
¤
¤
¤
¤
¤ ¤
¤
¤¤¤
¤
¤¤¤¤¤¤
¤
¤¤
¤
¤¤¤
¤ ¤¤¤
¤¤¤
¤¤ ¤
¤
¤ ¤¤¤¤
¤
¤¤
¤¤¤¤
¤¤¤
¤
¤
¤¤¤
¤¤¤ ¤
¤¤¤¤¤
¤¤
¤
¤¤¤
¤¤
¤
¤¤¤¤
¤¤¤¤¤¤ ¤
¤ ¤ ¤ ¤¤¤ ¤¤¤¤¤ ¤¤¤¤
¤
¤¤ ¤¤ ¤
¤¤¤
¤
¤
¤¤¤¤¤¤
¤
¤¤
¤¤
¤¤¤¤¤ ¤¤ ¤
¤¤¤¤¤
¤ ¤¤
¤
¤
Cape Cod Bay ClosureGreat South Channel Closure100 m contourHague Line
¤ Year 1999 Events¤ Year 2000 Events¤ Year 2001 Events
North SAMCore SAMUS
100 0 100 200 Miles
N
EW
S
Figure 9. Two potential SAM zones with 1999-2001 sightings events overlaid.
18
¤¤
¤
¤¤ ¤¤
¤
¤¤
¤
¤
¤
¤
¤ ¤
¤
¤¤¤
¤
¤¤¤¤¤¤
¤
¤¤
¤
¤¤¤
¤ ¤¤¤
¤¤¤
¤¤ ¤
¤
¤ ¤¤¤¤
¤
¤¤
¤¤¤¤
¤¤¤
¤
¤
¤¤¤
¤¤¤ ¤
¤¤¤¤¤
¤¤
¤
¤¤¤
¤¤
¤
¤¤¤¤
¤¤¤¤¤¤ ¤
¤ ¤ ¤ ¤¤¤ ¤¤¤¤¤ ¤¤¤¤
¤
¤¤ ¤¤ ¤
¤¤¤
¤
¤
¤¤¤¤¤¤
¤
¤¤
¤¤
¤¤¤¤¤ ¤¤ ¤
¤¤¤¤¤
¤ ¤¤
¤
¤
Cape Cod Bay ClosureGreat South Channel Closure100 m contourHague Line
Year 1999 Events¤ April
¤ May
Year 2000 Events¤ March-April
¤ May-June
Year 2001 Events¤ March-April
¤ May-July
Core SAMUS
100 0 100 200 Miles
N
EW
S
Figure 10. Seasonal distribution of right whale events with potential SAM zone overlaid.


Research Communications UnitNortheast Fisheries Science Center
National Marine Fisheries Service, NOAA166 Water St.
Woods Hole, MA 02543-1026
NOAA Technical Memorandum NMFS-NE -- This series is issued irregularly. The series typically includes: data reports of long-term or largearea studies; synthesis reports for major resources or habitats; annual reports of assessment or monitoring programs; documentary reports ofoceanographic conditions or phenomena; manuals describing field and lab techniques; literature surveys of major resource or habitat topics; findingsof task forces or working groups; summary reports of scientific or technical workshops; and indexed and/or annotated bibliographies. All issuesreceive internal scientific review and most issues receive technical and copy editing.
Northeast Fisheries Science Center Reference Document -- This series is issued irregularly. The series typically includes: data reports on fieldand lab observations or experiments; progress reports on continuing experiments, monitoring, and assessments; background papers for scientificor technical workshops; and simple bibliographies. Issues receive internal scientific review, but no technical or copy editing.
The mission of NOAA's National Marine Fisheries Service (NMFS) is "stewardship of living marine resources for the benefit of the nationthrough their science-based conservation and management and promotion of the health of their environment." As the research arm of the NMFS'sNortheast Region, the Northeast Fisheries Science Center (NEFSC) supports the NMFS mission by "planning, developing, and managingmultidisciplinary programs of basic and applied research to: 1) better understand the living marine resources (including marine mammals) ofthe Northwest Atlantic, and the environmental quality essential for their existence and continued productivity; and 2) describe and provide tomanagement, industry, and the public, options for the utilization and conservation of living marine resources and maintenance of environmentalquality which are consistent with national and regional goals and needs, and with international commitments." Results of NEFSC research arelargely reported in primary scientific media (e.g., anonymously-peer-reviewed scientific journals). However, to assist itself in providing data,information, and advice to its constituents, the NEFSC occasionally releases its results in its own media. Those media are in four categories:
Publications and Reportsof the
Northeast Fisheries Science Center
OBTAINING A COPY: To obtain a copy of a NOAA Technical Memorandum NMFS-NE or a Northeast Fisheries Science CenterReference Document, or to subscribe to the Fishermen's Report or the The Shark Tagger, either contact the NEFSC Editorial Office(166 Water St., Woods Hole, MA 02543-1026; 508-495-2228) or consult the NEFSC webpage on "Reports and Publications" (http://www.nefsc.nmfs.gov/nefsc/publications/).
ANY USE OF TRADE OR BRAND NAMES IN ANY NEFSC PUBLICATION OR REPORT DOES NOT IMPLYENDORSEMENT.
STANDARD MAIL A
The Shark Tagger -- This newsletter is an annual summary of tagging and recapture data on large pelagic sharks as derived from the NMFS'sCooperative Shark Tagging Program; it also presents information on the biology (movement, growth, reproduction, etc.) of these sharks assubsequently derived from the tagging and recapture data. There is internal scientific review, but no technical or copy editing, of this newsletter.
Fishermen's Report -- This information report is a quick-turnaround report on the distribution and relative abundance of commercial fisheriesresources as derived from each of the NEFSC's periodic research vessel surveys of the Northeast's continental shelf. There is no scientific review,nor any technical or copy editing, of this report.