Embed Size (px)
Citation preview

Identification of the Causes of Sediment-Associated Toxicity in the
Illinois River Complex Using a Sediment-TIE Approach
Tyler Mehler1, Jing You2, Jon Maul3 and Michael Lydy1
1Fisheries and Illinois Aquaculture and Department of Zoology, Southern Illinois University, Carbondale, Illinois, USA2State Key Laboratory of Organic Geochemistry, Guangzhou Institute of Geochemistry, Chinese Academy of Sciences, Guangzhou, China3The Institute of Environmental and Human Health, Department of Toxicology, Box 41163, Texas Tech University, Lubbock, Texas, USA
ISTC seminar: 9/9/09

What is a TIE?As defined by the EPA (2007):
The Toxicity Identification Evaluation approach “is to use physical/chemical manipulations of a sample to isolate or change the potency of different groups of toxicants potentially present in a sample”.
UnamendedAmended
X X XAmended for non-
polar organicsAmended for
ammonia
X X X
Amended for metals
X X X
Contaminated w/ non-polar organics

Matrix Choice
usgs.gov
Pore water
Sediment grain
Issues with pore water TIEs:
• Bioavailability
• Ingestion
• Water quality parameters
• Environmental Realistic?
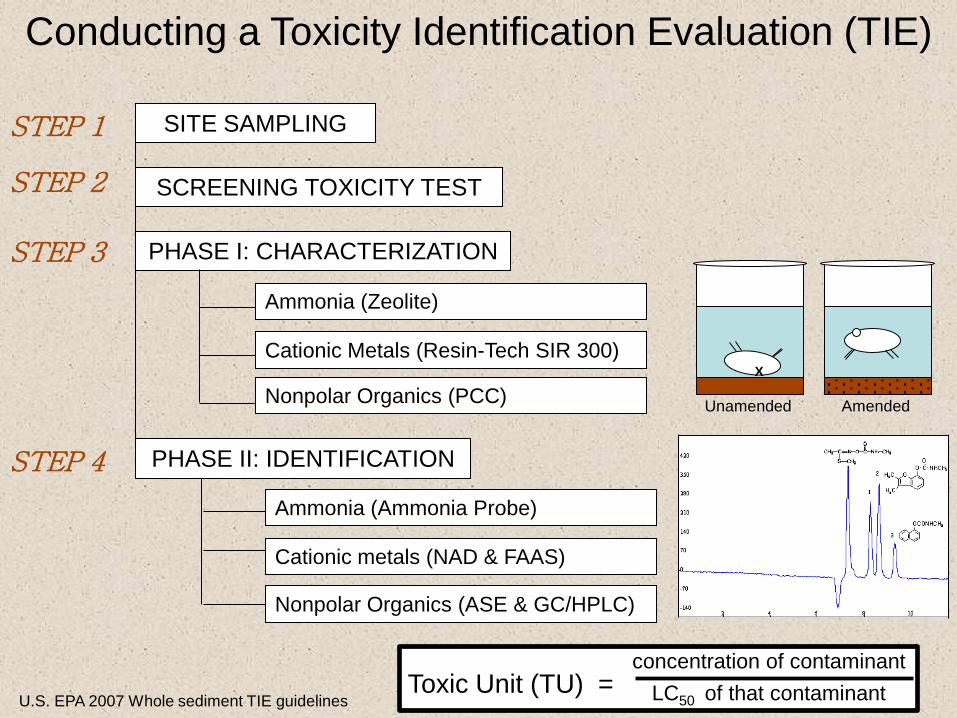
SITE SAMPLING
SCREENING TOXICITY TEST
PHASE I: CHARACTERIZATION
Ammonia (Zeolite)
Cationic Metals (Resin-Tech SIR 300)
Nonpolar Organics (PCC)
Conducting a Toxicity Identification Evaluation (TIE)
PHASE II: IDENTIFICATION
Ammonia (Ammonia Probe)
Cationic metals (NAD & FAAS)
Nonpolar Organics (ASE & GC/HPLC)
STEP 1
STEP 2
STEP 3
STEP 4
X
Unamended Amended
U.S. EPA 2007 Whole sediment TIE guidelinesToxic Unit (TU) =
concentration of contaminantLC50 of that contaminant
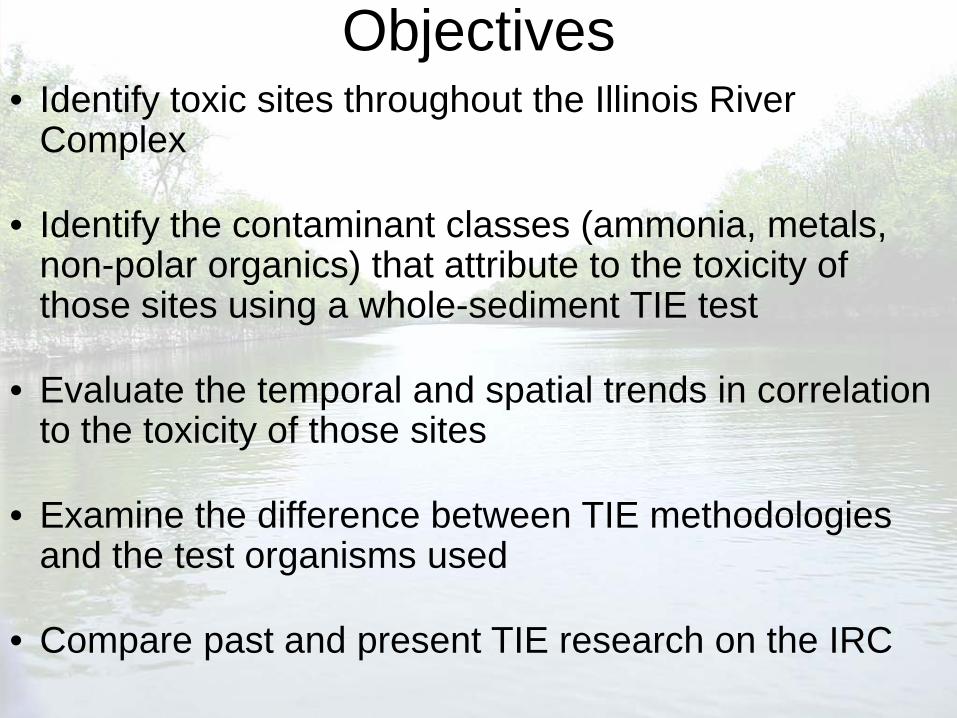
• Identify toxic sites throughout the Illinois River Complex
• Identify the contaminant classes (ammonia, metals, non-polar organics) that attribute to the toxicity of those sites using a whole-sediment TIE test
• Evaluate the temporal and spatial trends in correlation to the toxicity of those sites
• Examine the difference between TIE methodologies and the test organisms used
• Compare past and present TIE research on the IRC
Objectives

SITE SAMPLING
SCREENING TOXICITY TEST
PHASE I: CHARACTERIZATION
Ammonia (Zeolite)
Cationic Metals (Resin-Tech SIR 300)
Nonpolar Organics (PCC)
Conducting a Toxicity Identification Evaluation (TIE)
PHASE II: IDENTIFICATION
Ammonia (Ammonia Probe)
Cationic metals (NAD & FAAS)
Nonpolar Organics (ASE & GC/HPLC)
STEP 1
STEP 2
STEP 3
STEP 4
SITE SAMPLING

• 24 sites chosen with consultation of ISTC
• 2.5 kg was collected from each site
• Water samples from each site were also retrieved and water quality measurements for each site taken
• Hardness emulated
• Total pore water ammonia was analyzed upon arrival at SIUC
• Sediments and water samples were analyzed at SIUC Fisheries and Illinois Aquaculture Center
• Samples were taken in summer 07’, fall 07’, winter 07-08’, spring 08’ and again in summer 08’
Sampling Methods
1
4
2
3
5-78
10-11
12
13-15
169
17
1819
20
21 22
23
24
17

Sites Rivermile ( p )
Moore's Towhead (1) 76 Spring Lake Wildlife Area (2) 134 Pekin (3) 151 Mouth of Wesley Slough (4) 160 Peoria Dredge (5) 165 L Peoria Core 0-30 (6) 166 L Peoria Core 30-60 166 L Peoria Core 60-90 166 Upper Lower Peoria Lake (7) 166 Goose Lake (8) 179 Lacon (9) 187 Mudd Lake (10) 196 Sawmill Core 0-30 (11) 197 Sawmill Core 30-60 197 Sawmill Core 60-90 197 Down River of Hennepin (12) 205 Hennepin Power Plant (13) 212 Depue Lake (14) 212 Depue Core 0-30 (15) 212 Dupue Core 30-60 212 Dupue Core 60-90 212 Marseilles (16) 248 DuPage River (17) 277 Calmut 305 (18) 305 SS308 NC (19) 308 Stony Creek (20) 309 SS315 (21) 315 SS317 (22) 317 SR Cal RR (23) 318 Halstead Bridge (24) 320
1
4
2
3
5-78
10-11
12
13-15
169
17
1819
20
21 22
23
24
17
X
Carbondale
St. Louis

SITE SAMPLING
SCREENING TOXICITY TEST
PHASE I: CHARACTERIZATION
Ammonia (Zeolite)
Cationic Metals (Resin-Tech SIR 300)
Nonpolar Organics (PCC)
Conducting a Toxicity Identification Evaluation (TIE)
PHASE II: IDENTIFICATION
Ammonia (Ammonia Probe)
Cationic metals (NAD & FAAS)
Nonpolar Organics (ASE & GC/HPLC)
STEP 1
STEP 2
STEP 3
STEP 4
SCREENING TOXICITY TEST

Screening Toxicity Tests• 10-d bioassays (U.S. EPA) in flow-thru
system with three water changes per day (≈100 ml per change)
• 10 H. azteca (14 to 21-d old) per 300 ml beaker, 6 replicates per site
• Control: Touch of Nature (TON) hydrated soil – Carbondale, IL
• Amendment Reference: Lower Peoria Lake (LPL)
• Statistical Analysis: Dunnett’s Multiple Comparison Test

Summer 07’ Results: Screening Toxicity Tests
Sites that were significantly different from controls (p<0.05) and were chosen for seasonal analysis.
0
20
40
60
80
100
120
76 134 151 160 165 166 179 187 196 205 212 212 248 277 305 308 309 315 317 318 320
% S
urvi
val
Increasing Rivermile
Touc
h of
Nat
ure
Moo
re’s
Tow
head
Spr
ing
Lake
Wild
life
Are
a
Pek
in
Upp
er L
ower
Peo
ria L
ake
Goo
se
Laco
n
Mud
d
Hen
nepi
n D
own
Riv
er
Hen
nenp
in P
ower
Pla
nt
DuP
ue
Mar
seille
s
DuP
age
CS
305
Sto
ny C
reek
SS
315
SR
CA
LRR
SS
317
Hal
stea
d
SS
308
LPL
Dre
dge
Wes
ley

SITE SAMPLING
SCREENING TOXICITY TEST
PHASE I: CHARACTERIZATION
Ammonia (Zeolite)
Cationic Metals (Resin-Tech SIR 300)
Nonpolar Organics (PCC)
Conducting a Toxicity Identification Evaluation (TIE)
PHASE II: IDENTIFICATION
Ammonia (Ammonia Probe)
Cationic metals (NAD & FAAS)
Nonpolar Organics (ASE & GC/HPLC)
STEP 1
STEP 2
STEP 3
STEP 4
PHASE I: CHARACTERIZATION

Phase I: Characterization
RT SIR 300 HP
PCC
Unamended (sand)
20% (12 g)
25% (15 g)
15% (9 g)
25% (15 g)
Zeolite
Unamended (sand)
20% (12 g)
10 H. azteca
6 reps per treatment
4 -d static test
10-d flow-thru test

Summer 2007 Results: Phase IUnamended (sand) Organics (PCC)
TOXIC SITES
• The addition of zeolite (ammonia) and Resin-Tech SIR 300 (metals) showed no significant differences in comparison to the unamended sediment.
TON LPL SS308 Halstead CS305 Stny Crk SRCALRR SS315 DuPage

SITE SAMPLING
SCREENING TOXICITY TEST
PHASE I: CHARACTERIZATION
Ammonia (Zeolite)
Cationic Metals (Resin-Tech SIR 300)
Nonpolar Organics (PCC)
Conducting a Toxicity Identification Evaluation (TIE)
PHASE II: IDENTIFICATION
Ammonia (Ammonia Probe)
Cationic metals (NAD & FAAS)
Nonpolar Organics (ASE & GC/HPLC)
STEP 1
STEP 2
STEP 3
STEP 4 PHASE II: IDENTIFICATION
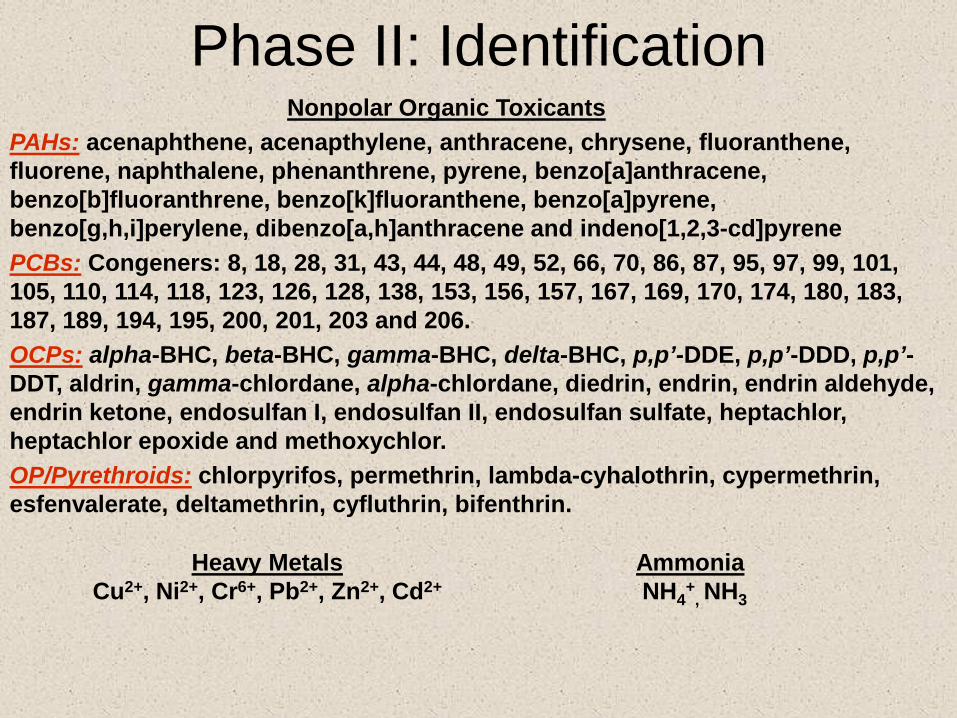
Nonpolar Organic ToxicantsPAHs: acenaphthene, acenapthylene, anthracene, chrysene, fluoranthene, fluorene, naphthalene, phenanthrene, pyrene, benzo[a]anthracene, benzo[b]fluoranthrene, benzo[k]fluoranthene, benzo[a]pyrene, benzo[g,h,i]perylene, dibenzo[a,h]anthracene and indeno[1,2,3-cd]pyrenePCBs: Congeners: 8, 18, 28, 31, 43, 44, 48, 49, 52, 66, 70, 86, 87, 95, 97, 99, 101, 105, 110, 114, 118, 123, 126, 128, 138, 153, 156, 157, 167, 169, 170, 174, 180, 183, 187, 189, 194, 195, 200, 201, 203 and 206.OCPs: alpha-BHC, beta-BHC, gamma-BHC, delta-BHC, p,p’-DDE, p,p’-DDD, p,p’-DDT, aldrin, gamma-chlordane, alpha-chlordane, diedrin, endrin, endrin aldehyde, endrin ketone, endosulfan I, endosulfan II, endosulfan sulfate, heptachlor, heptachlor epoxide and methoxychlor.OP/Pyrethroids: chlorpyrifos, permethrin, lambda-cyhalothrin, cypermethrin, esfenvalerate, deltamethrin, cyfluthrin, bifenthrin.
Heavy MetalsCu2+, Ni2+, Cr6+, Pb2+, Zn2+, Cd2+
AmmoniaNH4
+, NH3
Phase II: Identification

The reasons we analyzed total ammonia:
1. It’s commonly performed in standard TIE methods
2. Allows comparisons in pore water ammonia concentrations between past and present studies (Sparks and Ross 1992 – Concentrations measured as total ammonia)
3. Allows comparisons in pore water ammonia concentrations among sites (since water quality characteristics differed among sites)
4. Difficult to account for drifting pHs or changing temperature throughout studies

LPL SS308 Halstead CS305 StonyCreek SRCALRR SS315
∑Metals (µg/g dry) 6.39 37.7 26.5 27.6 50.4 23.8 17.9
Pore water total ammonia (mg N/L)
6.48 36.6 26.2 13.7 19.4 21.7 541
∑Pesticides (µg/g OC) BRL 0.447 0.208 0.414 2.14 1.12 0.405
∑PCBs (µg/g OC) 4.45 11.5 15.7 21.1 37.2 34.5 7.6
∑PAHs (µg/g OC) 586.8 1934 1328 1198 1021 1267 4112
Summer 2007 Phase II: Identification
BRL – 1 µg/kg
Toxic Units LPL SS308 Halstead CS305StonyCreek SRCALRR SS315
∑Metals (µg/g dry) <0.1 <0.1 <0.1 <0.1 <0.1 <0.1 <0.1Pore water total ammonia (mg N/L) <0.1 <0.1 <0.1 <0.1 <0.1 <0.1 0.4
PCBs (µg/g oc) <0.1 <0.1 <0.1 <0.1 <0.1 <0.1 <0.1Pesticides(µg/g oc) <0.1 <0.1 <0.1 <0.1 <0.1 <0.1 <0.1
PAHs (µg/g oc) 0.7 2.8 1.9 1.8 1.4 1.6 4.6
Low TU = Low ToxicityHigh TU= High Toxicity

Summer 2007 Conclusions
• Phase I findings strongly suggests that non-polar organics are the problem, with Phase II findings further suggesting that PAHs were at high concentrations to cause the noted toxicity.
• What about the other seasons?

Is PCC always effective?
SUMMER 07’
Unamended (sand)
Organics (PCC)
SUMMER 08’
• 46% of sites (in all seasons) were characterized with PCC
0
0.2
0.4
0.6
0.8
1
1.2
SS315 SS308 CS305 SRCALRR Halstead StonyCreek
DuPage LPL
Toxic Sites
% D
iese
l Ran
ge O
rgan
ics
• Affect on PCC binding capability?
• Organics higher affinity for UCM?
• Causes toxicity itself?
% U
nres
olve
d C
ompl
ex M
atrix
(UC
M)

0
25
50
0
50
100
150
200
400600800
Phase II: Spatial and temporal variationC
once
ntra
tion
of C
onta
min
ant
Summer 2007Fall 2007Winter 2007-2008Spring 2008Summer 2008
mg
N/L
µg/g
dry
wt
mg/
g O
C
SS315 SS308 LPLCS305 SRCALRR Halstead
3.0
6.0
Total Pore Water Ammonia
Total Cationic Metals
Total PAHs
Calumet Sag Channel
Chicago Sanitary and Shipping Canal
Stony Creek

Spatial Trends: Ammonia
Rivermile on the Illinois River
50 100 150 200 250 300 350
Tota
l Por
e W
ater
Am
mon
ia C
once
ntra
tion
(mg
N/L
)
0
25
50
75500
550
600
Y = 0.1314x – 16.633 r2 = 0.608 p < 0.001

Rivermile
308 310 312 314 316 318
Tota
l Por
e W
ater
Am
mon
ia (m
g N
/L)
0
250
500
750
1000
SS315Total Ammonia
>400 mg N/L
Municipal Waste Plant
Courtesy of www.flashearth.com
Spatial Trends: Ammonia

Gradient of increased toxicity associated with the total ammonia concentration
Ammonia the primary source of toxicity in the Illinois River Complex
Patches of toxicity occurring due to PAHs
Sparks and Ross (1992)

A Comparison Study:– Determine differences between pore water TIE testing and
whole-sediment TIE testing– Determine differences between test organisms (H. azteca
and C. dubia)– While still comparing past and present research
Two sites being evaluated:SS315 – highest ammonia concentrationsSS308 – highest PAH concentrations
VS VS

Phase I: Pore Water Characterization
Zeolite
Unamended
5 H. azteca
10 C. dubia
8 reps per treatment
2-d
stat
ic
test
Diluted by 50%
SPE C18
1-d
stat
ic
test

Phase I: Whole Sediment Characterization
Zeolite
Unamended
10 H. azteca
10 C. dubia
8 reps per treatment
4-d
stat
ic
test
PCC
10-d
flow
-th
ru te
st
2-d
stat
ic
test
Zeolite
Unamended
PCC

Comparing Methodologies: AmmoniaPore Water TIE Whole Sediment TIE
359 mg N/L 37.9 mg N/L
0.272.56
SS315 Ammonia Concentrations (mg N/L)
Predicted TUs for H. azteca
PHASE I:
PHASE II:

Comparing Methodologies: Non-polar OrganicsPore Water TIE Whole-Sediment TIE
The affects of:
• UCM
• Black carbon
• ingestion, adsorption
• DOC
• Glassware binding
PHASE I:
SS308 ∑PAH Concentrations:
TUs for H. aztecaPHASE II:
1.810.52
1953 µg/L 4405 µg/g oc

Comparing Species Sensitivity/Susceptibility
H. azteca C. dubia
Species Sensitivity ≠ Species Susceptibility
• Body Size /Age (Life Stage)
• Physiology/Feeding Behavior
• Niche
≈ 47.25 mg N/L (2-d)bLC50 Total Ammonia:≈ 140 mg N/L (4-d)a
a – Ankley et al. 1995
b – extrapolated from Bailey et al. 2001
c – Suedel and Rodgers, Jr. 1996
LC50 Fluoranthene (PAH): C. dubia ≈ 102.6 µg/L (10-d)cH. azteca ≈ 30.6 µg/L (10-d)c

Conclusions• Toxic sites were identified on the IRC for
future risk assessment & mitigation• Rm 277 (DuPage) Calumet Sag Channel,
Chicago Sanitary and Shipping Canal

Conclusions• PAHs and the associated oils and grease
were identified as the sources of the noted toxicity, however ammonia was elevated at SS315

Conclusions• Little temporal variation was noted in
toxicity and in concentrations• However, spatial trends were found in
toxicity especially concerning ammonia

Conclusions• Which TIE approach is better and where
are TIEs headed? • Is the IRC a healthy system ?

Acknowledgements
A special thanks goes to SETAC (Student Exchange Program) and Teresa Norberg-King and the rest of the EPA Duluth Lab.
Fisheries and Aquaculture Center and Dept. of Zoology staff and students
Funding:
Sampling Crew:
Ed Workman, Mandy Rothert, Liz Tripp, Heather Foslund

For more information:Mehler WT, Maul JD, You J, and MJ Lydy. 2009. Identifying the
causes of sediment-associated contamination in the Illinois River using a whole-sediment Toxicity Identification Evaluation (TIE). Environmental Toxicology and Chemistry. In Press.
Mehler WT, You J, Maul JD, and MJ Lydy. 2009. Comparative analysis of whole sediment and pore water Toxicity Identification Evaluation (TIE) techniques for ammonia and non-polar organic contaminants. Chemosphere. In Review.


Questions?

Evaluating Ammonia
SS315 overlying water
Total ammonia – 37.9 mg N/L (TU = 0.29)
Un-ionized ammonia – 0.584 mg/L (TU = 0.27)
Total ammonia – 359 mg N/L (TU = 2.56)
Un-ionized ammonia – 11.2 mg/L (TU = 5.19)
SS315 pore water

Sparks and Ross (1992)
Gradient of increased toxicity associated with the total ammonia concentration
Ammonia was the primary source of toxicity in the Illinois River Complex
Patches of toxicity occurring due to PAHs
The beginning of a general recovery of the Illinois River Complex


Gradient of increased toxicity associated with the total ammonia concentration
Ammonia the primary source of toxicity in the Illinois River Complex
Patches of toxicity occurring due to PAHs
The beginning of a general recovery of the Illinois River Complex
Sparks and Ross 1992
?

Questions?

Conclusions:• Differences in past and present TIE
studies is attributed to the differences in methodologies and perhaps on a lesser note test organism choice.
• Which test organism is better?– Realistic Test Organism?
– Using Historic Test Organism?
• Which TIE is better and where are TIEs headed?

![SCentralPri12082012111€¦ · Outside United States and Canada CALL 1-651-222-5352 (in USA) Hazards identification Solid. [Cast solid] WARNING ! CAUSES DIGESTIVE TRACT BURNS. CAUSES](https://img.pdfslide.net/doc/110x75/604d3ee147b28534265b5dd2/scentralpri12082012111-outside-united-states-and-canada-call-1-651-222-5352-in.jpg)