Embed Size (px)
Citation preview
Identification of the environmentally safe fairwayin the South-Western Baltic Sea and Kattegat
Xi Lu & Tarmo Soomere & Emil V. Stanev &
Jens Murawski
Received: 27 September 2011 /Accepted: 27 February 2012 /Published online: 20 March 2012# Springer-Verlag 2012
Abstract Application of the preventive techniques for theoptimisation of fairways in the south-western Baltic Sea andthe Kattegat in terms of protection of the coastal regionsagainst current-driven surface transport of adverse impactsreleased from vessels is considered. The techniques rely onthe quantification of the offshore domains (the points ofrelease of adverse impacts) in terms of their ability to serveas a source of remote, current-driven danger to the near-shore. An approximate solution to this inverse problem ofcurrent-driven transport is obtained using statistical analysisof a large pool of Lagrangian trajectories of water particlescalculated based on velocity fields from the Denmark’sMeteorological Institute (DMI)/BSH cmod circulation mod-el forced by the DMI-HIRHAM wind fields for 1990–1994.The optimum fairways are identified from the spatial distri-butions of the probability of hitting the coast and for the
time (particle age) it takes for the pollution to reach thecoast. In general, the northern side of the Darss Sill areaand the western domains of the Kattegat are safer to travel.The largest variations in the patterns of safe areas and theproperties of pollution beaching occur owing to the inter-play of water inflow and outflow. The gain from the use ofthe optimum fairways is in the range of 10–30 % in terms ofthe decrease in the probability of coastal hit within 10 daysafter pollution release or an increase by about 1–2 days ofthe time it takes for the hit to occur.
Keywords Particle tracking . Baltic Sea fairways . Inflowand outflow events
1 Introduction
The increasing density of traffic and the associated increasein the pressure to the marine ecosystem are calling for newsolutions for the environmental management of the potentialadverse impacts. The situation is particularly complicated inareas where intense ship traffic is crossing or located near tovulnerable areas where consequences of a major accidentmay be extremely large (Kachel 2008). In such places, it isessential to combine the rules for overall reliable design andimproved safety of offshore activities, which are usuallytargeted to the decrease in the probability of an accident, withnovel techniques of mitigation of environmental concerns thatoffer ways for the reduction of the costs of an accident. Thepresentation of such techniques and their application to onespecific ocean area with high concentration of marine traffic isthe major motivation for this research.
We address in this paper the Baltic Sea which is underlarge pressure of shipping and other offshore activities. Thenumber of ship operations (voyages, excluding ferry traffic)
Responsible Editor: Joachim W. Dippner
X. Lu (*) : E. V. StanevInstitute for Coastal Research, HZG Geesthacht,Max-Planck-Straße 1,21502 Geesthacht, Germanye-mail: [email protected]
T. SoomereInstitute of Cybernetics at Tallinn University of Technology,Akadeemia tee 21,12618 Tallinn, Estonia
J. MurawskiDanish Meteorological Institute,Lyngbyvej 100,2100 Copenhagen, Denmark
T. SoomereEstonian Academy of Sciences,Kohtu 6,10130 Tallinn, Estonia
Ocean Dynamics (2012) 62:815–829DOI 10.1007/s10236-012-0532-x
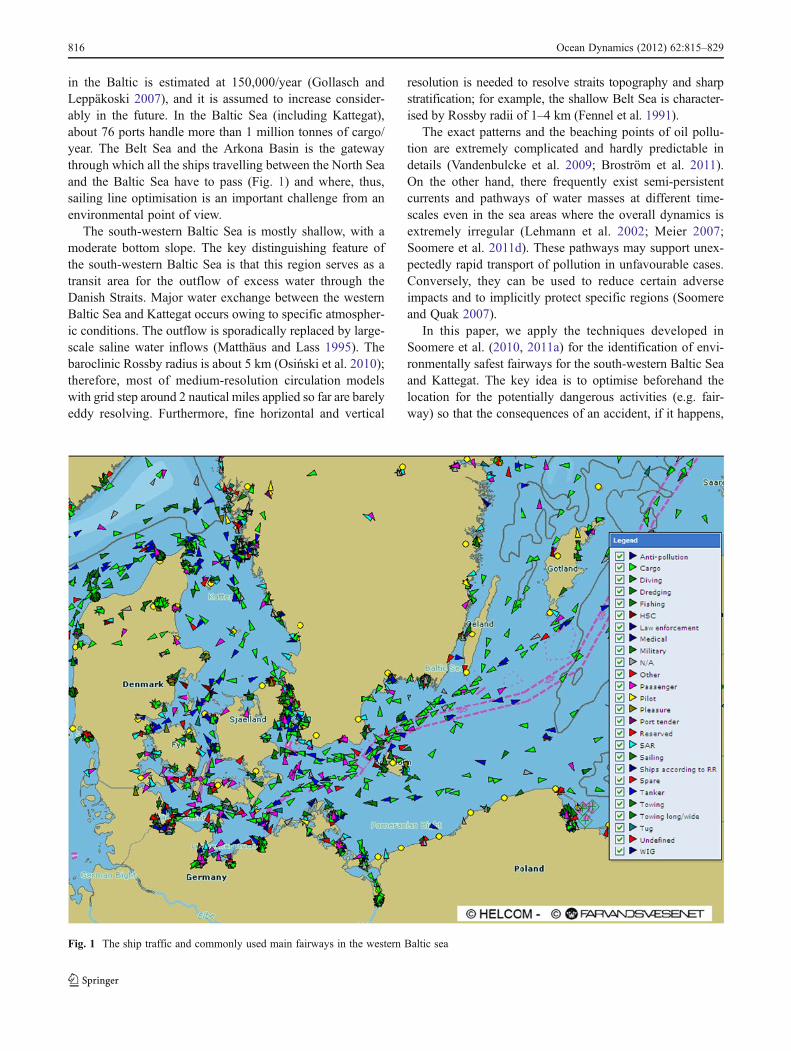
in the Baltic is estimated at 150,000/year (Gollasch andLeppäkoski 2007), and it is assumed to increase consider-ably in the future. In the Baltic Sea (including Kattegat),about 76 ports handle more than 1 million tonnes of cargo/year. The Belt Sea and the Arkona Basin is the gatewaythrough which all the ships travelling between the North Seaand the Baltic Sea have to pass (Fig. 1) and where, thus,sailing line optimisation is an important challenge from anenvironmental point of view.
The south-western Baltic Sea is mostly shallow, with amoderate bottom slope. The key distinguishing feature ofthe south-western Baltic Sea is that this region serves as atransit area for the outflow of excess water through theDanish Straits. Major water exchange between the westernBaltic Sea and Kattegat occurs owing to specific atmospher-ic conditions. The outflow is sporadically replaced by large-scale saline water inflows (Matthäus and Lass 1995). Thebaroclinic Rossby radius is about 5 km (Osiński et al. 2010);therefore, most of medium-resolution circulation modelswith grid step around 2 nautical miles applied so far are barelyeddy resolving. Furthermore, fine horizontal and vertical
resolution is needed to resolve straits topography and sharpstratification; for example, the shallow Belt Sea is character-ised by Rossby radii of 1–4 km (Fennel et al. 1991).
The exact patterns and the beaching points of oil pollu-tion are extremely complicated and hardly predictable indetails (Vandenbulcke et al. 2009; Broström et al. 2011).On the other hand, there frequently exist semi-persistentcurrents and pathways of water masses at different time-scales even in the sea areas where the overall dynamics isextremely irregular (Lehmann et al. 2002; Meier 2007;Soomere et al. 2011d). These pathways may support unex-pectedly rapid transport of pollution in unfavourable cases.Conversely, they can be used to reduce certain adverseimpacts and to implicitly protect specific regions (Soomereand Quak 2007).
In this paper, we apply the techniques developed inSoomere et al. (2010, 2011a) for the identification of envi-ronmentally safest fairways for the south-western Baltic Seaand Kattegat. The key idea is to optimise beforehand thelocation for the potentially dangerous activities (e.g. fair-way) so that the consequences of an accident, if it happens,
Fig. 1 The ship traffic and commonly used main fairways in the western Baltic sea
816 Ocean Dynamics (2012) 62:815–829
would be minimised. A comprehensive solution would re-quire solving the inverse problem of pollution propagation.
The present research deals with methodological problemsfocussing on transport by currents, which introduces somesimplifications in comparison with the real situations. Fol-lowing the earlier studies, we do not account for the impactof the wind- and wave-induced drift. The reader is referredto (Ardhuin et al. 2009) for the state-of-the art of the rele-vant knowledge and to (Broström et al. 2011) for a recentdiscussion of the role of the wind- and wave-induced drift inthe vicinity of our study area. Furthermore, unlike to the realpollutants, the studied here Lagrangian particles are domi-nated by simpler dynamics. Realistic pollutants are affectedby buoyancy, vertical mixing, dispersion, spreading and otherweathering processes.
Finally, we will also demonstrate that Lagrangian approachprovides new insight on ocean dynamics in the transitionzone, which could have useful geophysical relevance.
The structure of the paper is as follows. The circulationmodel and results of numerical simulations are presented inSection 2. Section 3 provides a short description of theTRACMASS code used for the calculations of Lagrangiantrajectories and depicts the long-term distributions of theLagrangian net transport speed. Section 4 provides statisticsof coastal hits that serves as the basis for the choice of theparameters of Lagrangian trajectories used in the furtheranalysis. Examples of two-dimensional (2D) distributionsof the probability for coastal hits and for the particle age arepresented in Section 5, and the long-term course of integralvalues of these parameters is analysed in Section 6. Section 7provides several examples of the optimum fairway.
2 Circulation in the western Baltic Sea, Danish straitsand Kattegat
2.1 Numerical model
Modelling of the transport of pollutants in water solveseither an advection–diffusion equation on a computationalgrid or uses a particle-tracking technique. Fundamentals ofthe present-day understanding of turbulence date back to theworks of Kolmogorov (1941, 1962) who developed thepicture of an energy cascade from the largest to the smallestscales. Empiric considerations of Stommel (1949) andOkubo (1971) appeared very useful to describe diffusivityobserved in the ocean. Osborne et al. (1986, 1989) andSanderson et al. (1990) studied the fractal behaviour ofdrifter trajectories and described dispersion in terms offractal geometry. To the best of authors’ knowledge, La-grangian techniques to compute dispersion of pollutantshave been first applied by Maier-Reimer (1973). In laterworks Lagrangian particle tracking has been applied by
Bork and Maier-Reimer (1978) to the heat transport, Dippner(1983) to the oil dispersion, as well as bymany other research-ers to different oceanographic problems.
The method for the approximate solving of the inverseproblem of Lagrangian transport in the context of the iden-tification of the optimum fairway described in detail in(Soomere et al. 2010, 2011a, b; Andrejev et al. 2010, 2011;Viikmäe et al. 2010) consists of four key components: (1) acirculation model for the sea area in question, (2) a method forthe calculation of Lagrangian trajectories, (3) a technique forthe construction of the cost function that characterises theenvironmental risk and finally (4) a procedure for the identi-fication of the optimum location of the potentially dangerousactivities.
In this study, we use an off-line method for simulations ofLagrangian transport of selected water particles: the trajec-tories are calculated separately after the integration of thecirculation model (Soomere et al. 2010, 2011a, b) using theTRACMASS code (Döös 1995; De Vries and Döös 2001).The particles are locked in the uppermost layer and thusexert only horizontal advection.
The circulation model, Denmark’s Meteorological Insti-tute (DMI)/BSH cmod, is a three-dimensional (3D) primi-tive equation, hydrostatic, free-surface ocean model, whichhas been developed originally by BSH (German FederalMaritime and Hydrographic Agency, Kleine 1994; Dick etal. 2001), further developed by DMI (Buch and She 2005;Lasern et al. 2007; Liu et al. 2009; She et al. 2007) and isnow known as the HIROMB-BOOS community model(Funkquist 2001). It solves the Navier–Stokes equationsfor the currents and budget equations for temperature andsalinity on a staggered Arakawa C-grid in spherical coordi-nates. Turbulent momentum exchange in the horizontal isparameterised following (Smagorinsky 1963) approach. Avertical mixing parameterisation has been implementedbased on the k-ω turbulence model that is extended forbuoyancy affected geophysical flows following (Umlauf etal. 2003). The model is coupled with a sea ice model (Hibler1979) treating both its dynamic and thermodynamicproperties.
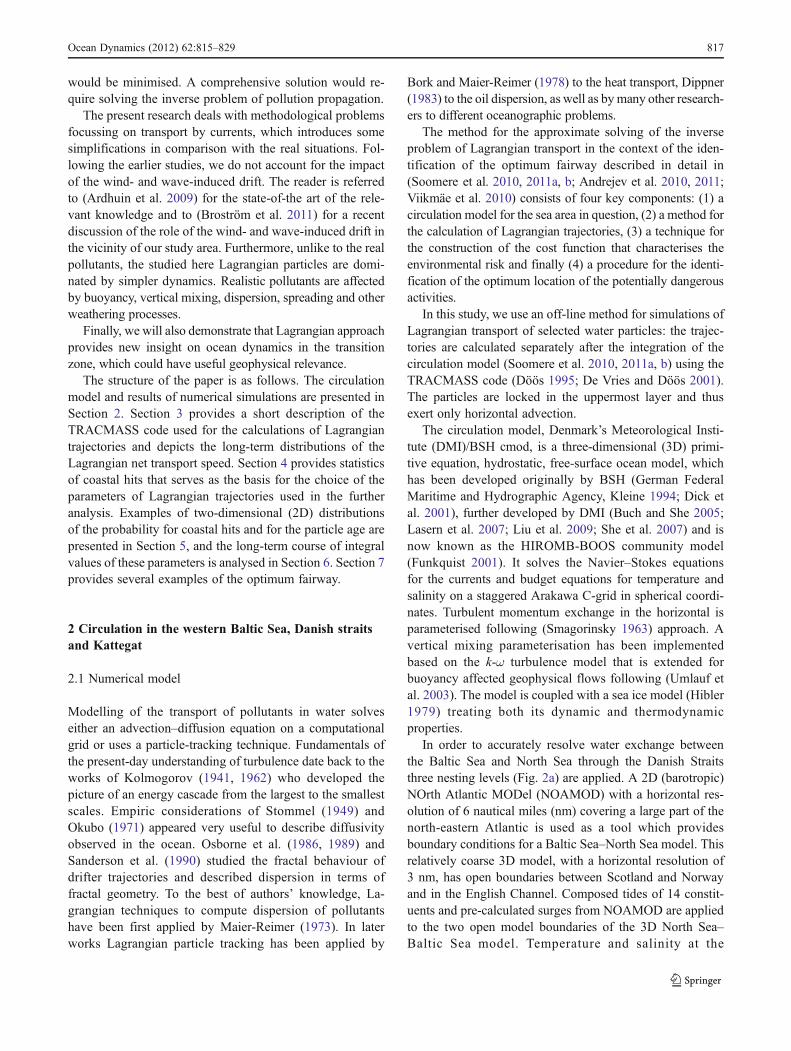
In order to accurately resolve water exchange betweenthe Baltic Sea and North Sea through the Danish Straitsthree nesting levels (Fig. 2a) are applied. A 2D (barotropic)NOrth Atlantic MODel (NOAMOD) with a horizontal res-olution of 6 nautical miles (nm) covering a large part of thenorth-eastern Atlantic is used as a tool which providesboundary conditions for a Baltic Sea–North Sea model. Thisrelatively coarse 3D model, with a horizontal resolution of3 nm, has open boundaries between Scotland and Norwayand in the English Channel. Composed tides of 14 constit-uents and pre-calculated surges from NOAMOD are appliedto the two open model boundaries of the 3D North Sea–Baltic Sea model. Temperature and salinity at the
Ocean Dynamics (2012) 62:815–829 817
boundaries are derived from the relevant monthly climatol-ogy and introduced into the 3D model using a sponge layer.Sea ice concentrations at the open lateral boundaries are alsoderived from monthly climatology.
Finally, a 3D model covering the transition area fromSkagen to Bornholm (80904 surface wet points) is two-way nested (Fig. 2b) into the above Baltic Sea–North Seamodel. The initial temperature and salinity data of the DMI/BSH cmod are taken from climatic data set for the BalticSea and North Sea.
The two-way nested grids for the North Sea–Baltic Sea(horizontal resolution of 3 nm, 50 layers in the vertical) andthe transition zone (0.5 nm, 52 layers) have matching reso-lution down to 76 m. This high vertical resolution enables aprecise mapping of the straits and sills topography, as wellas a correct representation of the thermohaline stratification.
The models are driven by hourly meteorological forcing(10 m winds, 2 m air temperature, mean sea level pressure,surface humidity and cloud cover) from DMIs 40 yearsreanalysis: a high-resolution ERA40/ERAInterim downscal-ing product of DMIs regional climate model HIRHAM(Christensen et al. 2006), with a horizontal resolution of12 km. This model uses High Resolution Limited AreaModel(http://hirlam.org) physics and parameterisations described byRoeckner et al. (2003). The surface heat flux is parameterisedwith bulk aerodynamic formulas using atmospheric data andsimulated sea surface temperature. River runoff is providedmonthly for 31 rivers from the BALTEX Hydrological DataCentre (http://www.smhi.se/sgn0102/bhdc/).
2.2 Analysis of surface transport
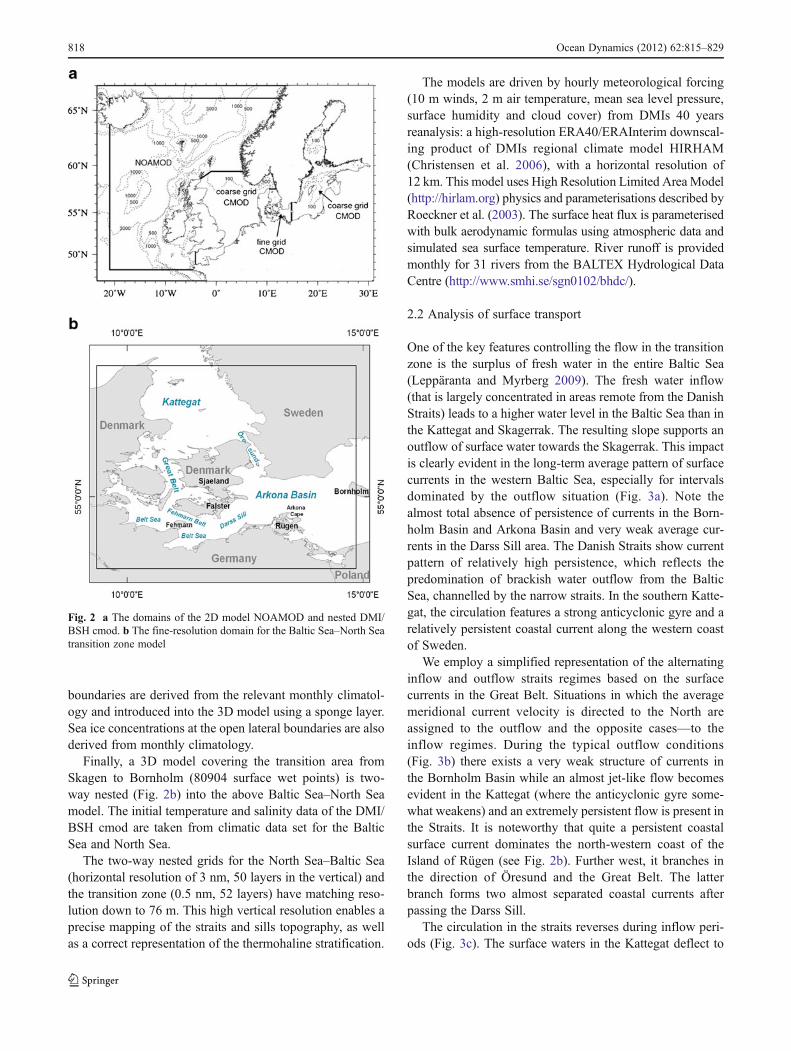
One of the key features controlling the flow in the transitionzone is the surplus of fresh water in the entire Baltic Sea(Leppäranta and Myrberg 2009). The fresh water inflow(that is largely concentrated in areas remote from the DanishStraits) leads to a higher water level in the Baltic Sea than inthe Kattegat and Skagerrak. The resulting slope supports anoutflow of surface water towards the Skagerrak. This impactis clearly evident in the long-term average pattern of surfacecurrents in the western Baltic Sea, especially for intervalsdominated by the outflow situation (Fig. 3a). Note thealmost total absence of persistence of currents in the Born-holm Basin and Arkona Basin and very weak average cur-rents in the Darss Sill area. The Danish Straits show currentpattern of relatively high persistence, which reflects thepredomination of brackish water outflow from the BalticSea, channelled by the narrow straits. In the southern Katte-gat, the circulation features a strong anticyclonic gyre and arelatively persistent coastal current along the western coastof Sweden.
We employ a simplified representation of the alternatinginflow and outflow straits regimes based on the surfacecurrents in the Great Belt. Situations in which the averagemeridional current velocity is directed to the North areassigned to the outflow and the opposite cases—to theinflow regimes. During the typical outflow conditions(Fig. 3b) there exists a very weak structure of currents inthe Bornholm Basin while an almost jet-like flow becomesevident in the Kattegat (where the anticyclonic gyre some-what weakens) and an extremely persistent flow is present inthe Straits. It is noteworthy that quite a persistent coastalsurface current dominates the north-western coast of theIsland of Rügen (see Fig. 2b). Further west, it branches inthe direction of Öresund and the Great Belt. The latterbranch forms two almost separated coastal currents afterpassing the Darss Sill.
The circulation in the straits reverses during inflow peri-ods (Fig. 3c). The surface waters in the Kattegat deflect to
Fig. 2 a The domains of the 2D model NOAMOD and nested DMI/BSH cmod. b The fine-resolution domain for the Baltic Sea–North Seatransition zone model
818 Ocean Dynamics (2012) 62:815–829
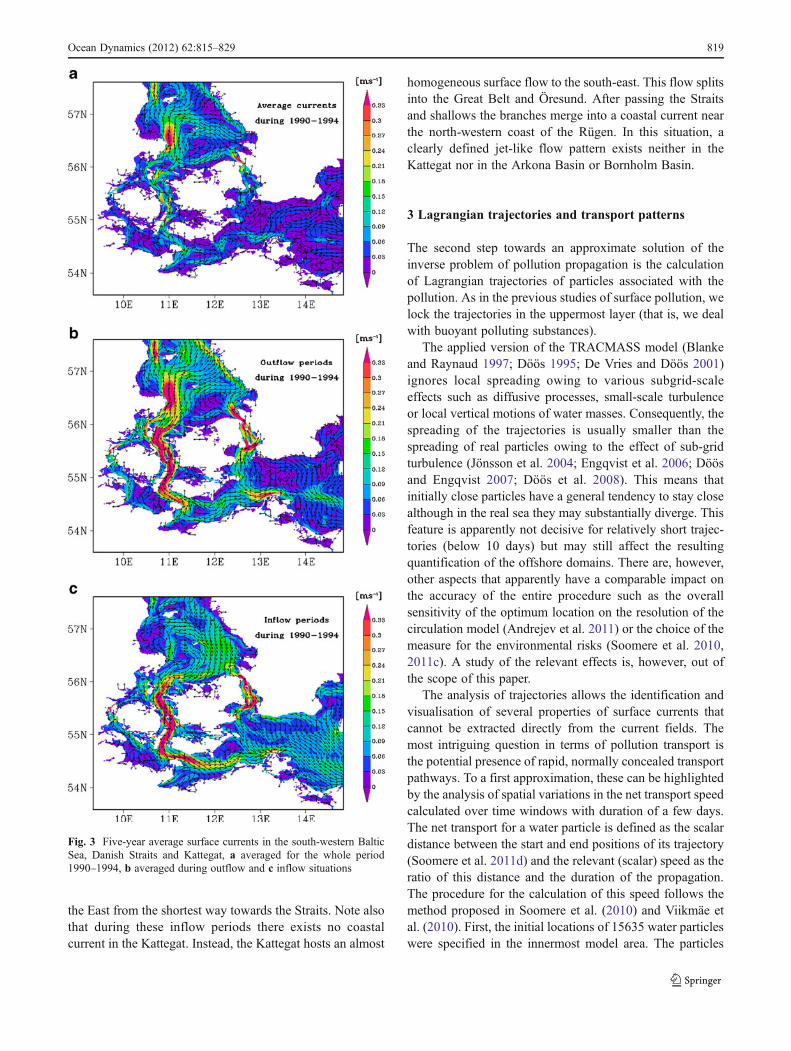
the East from the shortest way towards the Straits. Note alsothat during these inflow periods there exists no coastalcurrent in the Kattegat. Instead, the Kattegat hosts an almost
homogeneous surface flow to the south-east. This flow splitsinto the Great Belt and Öresund. After passing the Straitsand shallows the branches merge into a coastal current nearthe north-western coast of the Rügen. In this situation, aclearly defined jet-like flow pattern exists neither in theKattegat nor in the Arkona Basin or Bornholm Basin.
3 Lagrangian trajectories and transport patterns
The second step towards an approximate solution of theinverse problem of pollution propagation is the calculationof Lagrangian trajectories of particles associated with thepollution. As in the previous studies of surface pollution, welock the trajectories in the uppermost layer (that is, we dealwith buoyant polluting substances).
The applied version of the TRACMASS model (Blankeand Raynaud 1997; Döös 1995; De Vries and Döös 2001)ignores local spreading owing to various subgrid-scaleeffects such as diffusive processes, small-scale turbulenceor local vertical motions of water masses. Consequently, thespreading of the trajectories is usually smaller than thespreading of real particles owing to the effect of sub-gridturbulence (Jönsson et al. 2004; Engqvist et al. 2006; Döösand Engqvist 2007; Döös et al. 2008). This means thatinitially close particles have a general tendency to stay closealthough in the real sea they may substantially diverge. Thisfeature is apparently not decisive for relatively short trajec-tories (below 10 days) but may still affect the resultingquantification of the offshore domains. There are, however,other aspects that apparently have a comparable impact onthe accuracy of the entire procedure such as the overallsensitivity of the optimum location on the resolution of thecirculation model (Andrejev et al. 2011) or the choice of themeasure for the environmental risks (Soomere et al. 2010,2011c). A study of the relevant effects is, however, out ofthe scope of this paper.
The analysis of trajectories allows the identification andvisualisation of several properties of surface currents thatcannot be extracted directly from the current fields. Themost intriguing question in terms of pollution transport isthe potential presence of rapid, normally concealed transportpathways. To a first approximation, these can be highlightedby the analysis of spatial variations in the net transport speedcalculated over time windows with duration of a few days.The net transport for a water particle is defined as the scalardistance between the start and end positions of its trajectory(Soomere et al. 2011d) and the relevant (scalar) speed as theratio of this distance and the duration of the propagation.The procedure for the calculation of this speed follows themethod proposed in Soomere et al. (2010) and Viikmäe etal. (2010). First, the initial locations of 15635 water particleswere specified in the innermost model area. The particles
Fig. 3 Five-year average surface currents in the south-western BalticSea, Danish Straits and Kattegat, a averaged for the whole period1990–1994, b averaged during outflow and c inflow situations
Ocean Dynamics (2012) 62:815–829 819
were released at the centre point of every other grid cell,leaving every second row and column empty. Trajectorieswere calculated starting from 00:00 on 1 January 1990 over5 days. The trajectory simulations for the same initial posi-tions of particles are restarted from 12:00 on 01 January for5 days, at 00:00 on 02 January for 5 days, etc., until the end ofthe year 1994. The time window was tw05 days and the timelag between windows was 12 h. The net transport speed foreach grid cell containing particles is estimated as an average ofthe relevant values for all trajectories that started from this cellat different times (Soomere et al. 2011d). In essence, a spatialpattern of the net transport speed for a particular duration ofthe trajectories is a natural extension of the measure ofthe 5-year flow persistency used in Andrejev et al. (2004a, b)
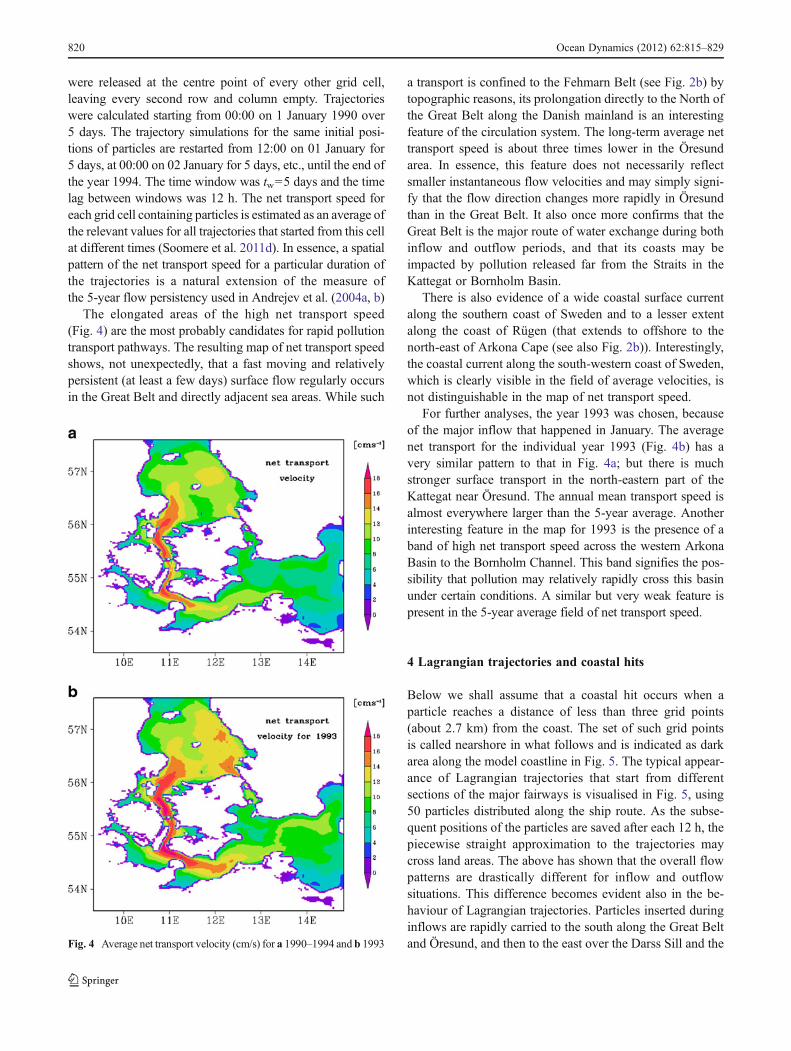
The elongated areas of the high net transport speed(Fig. 4) are the most probably candidates for rapid pollutiontransport pathways. The resulting map of net transport speedshows, not unexpectedly, that a fast moving and relativelypersistent (at least a few days) surface flow regularly occursin the Great Belt and directly adjacent sea areas. While such
a transport is confined to the Fehmarn Belt (see Fig. 2b) bytopographic reasons, its prolongation directly to the North ofthe Great Belt along the Danish mainland is an interestingfeature of the circulation system. The long-term average nettransport speed is about three times lower in the Öresundarea. In essence, this feature does not necessarily reflectsmaller instantaneous flow velocities and may simply signi-fy that the flow direction changes more rapidly in Öresundthan in the Great Belt. It also once more confirms that theGreat Belt is the major route of water exchange during bothinflow and outflow periods, and that its coasts may beimpacted by pollution released far from the Straits in theKattegat or Bornholm Basin.
There is also evidence of a wide coastal surface currentalong the southern coast of Sweden and to a lesser extentalong the coast of Rügen (that extends to offshore to thenorth-east of Arkona Cape (see also Fig. 2b)). Interestingly,the coastal current along the south-western coast of Sweden,which is clearly visible in the field of average velocities, isnot distinguishable in the map of net transport speed.
For further analyses, the year 1993 was chosen, becauseof the major inflow that happened in January. The averagenet transport for the individual year 1993 (Fig. 4b) has avery similar pattern to that in Fig. 4a; but there is muchstronger surface transport in the north-eastern part of theKattegat near Öresund. The annual mean transport speed isalmost everywhere larger than the 5-year average. Anotherinteresting feature in the map for 1993 is the presence of aband of high net transport speed across the western ArkonaBasin to the Bornholm Channel. This band signifies the pos-sibility that pollution may relatively rapidly cross this basinunder certain conditions. A similar but very weak feature ispresent in the 5-year average field of net transport speed.
4 Lagrangian trajectories and coastal hits
Below we shall assume that a coastal hit occurs when aparticle reaches a distance of less than three grid points(about 2.7 km) from the coast. The set of such grid pointsis called nearshore in what follows and is indicated as darkarea along the model coastline in Fig. 5. The typical appear-ance of Lagrangian trajectories that start from differentsections of the major fairways is visualised in Fig. 5, using50 particles distributed along the ship route. As the subse-quent positions of the particles are saved after each 12 h, thepiecewise straight approximation to the trajectories maycross land areas. The above has shown that the overall flowpatterns are drastically different for inflow and outflowsituations. This difference becomes evident also in the be-haviour of Lagrangian trajectories. Particles inserted duringinflows are rapidly carried to the south along the Great Beltand Öresund, and then to the east over the Darss Sill and theFig. 4 Average net transport velocity (cm/s) for a 1990–1994 and b 1993
820 Ocean Dynamics (2012) 62:815–829
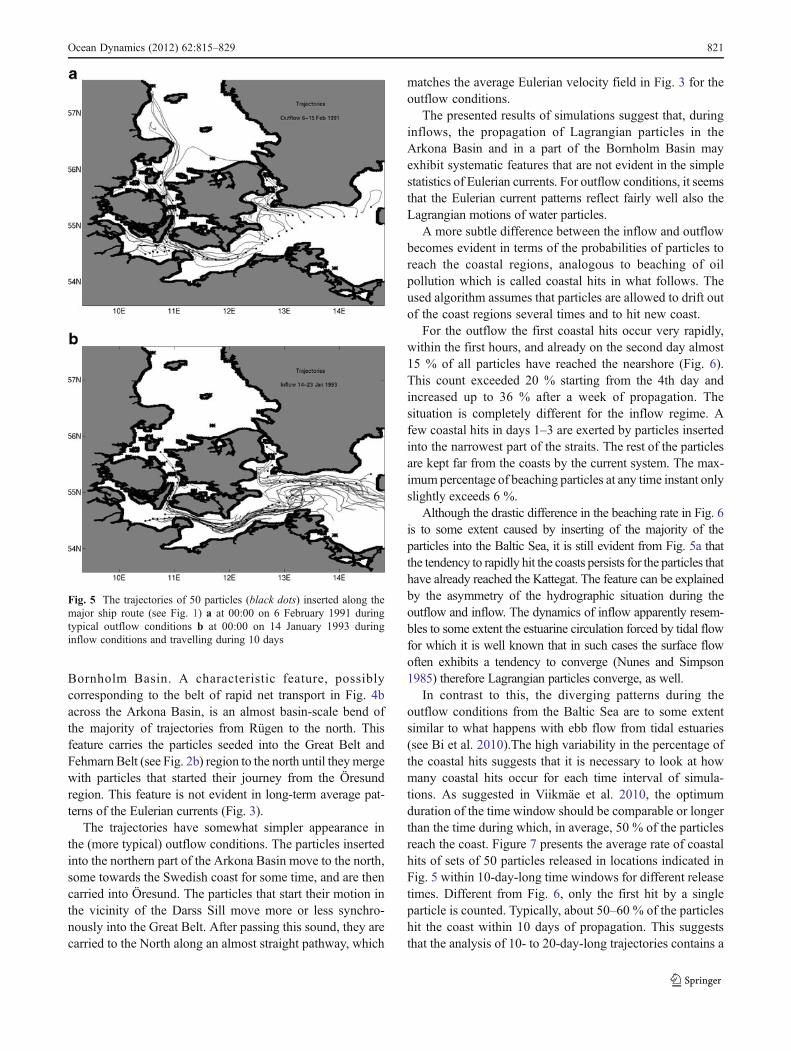
Bornholm Basin. A characteristic feature, possiblycorresponding to the belt of rapid net transport in Fig. 4bacross the Arkona Basin, is an almost basin-scale bend ofthe majority of trajectories from Rügen to the north. Thisfeature carries the particles seeded into the Great Belt andFehmarn Belt (see Fig. 2b) region to the north until theymergewith particles that started their journey from the Öresundregion. This feature is not evident in long-term average pat-terns of the Eulerian currents (Fig. 3).
The trajectories have somewhat simpler appearance inthe (more typical) outflow conditions. The particles insertedinto the northern part of the Arkona Basin move to the north,some towards the Swedish coast for some time, and are thencarried into Öresund. The particles that start their motion inthe vicinity of the Darss Sill move more or less synchro-nously into the Great Belt. After passing this sound, they arecarried to the North along an almost straight pathway, which
matches the average Eulerian velocity field in Fig. 3 for theoutflow conditions.
The presented results of simulations suggest that, duringinflows, the propagation of Lagrangian particles in theArkona Basin and in a part of the Bornholm Basin mayexhibit systematic features that are not evident in the simplestatistics of Eulerian currents. For outflow conditions, it seemsthat the Eulerian current patterns reflect fairly well also theLagrangian motions of water particles.
A more subtle difference between the inflow and outflowbecomes evident in terms of the probabilities of particles toreach the coastal regions, analogous to beaching of oilpollution which is called coastal hits in what follows. Theused algorithm assumes that particles are allowed to drift outof the coast regions several times and to hit new coast.
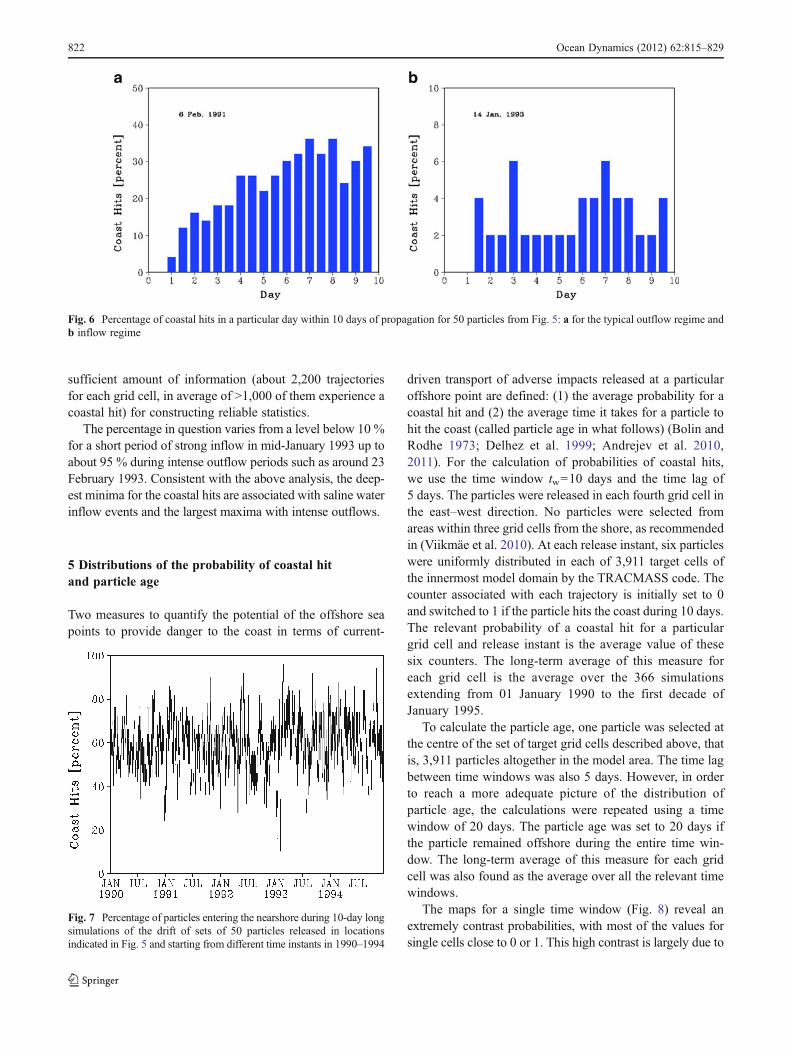
For the outflow the first coastal hits occur very rapidly,within the first hours, and already on the second day almost15 % of all particles have reached the nearshore (Fig. 6).This count exceeded 20 % starting from the 4th day andincreased up to 36 % after a week of propagation. Thesituation is completely different for the inflow regime. Afew coastal hits in days 1–3 are exerted by particles insertedinto the narrowest part of the straits. The rest of the particlesare kept far from the coasts by the current system. The max-imum percentage of beaching particles at any time instant onlyslightly exceeds 6 %.
Although the drastic difference in the beaching rate in Fig. 6is to some extent caused by inserting of the majority of theparticles into the Baltic Sea, it is still evident from Fig. 5a thatthe tendency to rapidly hit the coasts persists for the particles thathave already reached the Kattegat. The feature can be explainedby the asymmetry of the hydrographic situation during theoutflow and inflow. The dynamics of inflow apparently resem-bles to some extent the estuarine circulation forced by tidal flowfor which it is well known that in such cases the surface flowoften exhibits a tendency to converge (Nunes and Simpson1985) therefore Lagrangian particles converge, as well.
In contrast to this, the diverging patterns during theoutflow conditions from the Baltic Sea are to some extentsimilar to what happens with ebb flow from tidal estuaries(see Bi et al. 2010).The high variability in the percentage ofthe coastal hits suggests that it is necessary to look at howmany coastal hits occur for each time interval of simula-tions. As suggested in Viikmäe et al. 2010, the optimumduration of the time window should be comparable or longerthan the time during which, in average, 50 % of the particlesreach the coast. Figure 7 presents the average rate of coastalhits of sets of 50 particles released in locations indicated inFig. 5 within 10-day-long time windows for different releasetimes. Different from Fig. 6, only the first hit by a singleparticle is counted. Typically, about 50–60 % of the particleshit the coast within 10 days of propagation. This suggeststhat the analysis of 10- to 20-day-long trajectories contains a
Fig. 5 The trajectories of 50 particles (black dots) inserted along themajor ship route (see Fig. 1) a at 00:00 on 6 February 1991 duringtypical outflow conditions b at 00:00 on 14 January 1993 duringinflow conditions and travelling during 10 days
Ocean Dynamics (2012) 62:815–829 821
sufficient amount of information (about 2,200 trajectoriesfor each grid cell, in average of >1,000 of them experience acoastal hit) for constructing reliable statistics.
The percentage in question varies from a level below 10 %for a short period of strong inflow in mid-January 1993 up toabout 95 % during intense outflow periods such as around 23February 1993. Consistent with the above analysis, the deep-est minima for the coastal hits are associated with saline waterinflow events and the largest maxima with intense outflows.
5 Distributions of the probability of coastal hitand particle age
Two measures to quantify the potential of the offshore seapoints to provide danger to the coast in terms of current-
driven transport of adverse impacts released at a particularoffshore point are defined: (1) the average probability for acoastal hit and (2) the average time it takes for a particle tohit the coast (called particle age in what follows) (Bolin andRodhe 1973; Delhez et al. 1999; Andrejev et al. 2010,2011). For the calculation of probabilities of coastal hits,we use the time window tw010 days and the time lag of5 days. The particles were released in each fourth grid cell inthe east–west direction. No particles were selected fromareas within three grid cells from the shore, as recommendedin (Viikmäe et al. 2010). At each release instant, six particleswere uniformly distributed in each of 3,911 target cells ofthe innermost model domain by the TRACMASS code. Thecounter associated with each trajectory is initially set to 0and switched to 1 if the particle hits the coast during 10 days.The relevant probability of a coastal hit for a particulargrid cell and release instant is the average value of thesesix counters. The long-term average of this measure foreach grid cell is the average over the 366 simulationsextending from 01 January 1990 to the first decade ofJanuary 1995.
To calculate the particle age, one particle was selected atthe centre of the set of target grid cells described above, thatis, 3,911 particles altogether in the model area. The time lagbetween time windows was also 5 days. However, in orderto reach a more adequate picture of the distribution ofparticle age, the calculations were repeated using a timewindow of 20 days. The particle age was set to 20 days ifthe particle remained offshore during the entire time win-dow. The long-term average of this measure for each gridcell was also found as the average over all the relevant timewindows.
The maps for a single time window (Fig. 8) reveal anextremely contrast probabilities, with most of the values forsingle cells close to 0 or 1. This high contrast is largely due to
Fig. 6 Percentage of coastal hits in a particular day within 10 days of propagation for 50 particles from Fig. 5: a for the typical outflow regime andb inflow regime
Fig. 7 Percentage of particles entering the nearshore during 10-day longsimulations of the drift of sets of 50 particles released in locationsindicated in Fig. 5 and starting from different time instants in 1990–1994
822 Ocean Dynamics (2012) 62:815–829
the overall tendency for the initially closely packed particles tostay together in the current version of the TRACMASS code.This feature results in a tendency that a whole bunch oftrajectories starting from a specific grid cell either all touchthe nearshore, or none of them enters the nearshore. Thecontrasts in Fig. 8 are particularly strong because only~25 % of the cells are accounted for in the calcula-tions. In addition, frequently occurring large variationsbetween the probabilities for neighbouring cells arefurther enhanced because of the complexity of thegeometry of the study area. This high level of contrastsand extreme gradients in maps for single time windowsjustifies the necessity of using as many time windowsas possible in order to reach adequate climatologicalmaps of the parameters in question.
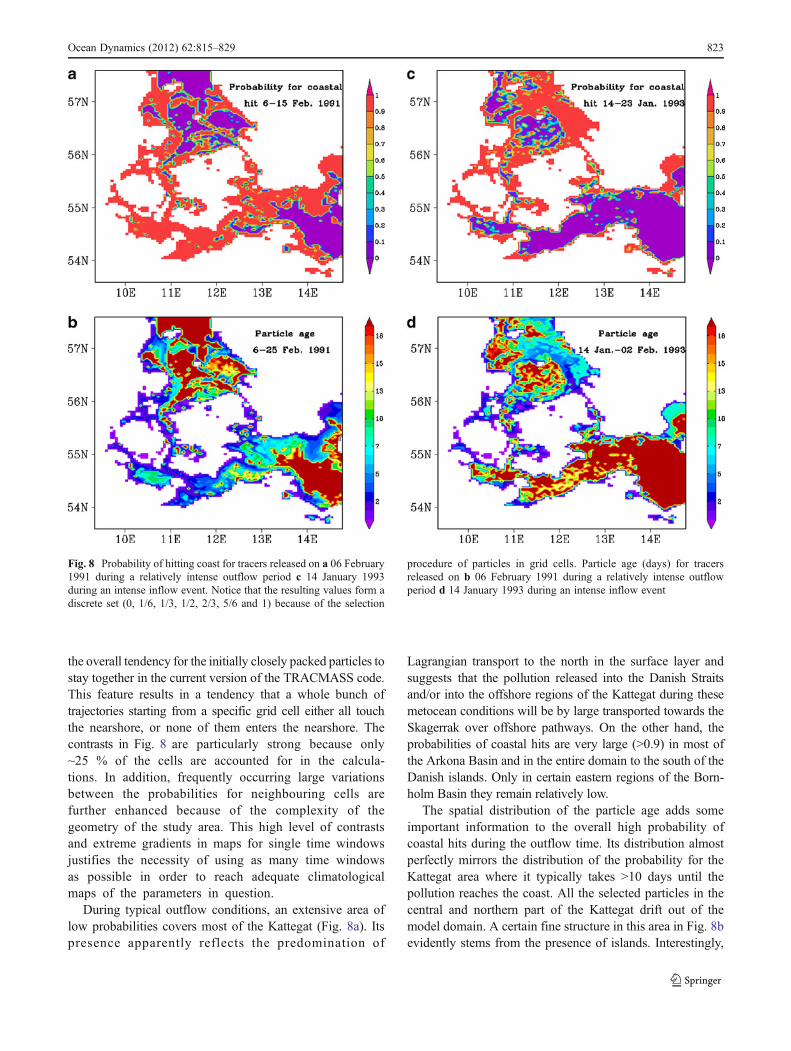
During typical outflow conditions, an extensive area oflow probabilities covers most of the Kattegat (Fig. 8a). Itspresence apparently reflects the predomination of
Lagrangian transport to the north in the surface layer andsuggests that the pollution released into the Danish Straitsand/or into the offshore regions of the Kattegat during thesemetocean conditions will be by large transported towards theSkagerrak over offshore pathways. On the other hand, theprobabilities of coastal hits are very large (>0.9) in most ofthe Arkona Basin and in the entire domain to the south of theDanish islands. Only in certain eastern regions of the Born-holm Basin they remain relatively low.
The spatial distribution of the particle age adds someimportant information to the overall high probability ofcoastal hits during the outflow time. Its distribution almostperfectly mirrors the distribution of the probability for theKattegat area where it typically takes >10 days until thepollution reaches the coast. All the selected particles in thecentral and northern part of the Kattegat drift out of themodel domain. A certain fine structure in this area in Fig. 8bevidently stems from the presence of islands. Interestingly,
Fig. 8 Probability of hitting coast for tracers released on a 06 February1991 during a relatively intense outflow period c 14 January 1993during an intense inflow event. Notice that the resulting values form adiscrete set (0, 1/6, 1/3, 1/2, 2/3, 5/6 and 1) because of the selection
procedure of particles in grid cells. Particle age (days) for tracersreleased on b 06 February 1991 during a relatively intense outflowperiod d 14 January 1993 during an intense inflow event
Ocean Dynamics (2012) 62:815–829 823
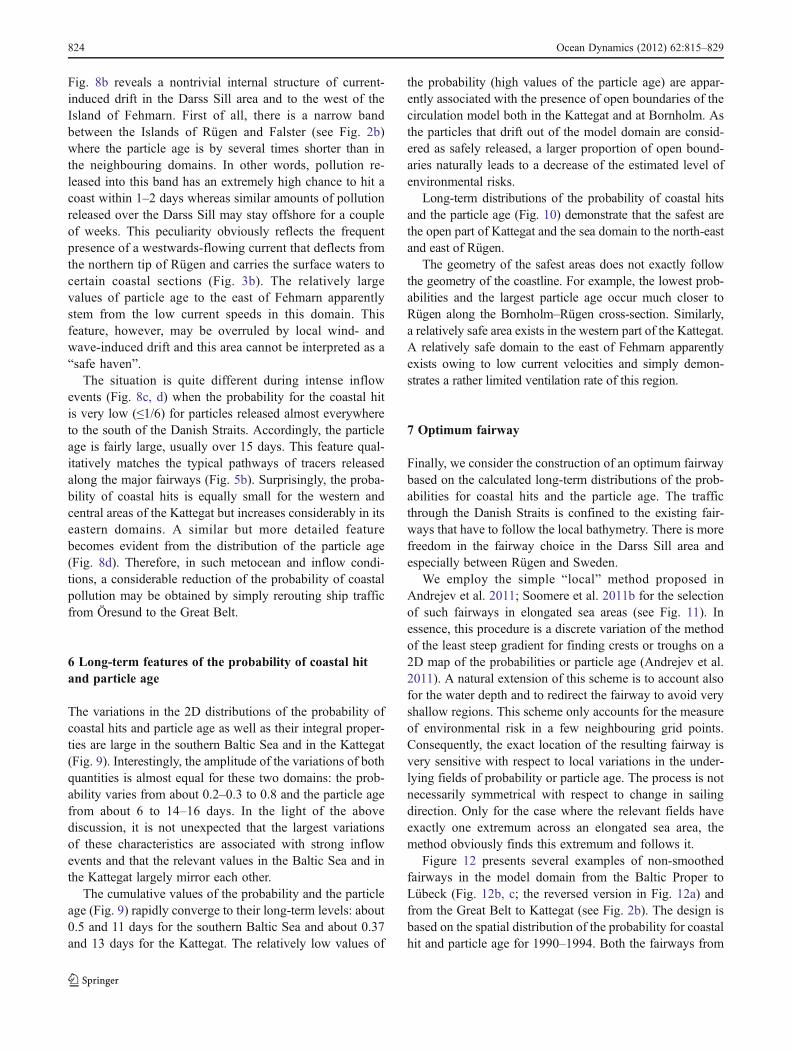
Fig. 8b reveals a nontrivial internal structure of current-induced drift in the Darss Sill area and to the west of theIsland of Fehmarn. First of all, there is a narrow bandbetween the Islands of Rügen and Falster (see Fig. 2b)where the particle age is by several times shorter than inthe neighbouring domains. In other words, pollution re-leased into this band has an extremely high chance to hit acoast within 1–2 days whereas similar amounts of pollutionreleased over the Darss Sill may stay offshore for a coupleof weeks. This peculiarity obviously reflects the frequentpresence of a westwards-flowing current that deflects fromthe northern tip of Rügen and carries the surface waters tocertain coastal sections (Fig. 3b). The relatively largevalues of particle age to the east of Fehmarn apparentlystem from the low current speeds in this domain. Thisfeature, however, may be overruled by local wind- andwave-induced drift and this area cannot be interpreted as a“safe haven”.
The situation is quite different during intense inflowevents (Fig. 8c, d) when the probability for the coastal hitis very low (≤1/6) for particles released almost everywhereto the south of the Danish Straits. Accordingly, the particleage is fairly large, usually over 15 days. This feature qual-itatively matches the typical pathways of tracers releasedalong the major fairways (Fig. 5b). Surprisingly, the proba-bility of coastal hits is equally small for the western andcentral areas of the Kattegat but increases considerably in itseastern domains. A similar but more detailed featurebecomes evident from the distribution of the particle age(Fig. 8d). Therefore, in such metocean and inflow condi-tions, a considerable reduction of the probability of coastalpollution may be obtained by simply rerouting ship trafficfrom Öresund to the Great Belt.
6 Long-term features of the probability of coastal hitand particle age
The variations in the 2D distributions of the probability ofcoastal hits and particle age as well as their integral proper-ties are large in the southern Baltic Sea and in the Kattegat(Fig. 9). Interestingly, the amplitude of the variations of bothquantities is almost equal for these two domains: the prob-ability varies from about 0.2–0.3 to 0.8 and the particle agefrom about 6 to 14–16 days. In the light of the abovediscussion, it is not unexpected that the largest variationsof these characteristics are associated with strong inflowevents and that the relevant values in the Baltic Sea and inthe Kattegat largely mirror each other.
The cumulative values of the probability and the particleage (Fig. 9) rapidly converge to their long-term levels: about0.5 and 11 days for the southern Baltic Sea and about 0.37and 13 days for the Kattegat. The relatively low values of
the probability (high values of the particle age) are appar-ently associated with the presence of open boundaries of thecirculation model both in the Kattegat and at Bornholm. Asthe particles that drift out of the model domain are consid-ered as safely released, a larger proportion of open bound-aries naturally leads to a decrease of the estimated level ofenvironmental risks.
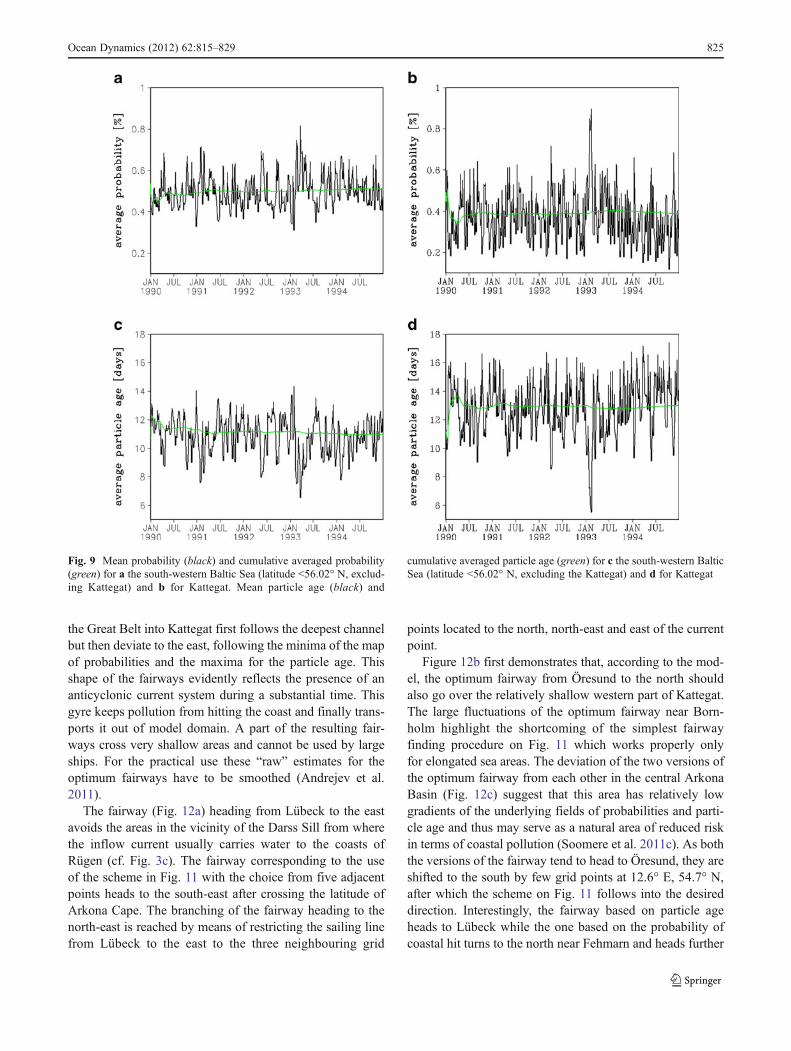
Long-term distributions of the probability of coastal hitsand the particle age (Fig. 10) demonstrate that the safest arethe open part of Kattegat and the sea domain to the north-eastand east of Rügen.
The geometry of the safest areas does not exactly followthe geometry of the coastline. For example, the lowest prob-abilities and the largest particle age occur much closer toRügen along the Bornholm–Rügen cross-section. Similarly,a relatively safe area exists in the western part of the Kattegat.A relatively safe domain to the east of Fehmarn apparentlyexists owing to low current velocities and simply demon-strates a rather limited ventilation rate of this region.
7 Optimum fairway
Finally, we consider the construction of an optimum fairwaybased on the calculated long-term distributions of the prob-abilities for coastal hits and the particle age. The trafficthrough the Danish Straits is confined to the existing fair-ways that have to follow the local bathymetry. There is morefreedom in the fairway choice in the Darss Sill area andespecially between Rügen and Sweden.
We employ the simple “local” method proposed inAndrejev et al. 2011; Soomere et al. 2011b for the selectionof such fairways in elongated sea areas (see Fig. 11). Inessence, this procedure is a discrete variation of the methodof the least steep gradient for finding crests or troughs on a2D map of the probabilities or particle age (Andrejev et al.2011). A natural extension of this scheme is to account alsofor the water depth and to redirect the fairway to avoid veryshallow regions. This scheme only accounts for the measureof environmental risk in a few neighbouring grid points.Consequently, the exact location of the resulting fairway isvery sensitive with respect to local variations in the under-lying fields of probability or particle age. The process is notnecessarily symmetrical with respect to change in sailingdirection. Only for the case where the relevant fields haveexactly one extremum across an elongated sea area, themethod obviously finds this extremum and follows it.
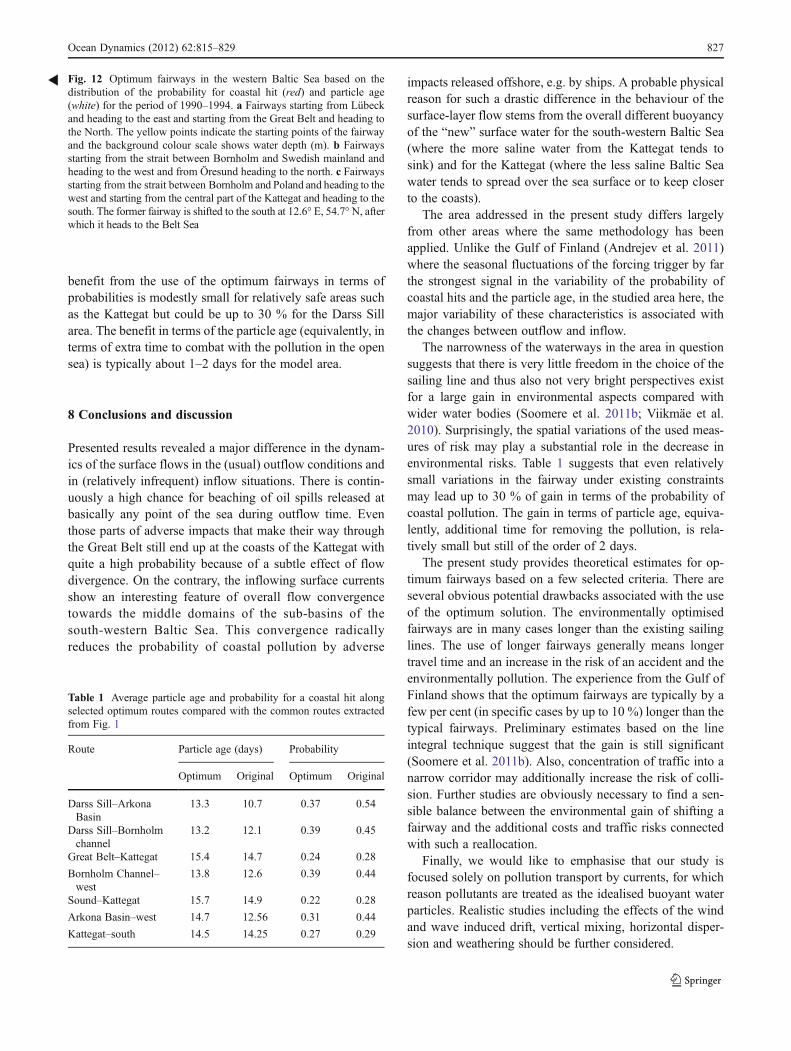
Figure 12 presents several examples of non-smoothedfairways in the model domain from the Baltic Proper toLübeck (Fig. 12b, c; the reversed version in Fig. 12a) andfrom the Great Belt to Kattegat (see Fig. 2b). The design isbased on the spatial distribution of the probability for coastalhit and particle age for 1990–1994. Both the fairways from
824 Ocean Dynamics (2012) 62:815–829
the Great Belt into Kattegat first follows the deepest channelbut then deviate to the east, following the minima of the mapof probabilities and the maxima for the particle age. Thisshape of the fairways evidently reflects the presence of ananticyclonic current system during a substantial time. Thisgyre keeps pollution from hitting the coast and finally trans-ports it out of model domain. A part of the resulting fair-ways cross very shallow areas and cannot be used by largeships. For the practical use these “raw” estimates for theoptimum fairways have to be smoothed (Andrejev et al.2011).
The fairway (Fig. 12a) heading from Lübeck to the eastavoids the areas in the vicinity of the Darss Sill from wherethe inflow current usually carries water to the coasts ofRügen (cf. Fig. 3c). The fairway corresponding to the useof the scheme in Fig. 11 with the choice from five adjacentpoints heads to the south-east after crossing the latitude ofArkona Cape. The branching of the fairway heading to thenorth-east is reached by means of restricting the sailing linefrom Lübeck to the east to the three neighbouring grid
points located to the north, north-east and east of the currentpoint.
Figure 12b first demonstrates that, according to the mod-el, the optimum fairway from Öresund to the north shouldalso go over the relatively shallow western part of Kattegat.The large fluctuations of the optimum fairway near Born-holm highlight the shortcoming of the simplest fairwayfinding procedure on Fig. 11 which works properly onlyfor elongated sea areas. The deviation of the two versions ofthe optimum fairway from each other in the central ArkonaBasin (Fig. 12c) suggest that this area has relatively lowgradients of the underlying fields of probabilities and parti-cle age and thus may serve as a natural area of reduced riskin terms of coastal pollution (Soomere et al. 2011c). As boththe versions of the fairway tend to head to Öresund, they areshifted to the south by few grid points at 12.6° E, 54.7° N,after which the scheme on Fig. 11 follows into the desireddirection. Interestingly, the fairway based on particle ageheads to Lübeck while the one based on the probability ofcoastal hit turns to the north near Fehmarn and heads further
Fig. 9 Mean probability (black) and cumulative averaged probability(green) for a the south-western Baltic Sea (latitude <56.02° N, exclud-ing Kattegat) and b for Kattegat. Mean particle age (black) and
cumulative averaged particle age (green) for c the south-western BalticSea (latitude <56.02° N, excluding the Kattegat) and d for Kattegat
Ocean Dynamics (2012) 62:815–829 825
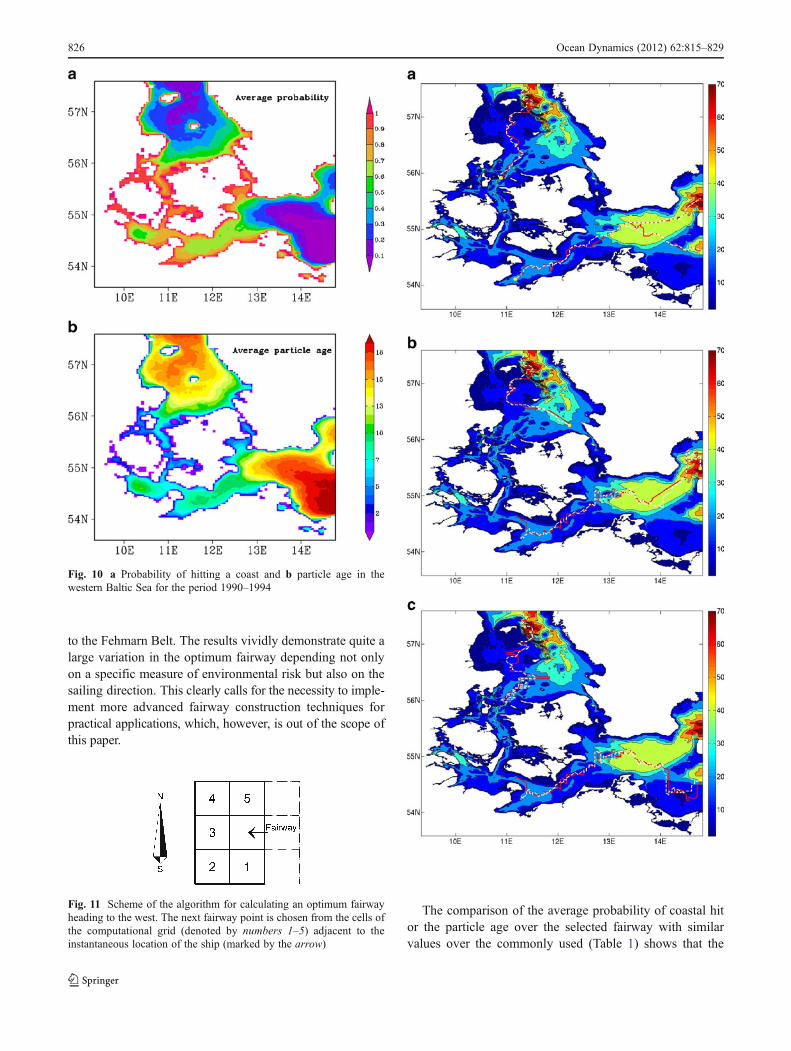
to the Fehmarn Belt. The results vividly demonstrate quite alarge variation in the optimum fairway depending not onlyon a specific measure of environmental risk but also on thesailing direction. This clearly calls for the necessity to imple-ment more advanced fairway construction techniques forpractical applications, which, however, is out of the scope ofthis paper.
The comparison of the average probability of coastal hitor the particle age over the selected fairway with similarvalues over the commonly used (Table 1) shows that the
Fig. 10 a Probability of hitting a coast and b particle age in thewestern Baltic Sea for the period 1990–1994
Fig. 11 Scheme of the algorithm for calculating an optimum fairwayheading to the west. The next fairway point is chosen from the cells ofthe computational grid (denoted by numbers 1–5) adjacent to theinstantaneous location of the ship (marked by the arrow)
826 Ocean Dynamics (2012) 62:815–829
benefit from the use of the optimum fairways in terms ofprobabilities is modestly small for relatively safe areas suchas the Kattegat but could be up to 30 % for the Darss Sillarea. The benefit in terms of the particle age (equivalently, interms of extra time to combat with the pollution in the opensea) is typically about 1–2 days for the model area.
8 Conclusions and discussion
Presented results revealed a major difference in the dynam-ics of the surface flows in the (usual) outflow conditions andin (relatively infrequent) inflow situations. There is contin-uously a high chance for beaching of oil spills released atbasically any point of the sea during outflow time. Eventhose parts of adverse impacts that make their way throughthe Great Belt still end up at the coasts of the Kattegat withquite a high probability because of a subtle effect of flowdivergence. On the contrary, the inflowing surface currentsshow an interesting feature of overall flow convergencetowards the middle domains of the sub-basins of thesouth-western Baltic Sea. This convergence radicallyreduces the probability of coastal pollution by adverse
impacts released offshore, e.g. by ships. A probable physicalreason for such a drastic difference in the behaviour of thesurface-layer flow stems from the overall different buoyancyof the “new” surface water for the south-western Baltic Sea(where the more saline water from the Kattegat tends tosink) and for the Kattegat (where the less saline Baltic Seawater tends to spread over the sea surface or to keep closerto the coasts).
The area addressed in the present study differs largelyfrom other areas where the same methodology has beenapplied. Unlike the Gulf of Finland (Andrejev et al. 2011)where the seasonal fluctuations of the forcing trigger by farthe strongest signal in the variability of the probability ofcoastal hits and the particle age, in the studied area here, themajor variability of these characteristics is associated withthe changes between outflow and inflow.
The narrowness of the waterways in the area in questionsuggests that there is very little freedom in the choice of thesailing line and thus also not very bright perspectives existfor a large gain in environmental aspects compared withwider water bodies (Soomere et al. 2011b; Viikmäe et al.2010). Surprisingly, the spatial variations of the used meas-ures of risk may play a substantial role in the decrease inenvironmental risks. Table 1 suggests that even relativelysmall variations in the fairway under existing constraintsmay lead up to 30 % of gain in terms of the probability ofcoastal pollution. The gain in terms of particle age, equiva-lently, additional time for removing the pollution, is rela-tively small but still of the order of 2 days.
The present study provides theoretical estimates for op-timum fairways based on a few selected criteria. There areseveral obvious potential drawbacks associated with the useof the optimum solution. The environmentally optimisedfairways are in many cases longer than the existing sailinglines. The use of longer fairways generally means longertravel time and an increase in the risk of an accident and theenvironmentally pollution. The experience from the Gulf ofFinland shows that the optimum fairways are typically by afew per cent (in specific cases by up to 10 %) longer than thetypical fairways. Preliminary estimates based on the lineintegral technique suggest that the gain is still significant(Soomere et al. 2011b). Also, concentration of traffic into anarrow corridor may additionally increase the risk of colli-sion. Further studies are obviously necessary to find a sen-sible balance between the environmental gain of shifting afairway and the additional costs and traffic risks connectedwith such a reallocation.
Finally, we would like to emphasise that our study isfocused solely on pollution transport by currents, for whichreason pollutants are treated as the idealised buoyant waterparticles. Realistic studies including the effects of the windand wave induced drift, vertical mixing, horizontal disper-sion and weathering should be further considered.
Table 1 Average particle age and probability for a coastal hit alongselected optimum routes compared with the common routes extractedfrom Fig. 1
Route Particle age (days) Probability
Optimum Original Optimum Original
Darss Sill–ArkonaBasin
13.3 10.7 0.37 0.54
Darss Sill–Bornholmchannel
13.2 12.1 0.39 0.45
Great Belt–Kattegat 15.4 14.7 0.24 0.28
Bornholm Channel–west
13.8 12.6 0.39 0.44
Sound–Kattegat 15.7 14.9 0.22 0.28
Arkona Basin–west 14.7 12.56 0.31 0.44
Kattegat–south 14.5 14.25 0.27 0.29
Fig. 12 Optimum fairways in the western Baltic Sea based on thedistribution of the probability for coastal hit (red) and particle age(white) for the period of 1990–1994. a Fairways starting from Lübeckand heading to the east and starting from the Great Belt and heading tothe North. The yellow points indicate the starting points of the fairwayand the background colour scale shows water depth (m). b Fairwaysstarting from the strait between Bornholm and Swedish mainland andheading to the west and from Öresund heading to the north. c Fairwaysstarting from the strait between Bornholm and Poland and heading to thewest and starting from the central part of the Kattegat and heading to thesouth. The former fairway is shifted to the south at 12.6° E, 54.7° N, afterwhich it heads to the Belt Sea
R
Ocean Dynamics (2012) 62:815–829 827
Acknowledgement Thanks are due to two anonymous reviewers fortheir useful comments and to J. Dippner who motivated us to address inthis research the broader aspect of mathematical modelling of transportof pollution in water. This study was supported by the EuropeanCommunity’s Seventh Framework Programme (FP/2007–2013) undergrant agreement no. 217246 made with the joint Baltic Sea researchand development programme BONUS within the Baltic Way project.The research was partially supported by targeted financing from theEstonian Ministry of Education and Science (grant no. SF0140007s11)and the Estonian Science Foundation (grant no. 9125). TS gratefullyacknowledges the support of the Alexander von Humboldt Founda-tions for performing research in the HZG in June–September 2011.
References
Andrejev O, Myrberg K, Alenius P, Lundberg PA (2004a) Meancirculation and water exchange in the Gulf of Finland—a studybased on three-dimensional modelling. Boreal Environ Res 9:1–16
Andrejev O, Myrberg K, Lundberg PA (2004b) Age and renewal timeof water masses in a semi-enclosed basin—application to the Gulfof Finland. Tellus 56A:548–558
Andrejev O, Sokolov A, Soomere T, Värv R, Viikmäe B (2010) Theuse of high-resolution bathymetry for circulation modelling in theGulf of Finland. Estonian J Eng 16:187–210
Andrejev O, Soomere T, Sokolov A, Myrberg K (2011) The role ofspatial resolution of a three-dimensional hydrodynamic model formarine transport risk assessment. Oceanologia 53:309–334
Ardhuin F, Marie L, Rascle N, Forget P, Roland A (2009) Observationand estimation of Lagrangian, Stokes and Eulerian currents in-duced by wind and waves at the sea surface. J Phys Oceanogr39:2820–2838
Bi NS, Yang ZS, Wang HJ, Hu BQ, Ji YJ (2010) Sediment dispersionpattern off the present Huanghe (Yellow River) subdelta and itsdynamic mechanism during normal river discharge period. EstuarCoast Shelf Sci 86:352–362
Blanke B, Raynaud S (1997) Kinematics of the Pacific Equatorialundercurrent: an Eulerian and Lagrangian approach from GCMresults. J Phys Oceanogr 27:1038–1053
Bolin B, Rodhe H (1973) A note on the concepts of age distributionand transit time in natural reservoirs. Tellus 25:58–62
Bork I, Maier-Reimer E (1978) On the spreading of power plant cool-ing water in a tidal river applied to the river Elbe. Adv WaterResour 1(3):161–168
Broström G, Carrasco A, Hole LR, Dick S, Janssen F, Mattsson J,Berger S (2011) Usefulness of high resolution coastal models foroperational oil spill forecast: the Full City accident. Ocean Sci7:805–820
Buch E, She J (2005) Operational Ocean Forecasting at the DanishMeteorological Institute. Environ Res Eng Manag 3:5–11
Christensen OB, Drews M, Christensen JH, Dethloff K, Ketelsen K,Hebestadt I, Rinke A (2006) The HIRHAM Regional ClimateModel. Version 5. DMI technical report No. 06–17, Available athttp://www.dmi.dk/dmi/tr06-17.pdf
De Vries P, Döös K (2001) Calculating Lagrangian trajectories usingtime-dependent velocity fields. J Atmos Oceanic Technol 18:1092–1101
Delhez EJM, Campin J, Hirst AC, Deleersnijder E (1999) Toward ageneral theory of the age in ocean modelling. OceanModel 1:17–27
Dick S, Kieline E, Müller-Navarra S (2001) The operational circulationmodel of BSH (BSHcmod). Model description and validation.Berichte des Bundesatesamtes für Seeschifffahrt und Hydrogra-phie 29/2001. Hamburg, Germany, 48 pp
Dippner JW (1983) A hindcast of the Bravo Ekofish blow-out (NorthSea). Veroeff Inst Meeresforsch Bremerhaven 19:245–257
Döös K (1995) Inter-ocean exchange of water masses. J Geophys ResC100:13499–13514
Döös K, Engqvist A (2007) Assessment of water exchange be-tween a discharge region and the open sea—a comparison ofdifferent methodological concepts. Estuar Coast Shelf Sci74:709–721
Döös K, Nycander J, Coward AC (2008) Lagrangian decomposition ofthe Deacon Cell. J Geophys Res C 113:07028
Engqvist A, Döös K, Andrejev O (2006) Modeling water exchange andcontaminant transport through a Baltic coastal region. Ambio35:435–447
Fennel W, Seifert T, Kayser B (1991) Rossby radii and phase speeds inthe Baltic Sea. Cont Shelf Res 11:23–36
Funkquist L (2001) HIROMIB: An operational eddy-resolving modelfor the Baltic Sea. Bull Maritime Inst Gdansk 28:7–16
Gollasch S, Leppäkoski E (2007) Risk assessment and managementscenarios for ballast water mediated species introduction into theBaltic Sea. Aquat Invasions 2:313–340
Hibler WD (1979) A dynamic thermodynamic sea ice model. J PhysOceanogr 9:815–846
Jönsson B, Lundberg P, Döös K (2004) Baltic sub-basin turnover timesexamined using the Rossby Centre Ocean Model. Ambio 23:257–260
Kachel MJ (2008) Particularly sensitive sea areas. Hamburg studies onmaritime affairs, 13. Springer, Berlin, 376 pp
Kleine E (1994) Das operationelle Modell des BSH für Nordsee undOstsee. Bundesamt fur Seeschifffart und Hydrographie. Technicalreport, 126 pp
Kolmogorov AN (1941) The local structure of turbulence in an incom-pressible fluid for very large Reynolds numbers. Comptes rendus(Doklady) de l’Academie des Sciences de l’URSS 31:301–305
Kolmogorov AN (1962) A refinement of previous hypothesesconcerning the local structure of turbulence in a viscous incom-pressible fluid at high Reynolds number. J Fluid Mech 13:82–85
Lasern J, Høyer JL, She J (2007) Validation of a hybrid optimalinterpolation and Kalman filter scheme of sea surface temperatureassimilation. J Mar Sys 65:122–133
Lehmann A, Krauss W, Hinrichsen H-H (2002) Effects of remote andlocal atmospheric forcing on circulation and upwelling in theBaltic Sea. Tellus 54A:299–316
Leppäranta M, Myrberg K (2009) Physical oceanography of the BalticSea. Springer, Berlin, 378 pp
Liu Y, Zhu J, She J, Zhuang S, Fu W, Gao J (2009) Assimilatingtemperature and salinity profile observations using an anisotropicrecursive filter in a coastal ocean model. Ocean Model 30:75–87
Maier-Reimer E (1973) Hydrodynamical numerical investigation onhorizontal dispersion and transport process in the North Sea. Mittei-lungen des Institutes für Meereskunde der Universität Hamburg 21,96 pp
Matthäus W, Lass HU (1995) The recent salt inflow into the Baltic Sea.J Phys Oceanogr 25:280–286
Meier HEM (2007) Modeling the pathways and ages of inflowing salt-and freshwater in the Baltic Sea. Estuar Coast Shelf Sci 74:610–627
Nunes RA, Simpson JH (1985) Axial convergence in a well-mixedestuary. Estuar Coast Shelf Sci 20:637–649
Okubo A (1971) Oceanic diffusion diagrams. Deep-Sea Res 18:789–802
Osborne AR, Kirwan AD Jr, Provenzale A, Bergamasco L (1986) Aresearch for chaotic behaviour in large and mesoscale motions inthe Pacific Ocean. Physica 23D:75–83
Osborne AR, Kirwan AD, Provenzale A, Bergamasco L (1989)Fractal drifter trajectories in the Kuroshio extension. Tellus41A:416–435
828 Ocean Dynamics (2012) 62:815–829
Osiński R, Rak D, Walczowski W, Piechura J (2010) BaroclinicRossby radius of deformation in the southern Baltic Sea. Ocean-ologia 52:417–429
Roeckner E, Bäuml G, Bonaventura L, Brokopf R, Esch M, GiorgettaM, Hagemann S, Kirchner I, Kornblueh L, Manzini E, Rhodin A,Schlese U, Schulzweida U, Tompkins A (2003) The atmosphericgeneral circulation model ECHAM5. Part 1. Model description.Report no. 349, Max-Planck-Institut für Meteorologie
Sanderson BG, Goulding A, Okubo A (1990) The fractal dimension ofrelative Lagrangian motion. Tellus 42A:550–556
She J, Berg P, Berg J (2007) Bathymetry effects on water exchangemodelling the Danish Straits. J Mar Syst 65:450–459
Smagorinsky J (1963) General circulation experiments with the prim-itive equations I. The basic experiment. Mon Wea Rev 91:99–164
Soomere T, Quak E (2007) On the potential of reducing coastal pollutionby a proper choice of the fairway. J Coastal Res Special Issue50:678–682
Soomere T, Viikmäe B, Delpeche N, Myrberg K (2010) Towardsidentification of areas of reduced risk in the Gulf of Finland, theBaltic Sea. Proc Estonian Acad Sci 59:156–165
Soomere T, Andrejev O, Sokolov A, Myrberg K (2011a) The use ofLagrangian trajectories for identification the environmentally safefairway. Mar Pollut Bull 62:1410–1420
Soomere T, Andrejev O, Sokolov A, Quak E (2011b) Management ofcoastal pollution by means of smart placement of human activi-ties. J Coast Res Special Issue 64:951–955
Soomere T, Berezovski M, Quak E, Viikmäe B (2011c) Modellingenvironmentally friendly fairways using Lagrangian trajectories: acase study for the Gulf of Finland, the Baltic Sea. Ocean Dyn61:1669–1680
Soomere T, Delpeche N, Viikmäe B, Quak E, Meier HEM, Döös K(2011d) Patterns of current-induced transport in the surface layerof the Gulf of Finland. Boreal Environ Res 16(Suppl A):49–63
Stommel H (1949) Horizontal diffusion due to oceanic turbulence. JMar Res 8:199–255
Umlauf L, Burchard H, Hutter K (2003) Extending the k-ω turbulencemodel towards oceanic applications. Ocean Model 5:195–218
Vandenbulcke L, Beckers J-M, Lenartz F, Barth A, Poulain P-M,Aidonidis M, Meyrat J, Ardhuin F, Tonani M, Fratianni C,Torrisi L, Pallela D, Chiggiato J, Tudor M, Book JW, MartinP, Peggion G, Rixen M (2009) Super-ensemble techniques:application to surface drift prediction. Progr Oceanogr 82:149–167
Viikmäe B, Soomere T, Viidebaum M, Berezovski A (2010) Temporalscales for transport patterns in the Gulf of Finland. Estonian J Eng16:211–227
Ocean Dynamics (2012) 62:815–829 829