Embed Size (px)
Citation preview

IDENTIFYING ASIAN LDCS’ HIGH POTENTIAL EXPORT SECTORS
STUDY FOR THE PROJECT “ENHANCING EXPORT CAPACITIES OF ASIAN LDCS”

IDENTIFYING ASIAN LDCS’ HIGH POTENTIAL EXPORT SECTORS
ii
The designations employed and the presentation of material in this document do not imply the expression of any opinion whatsoever on the part of the International Trade Centre concerning the legal status of any country, territory, city or area or of its authorities, or concerning the delimitation of its frontiers or boundaries.
This document has not formally been edited by the International Trade Centre.

IDENTIFYING ASIAN LDCS’ HIGH POTENTIAL EXPORT SECTORS
iii
Contents
1. Background ........................................................................................................................................... 1
2. Trade context ........................................................................................................................................ 1
2.1. Asian LDCs’ current export pattern ............................................................................................. 1
2.2. Trade policy framework ............................................................................................................... 4
3. Identification of high potential export sectors in Asian LDCs ................................................................ 6
3.1. Methodology ................................................................................................................................ 6
3.2. Results ........................................................................................................................................ 7
3.2.1. Sector and product selection ......................................................................................... 7
3.2.2. Future development prospects .................................................................................... 15
4. Discussion ........................................................................................................................................... 17
Annexes
I. Country groups and additional descriptive statistics 18
II. Additional EPI results 23
Tables and figures
Table 1: Overview of Asian LDCs’ trade relations to China 1 Table 2: Product selection for exports to developing Asia 8 Table 3: Product selection for exports to China 9 Table 4: Trade and tariffs for the selected textile products for exports to China 12 Table 5: Trade and tariffs for the selected fruits, vegetable, and nuts products for exports to China 14 Table 6: Summary of product selection 17
Figure 1: Share of Asian markets in Asian LDCs’ total exports 2 Figure 2: Asian LDCs’ exports by sector and market 3 Figure 3: Trade Agreements in Asia-Pacific 5 Figure 4: Degree of sophistication of the selected products 16

IDENTIFYING ASIAN LDCS’ HIGH POTENTIAL EXPORT SECTORS
1
1. Background
Expanding exports by targeting dynamic markets is critical for future development and poverty alleviation in many developing countries. Yet, Asian Least Developed Countries (LDCs) like many other LDCs remain marginal players in the global economy and need technical assistance to fully grasp the benefits from international trade. Governments seek to complement general (“horizontal”) policies that improve the overall business environment by more targeted, sector-specific policies. Identifying sectors on which to put priority is necessary for a sound allocation of limited public resources. Governments, donors and other stakeholders want to make an informed decision on which priority sectors to select, and thus need to assess the export potential of individual sectors. As important as knowing what to export is the question where to export. Given the stagnating demand in many developed economies, emerging regional markets, first and foremost China, may offer export opportunities to Asian LDCs that are yet to be explored.
This report aims at identifying at least two sectors that show a high potential for exports in several Asian LDCs
1 vis-à-vis China and vis-à-vis developing countries in Asia in general. After revising the countries’
existing export patterns, we employ a modified version of the International Trade Centre’s (ITC) Export Potential Assessment (EPA) methodology that combines information on export performance, import demand and market access conditions to identify promising sectors and products.
2. Trade context
2.1. Asian LDCs’ current export pattern
Table 1 gives an overview of the seven Asian LDCs’ trade relations to China. Even though Bangladesh is by far the biggest exporter of the seven LDCs, its trade relations with China are still at the outset. Out of all seven Asian LDCs, Myanmar exports with US$ 1.3 billion the highest value to China. Due to its closed borders to The Tibet Autonomous Region (TAR), Bhutan’s exports to China are with a value of US$ 13 thousand still negligible and have not increased over the time frame 2001-2012. All other LDCs exported in 2012 significantly more to China than they did in 2001. Since imports from China have increased as well, the trade balance is still highly negative.
Table 1: Overview of Asian LDCs’ trade relations to China
Country Export value in 2012 (in mio.
US$)
Annual export growth 2001-
2012 (%)
Import value in 2012 (in mio.
US$)
Annual import growth 2001-
2012 (%)
Trade balance in 2012 (in mio.
US$)
Afghanistan 5.11 37 464.46 35 -459.34
Bangladesh 479.13 36 7,952.15 21 -7,473.02
Bhutan 0.01 -1 15.60 23 -15.59
Cambodia 215.42 18 2,704.36 26 -2,488.94
Laos 790.89 53 931.79 29 -140.90
Myanmar 1,299.60 23 5,666.68 25 -4,367.08
Nepal 29.51 18 1,965.55 26 -1,936.04
Source: ITC calculations. Data from ITC Trade Map.
China’s importance as a market for Asian LDCs’ exports has grown overall as well (see Figure 1). Especially for Lao People’s Democratic Republic’s and Myanmar’s exports, the Chinese market is becoming increasingly relevant. It is Myanmar’s top import market, and ranks 2
nd for Lao’s People
Democratic Republic after Thailand.
Beyond China, all developing Asia is a big and growing market for most Asian LDCs. Five LDCs – Bhutan, Lao People’s Democratic Republic, Myanmar, Afghanistan and Nepal – sell more than half of their total
1 Afghanistan, Bangladesh, Bhutan, Cambodia, Lao People’s Democratic Republic, Myanmar and Nepal.
IDENTIFYING ASIAN LDCS’ HIGH POTENTIAL EXPORT SECTORS
2
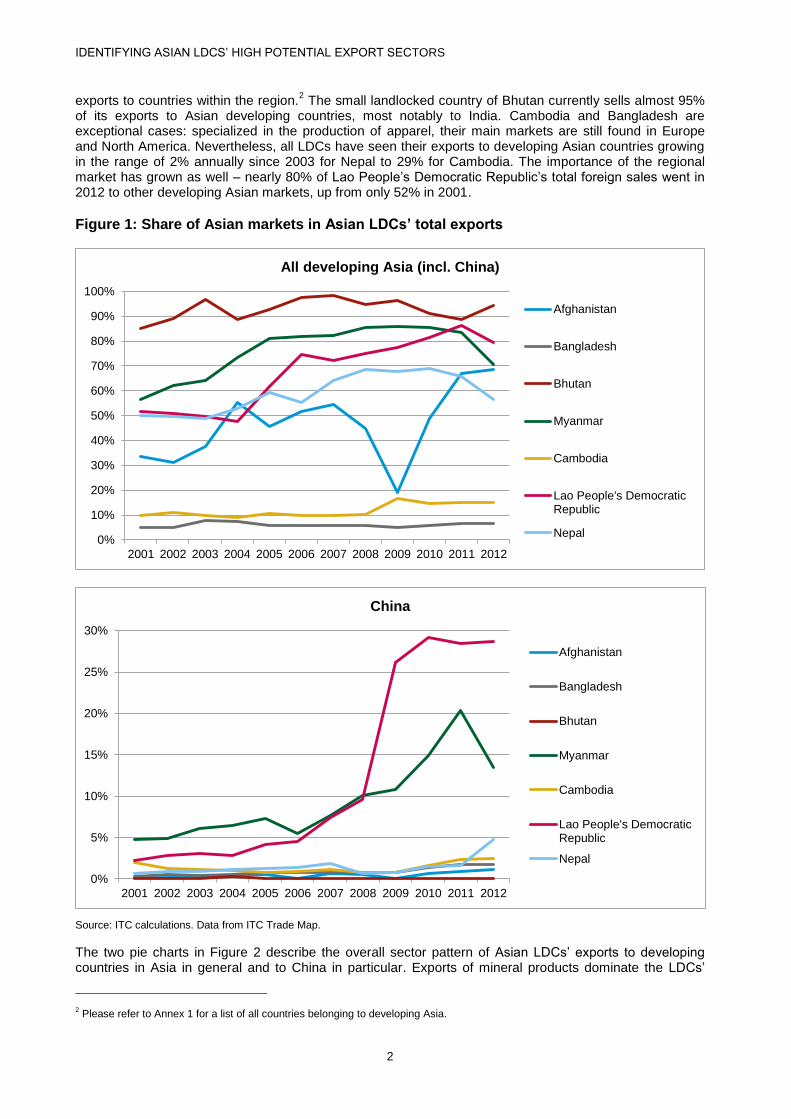
exports to countries within the region.2 The small landlocked country of Bhutan currently sells almost 95%
of its exports to Asian developing countries, most notably to India. Cambodia and Bangladesh are exceptional cases: specialized in the production of apparel, their main markets are still found in Europe and North America. Nevertheless, all LDCs have seen their exports to developing Asian countries growing in the range of 2% annually since 2003 for Nepal to 29% for Cambodia. The importance of the regional market has grown as well – nearly 80% of Lao People’s Democratic Republic’s total foreign sales went in 2012 to other developing Asian markets, up from only 52% in 2001.
Figure 1: Share of Asian markets in Asian LDCs’ total exports
Source: ITC calculations. Data from ITC Trade Map.
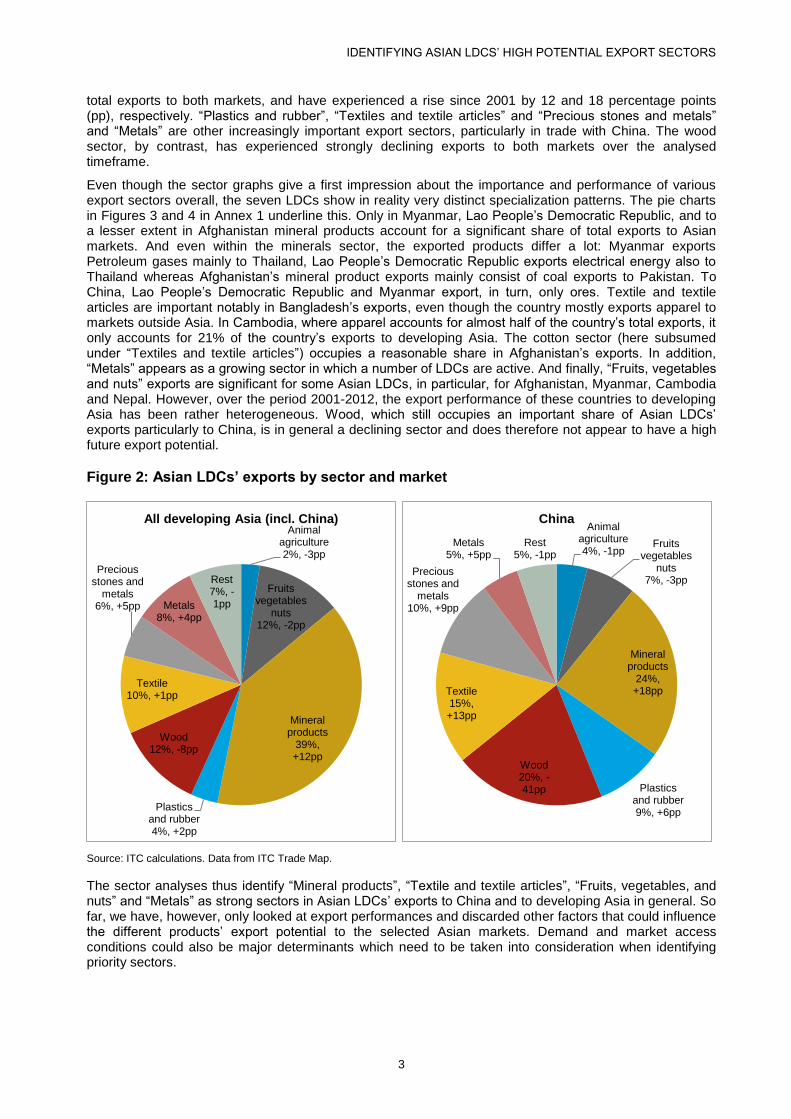
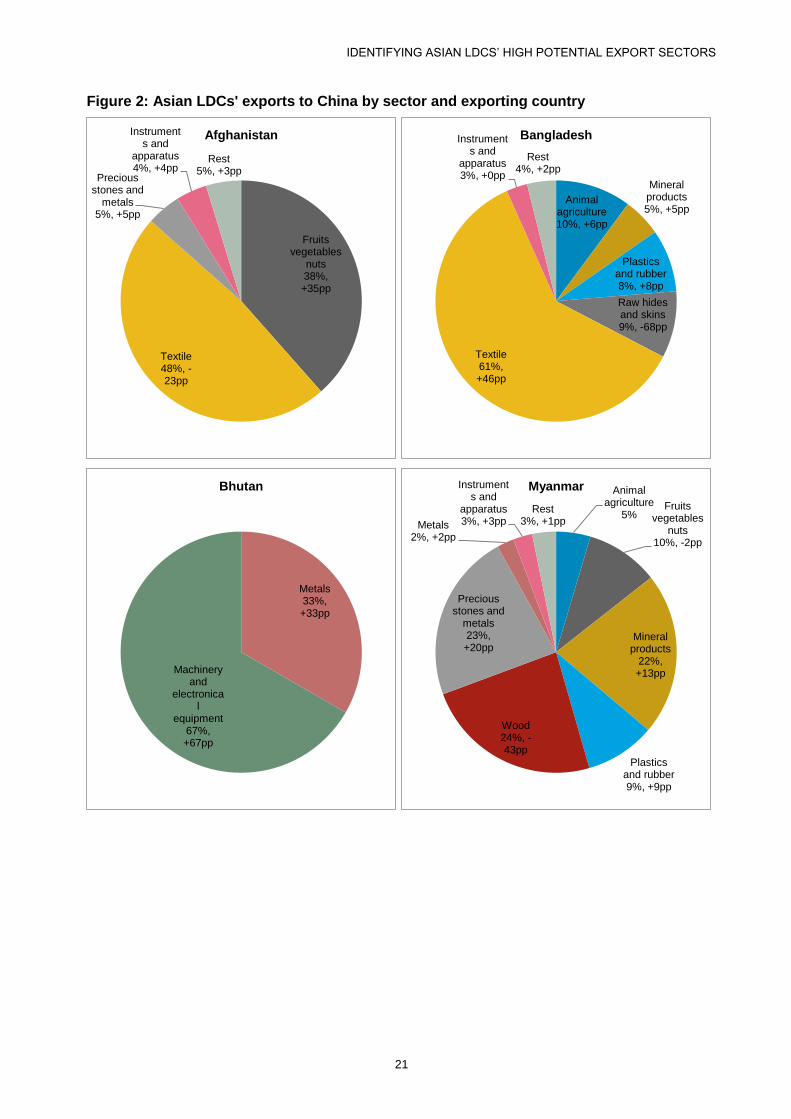
The two pie charts in Figure 2 describe the overall sector pattern of Asian LDCs’ exports to developing countries in Asia in general and to China in particular. Exports of mineral products dominate the LDCs’
2 Please refer to Annex 1 for a list of all countries belonging to developing Asia.
0%
10%
20%
30%
40%
50%
60%
70%
80%
90%
100%
2001 2002 2003 2004 2005 2006 2007 2008 2009 2010 2011 2012
All developing Asia (incl. China)
Afghanistan
Bangladesh
Bhutan
Myanmar
Cambodia
Lao People's DemocraticRepublic
Nepal
0%
5%
10%
15%
20%
25%
30%
2001 2002 2003 2004 2005 2006 2007 2008 2009 2010 2011 2012
China
Afghanistan
Bangladesh
Bhutan
Myanmar
Cambodia
Lao People's DemocraticRepublic
Nepal
IDENTIFYING ASIAN LDCS’ HIGH POTENTIAL EXPORT SECTORS
3
total exports to both markets, and have experienced a rise since 2001 by 12 and 18 percentage points (pp), respectively. “Plastics and rubber”, “Textiles and textile articles” and “Precious stones and metals” and “Metals” are other increasingly important export sectors, particularly in trade with China. The wood sector, by contrast, has experienced strongly declining exports to both markets over the analysed timeframe.
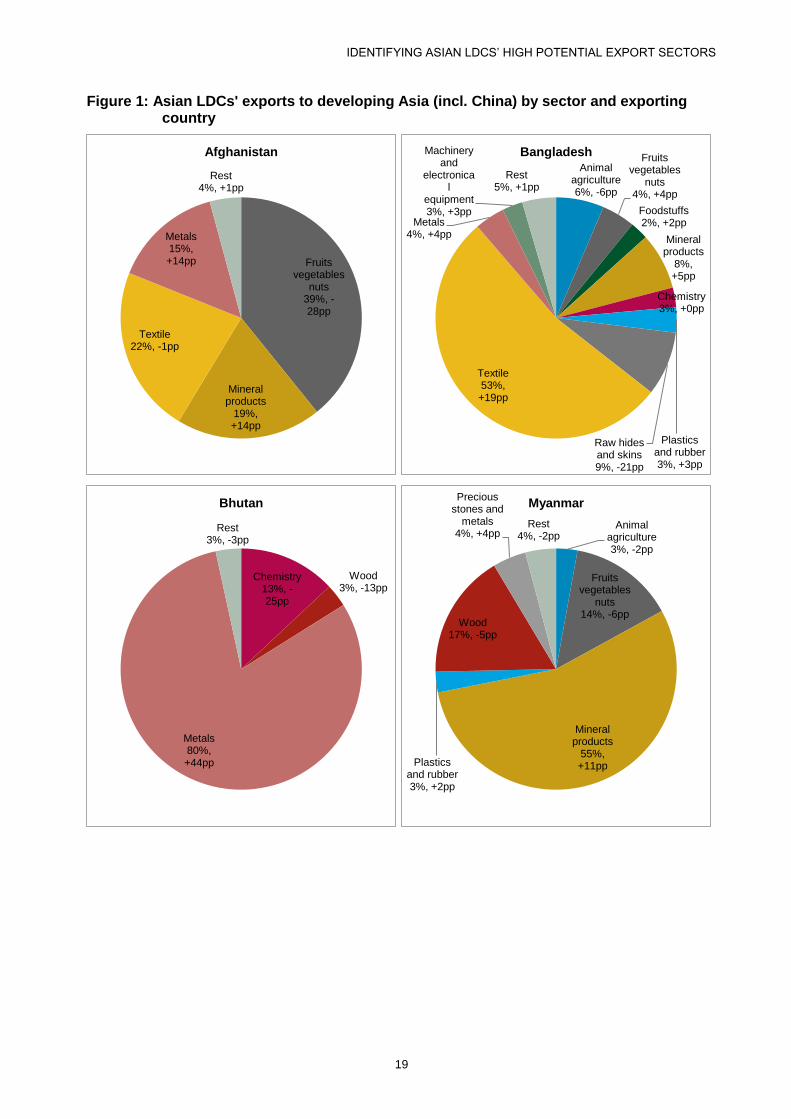
Even though the sector graphs give a first impression about the importance and performance of various export sectors overall, the seven LDCs show in reality very distinct specialization patterns. The pie charts in Figures 3 and 4 in Annex 1 underline this. Only in Myanmar, Lao People’s Democratic Republic, and to a lesser extent in Afghanistan mineral products account for a significant share of total exports to Asian markets. And even within the minerals sector, the exported products differ a lot: Myanmar exports Petroleum gases mainly to Thailand, Lao People’s Democratic Republic exports electrical energy also to Thailand whereas Afghanistan’s mineral product exports mainly consist of coal exports to Pakistan. To China, Lao People’s Democratic Republic and Myanmar export, in turn, only ores. Textile and textile articles are important notably in Bangladesh’s exports, even though the country mostly exports apparel to markets outside Asia. In Cambodia, where apparel accounts for almost half of the country’s total exports, it only accounts for 21% of the country’s exports to developing Asia. The cotton sector (here subsumed under “Textiles and textile articles”) occupies a reasonable share in Afghanistan’s exports. In addition, “Metals” appears as a growing sector in which a number of LDCs are active. And finally, “Fruits, vegetables and nuts” exports are significant for some Asian LDCs, in particular, for Afghanistan, Myanmar, Cambodia and Nepal. However, over the period 2001-2012, the export performance of these countries to developing Asia has been rather heterogeneous. Wood, which still occupies an important share of Asian LDCs’ exports particularly to China, is in general a declining sector and does therefore not appear to have a high future export potential.
Figure 2: Asian LDCs’ exports by sector and market
Source: ITC calculations. Data from ITC Trade Map.
The sector analyses thus identify “Mineral products”, “Textile and textile articles”, “Fruits, vegetables, and nuts” and “Metals” as strong sectors in Asian LDCs’ exports to China and to developing Asia in general. So far, we have, however, only looked at export performances and discarded other factors that could influence the different products’ export potential to the selected Asian markets. Demand and market access conditions could also be major determinants which need to be taken into consideration when identifying priority sectors.
Animal agriculture 2%, -3pp
Fruits vegetables
nuts 12%, -2pp
Mineral products
39%, +12pp
Plastics and rubber 4%, +2pp
Wood 12%, -8pp
Textile 10%, +1pp
Precious stones and
metals 6%, +5pp Metals
8%, +4pp
Rest 7%, -1pp
All developing Asia (incl. China) Animal
agriculture 4%, -1pp
Fruits vegetables
nuts 7%, -3pp
Mineral products
24%, +18pp
Plastics and rubber 9%, +6pp
Wood 20%, -41pp
Textile 15%, +13pp
Precious stones and
metals 10%, +9pp
Metals 5%, +5pp
Rest 5%, -1pp
China
IDENTIFYING ASIAN LDCS’ HIGH POTENTIAL EXPORT SECTORS
4
2.2. Trade policy framework
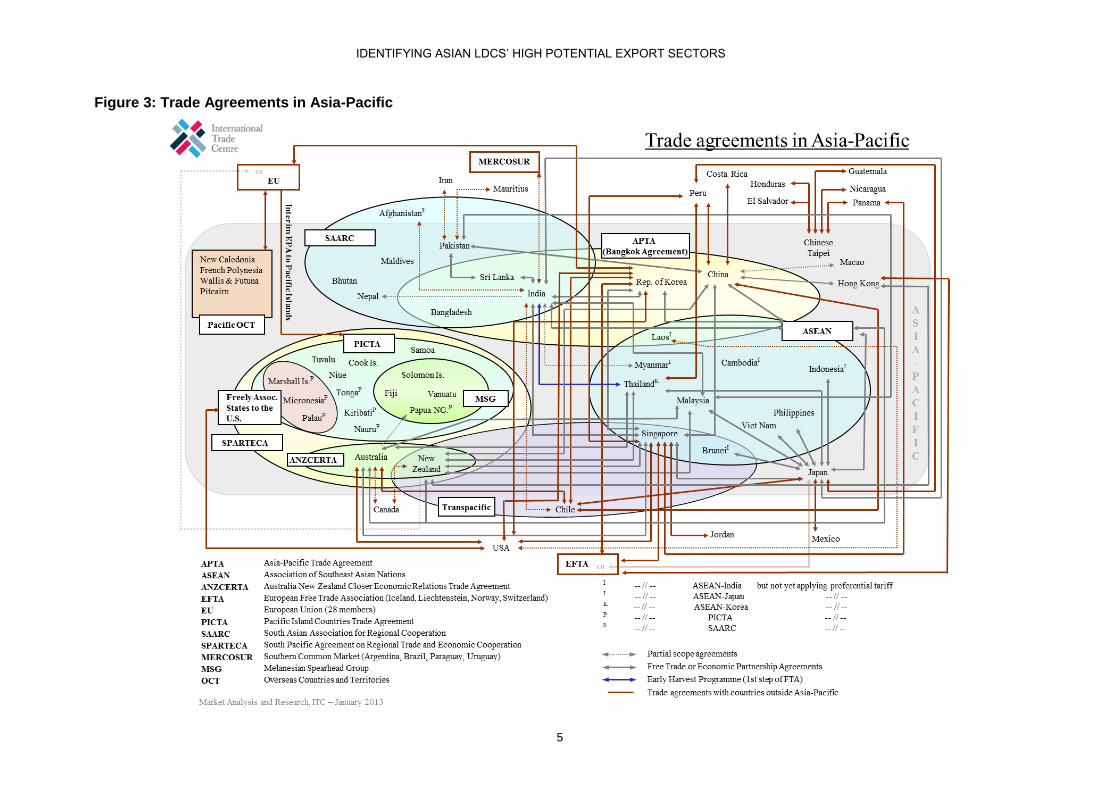
Several regional trade agreements coexist in Asia and partially overlap each other (see Figure 3 for an overview). Myanmar, Cambodia, and Lao People’s Democratic Republic are members of the Association of South East Asian Nations (ASEAN). Afghanistan, Bangladesh, Bhutan and Nepal benefit from preferences granted under the South Asian Free Trade Area (SAFTA) agreement and the three latter countries obtain preferential access also under the Bay of Bengal Initiative for Multi-Sectoral Technical and Economic Cooperation (BIMSTEC) agreement. Lao People’s Democratic Republic and Bangladesh are furthermore members to the Asia-Pacific Trade Agreement (APTA).
3
These agreements sometimes entail preferential treatment also on the Chinese market. As ASEAN members, Myanmar, Cambodia and Lao People’s Democratic Republic benefit from substantial tariff reductions negotiated under the China-ASEAN agreement. Even though the newer ASEAN members followed a slower tariff reduction schedule than the founding members, China eliminated tariffs on 7,881 product categories (90% of all tariff lines) to the three LDCs on 1
st January 2010. Tariffs on sensitive
products will be reduced by 2015.
Bangladesh and Lao People’s Democratic Republic also benefit from tariff preferences granted in the context of APTA. China offers preferential margins on 1,697 tariff lines of up to 100%. In 2011, 9.6% of all tariff lines were duty-free and China’s average applied tariff to other members of the agreement amounted to 8.9%. Under both agreements, average applied tariffs to agricultural products are slightly above tariffs applied to manufacturing products.
Finally, since July 2010, China grants unilateral preferences to 40 LDCs, amongst which Afghanistan and Nepal as well as the other Asian LDCs with the exception of Bhutan. 4,788 and thus 60% of all tariff lines enter the Chinese market currently free of duty. In the context of the Hong Kong Ministerial Declaration, China promised, however, to increase the coverage of products eligible for zero tariffs to 97% of tariff lines.
4
Bhutan is therefore the only of the seven Asian LDCs whose exports to China are subject to non-preferential general tariff rates.
5 China applies a general tariff rate that is significantly above the most
favoured nation tariff scheme applied to WTO members: for agricultural and non-agricultural products, the simple average of the general rates amounted in 2011 to 68% and 55%, respectively.
6
3 www.bilaterals.org. Other bilateral agreements between some of the seven LDCs and individual Asian developing countries exist as
well. Their analysis goes, however, beyond the scope of this study. 4 United Nations Support Measures Portal for LDCs, http://esango.un.org/ldcportal/web/guest.
5 Preferential tariffs are granted only to LDCs engaged in diplomatic relations with the People’s Republic of China.
6 WTO (2012): Trade Policy Review China.
IDENTIFYING ASIAN LDCS’ HIGH POTENTIAL EXPORT SECTORS
5
Figure 3: Trade Agreements in Asia-Pacific

IDENTIFYING ASIAN LDCS’ HIGH POTENTIAL EXPORT SECTORS
6
3. Identification of high potential export sectors in Asian LDCs
3.1. Methodology
The identification of priority sectors and products of Asian LDCs’ exports to China and to developing Asia in general is based upon the ITC EPA methodology. Normally, EPAs are two-step analyses of the identification of high potential export products in a first step and then, for each high performing export product, the identification of attractive markets in a second step. For this project, we deviate from the standard approach since the aim is to simultaneously identify sectors and LDCs that have the capacities to develop exports in these sectors. The related questions are thus:
Which are the high potential sectors in Asian LDCs’ exports to China and to other Asian markets?
Which of the seven LDCs show good prospects to develop exports in these sectors?
We have adapted the standard methodology in various ways. In particular, we combine information on export performance, market demand and market access conditions to calculate a single index that helps selecting priority sectors that “work” for at least some of the seven Asian LDCs.
Export performance is thereby measured by three sub-indicators:
Comparative advantage: calculated as the share of the product in total national exports as compared to the share of this product in world exports, the indicator shows in which products the country is competitive compared with other countries in the world.
Growth of comparative advantage: calculated as the annual growth of comparative advantage over the last five years, the indicator shows in which products the country has recently become competitive.
Trade balance: calculated as the share of the trade balance for each product in the country’s total trade, the indicator controls for re-exports and thus focuses on products that are produced in the country.
Market demand is also measured by three sub-indicators:
Size (in value terms) of the market for each product
Growth of market demand for each product: calculated as the annual growth of the market’s imports over the last five years, the indicator shows which products have recently experienced an increase in demand.
Tariff preferences: the tariff preference granted to each LDC by the market (as compared to other suppliers) is compared to the average tariff preference that this LDC enjoys when it exports to the world (as compared to other suppliers). This indicates if a market is particularly more attractive than others due to specific tariff preferences for a given product. Tariff preferences are computed at the HS 6-digit level and then aggregated to the HS 4-digit level.
Calculations of the export potential rankings are made at the 4-digit level of the Harmonized System (HS) classification. This level of detail seems fine enough to account for differences in applied tariffs that may prevail within a sector and aggregated enough to overcome statistical issues related to changing product codes across different HS revisions.
To better reflect potential supply constraints in Asian LDCs, we give double weight to the export performance index when combining it with the market demand index. As a result, we obtain seven augmented Export Potential Indices (EPIs) that allow us to identify the most promising products for each country. Since the objective is, however, to identify sectors and products that are eligible for a number of Asian LDCs, we combine the seven country rankings into a single ranking using a simple average of inverse percentiles. Using percentiles instead of actual ranks allows controlling for the fact that the number of exported products may differ across countries (e.g. between Bangladesh and Bhutan). To give an example, for a country with 100 ranked products the 5
th product will be in the 5
th percentile. In a country
with 400 products however, the 20th product would also be in the 5
th percentile, thus products at different
ranks in the individual rankings may be given the same importance in the composite ranking to account for the fact that the number of exported products differs by country.
IDENTIFYING ASIAN LDCS’ HIGH POTENTIAL EXPORT SECTORS
7
As the aim is to identify broad sectors, we will further aggregate the composite HS 4-level product ranking to 21 broader sections. The determination of the final groups will be based on a filling algorithm which will allow us to select simultaneously the best broad product groups and the best individual products inside each product group.
3.2. Results
3.2.1. Sector and product selection
The composite cross-country EPI indicates that products falling into the sectors of “Textile and textile articles” and “Fruits, vegetables, and nuts” have overall the highest potential for Asian LDCs’ export development to developing Asia and to China.
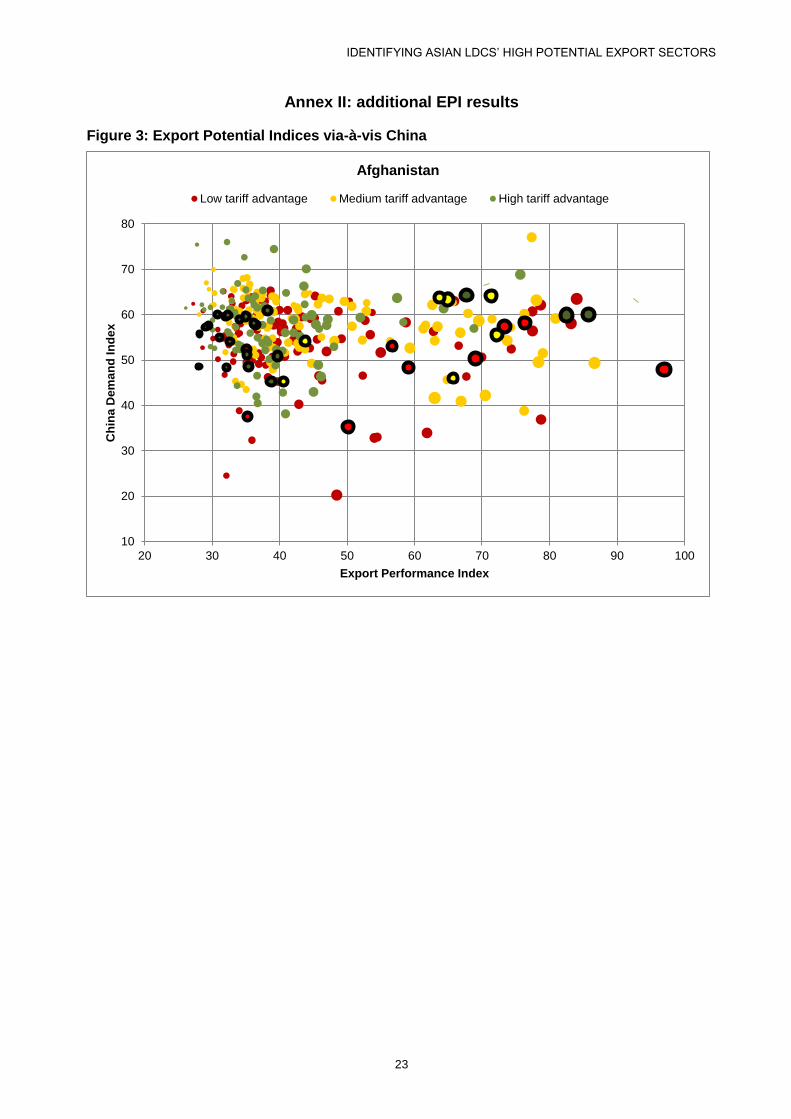
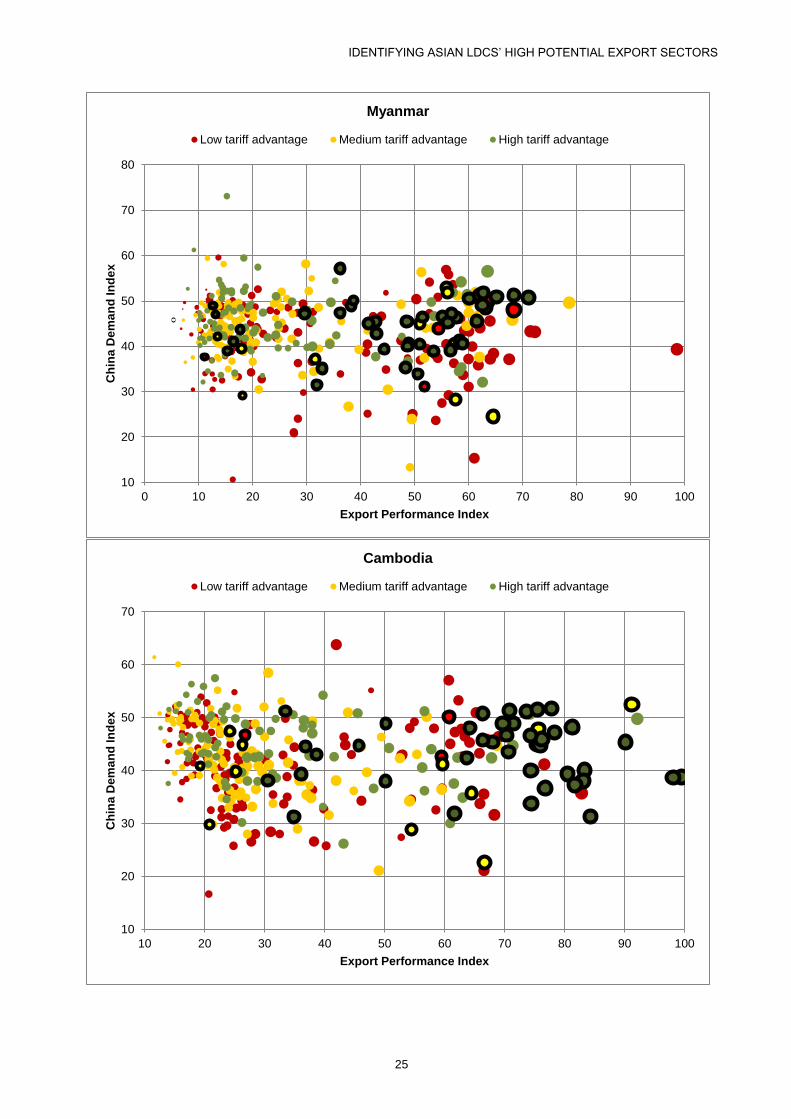
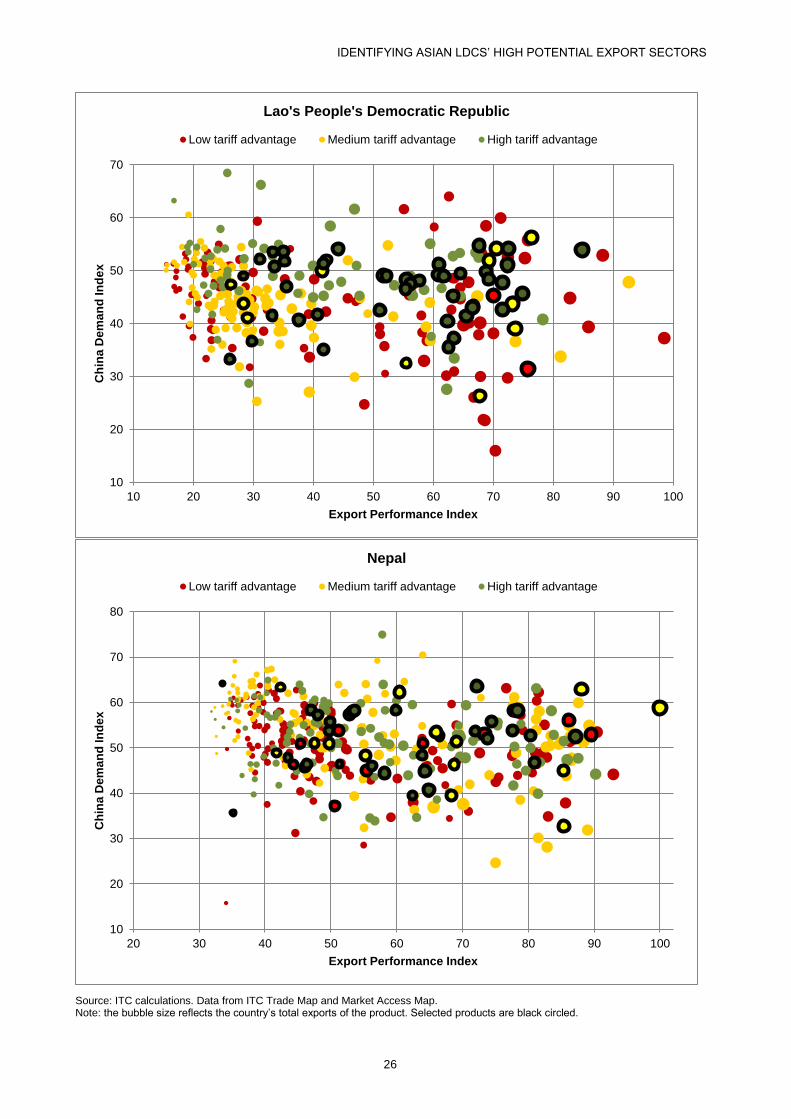
The bubble graphs in Annex 2 show for each LDC and each market individually the export performance and import demand along with the tariff advantages for all products. Black circled products have been selected based on the composite cross-country EPI that combines indicators from both dimensions and from all seven LDCs. The higher the product’s score in terms of export performance and market demand, the more likely it will also rank high in terms of the EPI, and the more likely it becomes one of the selected products. The graphs show that the selection reflects well Bangladesh’s good performance in textile exports, but it reflects less well Bhutan’s high potential products. Note that it is not the size of the country that drives this result, but the simple fact that Bangladesh’s specialization pattern is better aligned with those of other LDCs. Hence, promising products for Bangladesh are also promising products for other LDCs.
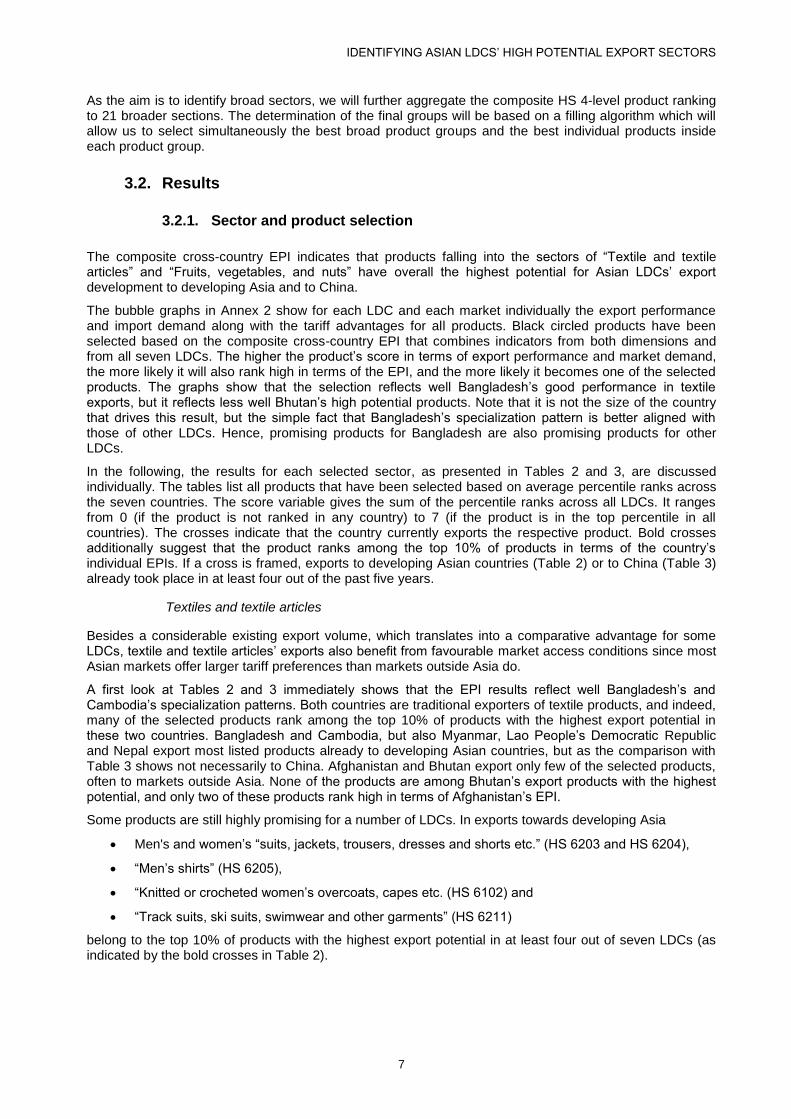
In the following, the results for each selected sector, as presented in Tables 2 and 3, are discussed individually. The tables list all products that have been selected based on average percentile ranks across the seven countries. The score variable gives the sum of the percentile ranks across all LDCs. It ranges from 0 (if the product is not ranked in any country) to 7 (if the product is in the top percentile in all countries). The crosses indicate that the country currently exports the respective product. Bold crosses additionally suggest that the product ranks among the top 10% of products in terms of the country’s individual EPIs. If a cross is framed, exports to developing Asian countries (Table 2) or to China (Table 3) already took place in at least four out of the past five years.
Textiles and textile articles
Besides a considerable existing export volume, which translates into a comparative advantage for some LDCs, textile and textile articles’ exports also benefit from favourable market access conditions since most Asian markets offer larger tariff preferences than markets outside Asia do.
A first look at Tables 2 and 3 immediately shows that the EPI results reflect well Bangladesh’s and Cambodia’s specialization patterns. Both countries are traditional exporters of textile products, and indeed, many of the selected products rank among the top 10% of products with the highest export potential in these two countries. Bangladesh and Cambodia, but also Myanmar, Lao People’s Democratic Republic and Nepal export most listed products already to developing Asian countries, but as the comparison with Table 3 shows not necessarily to China. Afghanistan and Bhutan export only few of the selected products, often to markets outside Asia. None of the products are among Bhutan’s export products with the highest potential, and only two of these products rank high in terms of Afghanistan’s EPI.
Some products are still highly promising for a number of LDCs. In exports towards developing Asia
Men's and women’s “suits, jackets, trousers, dresses and shorts etc.” (HS 6203 and HS 6204),
“Men’s shirts” (HS 6205),
“Knitted or crocheted women’s overcoats, capes etc. (HS 6102) and
“Track suits, ski suits, swimwear and other garments” (HS 6211)
belong to the top 10% of products with the highest export potential in at least four out of seven LDCs (as indicated by the bold crosses in Table 2).

IDENTIFYING ASIAN LDCS’ HIGH POTENTIAL EXPORT SECTORS
8
Table 2: Product selection for exports to developing Asia
sector code Description Afghani-
stan Bangla-
desh Bhutan Myanmar Cambo-
dia Laos Nepal score
Te
xti
les
an
d t
ex
tile
arti
cle
s
6214 Shawls, scarves, mufflers, mantillas, etc X X X X X X X 5.0
6205 Men's shirts X X X X X X 4.7
6210 Garment made up of fabric of heading no 56.02,56.03,59.03,59.06/59.07 X X X X X X 4.6
6104 Women's suits,dresses,skirt etc&short, knit/croch X X X X X X 4.6
6204 Women's suits, jackets,dresses skirts etc&shorts X X X X X X 4.6
6101 Men's overcoats,capes,etc, knitted/crochetd,o/t of hd 61.03 X X X X X 4.6
6102 Women's overcoat,cape, etc,knitted/crochetd,o/t of hd 61.04 X X X X X 4.5
6203 Men's suits, jackets, trousers etc & shorts X X X X X X 4.5
6211 Track suits, ski suits and swimwear; other garments X X X X X X 4.5
6206 Women's blouses & shirts X X X X X X 4.4
6110 Jerseys, pullovers, cardigans, etc, knitted or crocheted X X X X X X 4.3
6114 Garments, knitted or crocheted, nes X X X X X X 4.3
6201 Men's overcoats, capes, windjackets etc o/t those of hd 62.03 X X X X X X 4.3
6109 T-shirts, singlets and other vests, knitted or crocheted X X X X X X X 4.3
6202 Women's overcoats,capes,wind-jackets etc o/t those of hd 62.04 X X X X X X 4.1
6112 Track suits, ski suits and swimwear, knitted or crocheted X X X X X 4.1
6103 Men's suits,jackets,trousers etc&shorts, knit/croch X X X X X 4.1
6209 Babies' garments and clothing accessories X X X X X 4.1
6106 Women's blouses & shirts, knitted or crocheted X X X X X 4.1
6111 Babies' garments, knitted or crocheted X X X X X 4.0
6307 Made up articles nes, including dress patterns X X X X X X X 4.0
6105 Men's shirts, knitted or crocheted X X X X X 4.0
6305 Sacks and bags of a kind used for the packing of goods X X X X X 4.0
6310 Rags,scrap twine,crodage,rope X X X X X 4.0
6108 Women's slips,panties,pyjamas, bathrobes etc, knitted/crocheted X X X X X 4.0
6107 Men's underpants,pyjamas,bathrobes etc,knit/croch X X X X X 4.0
6208 Women's singlets, slips, briefs, pyjamas, bathrobes etc X X X X X 3.7
6302 Bed, table, toilet and kitchen linens X X X X X X 3.7
6207 Men's singlets, briefs, pyjamas, bathrobes etc X X X X X 3.6
6212 Brassieres,girdles,corsets,braces,suspenders etc&parts X X X X X 3.6
6113 Garment,made up of knitted/crochetd fabric of hd no 59.03,06,07 X X X X 3.5
6301 Blankets and travelling rugs X X X X X X 3.5
5701 Carpets and other textile floor covering knotted X X X X X 3.4
6309 Worn clothing and articles X X X X X X 3.4
6117 Clothing access nes,knitted/croch X X X X X X 3.3
6116 Gloves, mittens and mitts, knitted or crocheted X X X X X 3.2
6115 Panty hose, tights, stockings & other hosiery, knitted or crocheted X X X X X 3.2
5806 Nar woven fabrics,o/t those of hd 5807 X X X X X X 3.1
6217 Clothing accessories nes; o/t of hd 62.12 X X X X X X 3.0
Fru
its
,
ve
ge
tab
les
,
and n
uts
1211 Medicinal plants X X X X X X X 6.2
1207 Oil seeds X X X X X X 4.8
0910 Ginger,saffron,turmeric, thyme, bay leaves & curry X X X X X X 4.6
0713 Dried vegetables, shelled X X X X X X 4.5
1401 Vegetable material for plaiting X X X X X X 4.4
IDENTIFYING ASIAN LDCS’ HIGH POTENTIAL EXPORT SECTORS
9
1404 Vegetable products, nes X X X X X 4.4
1202 Ground-nuts, not roasted X X X X X 4.3
1212 Locust beans X X X X X 4.2
0714 Manioc, arrowroot salem (yams) etc X X X X 3.7
0709 Vegetables nes, fresh or chilled X X X X X X X 3.7
0810 Fruits nes, fresh X X X X X X 3.6
1301 Lac; natural gums, resins, gum-resins & balsams X X X X X 3.6
1006 Rice X X X X X X 3.3
0712 Dried vegetables X X X X X X 3.3
0802 Nuts nes X X X X 3.2
0804 Dates, figs,pineapples, mangoes, avocadoes, guavas X X X X X 3.2
0901 Coffee X X X X X X 3.2
1008 Buckwheat, millet and canary seed X X X X 3.1
0813 Dried fruit X X X X 3.1
0902 Tea X X X X 3.0
0801 Brazil nuts, cashew nuts & coconuts X X X X 3.0
1108 Starches; inulin X X X X 2.9
0807 Melons (including watermelons) & papayas, fresh X X X X 2.9
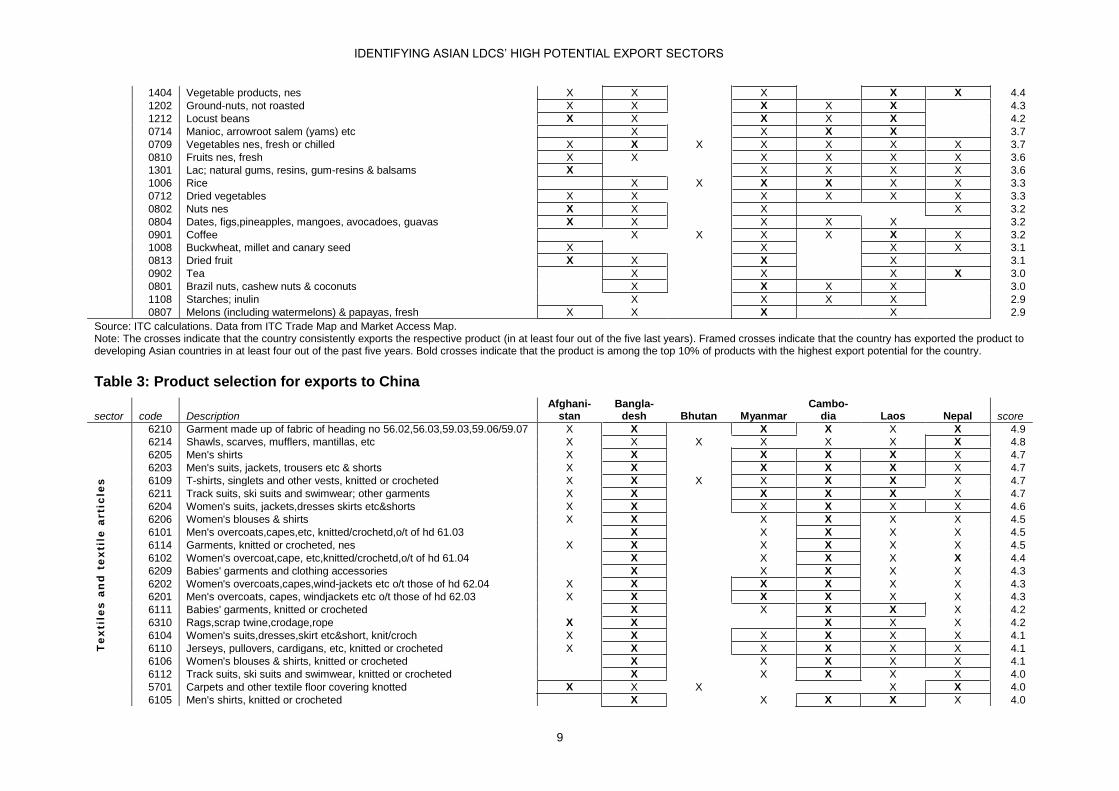
Source: ITC calculations. Data from ITC Trade Map and Market Access Map. Note: The crosses indicate that the country consistently exports the respective product (in at least four out of the five last years). Framed crosses indicate that the country has exported the product to developing Asian countries in at least four out of the past five years. Bold crosses indicate that the product is among the top 10% of products with the highest export potential for the country.
Table 3: Product selection for exports to China
sector code Description Afghani-
stan Bangla-
desh Bhutan Myanmar Cambo-
dia Laos Nepal score
Te
xti
les
an
d t
ex
tile
arti
cle
s
6210 Garment made up of fabric of heading no 56.02,56.03,59.03,59.06/59.07 X X X X X X 4.9
6214 Shawls, scarves, mufflers, mantillas, etc X X X X X X X 4.8
6205 Men's shirts X X X X X X 4.7
6203 Men's suits, jackets, trousers etc & shorts X X X X X X 4.7
6109 T-shirts, singlets and other vests, knitted or crocheted X X X X X X X 4.7
6211 Track suits, ski suits and swimwear; other garments X X X X X X 4.7
6204 Women's suits, jackets,dresses skirts etc&shorts X X X X X X 4.6
6206 Women's blouses & shirts X X X X X X 4.5
6101 Men's overcoats,capes,etc, knitted/crochetd,o/t of hd 61.03 X X X X X 4.5
6114 Garments, knitted or crocheted, nes X X X X X X 4.5
6102 Women's overcoat,cape, etc,knitted/crochetd,o/t of hd 61.04 X X X X X 4.4
6209 Babies' garments and clothing accessories X X X X X 4.3
6202 Women's overcoats,capes,wind-jackets etc o/t those of hd 62.04 X X X X X X 4.3
6201 Men's overcoats, capes, windjackets etc o/t those of hd 62.03 X X X X X X 4.3
6111 Babies' garments, knitted or crocheted X X X X X 4.2
6310 Rags,scrap twine,crodage,rope X X X X X 4.2
6104 Women's suits,dresses,skirt etc&short, knit/croch X X X X X X 4.1
6110 Jerseys, pullovers, cardigans, etc, knitted or crocheted X X X X X X 4.1
6106 Women's blouses & shirts, knitted or crocheted X X X X X 4.1
6112 Track suits, ski suits and swimwear, knitted or crocheted X X X X X 4.0
5701 Carpets and other textile floor covering knotted X X X X X 4.0
6105 Men's shirts, knitted or crocheted X X X X X 4.0
IDENTIFYING ASIAN LDCS’ HIGH POTENTIAL EXPORT SECTORS
10
6307 Made up articles nes, including dress patterns X X X X X X X 4.0
6305 Sacks and bags of a kind used for the packing of goods X X X X X 4.0
6108 Women's slips,panties,pyjamas, bathrobes etc, knitted/crocheted X X X X X 3.9
6103 Men's suits,jackets,trousers etc&shorts, knit/croch X X X X X 3.9
6207 Men's singlets, briefs, pyjamas, bathrobes etc X X X X X X 3.8
6107 Men's underpants,pyjamas,bathrobes etc,knit/croch X X X X X 3.8
6208 Women's singlets, slips, briefs, pyjamas, bathrobes etc X X X X X 3.8
6302 Bed, table, toilet and kitchen linens X X X X X X 3.5
6212 Brassieres,girdles,corsets,braces,suspenders etc&parts X X X X X 3.5
6113 Garment,made up of knitted/crochetd fabric of hd no 59.03,06,07 X X X X 3.4 6116 Gloves, mittens and mitts, knitted or crocheted X X X X X 3.2
Fru
its
, v
eg
eta
ble
s,
an
d
nu
ts
1211 Medicinal plants X X X X X X X 6.2
1207 Oil seeds X X X X X X 5.0
0910 Ginger,saffron,turmeric, thyme, bay leaves & curry X X X X X X 5.0
0713 Dried vegetables, shelled X X X X X X 4.6
1404 Vegetable products, nes X X X X X 4.5
1401 Vegetable material for plaiting X X X X X X 4.4
1212 Locust beans X X X X X 4.3
1202 Ground-nuts, not roasted X X X X X 4.0
1006 Rice X X X X X X 3.9
0714 Manioc, arrowroot salem (yams) etc X X X X 3.8
1301 Lac; natural gums, resins, gum-resins & balsams X X X X X 3.6
0810 Fruits nes, fresh X X X X X X 3.4
0802 Nuts nes X X X X 3.2
0902 Tea X X X X 3.2
1005 Maize (corn) X X X X 3.2
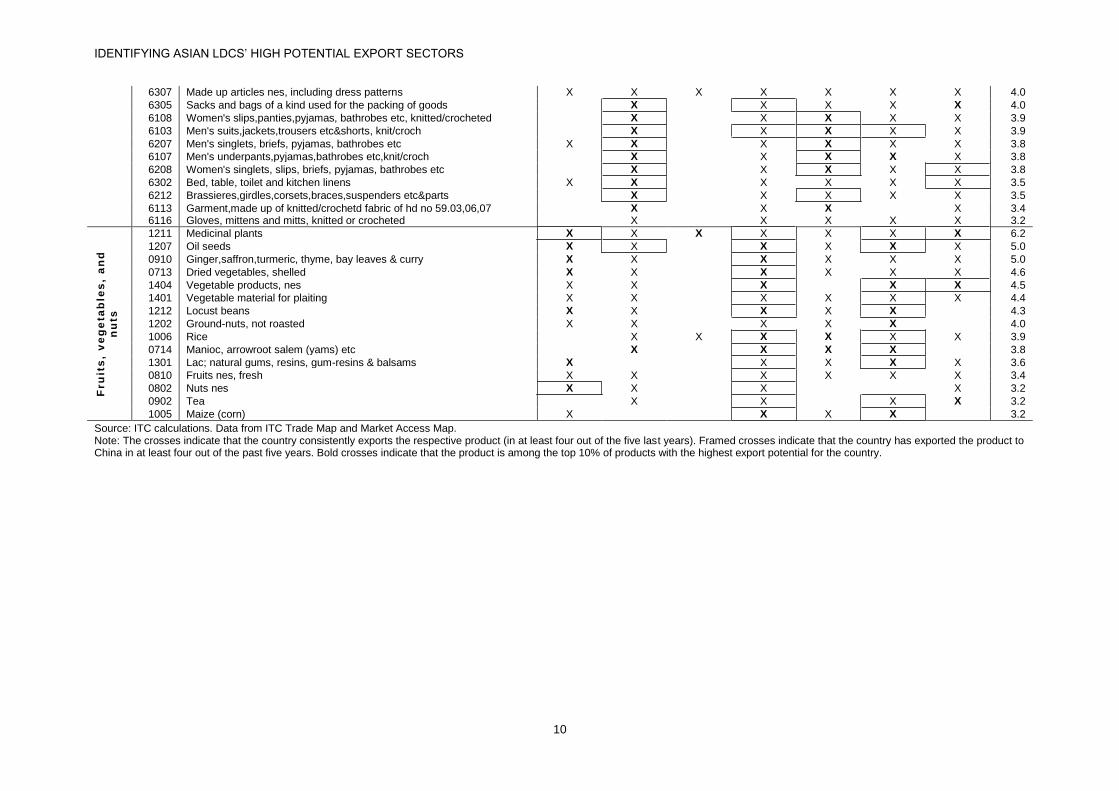
Source: ITC calculations. Data from ITC Trade Map and Market Access Map. Note: The crosses indicate that the country consistently exports the respective product (in at least four out of the five last years). Framed crosses indicate that the country has exported the product to China in at least four out of the past five years. Bold crosses indicate that the product is among the top 10% of products with the highest export potential for the country.
IDENTIFYING ASIAN LDCS’ HIGH POTENTIAL EXPORT SECTORS
11
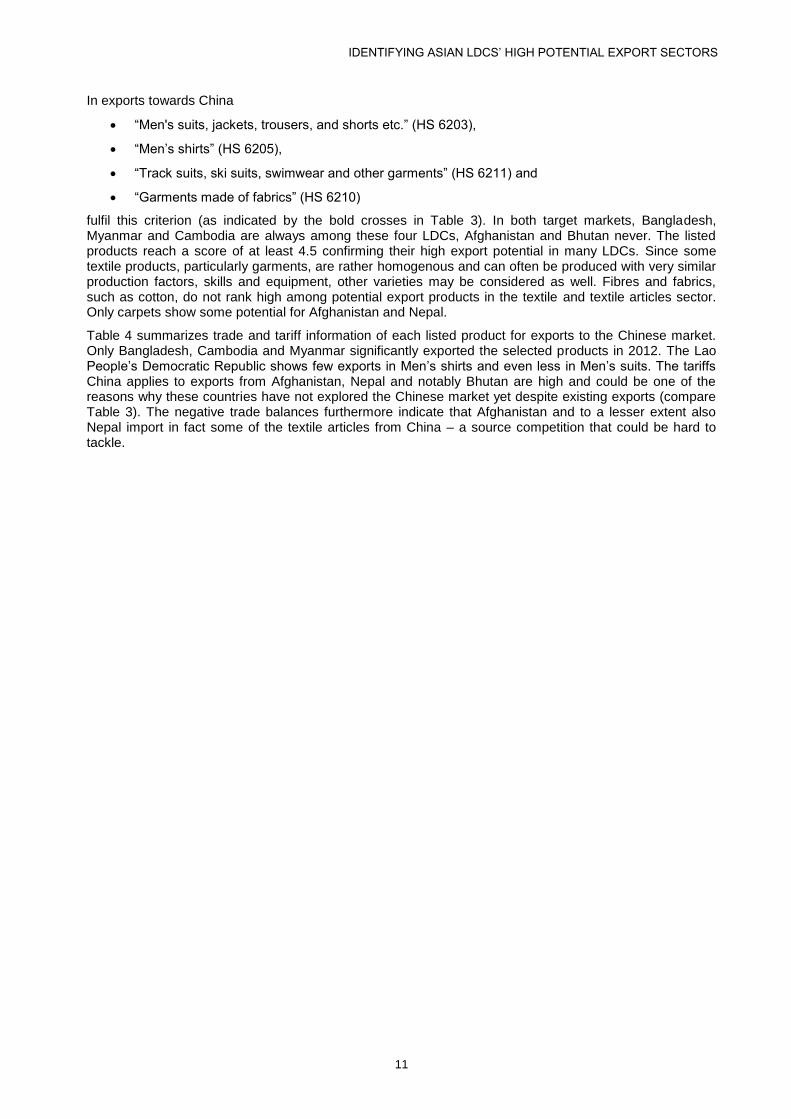
In exports towards China
“Men's suits, jackets, trousers, and shorts etc.” (HS 6203),
“Men’s shirts” (HS 6205),
“Track suits, ski suits, swimwear and other garments” (HS 6211) and
“Garments made of fabrics” (HS 6210)
fulfil this criterion (as indicated by the bold crosses in Table 3). In both target markets, Bangladesh, Myanmar and Cambodia are always among these four LDCs, Afghanistan and Bhutan never. The listed products reach a score of at least 4.5 confirming their high export potential in many LDCs. Since some textile products, particularly garments, are rather homogenous and can often be produced with very similar production factors, skills and equipment, other varieties may be considered as well. Fibres and fabrics, such as cotton, do not rank high among potential export products in the textile and textile articles sector. Only carpets show some potential for Afghanistan and Nepal.
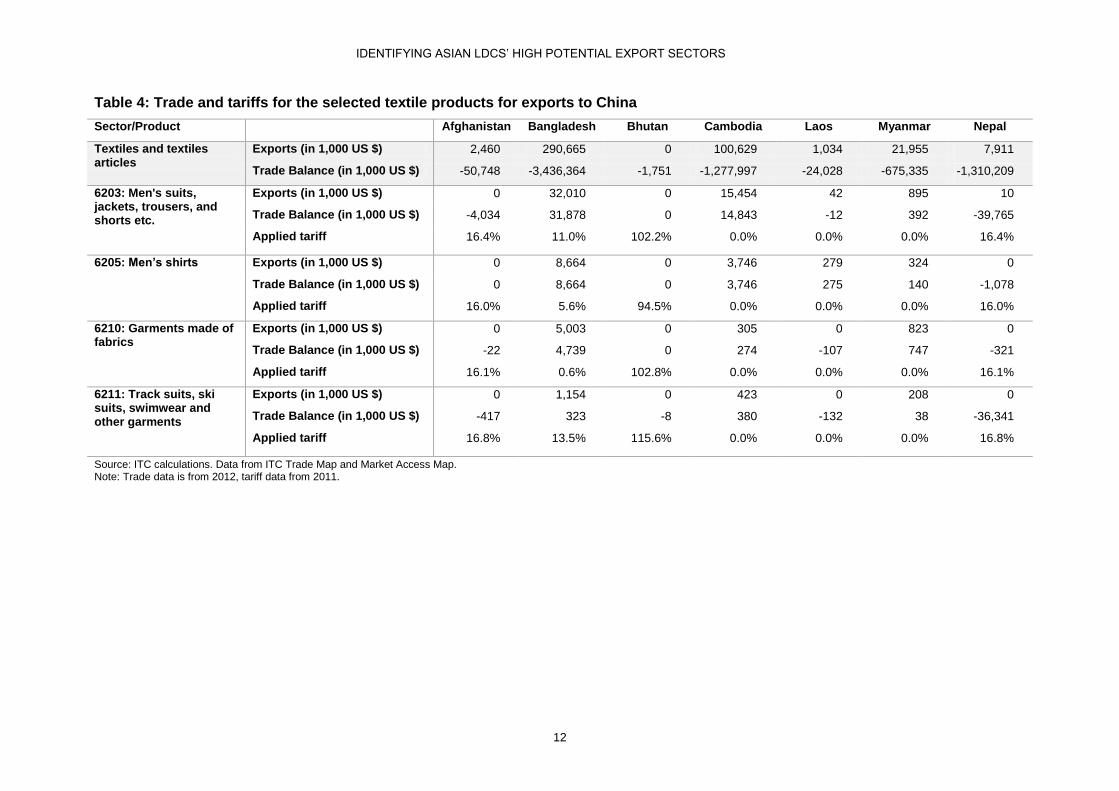
Table 4 summarizes trade and tariff information of each listed product for exports to the Chinese market. Only Bangladesh, Cambodia and Myanmar significantly exported the selected products in 2012. The Lao People’s Democratic Republic shows few exports in Men’s shirts and even less in Men’s suits. The tariffs China applies to exports from Afghanistan, Nepal and notably Bhutan are high and could be one of the reasons why these countries have not explored the Chinese market yet despite existing exports (compare Table 3). The negative trade balances furthermore indicate that Afghanistan and to a lesser extent also Nepal import in fact some of the textile articles from China – a source competition that could be hard to tackle.
IDENTIFYING ASIAN LDCS’ HIGH POTENTIAL EXPORT SECTORS
12
Table 4: Trade and tariffs for the selected textile products for exports to China
Sector/Product Afghanistan Bangladesh Bhutan Cambodia Laos Myanmar Nepal
Textiles and textiles articles
Exports (in 1,000 US $) 2,460 290,665 0 100,629 1,034 21,955 7,911
Trade Balance (in 1,000 US $) -50,748 -3,436,364 -1,751 -1,277,997 -24,028 -675,335 -1,310,209
6203: Men's suits, jackets, trousers, and shorts etc.
Exports (in 1,000 US $) 0 32,010 0 15,454 42 895 10
Trade Balance (in 1,000 US $) -4,034 31,878 0 14,843 -12 392 -39,765
Applied tariff 16.4% 11.0% 102.2% 0.0% 0.0% 0.0% 16.4%
6205: Men’s shirts
Exports (in 1,000 US $) 0 8,664 0 3,746 279 324 0
Trade Balance (in 1,000 US $) 0 8,664 0 3,746 275 140 -1,078
Applied tariff 16.0% 5.6% 94.5% 0.0% 0.0% 0.0% 16.0%
6210: Garments made of fabrics
Exports (in 1,000 US $) 0 5,003 0 305 0 823 0
Trade Balance (in 1,000 US $) -22 4,739 0 274 -107 747 -321
Applied tariff 16.1% 0.6% 102.8% 0.0% 0.0% 0.0% 16.1%
6211: Track suits, ski suits, swimwear and other garments
Exports (in 1,000 US $) 0 1,154 0 423 0 208 0
Trade Balance (in 1,000 US $) -417 323 -8 380 -132 38 -36,341
Applied tariff 16.8% 13.5% 115.6% 0.0% 0.0% 0.0% 16.8%
Source: ITC calculations. Data from ITC Trade Map and Market Access Map. Note: Trade data is from 2012, tariff data from 2011.
IDENTIFYING ASIAN LDCS’ HIGH POTENTIAL EXPORT SECTORS
13
Fruits, vegetables, and nuts
China’s and developing Asia’s strong and growing demand of some seeds, vegetables and nuts implies a potential for Asian LDCs’ exports in the sector. Market access conditions are generally, however, more restrictive, both in terms of tariff and in terms of non-tariff measures.
Nevertheless have a number of countries managed to overcome these trade obstacles and exported fruits, vegetables, and nuts to developing Asia and to China in the past. Especially Myanmar and Lao People’s Democratic Republic have already successfully sold their produces on the Chinese market.
Regarding the developing Asian market in general, four out of seven LDCs have a high export potential in
“Medicinal plants” (HS 1211)
and at least three LDCs have a high potential in
“Oil seeds” (HS 1207) and
“Locust beans” (HS 1212).
All these products rank among the top 10% of high potential export products in Afghanistan and in Lao People’s Democratic Republic. Regarding the Chinese market, in particular,
“Manioc, arrowroot salem (yams) etc.” (HS 0714)
is a promising export product in four out of seven LDCs, and
“Medicinal plants” (HS 1211),
“Oil seeds” (HS 1207),
“Locust beans” (HS 1212) and
“Other vegetables” (HS 1404)
are among the products with the highest potential in at least three LDCs. Afghanistan, Myanmar and Lao People’s Democratic Republic have a high export potential for most of these products but also Nepal and even Bhutan seem to have some prospects for successful exports in particular in medicinal plants. In fact, all LDCs have a high export potential in at least one of the listed products. This shows that the fruits, vegetables, and nuts sector is generally more heterogeneous than the textile and textile articles sector and may require product-specific export promotion activities.
Table 5 gives an overview of trade in and tariffs applied to each listed product by China. Fostered by duty-free entry conditions into the Chinese market, Myanmar and Lao People’s Democratic Republic show significant exports in most of the selected goods. Nepal and Afghanistan export mainly medicinal plants to China for which these two countries also have a high export potential (compare Table 3). Cambodia managed to export in 2012 for the first time a significant amount of manioc to China. High tariffs applied to Bhutan and for some products also to Afghanistan and Nepal may make it difficult for these countries to develop exports to China, even though the trade balances indicate that competition from China is rather limited in the selected products.

IDENTIFYING ASIAN LDCS’ HIGH POTENTIAL EXPORT SECTORS
14
Table 5: Trade and tariffs for the selected fruits, vegetable, and nuts products for exports to China
Sector/Product Afghanistan Bangladesh Bhutan Cambodia Laos Myanmar Nepal
Fruits, vegetables, and nuts
Exports (in 1,000 US $) 1,968 3,888 0 10,706 36,460 127,255 8,508
Trade Balance (in 1,000 US $) -568 -149,159 -284 -1,450 31,805 103,554 -31,330
0714: Manioc, arrowroot salem (yams) etc.
Exports (in 1,000 US $) 0 0 0 5,343 482 1,187 0
Trade Balance (in 1,000 US $) 0 0 0 5,343 482 1,187 0
Applied tariff 8.6% 7.8% 46.6% 0.0% 0.0% 0.0% 8.6%
1207: Oil seeds Exports (in 1,000 US $) 0 3,871 0 0 177 14,720 0
Trade Balance (in 1,000 US $) 0 3,196 0 0 135 14,720 0
Applied tariff 8.3% 8.0% 43.1% 0.0% 0.0% 0.0% 8.2%
1211: Medicinal plants Exports (in 1,000 US $) 1,966 0 0 0 8 2,023 8,397
Trade Balance (in 1,000 US $) 1,966 -302 0 0 8 2,023 8,278
Applied tariff 6.3% 3.6% 24.6% 0.0% 0.0% 0.0% 6.3%
1212: Locust beans Exports (in 1,000 US $) 0 0 0 95 9,805 42,586 0
Trade Balance (in 1,000 US $) -53 -1 0 -422 9,805 42,585 0
Applied tariff 18.3% 14.0% 73.1% 1.3% 1.3% 1.3% 18.3%
1404: Other vegetables Exports (in 1,000 US $) 0 0 0 0 185 5 10
Trade Balance (in 1,000 US $) 0 0 0 0 185 5 10
Applied tariff 7.6% 7.4% 46.4% 0.0% 0.0% 0.0% 7.6%
Source: ITC calculations. Data from ITC Trade Map and Market Access Map. Note: Trade data is from 2012, tariff data from 2011.

IDENTIFYING ASIAN LDCS’ HIGH POTENTIAL EXPORT SECTORS
15
3.2.2. Future development prospects
Our analysis has so far taken into account supply and demand including market access conditions. The selected products may, however, entail very different prospects for future economic development that go beyond these dimensions. For example, countries may desire to focus their efforts on products that are associated with relatively high per-capita incomes. The associated income is calculated as the average per-capita GDP of all exporting countries weighted by their revealed comparative advantages in that product. A product thus implies a relatively high per-capita income if many wealthy countries produce and export it with a comparative advantage. The associated income may also be interpreted as a measure of product sophistication.
7
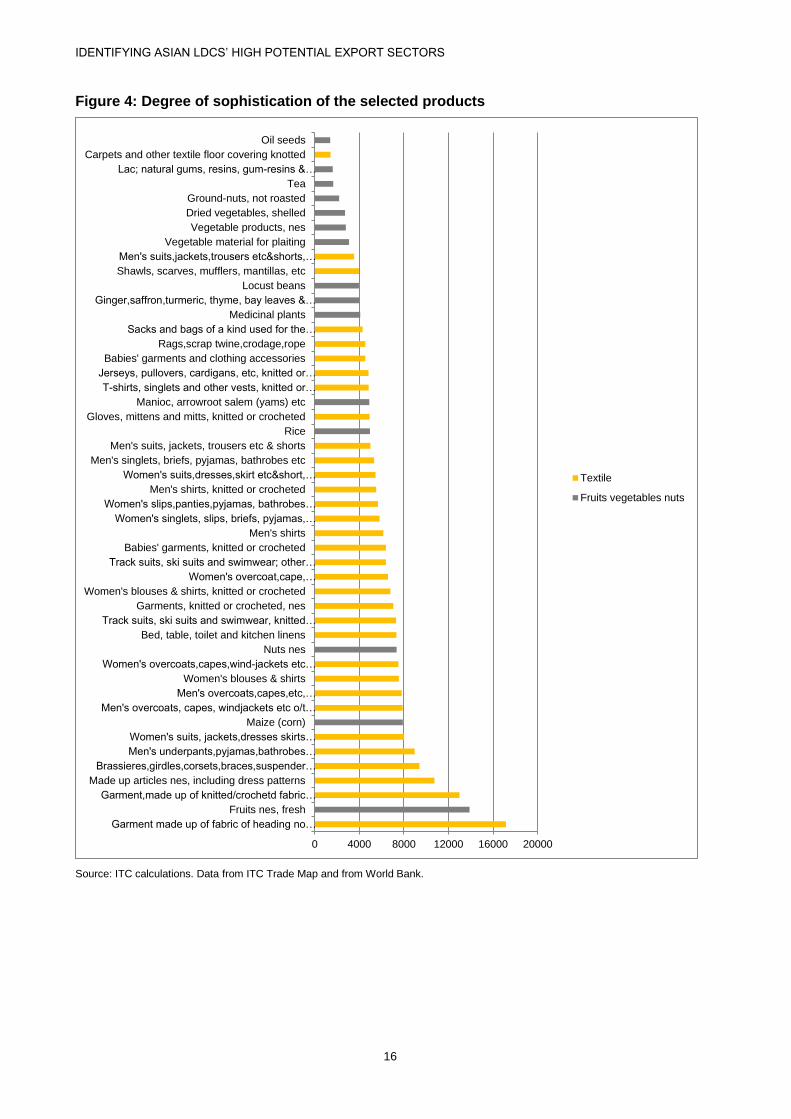
Figure 4 shows the per-capita income level that is associated with each of the products selected for exporting to China. Textile products tend to be linked to higher GDP per-capita levels than fruits, vegetables and nuts. Garments made of fabrics (HS 6210) even reach an average associated income of US$ 17,162 which is a multiple of Asian LDCs’ current levels. The other products with a high EPI score (among the top 10%) in at least four LDCs have lower associated per-capita GDPs of US$ 5,000 (Men's suits, jackets, trousers, and shorts etc.) to US$ 6,400 (Track suits, ski suits, swimwear and other garments). In the fruits, vegetables and nuts sector, the vast majority of products imply an average per-capita GDP of below US$ 4,000. Out of the products that have a high export potential in at least three countries, only manioc, arrowroot salem (yams) etc. (HS 0714) and medicinal plants (HS 1211) are linked to more elevated incomes. Nevertheless, compared to the countries’ actual GDP per-capita levels, efforts to export (more of) the selected products could still be conducive to the countries’ future economic development. Only Bhutan’s per-capita GDP is with around US$ 2,400 currently above the level associated with a few of the selected products.
7 Hausmann et al. (2007): What you export matters, Journal of Economic Growth 12:1-25.
IDENTIFYING ASIAN LDCS’ HIGH POTENTIAL EXPORT SECTORS
16
Figure 4: Degree of sophistication of the selected products
Source: ITC calculations. Data from ITC Trade Map and from World Bank.
0 4000 8000 12000 16000 20000
Garment made up of fabric of heading no…
Fruits nes, fresh
Garment,made up of knitted/crochetd fabric…
Made up articles nes, including dress patterns
Brassieres,girdles,corsets,braces,suspender…
Men's underpants,pyjamas,bathrobes…
Women's suits, jackets,dresses skirts…
Maize (corn)
Men's overcoats, capes, windjackets etc o/t…
Men's overcoats,capes,etc,…
Women's blouses & shirts
Women's overcoats,capes,wind-jackets etc…
Nuts nes
Bed, table, toilet and kitchen linens
Track suits, ski suits and swimwear, knitted…
Garments, knitted or crocheted, nes
Women's blouses & shirts, knitted or crocheted
Women's overcoat,cape,…
Track suits, ski suits and swimwear; other…
Babies' garments, knitted or crocheted
Men's shirts
Women's singlets, slips, briefs, pyjamas,…
Women's slips,panties,pyjamas, bathrobes…
Men's shirts, knitted or crocheted
Women's suits,dresses,skirt etc&short,…
Men's singlets, briefs, pyjamas, bathrobes etc
Men's suits, jackets, trousers etc & shorts
Rice
Gloves, mittens and mitts, knitted or crocheted
Manioc, arrowroot salem (yams) etc
T-shirts, singlets and other vests, knitted or…
Jerseys, pullovers, cardigans, etc, knitted or…
Babies' garments and clothing accessories
Rags,scrap twine,crodage,rope
Sacks and bags of a kind used for the…
Medicinal plants
Ginger,saffron,turmeric, thyme, bay leaves &…
Locust beans
Shawls, scarves, mufflers, mantillas, etc
Men's suits,jackets,trousers etc&shorts,…
Vegetable material for plaiting
Vegetable products, nes
Dried vegetables, shelled
Ground-nuts, not roasted
Tea
Lac; natural gums, resins, gum-resins &…
Carpets and other textile floor covering knotted
Oil seeds
Textile
Fruits vegetables nuts
IDENTIFYING ASIAN LDCS’ HIGH POTENTIAL EXPORT SECTORS
17
4. Discussion
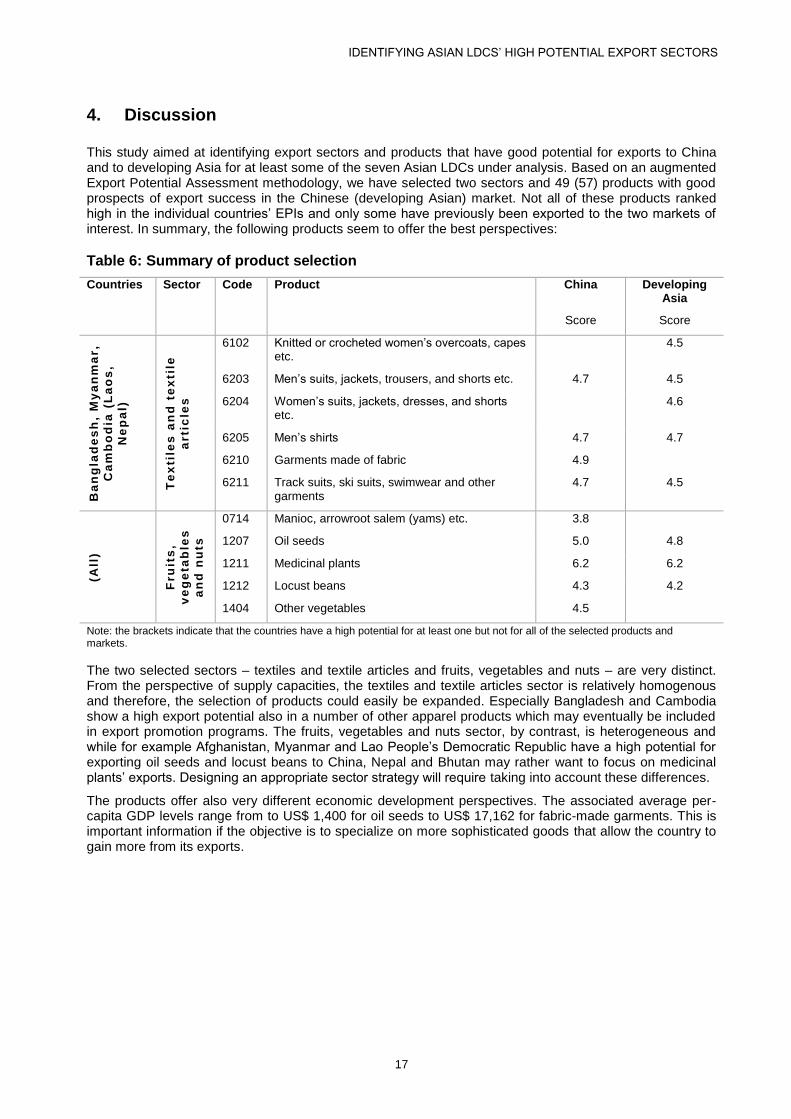
This study aimed at identifying export sectors and products that have good potential for exports to China and to developing Asia for at least some of the seven Asian LDCs under analysis. Based on an augmented Export Potential Assessment methodology, we have selected two sectors and 49 (57) products with good prospects of export success in the Chinese (developing Asian) market. Not all of these products ranked high in the individual countries’ EPIs and only some have previously been exported to the two markets of interest. In summary, the following products seem to offer the best perspectives:
Table 6: Summary of product selection
Countries Sector Code Product China Developing Asia
Score Score
Ba
ng
lad
es
h,
My
an
ma
r,
Ca
mb
od
ia (
La
os
,
Ne
pa
l)
Te
xti
les
an
d t
ex
tile
arti
cle
s
6102 Knitted or crocheted women’s overcoats, capes etc.
4.5
6203 Men’s suits, jackets, trousers, and shorts etc. 4.7 4.5
6204 Women’s suits, jackets, dresses, and shorts etc.
4.6
6205 Men’s shirts 4.7 4.7
6210 Garments made of fabric 4.9
6211 Track suits, ski suits, swimwear and other garments
4.7 4.5
(All
)
Fru
its
,
ve
ge
tab
les
an
d n
uts
0714 Manioc, arrowroot salem (yams) etc. 3.8
1207 Oil seeds 5.0 4.8
1211 Medicinal plants 6.2 6.2
1212 Locust beans 4.3 4.2
1404 Other vegetables 4.5
Note: the brackets indicate that the countries have a high potential for at least one but not for all of the selected products and markets.
The two selected sectors – textiles and textile articles and fruits, vegetables and nuts – are very distinct. From the perspective of supply capacities, the textiles and textile articles sector is relatively homogenous and therefore, the selection of products could easily be expanded. Especially Bangladesh and Cambodia show a high export potential also in a number of other apparel products which may eventually be included in export promotion programs. The fruits, vegetables and nuts sector, by contrast, is heterogeneous and while for example Afghanistan, Myanmar and Lao People’s Democratic Republic have a high potential for exporting oil seeds and locust beans to China, Nepal and Bhutan may rather want to focus on medicinal plants’ exports. Designing an appropriate sector strategy will require taking into account these differences.
The products offer also very different economic development perspectives. The associated average per-capita GDP levels range from to US$ 1,400 for oil seeds to US$ 17,162 for fabric-made garments. This is important information if the objective is to specialize on more sophisticated goods that allow the country to gain more from its exports.
IDENTIFYING ASIAN LDCS’ HIGH POTENTIAL EXPORT SECTORS
18
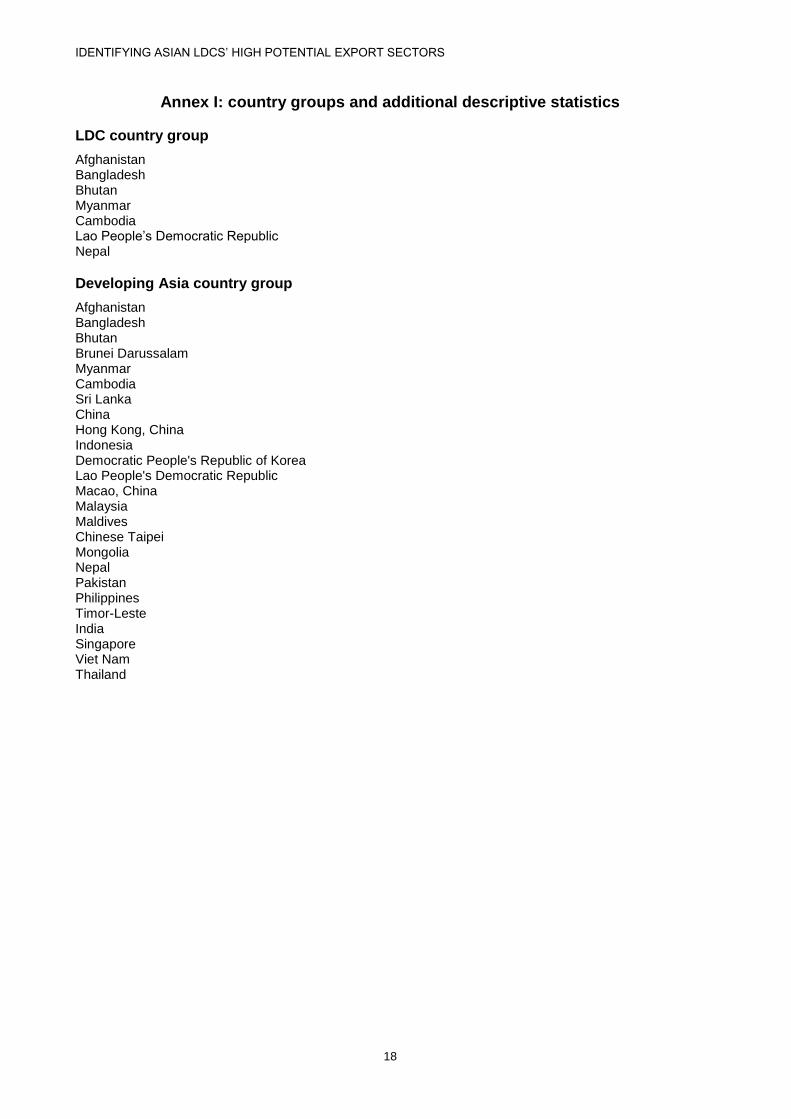
Annex I: country groups and additional descriptive statistics
LDC country group
Afghanistan Bangladesh Bhutan Myanmar Cambodia Lao People’s Democratic Republic Nepal
Developing Asia country group
Afghanistan Bangladesh Bhutan Brunei Darussalam Myanmar Cambodia Sri Lanka China Hong Kong, China Indonesia Democratic People's Republic of Korea Lao People's Democratic Republic Macao, China Malaysia Maldives Chinese Taipei Mongolia Nepal Pakistan Philippines Timor-Leste India Singapore Viet Nam Thailand
IDENTIFYING ASIAN LDCS’ HIGH POTENTIAL EXPORT SECTORS
19
Figure 1: Asian LDCs' exports to developing Asia (incl. China) by sector and exporting country
Fruits vegetables
nuts 39%, -28pp
Mineral products
19%, +14pp
Textile 22%, -1pp
Metals 15%, +14pp
Rest 4%, +1pp
Afghanistan
Animal agriculture 6%, -6pp
Fruits vegetables
nuts 4%, +4pp
Foodstuffs 2%, +2pp
Mineral products
8%, +5pp
Chemistry 3%, +0pp
Plastics and rubber 3%, +3pp
Raw hides and skins 9%, -21pp
Textile 53%, +19pp
Metals 4%, +4pp
Machinery and
electronical
equipment 3%, +3pp
Rest 5%, +1pp
Bangladesh
Chemistry 13%, -25pp
Wood 3%, -13pp
Metals 80%, +44pp
Rest 3%, -3pp
Bhutan
Animal agriculture 3%, -2pp
Fruits vegetables
nuts 14%, -6pp
Mineral products
55%, +11pp Plastics
and rubber 3%, +2pp
Wood 17%, -5pp
Precious stones and
metals 4%, +4pp
Rest 4%, -2pp
Myanmar

IDENTIFYING ASIAN LDCS’ HIGH POTENTIAL EXPORT SECTORS
20
Fruits vegetables
nuts 12%, +9pp
Mineral products 6%, +6pp
Plastics and rubber 9%, -5pp
Wood 3%, -29pp
Textile 21%
Footwear headgear umbrellas 3%, +2pp
Precious stones and
metals 33%, +26pp
Metals 5%, +3pp
Machinery and
electronical
equipment 4%, +2pp
Rest 4%, +0pp
Cambodia Fruits vegetables
nuts 5%, +0pp
Mineral products
47%, +42pp
Plastics and rubber 2%, +2pp
Wood 14%, -52pp
Metals 28%, +28pp
Rest 4%, +0pp
Laos
Fruits vegetables
nuts 15%, +11pp
Foodstuffs 15%, +11pp
Mineral products 3%, +2pp
Chemistry 10%, -11pp Plastics
and rubber 12%, +8pp
Textile 11%, -5pp
Footwear headgear umbrellas 4%, +4pp
Metals 22%, +4pp
Rest 7%, +1pp
Nepal
IDENTIFYING ASIAN LDCS’ HIGH POTENTIAL EXPORT SECTORS
21
Figure 2: Asian LDCs' exports to China by sector and exporting country
Fruits vegetables
nuts 38%, +35pp
Textile 48%, -23pp
Precious stones and
metals 5%, +5pp
Instruments and
apparatus 4%, +4pp
Rest 5%, +3pp
Afghanistan
Animal agriculture 10%, +6pp
Mineral products 5%, +5pp
Plastics and rubber 8%, +8pp
Raw hides and skins 9%, -68pp
Textile 61%, +46pp
Instruments and
apparatus 3%, +0pp
Rest 4%, +2pp
Bangladesh
Metals 33%, +33pp
Machinery and
electronical
equipment 67%, +67pp
Bhutan Animal agriculture
5% Fruits
vegetables nuts
10%, -2pp
Mineral products
22%, +13pp
Plastics and rubber 9%, +9pp
Wood 24%, -43pp
Precious stones and
metals 23%, +20pp
Metals 2%, +2pp
Instruments and
apparatus 3%, +3pp
Rest 3%, +1pp
Myanmar

IDENTIFYING ASIAN LDCS’ HIGH POTENTIAL EXPORT SECTORS
22
Animal agriculture 4%, +0pp
Fruits vegetables
nuts 5%, +4pp
Plastics and rubber 19%, +3pp
Wood 13%, -64pp
Textile 47%, +45pp
Footwear headgear umbrellas 5%, +5pp
Metals 4%, +4pp
Machinery and
electronical
equipment 2%, +2pp
Rest 1%, -2pp
Cambodia
Fruits vegetables
nuts 5%, -17pp
Mineral products
46%, +46pp
Plastics and rubber 7%, +3pp
Wood 30%, -39pp
Metals 12%, +12pp
Rest 1%, -1pp
Laos
Fruits vegetables
nuts 29%, +7pp
Raw hides and skins 11%, +7pp
Wood 5%, +5pp
Textile 27%, +22pp
Metals 24%, +19pp
Rest 4%, +1pp
Nepal
IDENTIFYING ASIAN LDCS’ HIGH POTENTIAL EXPORT SECTORS
23
Annex II: additional EPI results
Figure 3: Export Potential Indices via-à-vis China
10
20
30
40
50
60
70
80
20 30 40 50 60 70 80 90 100
Ch
ina
De
ma
nd
In
de
x
Export Performance Index
Afghanistan
Low tariff advantage Medium tariff advantage High tariff advantage

IDENTIFYING ASIAN LDCS’ HIGH POTENTIAL EXPORT SECTORS
24
10
20
30
40
50
60
70
80
0 10 20 30 40 50 60 70 80 90 100
Ch
ina
De
ma
nd
In
de
x
Export Performance Index
Bangladesh
Low tariff advantage Medium tariff advantage High tariff advantage
20
30
40
50
60
70
80
90
20 30 40 50 60 70 80 90
Ch
ina
Dem
an
d In
de
x
Export Performance Index
Bhutan
Low tariff advantage Medium tariff advantage High tariff advantage
IDENTIFYING ASIAN LDCS’ HIGH POTENTIAL EXPORT SECTORS
25
10
20
30
40
50
60
70
80
0 10 20 30 40 50 60 70 80 90 100
Ch
ina
De
ma
nd
In
de
x
Export Performance Index
Myanmar
Low tariff advantage Medium tariff advantage High tariff advantage
10
20
30
40
50
60
70
10 20 30 40 50 60 70 80 90 100
Ch
ina
Dem
an
d In
de
x
Export Performance Index
Cambodia
Low tariff advantage Medium tariff advantage High tariff advantage
IDENTIFYING ASIAN LDCS’ HIGH POTENTIAL EXPORT SECTORS
26
Source: ITC calculations. Data from ITC Trade Map and Market Access Map. Note: the bubble size reflects the country’s total exports of the product. Selected products are black circled.
10
20
30
40
50
60
70
10 20 30 40 50 60 70 80 90 100
Ch
ina
De
ma
nd
In
de
x
Export Performance Index
Lao's People's Democratic Republic
Low tariff advantage Medium tariff advantage High tariff advantage
10
20
30
40
50
60
70
80
20 30 40 50 60 70 80 90 100
Ch
ina
Dem
an
d In
de
x
Export Performance Index
Nepal
Low tariff advantage Medium tariff advantage High tariff advantage

IDENTIFYING ASIAN LDCS’ HIGH POTENTIAL EXPORT SECTORS
27
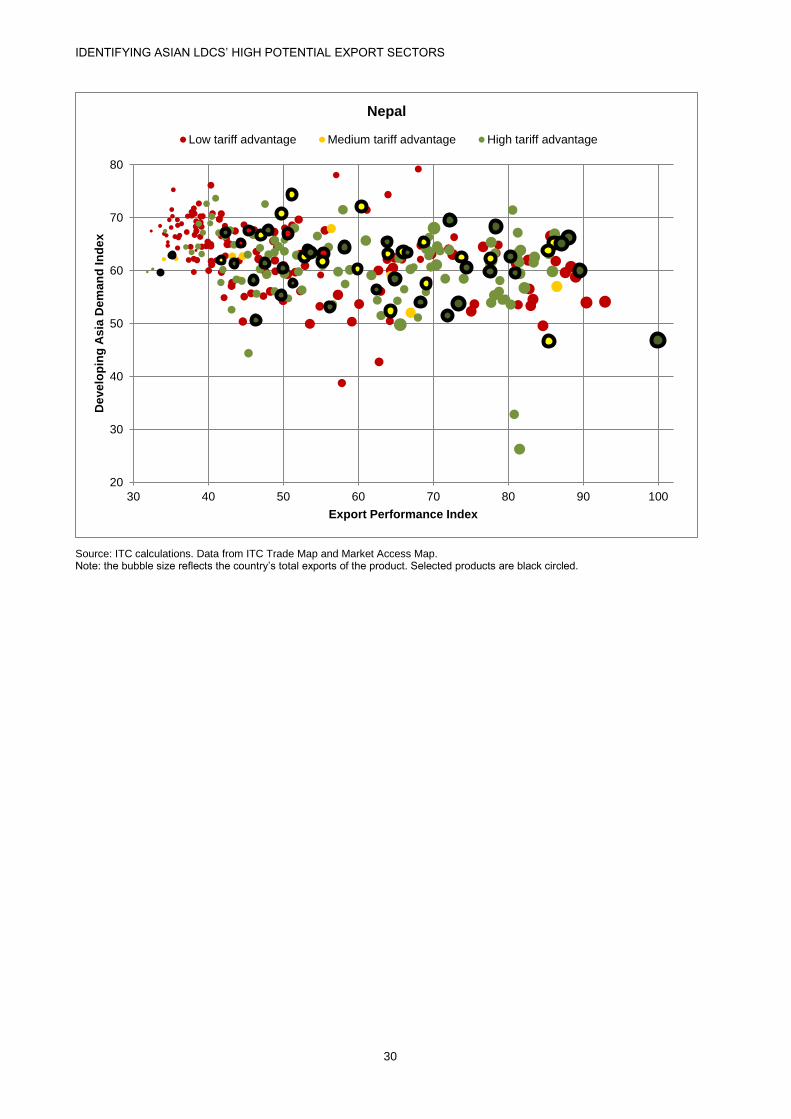
Figure 4: Export Potential Indices vis-à-vis developing Asia
40
50
60
70
80
90
20 30 40 50 60 70 80 90 100
De
ve
lop
ing
As
ia D
em
an
d In
de
x
Export Performance Index
Afghanistan
Low tariff advantage Medium tariff advantage High tariff advantage
20
30
40
50
60
70
80
90
0 10 20 30 40 50 60 70 80 90 100
Deve
lop
ing
As
ia D
em
an
d In
de
x
Export Performance Index
Bangladesh
Low tariff advantage Medium tariff advantage High tariff advantage

IDENTIFYING ASIAN LDCS’ HIGH POTENTIAL EXPORT SECTORS
28
30
35
40
45
50
55
60
65
70
75
80
20 30 40 50 60 70 80 90
De
ve
lop
ing
As
ia D
em
an
d In
de
x
Export Performance Index
Bhutan
Low tariff advantage Medium tariff advantage High tariff advantage
10
20
30
40
50
60
70
0 10 20 30 40 50 60 70 80 90 100
Deve
lop
ing
As
ia D
em
an
d In
de
x
Export Performance Index
Myanmar
Low tariff advantage Medium tariff advantage High tariff advantage

IDENTIFYING ASIAN LDCS’ HIGH POTENTIAL EXPORT SECTORS
29
0
10
20
30
40
50
60
70
80
10 20 30 40 50 60 70 80 90 100
De
ve
lop
ing
As
ia D
em
an
d In
de
x
Export Performance Index
Cambodia
Low tariff advantage Medium tariff advantage High tariff advantage
10
20
30
40
50
60
70
80
20 30 40 50 60 70 80 90 100
Deve
lop
ing
As
ia D
em
an
d In
de
x
Export Performance Index
Lao's People's Democratic Republic
Low tariff advantage Medium tariff advantage High tariff advantage
IDENTIFYING ASIAN LDCS’ HIGH POTENTIAL EXPORT SECTORS
30
Source: ITC calculations. Data from ITC Trade Map and Market Access Map. Note: the bubble size reflects the country’s total exports of the product. Selected products are black circled.
20
30
40
50
60
70
80
30 40 50 60 70 80 90 100
De
ve
lop
ing
As
ia D
em
an
d In
de
x
Export Performance Index
Nepal
Low tariff advantage Medium tariff advantage High tariff advantage