Embed Size (px)
Citation preview

Identifying dynamics of growth in a competitive and transitioning lighting industry using PESTLE and SWOT analysis
Master thesis submitted to Delft University of Technology
in partial fulfilment of the requirements for the degree of
MASTER OF SCIENCE
in Management of Technology
Faculty of Technology, Policy and Management
by
Arun Meyappan Venkatachalam
Student number: 4614631
To be defended in public on November 19, 2018
Graduation committee
Supervisor: Dr. L. (Laurens) Rook, Assistant Professor, Economics of Technology and Innovation Chairperson: Prof.dr. S. (Sabine) Roeser, Full Professor, Ethics/Philosophy of technology
An electronic version of this thesis is available at http://repository.tudelft.nl/.

2
Preface I would like to first thank, Dr. Laurens Rook for his continuous support and patience throughout the research.
His comments on perfecting each chapter taught me the way to create a storyline and helped me improve
my writing skills. From appreciating whenever I submitted a good draft till making me do many revisions for
certain chapters, he has truly been an inspiration for me to draft a quality report.
Second, I would like to thank, Prof.dr. Sabine Roeser. Finding a chairperson for my thesis took me months,
until she accepted immediately and came on board. Also, thank you for accepting my request for an early
defense. Your feedback on asking me to explicitly state academic relevance helped the report gain solid flow.
Next my family. Through all their financial struggles, Amma, Appa and Chidu were determined to send me to
TU Delft for my masters. Vaish appa and amma and Sundeep amma for their parents like love. I owe it to all
of them! Then my friends in Netherlands. Specially, I would like to thank Nithya, Manoj and Shashank (or my
family in Netherlands). Nithya for always and always and always being there, Manoj for being the guy I can
blindly take out my frustration on and Shashank for bringing in the much-needed positivity and ultimate fun
sessions. Also, I would like to thank Agnelo for his constant Aruns and Jayanth for his messenger pings.
Finally, my friends back home. Thank you da, Sundeep, Vaishnav, Abhinav and Siva!

3
Executive summary
The conventional lighting industry had entry barriers in terms of technical know-how, economy of scale advantages
and product quality whereas the LED technology has allowed new players from the semiconductor and consumer
electronics segments to enter the general lighting market with LED products. While demand for replacement lamps
has accounted for significant growth of conventional lighting thus far, that market is dwindling as fewer replacements
are needed given LEDs’ longer life span. Therefore, the lighting industry structure is rapidly changing due to a disruptive
technological innovation in the form of LEDs. From being dominated by few firms, today’s lighting industry has become
highly competitive with a large number of firms fighting to become the market leader. In this situation, accurately
understanding the dynamics of lighting industry becomes very important and challenging.
Therefore, the goal of this thesis is to identify the dynamics of growth in a competitive and transitioning lighting
industry and arrive at growth strategies for a lighting company. The scope of the research is limited to European
market. Having defined the research objective, the main research question is:
How can a firm identify the dynamics of growth in a competitive lighting industry transitioning from conventional
to fully LED based lighting?
Through combining five forces model with various other relevant strategic tools, a holistic industry analysis can be
made possible but very little literature is available on this. Therefore, this research addresses this scientific gap where
PESTEL (Political, Economic, Social, Technological, Environmental and Legal), Organizational and SWOT analyses are
combined with Porter’s five forces model to accurately analyze the dynamic lighting industry transitioning from
conventional to fully LED based lighting. Based on the qualitative approach, matching research design was defined.
The research design selected is a single case study, as it allows for measuring contemporary phenomena in its usual
context. By analyzing external and internal environment, and market position using PESTEL and SWOT, determinants
for creating a successful strategy are identified and used to arrive at growth strategies for a lighting firm.
The research indicated that the current state of the lighting industry with respect to European market is favouring the
transition of the industry towards LED based lighting from existing conventional sources. Additionally, as the case
company is a market leader in lighting sector, pursuing ‘Grow Strategy’ is the best way for them to move forward. In
this strategy, their strengths and opportunities can be combined to pursue new product ideas like quality of light and
connected lighting solutions, both of which requires immense technical know-how. The case company’s strong R&D
capabilities guarantees product quality and reliability and that along with its massive sales team and good region wise
operational setups can help the case company gain market share in the LED lighting sector. Finally, the main research
question was answered. LED technology is rapidly being commoditized, and product performance cannot anymore be
the specification where companies differentiate themselves. Therefore, opportunities for lighting companies to gain
market share is only possible through developing new value propositions for buyers like quality of light and exploring
untapped potential of connected lighting. Lighting companies must orient their research and development in exploring
and creating these value propositions. Additionally, equipping their current workforce with the relevant technical and
business capabilities will be vital.
Since the lighting industry is rapidly moving towards LED from conventional sources, the expectations of the customers
are high, therefore product quality and reliability is very important. LED lighting being an expensive option, educational
campaigns clearing the doubts surrounding LEDs and its payback time will also be a major push to stimulate the sales.
Low-cost, high volume, and reliable manufacturing methods are important to drive down the first costs of LED lighting.
The research also mentioned the need to maintain strategic relationship with LED suppliers as it is expected that the
future will consolidate all the existing LED suppliers into 3-4 suppliers. New possibilities in decorative and architectural
lighting are now presented by LED lighting, due to their superior colour and special distribution capabilities. Finally, the
research showed that LED lighting will clearly be able to outperform existing lighting technologies in terms of efficacy,
without sacrificing colour rendition. Therefore, the next step is towards device integration and system architecture to
serve the different applications targeted.

4
Contents
Preface ............................................................................................................................................................... 2
Executive summary ............................................................................................................................................ 3
Contents ............................................................................................................................................................. 4
1. Introduction .................................................................................................................................................... 6
1.1 Industry description ................................................................................................................................. 7
1.2 Problem description ................................................................................................................................. 8
1.3 Research objective and questions ............................................................................................................ 8
1.4 Thesis outline ........................................................................................................................................... 8
2. Literature review ............................................................................................................................................ 9
2.1 Porter’s five forces model ........................................................................................................................ 9
2.1.1 Threat of new entrants ................................................................................................................. 10
2.1.2 The threat of new substitutes....................................................................................................... 10
2.1.3 Rivalry among existing firms ........................................................................................................ 11
2.1.4 The bargaining power of buyers .................................................................................................. 11
2.1.5 The bargaining power of suppliers .............................................................................................. 12
2.2 Limitations and Criticisms of the five forces model .............................................................................. 12
2.3 Relationship marketing and its relevance in hypercompetitive and rapidly growing industries .......... 13
2.4 Research gap .......................................................................................................................................... 15
2.5 Conclusion ............................................................................................................................................. 16
3. Methodology ................................................................................................................................................ 17
3.1 Research strategy ................................................................................................................................... 17
3.1.1 Desk research .................................................................................................................................. 18
3.1.2 PESTEL framework ........................................................................................................................ 18
3.1.3 SWOT Analysis .............................................................................................................................. 21
3.1.4 Expert interviews ............................................................................................................................ 22
3.2 Data collection ....................................................................................................................................... 23
3.2.1 Case Company: Signify .................................................................................................................. 23
3.2.2 Signify: Business group level strategy ............................................................................................ 24
3.2.3 Signify: business unit level strategy ................................................................................................ 25
3.2.4 Signify: business division level strategy ......................................................................................... 25
3.2.5 Summary ......................................................................................................................................... 25
3.3 Case study protocol ............................................................................................................................... 25
3.3.1 Case study overview ....................................................................................................................... 26
3.4 Data analysis strategy ........................................................................................................................... 26
3.4.1 Data management ............................................................................................................................ 26
3.4.2 Content analysis and analysis within and between interviews........................................................ 26
3.4.3 Data coding ..................................................................................................................................... 27
3.4.4 Category construction ..................................................................................................................... 27
3.4.5 Cross-checking of results ................................................................................................................ 27
3.5 Research quality .................................................................................................................................... 27
3.5.1 Reliability of the research ............................................................................................................... 27
3.4.2 Validity of the research ................................................................................................................... 28
4. Results .......................................................................................................................................................... 29
4.1 Interview setting and findings ................................................................................................................ 29
4.1.1 Sample and procedure ..................................................................................................................... 29
4.1.2 Individual interviews ....................................................................................................................... 30
4.1.3 Focus group interviews ................................................................................................................... 33

5
4.1.4 Spearman correlation ...................................................................................................................... 35
4.2 Consolidation and interpretation of results ........................................................................................... 36
4.2.1 PESTEL analysis ............................................................................................................................. 36
4.2.2 SWOT Analysis .............................................................................................................................. 47
4.3 SWOT Matrix and strategies .............................................................................................................. 48
4.4 Conclusion ............................................................................................................................................. 50
5. Discussion and conclusions ......................................................................................................................... 52
5.1 Key findings ........................................................................................................................................... 52
5.2 Theoretical contribution ........................................................................................................................ 52
5.3 Practical relevance ................................................................................................................................ 53
5.4 Limitations ............................................................................................................................................. 54
5.5 Future research ...................................................................................................................................... 54
5.6 Conclusion ............................................................................................................................................. 55
6. References .................................................................................................................................................... 56
Appendix 1 ....................................................................................................................................................... 64

6
1. Introduction Why do some companies perform better than their competitors and achieve continuous success? How can firms build
competitive advantage in regimes of rapid change? These are the fundamental questions in the field of strategic
management. Since the early 1960s, managing the planning process has become more important as a means of coping
with a turbulent business environment (Drucker, 1964; Hussey, 1979). A number of forces have contributed to this,
including an increase in environmental uncertainty, the external interdependence of organizations, organizational
diversification and size, societal performance demands on organizations, and more recently the disappearance of
conventional marketing structures (Homburg & Workman, 2000; McDonald, 1996; McDonald, 1982; Moorman & Rust,
1999).
The new competitive landscape, driven by the technological revolution and significant globalization, is moving towards
hyper competition (rapidly escalating competition and strategic maneuvering), extreme emphases on price, quality
and satisfaction of customer needs, and an increasing focus on innovation (both in technology and new
products/services). As a result, in the new competitive landscape, firms face significant uncertainty, ambiguity and an
increasing number of strategic discontinuities. Firms have to create innovative products and services of high quality
and at low prices to satisfy increasingly informed customers with distinct needs. Managers are motivated to reduce
the uncertainty by identifying new sources of competitive advantage (Hitt, Keats, & Samuel, 1998). Therefore, such
challenging marketing circumstances often require the companies to reformulate their marketing strategies and
offerings several times.
Strategic management is defined as a set of managerial decisions and actions of an organization that can be used to
facilitate competitive advantage and long-run superior performance over other organizations (Powell, 2001; Wheelen
and Hunger, 2004). The dominant paradigm in strategic management was the competitive strategy approach
developed by Porter (1980). This approach, rooted in the structure – conduct – performance paradigm of industrial
organization (Mason, 1949; Bain, 1959; Lansley, 1994; Grundy, 2006), emphasizes the actions a firm can take to create
defensible positions against competitive forces. A second approach, referred to as a strategic conflict approach
(Shapiro, 1989), is closely related to the first in its focus on product market imperfections, entry deterrence, and
strategic interaction. This approach implicitly views competitive outcomes as a function of the effectiveness with which
firms keep their rivals off balance through strategic investments, pricing strategies, signaling, and the control of
information. Both the competitive forces and the strategic conflict approaches share the view that rents flow from
privileged product market positions (Teece, Gary, & Shuen, 1997).
Another distinct class of approaches emphasizes building competitive advantage through capturing entrepreneurial
rents stemming from fundamental firm-level efficiency advantages. These approaches have their roots in a much older
discussion of corporate strengths and weaknesses; they have taken on new life as evidence suggests that firms build
enduring advantages only through efficiency and effectiveness, and as developments in organizational economics and
the study of technological and organizational change become applied to strategy questions. One strand of this
literature, often referred to as the ‘resource-based perspective,’ emphasizes firm-specific capabilities and assets and
the existence of isolating mechanisms as the fundamental determinants of firm performance. This perspective
recognizes but does not attempt to explain the nature of the isolating mechanisms that enable entrepreneurial rents
and competitive advantage to be sustained (Penrose, 1959; Rumelt, 1984; Teece D. J., 1984; Wernerfelt, 1984).
Strategic management involves a number of critical steps, including scanning the environment for information,
selecting relevant data and interpreting it, building a strategy, testing it and putting it into action (Cray and Mallory,
1998). In recent years, several conceptual frameworks have been developed to better understand the processes of
strategy formulation, and for such processes, the term “strategic marketing” is used to describe the decisions taken to
develop long-run strategies for survival and growth (Urban & Star, 1991). An important part of strategic marketing in
is in evaluating the business environment of a firm. Porter’s model (1980) states that the knowledge of specific five
forces are crucial to understand the competitive environment that the company is operating within (Lansley, 1994).
Until today the framework has been an influential model within business literature and textbooks for analyzing a
company’s environment (Grundy, 2006; Bartlett and Sumantra, 2002; Dobbs, 2014). Grundy (2006) compliments the
model stating it is “genius” how Porter condensed the complex micro-economic theory into only five key influences.

7
But, using Porter’s five forces model to evaluate today’s competitive landscape created by the growth in international
trade, technological improvements and global access to information may not be accurate.
According to Thyrlby (1998), the five forces model of Porter is static and does not take account of time. The static
nature of the model is a challenge to innovation in a rapidly changing industrial structure such as environmental trends,
changes in the ethnic composition of a population or a technological innovation which may pose a greater impact on
some industries than on others (Dess et al., 2005). Thus, it is much more difficult to determine markets with higher
dynamic competition because they can change very quickly. Flower (2004) and Downes (1997) criticize Porter’s model
because of the missing attention to ‘Digitalization’, ‘Globalization’, and ‘Deregulation’. According to them, those three
factors are one reason why the industry structures changed during the last decades. Therefore, a need for more
accurate analysis of business environment arises especially when the corresponding industry or market is dynamic and
growing rapidly.
1.1 Industry description
Lighting industry is entering an era of faster-paced competition. An industry that has been dominated by a few firms
now faces competition from new technologies, firms, and regions. Lamp (the industry name for a light bulb)
manufacturing was dominated for decades by Philips, OSRAM, and General Electric (GE). But today, not only are these
incumbent firms under the threat from low-cost imports, but Solid-State Lighting (SSL), a LED (semiconductor) based
technology with greater potential energy efficiency and new capabilities, is revolutionizing the industry and changing
how we understand and use lighting. The advantages of LED based lighting include low energy consumption, a long
lifetime, and enhanced versatility. These advantages along with falling prices of LEDs are driving the rapid adoption of
the SSL (Sanderson, Simons, Walls, & Lai, 2008; Zhu & Humphreys, 2016; Candelon, Creyghton, Hong, Rubel, & Smits,
2015).
The main disadvantages of LEDs are: Lack of standardization, relatively high price, risk of glare as a result of small lamp
size, need for thermal management to avoid degradation in lifetime, temperature dependence (ambient temperature
greatly influences the LEDs' performance) but the shift towards LED technology is predicted to accelerate for two key
reasons. First, although LED technology is still more expensive than conventional lights (currently about five to ten
times more) the price is falling precipitously, owing to technological advances in manufacturing and increasing LED
efficiency (fewer LEDs are required for a similar amount of light output). Second, there is an increasing focus on the
Total Cost of Ownership (TCO) of lighting. Manufacturers can market their products by pushing the message about
LED’s lower total costs, and as LED prices continue to fall, that TCO calculation will become an even stronger selling
point (Sanderson, Simons, Walls, & Lai, 2008; Candelon, Creyghton, Hong, Rubel, & Smits, 2015; Almeida, Santos, Paolo,
& Quicheron, 2014).
The light emitting diode (LED) was first commercialized in the 1960s and is now poised to replace conventional lighting.
Hundreds of companies worldwide are participating in the LED market. Major outdoor area and commercial retrofit
adoptions are taking place. The larger lighting companies have introduced LED products and design approaches for LED
fixtures and light engines are becoming more sophisticated. Therefore, the $ 112 billion global lighting market is
undergoing a rapid transformation driven by the growing adoption of Light Emitting Diode (LED) technology. This trend
is fundamentally altering the underlying economics and dynamics of the market. As a result, new sources of
competitive advantage are emerging, requiring players to revamp their strategies across the lighting value chain
(Sanderson, Simons, Walls, & Lai, 2008; Candelon, Creyghton, Hong, Rubel, & Smits, 2015; Baumgartner, Wunderlich,
Wee, & Jaunich, 2012).
The shift towards light-emitting-diode (LED) lighting is further helping the adoption of connected lighting systems.
These trends, which reinforce one another, are fundamentally altering the dynamics of the lighting market. Existing
players are scrambling to adapt while new players—such as manufacturers in Asia and companies that market
privatelabel products—are entering the fray. Attractive new product markets are emerging. The result: companies
across the complex lighting ecosystem must evaluate where they can compete effectively amid the changes and adopt
new strategies to win in the future (Sanderson, Simons, Walls, & Lai, 2008; Craninx, 2017; Pust, Schmidt, & Schnick,
2015).

8
1.2 Problem description
The conventional lighting industry had entry barriers in terms of technical know-how, economy of scale advantages
and product quality whereas the LED technology has allowed new players from the semiconductor and consumer
electronics segments to enter the general lighting market with LED products. While demand for replacement lamps
has accounted for significant growth of conventional lighting thus far, that market is dwindling as fewer replacements
are needed given LEDs’ longer life span. Therefore, the lighting industry structure is rapidly changing due to a disruptive
technological innovation in the form of LEDs. From being dominated by few firms, today’s lighting industry has become
highly competitive with a large number of firms fighting to become the market leader. In this situation, accurately
understanding the dynamics of lighting industry becomes very important and challenging. Only after a precise
situational analysis, a firm can successfully arrive at their growth strategies.
1.3 Research objective and questions
The goal of this thesis is to identify the dynamics of growth in a competitive and transitioning lighting industry and
arrive at growth strategies for a lighting company. The scope of the research is limited to European market. Having
defined the research objective, the research question is:
How can a firm identify the dynamics of growth in a competitive lighting industry transitioning from conventional
to fully LED based lighting?
To answer the main research question, the following sub-research questions are defined:
1. What is the current state of the lighting industry with respect to European market as it is transitioning from
conventional to LED based lighting?
An analysis using an existing framework is performed to scan today’s lighting industry and identify factors that are
accelerating the transition towards LED based lighting.
2. How to perform a strategic analysis that accurately evaluates the dynamic business environment of a firm?
An internal and external environment analysis of the case company are performed and is followed by a strategic
analysis that combines both to arrive at the determinants for creating a successful growth strategy.
3. After performing the strategic analysis, how can a firm in a transitioning lighting industry arrive at its growth
strategies?
All the possible growth strategies are identified and discussed for its merits and limitations. Also, the most suitable
strategy for the case company is suggested.
1.4 Thesis outline
This report started with an introduction to the topic, a brief on today’s lighting industry, research objective and
questions. In chapter 2, the theoretical framework is established, first the core concepts of the research question are
investigated by analyzing existing literature on business strategy. This results in arriving at a research gap and
concluding the chapter with the conceptual framework of the research. Chapter 3 contains the methodology
description, based on a qualitative, single case study research design. In chapter 4, the results of the research are
discussed thoroughly and determinants for creating a successful growth strategy in LED lighting industry are identified.
Using Atlas.ti 7.0, a dedicated software for qualitative research, relational and conceptual analysis were carried out,
thus enabling a more structured approach. The final chapter entails the discussion of scientific and practical relevance,
outlines the limitations and recommendations and provides the conclusion by answering the main research question.

2. Literature review
An industry is an arbitrary boundary within which firms compete with each other to produce related or similar products.
Almost all firms across all industries are challenged, by the inherent effects of persistent technological developments
as businesses increasingly emphasize the utilization of the latest accessible technologies when conducting business
and competing with each other (Hove & Masocha, 2014). Technology is a force that is leading the redefining of the
competitive spectrum for firms and their interaction with customers. Transformation is instigated by a technological
innovation to which companies, new and existing, respond (Chandy & Tellis, 2000). The varying responses collectively
transform an existing industry or initiate the formation of a new one (Kaplan & Tripsas, 2008). Radical and disruptive
innovations can change the way an industry is organized and cause dominant companies problems or even put them
out of the industry (Srinivasan et al., 2002; Danneels, 2004). In contrast, the development of incremental innovations
is built on the competences of dominant companies and therefore the new entrants have significant problems in trying
to challenge incumbent companies (Henderson & Clark, 1990). Therefore, ability of a firm to recognize and respond to
a technological innovation plays an important role in helping it to make the transition to a new technological regime.
Absorptive capacity is defined as the ability to evaluate, assimilate, and apply outside knowledge to commercial ends.
It enables the firm to respond to technological opportunities and to appropriate the technological knowledge made
available through R&D spill-overs by competitors, and/or firms external to the industry (Cohen & Levinthal, 1989).
Absorptive capacity can be explained in terms of two separate, but interrelated, dimensions of technology strategy:
how the firm acquires outside knowledge (through its external environment analysis), and how it integrates, uses, and
enhances that knowledge {through its internal R&D activities), in order to develop the technological capabilities that
will be needed to respond to changes in the prevailing technological paradigm. While absorptive capacity is a firm
specific, it is the external environment that impacts the development of internal capabilities (Nicholls-Nixon, 1995).
Hence, a thorough and reliable analysis of the external environment becomes very important for a firm when it has to
respond to a technological innovation.
In 1979, Michael Porter published his first article in the Harvard Business Review developing five forces that would help
to determine the long-term profitability of any industry (Porter, 1980). According to Pearce and Robinson (2005) and
Johnson et al. (2002), the strengths of Porter’s model are that it provides one simple approach to analyze industry
structure, identify and determine the attractiveness of an industry, reveal insights on profitability, inform important
decisions about whether to leave or enter industries or sectors, and develop strategic options to improve relative
performance in the industry or influence relative position in the industry. As one of the most influential management
tools for strategic industry analysis, the model has been applied by numerous practitioners and academics
(Karagiannopoulos et al., 2005; Breedveld et al., 2006). For almost three decades, Michael Porter’s five forces
framework has been a powerhouse under the models studied in strategic management. But, in the era of
hypercompetitive and rapidly growing industries and business environments, Porter’s Five Forces model is believed to
be in need of a reshape as it is missing some known actors such as regulators or globalization (Ural, 2014).
The next sections will provide a thorough literature review of Porter’s five forces model followed by the criticisms and
limitations of the model. Then a marketing approach to complement and strengthen the model is suggested. Following
which, the literature review is summarized, research gap is identified, and importance of this research is justified.
2.1 Porter’s five forces model
The Porter’s framework shown in fig. 1, consists of five industry forces: (1) Threat of new entrants (2) Threat of
substitution (3) Bargaining Power of Buyers (4) Bargaining power of suppliers and (5) Rivalry among existing firms. In
general, the firm should find and develop a position in their industry that they can best defend themselves against
competitive forces or influence them in their favour, from which determines whether the firm can achieve competitive
advantage or disadvantage. The weaker those forces are, the easier it is to establish your business in an industry and
strive for increased performance (Porter, 1979).

Figure 1 - Porter’s Five Forces of Competitive Advantage Framework (Porter, 1980)
Porter (1985) also noted that the fundamental basis of outperforming competitors and achieving superior profits in
the long run is referred to as sustainable competitive advantage. Porter also points out that every different industry
will have different challenges concerning the forces and those challenges should be made number one priority if a firm
in order to position the firm to compete with the best in the industry.
2.1.1 Threat of new entrants Firms that have recently entered the market and industry to share the profits enjoyed by already existing firms in the
same market contribute towards the threat of new entrants to any industry (Hellriegel, et al., 2004). New firms to an
industry are driven by profitability of an industry as well survival chances. The threat of new entrants depends on that
industry’s barriers to entry. Porter (1979) distinguishes between six significant barriers to enter the market: (1)
Economic of Scale (2) Product Differentiation, (3) Capital Requirements (4) Cost Disadvantages (5) Access to
Distribution Channels (6) Government Policy. In his 2008 article, Porter extends the barriers of new entrance to supply
side economies of scale, demand-side benefits of scale, customer switching costs, capital requirements, incumbency
advantages independent of size, unequal access to distribution channels and restrictive government policy.
New entrants to an industry bring new capacity, the desire to gain market share, and often substantial resources
(Porter, 1980). The existence of entry barriers limits the number of companies in the industry and therefore influences
the ‘Rivalry among existing competitors’ (Johnson et al., 2008). Furthermore, companies who enter an existing market
directly affect the competitive advantages. The additional supply for the same demand decreases the profit of the
market participants. The lower the barriers to entry are, the higher the threat of new entrants is. The height of barriers
to entry has been found consistently to be the most significant predictor of industry profitability (Rothaermel, 2008).
Also, the technological front accentuates the entry of new competitors and makes it difficult for incumbents to
recognize and react to new competitors (Rodie & Martin, 2001).
Mol, Chiu & Wijnberg (2012) opine that technological impact on industry dynamics is two-thronged. Firstly, new
technologies are identified as competence-enhancing whereby the dominance of incumbents is strengthened. This is
when huge technological investments turn out to create barriers of entry for potential entrants (Louw & Venter, 2010).
Secondly, competence-destroying technologies nullify and mitigate the required economies of scale in an industry,
hence, reducing barriers to entry and ultimately increasing the propensity of newcomers. Firms can be either
incumbents or the potential entrants and as such how technology impacts them depends on their market position.
Unfortunately, technology seems to create exit barriers in the form of sunk costs. This eventually dampens the
profitability of that particular industry and intensifies competition as once a firm has entered an industry, they are
faced with a “do or die” scenario.
2.1.2 The threat of new substitutes A substitute product is a product that serves the same purpose as the traditional and original product of firms in the
market (Louw & Venter, 2010). The threat of substitutes increases where the firm's customers are willing to substitute
the traditional product with a new one, where the new product/service offers relatively more benefits than the

11
traditional one and where there are low switching costs. According to Hubbard and Beamish (2011), there are several
factors that influence the Threat of Substitutes, e.g. switching costs between substitute products/services and industry
product (Klemperer, 1995), or buyers’ addiction to buy substitutes. New technologies result in new products and
services for consumers, improved existing products, better customer services and, often, lower prices; these lure
customers towards switching and substituting the existing products with new ones (Boone & Kurtz, 1992).
According to Porter (2008), substitutes are always present, but they are easy to overlook due to their nature of being
different from industry’s products. If the threat of substitutes is high, industry profitability will be low due to the fact
that substitutes place a limit on prices. An industries growth potential and profitability will be damaged if the industry
does not distance itself from substitutes (Porter, 2008). Porter also mentions that substitutes not only limit profits in
normal times, but they also reduce the bonanza an industry can reap in good times (Porter, 2008). Hence the threat of
substitute is high if the substitute offers an attractive price-performance trade-off to the industry’s product. Also, the
buyer’s switching costs to the substitute should be low (Porter, 2008). The substitutes have similar purpose as the
original products but can limit the potential returns of that industry by placing a ceiling on the prices that firms in the
industry can profitably charge (Porter, 1980).
2.1.3 Rivalry among existing firms Competitive rivals are firms with similar products and services which are aimed at the same customer group (Louw &
Venter, 2010). This is the most obvious and immediate source of competition. Industry competition intensifies when a
market is composed of numerous and almost balanced competing firms. Notably, competitors utilise strategies such
as price-cutting, improved service delivery and quality (Hellriegel et al., 2004). New technology causes firms to face
more difficulties in upholding proprietary offerings. This reduces differentiation and strengthens the rivalry which
exists among these firms, hence, intensifying the overall industry competition (Porter, 2001). A high level of rivalry
between existing competitors can influence the profitability of an industry. It depends on the intensity with which
companies compete and, second, on the basis on which they compete (Porter, 2008).
This force can be influenced by industry growth rate, fixed costs/ storage costs, number of firms/ competitor balance,
switching costs between competitors, differentiation, or exit barriers (Hubbard & Beamish, 2011; Slater & Olson, 2002;
Johnson et al., 2008). The intensity and the basis that competitors compete on sum the degree of the rivalry. The
rivalry between competitors is high when competitors are big in numbers and share the similar size and power. Also,
if the industry growth is slow, it will cause arguments and challenges to capture market share. Rivalry between
competitors is also big if exit barriers out of the industry are high. In addition, rivals that are very committed to their
business and gaining competitive advantage through good leadership will want to compete against others. At last,
firms that are not familiar with each other will also cause great rivalry (Porter, 2008).
2.1.4 The bargaining power of buyers The bargaining power of buyers refers to the ability of buyers/customers to force down the prices of the firm's products
and services (Hellriegel et al., 2004). If the buyers have a high market power, they are able to push prices downward,
prevail better quality or they can force expanded services. These also reduce the profitability of the industry. The
bargaining power of buyer is high if the buyers are large, they are ably to switch easily to another supplier and they
are few in numbers (Slater & Olson, 2002). In addition, competition increases in an industry where customers threaten
to integrate backwards (Hollensen, 2003).
Technology provides a customer with a wider choice of channels through which to connect with a brand; this intensifies
the switching and mobility of customers, thereby boosting buyers’ bargaining power (Porter, 2001; Kotler & Keller,
2006; Baker & Bass, 2003). Therefore, the power of buyers is the exercise of pushing down prices, wanting better
quality and service and letting suppliers compete against each other for the job. This way the buyer will try to capture
more value while probably paying one of the lowest if not the lowest price for good quality. In this matter suppliers
are dependent on the buyer and the buyer takes advantage of his position by applying price pressures to suppliers.
The power of customers can be described as the “flip side of powerful suppliers” (Porter, 2008).

12
2.1.5 The bargaining power of suppliers The bargaining power of suppliers refers to the ability of suppliers to force up the prices of the inputs of firms in the
industry (Hellriegel et al., 2004). The bargaining power of suppliers tends to be higher when the suppliers are
concentrated or when they contribute to the larger component of the products that are bought by customers. Thus,
suppliers can bargain for higher prices and thus reduce the profitability of the firms (Jain, 1997). Competition from
suppliers is also increased when suppliers threaten to integrate forward (Malcolm & Martin, 2003). New technology,
which results in reduced barriers to entry, results in an increase in competitors as suppliers integrate forward.
Ultimately, this tends to shift the bargaining power to suppliers, hence increasing competition (Porter, 2001).
Powerful suppliers can thereby squeeze profitability out of an industry unable to recover cost increases in its own
prices (Porter, 1979). There are different factors which are determined as indicators for high bargaining power of
suppliers: For example, the industry is dominated by a few companies and is therefore more concentrated than the
industry it sells to, or the industry is not the most important customer of the supplier group (Porter, 1979). The
Bargaining Power of Suppliers can be influenced by the size of the supplier, the number of suppliers, and the availability
of alternative customers (Slater & Olson, 2002). The power of suppliers can have an impact on profitability of an
industry by raising costs or reducing the quality of purchased good and services (Porter, 1979).
2.2 Limitations and Criticisms of the five forces model
Although the five forces model is one of the most known and widely spread management models in practice, the
criticism became increasingly severe (O'shaughnessy, 1984; Dulčić, Gnjidić & Alfirević, 2012). One of the first criticisms
is the fact that Porter (1979) has no justification for the choice of the five environmental forces, which prove the validity
of his choice (O'shaughnessy, 1984). A further criticism is that the model only generates snap-shots. Dulčić et al. (2012)
are extremely critical in regard to the use of five forces model. In their opinion, taking the dimension ‘time’ into account
is beneficial for managers as they will be better able to consider market trends and changing environment. In addition,
Grundy (2006) notes that the framework doesn’t refer to the ‘PEST’ factors or to the ‘dynamics of growth’ for a certain
industry or market.
According to Johnson et al. (2008), Porter’s Five Forces framework is relevant to the majority of organisations and the
industry analysis can offer the basis for developing a strategy. The framework adapted traditional supply-demand
analyses to include rivals (Karagiannopoulos et al., 2005), which allows organisations to prepare for a stronger strategic
position (Dalken, 2014). However, Williams (2011) has identified a limitation of Porter’s Five Forces, being that the
model assumes perfect competition. In the contemporary market where there is demand for unique and highly
differentiated products, there is a large number of monopolistic industries; for companies that dominate the majority
of the industry, an industry analysis tool such as Porter’s Five Forces may not be relevant. Furthermore, making use of
the five forces model does not guarantee a competitive advantage that is inviolable and sustained (Aktouf, 2004). The
reason for this again lies in the fact that five forces framework is a static model, which does not include the changing
competitive environment (Karagiannopoulos et al., 2005).
The Five Forces model does not assess the resources and capabilities of a company, which are also relevant for
analyzing the overall profitability (Rivard, Raymond & Verreault, 2006). According to Spanos et al. (2001), the firm’s
unique resources should be the catalyzer to define the essence of strategy. Pfeffer et al. (1999) and Aktouf et al. (2005)
go further by mentioning intrinsic and intangible factors namely leadership, management, reputation, compensation,
selective hiring, people, employment security, teams, information transparency, culture, morale, training,
empowerment and communication that are not considered in Porter’s Five Forces framework. Furthermore, many
managers have lost focus as they are too busy concentrating on the external forces rather than the internal forces that
play an important role in achieving competitive advantage (Pfeffer et al., 1999). Aktouf et al. (2005) go on to criticize
the model as not guaranteeing a competitive advantage. The framework that is rather a prescription than a dynamic
model is not helpful to businesses in terms of improving their shaky market/industry position. Likewise, Srisvastava et
al. (2012) argues that Porter’s framework is not a dynamic analysis and does not really open up on how the industry
participants actually interact with each other in quickly changing industries.

13
According to Hill and Jones (2008), industry factors are able to justify business performance variations. Those factors
can only motivate 20 percent of the variations in terms of market share, growth and industry profitability (Grant, 2011).
Today’s goal is not only to protect against the five forces, it becomes more and more important to start collaboration
and maintain innovation due to the increasing power of the Internet and other information technologies
(Karagiannopoulos et al., 2005; Holm, Eriksson & Johanson, 1996). Wang and Chang (2009) argue that the zero-sum
game approach is short term and ignores the long-term benefits of a constructive win-win strategy through
relationships with all or most of the stakeholders like strong mutual relationship with suppliers and buyers can make
the firm enjoy the Just In Time philosophy (JIT), thus saving on storage costs. It has also been noted that power
showdowns to competitors may sometimes boomerang on the firm and heavily impact on the firm cost-wise, and that
by cooperating with the stakeholders, the banks in an industry can become least-cost producers.
Grundy (2006) argues that the most prevalent criticism of Porter’s framework is its static nature; that it only considers
the current environment and doesn’t anticipate changes in the industry which diminishes its efficacy. It is important to
take this into consideration due to the turbulence of the competitive environment – the question becomes whether
one must defend themselves against the forces or to create a product innovative enough to expand the industry
(Karagiannopoulos et al., 2005). Porter’s Five Forces is primarily a tool for analyzing the competition within an industry.
However, it fails to acknowledge the existence of complementary companies as well as competitors, and some
strategists believe that complementors should be added as a sixth force (Johnson et al 2013). The model ignores the
pivotal role of complements by focusing on industry and group structures rather than individual companies
(Brandenburg and Nalebuff, 1995) and innovation creates change in industry structures, thus, altering the competitive
environment and that the industry structure alone cannot fully explain the performance differences between industry
competitors (Moriarty, 1983).
In the modern era of globalization, the dynamic business environment causes industry boundaries to merge, therefore
defining and analyzing one specific industry becomes challenging (Johnson et al., 2013; Grundy 2006). These
converging industries are comprised of many different markets and segments; therefore, the five forces must be
conducted at different levels in order to understand the whole industry; however, having to complete multiple analyses
is a limitation of the model. The business environment is divided into three layers – the macro-environment, the
industry and competitors. Porter’s Five Forces is a framework for analyzing the industry alone; therefore, it might be
worthwhile conducting complementary analyses for other layers of the business environment, such as a PESTEL
analysis for the macro-environment. Grundy (2006) believes that these strategic tools are interdependent, and a
combination would allow for a wider and more accurate analysis of the business environment.
To summarize, Porter’s five forces framework is criticized as a static model that does not: include the changing
competitive environment, assess the resources and capabilities of a firm, and provide insights on how the industry
participants interact with each other in transitioning industries. Therefore, through combining five forces model with
various other relevant strategic tools, these limitations can be addressed, and a holistic industry analysis can be made
possible. In this context, it is also important especially for firms in dynamic industries to utilize a marketing strategy
that not only protects against the five forces but promotes starting and maintaining stakeholder relationships and
inter-firm collaborations due to the increasing power of the Internet and other information technologies
(Karagiannopoulos et al., 2005; Holm, Eriksson & Johanson, 1996).
2.3 Relationship marketing and its relevance in hypercompetitive and rapidly growing industries
The marketing mix management paradigm has dominated marketing thought, research and practice since it was
introduced. Marketing, the way most textbooks treat it today, was introduced around 1960. The concept of the
marketing mix and the Four Ps of marketing – product, price, place and promotion – entered the marketing textbooks
at that time (McCarthy, 1960). Eventually the Four Ps of the marketing mix became an indisputable paradigm in
academic research, the validity of which was taken for granted (Grönroos, 1989). The paradigm began to lose its
position and new approaches have been emerging in marketing research. The globalization of business and the
evolving recognition of the importance of customer retention and market economies and of customer relationship
economics, among other trends, reinforced the change in mainstream marketing (Grönroos, 1992 and Sheth et al.,
14
1998). Relationship building and management, or what has been labelled relationship marketing, is one leading new
approach to marketing which eventually has entered the marketing literature (Grönroos, 1992; Gummesson, 1987 and
Blomqvist et. al, 1993).
In response to the constraints imposed by the globalization of markets, firms and their marketing function have
become more international, and recognized a growing need to focus on their core businesses, outsourcing activities
and contractual relationships, so as to manage their inputs and distribute their outputs efficiently. Real networks are
being developed, focusing on relationships, and continuous and sustainable development (Heide & Miner, 1992; Hertz
& Mattsson, 2001; Noonan, 1999; Webster Jr., 1992). Cooperation and collaboration networks can be vertical, between
players at technologically distinct stages or horizontal, involving competitors or even firms supplying complementary
products to the same target-market (Gemunden & Ritter, 1997; Gulati, 1998). The research of Wang and Chang (2009)
further strengthens the need for this approach by suggesting that a constructive win-win strategy through relationships
with all or most of the stakeholders is important in today’s dynamic industries. Further, this approach is extremely
important in an industrial setting which is different from consumer marketing in a number of aspects like the formalized
decision-making procedures, the buying practices and rationality of choices and the special character of the industrial
customer (Alexander et al., 1961; Kotler, 1984; Wind and Webster, 1972; Fern and Brown, 1984).
An interest in turning anonymous masses of potential and existing customers into interactive relationships with well-
defined customers is becoming increasingly important (McKenna, 1991; Rapp et al., 1990 and Clancy, 1991). The
interaction and network approach of industrial marketing and modern service marketing approaches, especially the
one by the Nordic School, clearly views marketing as an interactive process in a social context where relationship
building, and management are a vital cornerstone (Bagozzi, 1975 and Webster, 1992). They are in some respects clearly
related to the systems-based approaches to marketing of the 1950s (Fisk, 1967). The marketing mix management
paradigm with its Four Ps, on the other hand, is a much more clinical approach, which makes the seller the active part
and the buyer and consumer passive. No personalized relationship with the producer and marketer of a product is
supposed to exist, other than with professional sales representatives in some cases. This, latter view of marketing does
not fit the dynamic industries. Thus, the concept of relationship marketing emerged within the fields of service
marketing and industrial marketing (Gummesson, 1991; Grönroos, 1990; Jackson, 1985 and Berry, 1983). Grönroos
defines relationship marketing in the following way: Marketing is to establish, maintain, and enhance relationships
with customers and other partners, at a profit, so that the objectives of the parties involved are met. This is achieved
by a mutual exchange and fulfilment of promises (Grönroos, 1990).
Such relationships are usually but not necessarily always long-term. Establishing a relationship, for example with a
customer, can be divided into two parts: to attract the customer and to build the relationship with that customer so
that the economic goals of that relationship are achieved. An integral element of the relationship marketing approach
is the promise concept which has been strongly emphasized by Calonius (1988). According to him, the responsibilities
of marketing do not only, or predominantly, include giving promises and thus persuading customers as passive
counterparts in the marketplace to act in a given way. Calonius also stresses the fact that promises are mutually given
and fulfilled. Therefore, a firm occupies itself with giving promises can temporarily attract new customers and build
relationships initially. However, if promises are not kept, the evolving relationship cannot be maintained and enhanced.
Fulfilling promises that have been given is equally important as a means of achieving customer satisfaction, retention
of the customer base, and long-term profitability (Reichheld et al., 1990).
Another key element in marketing is trust (Grönroos, 1994). Moorman et al. (1993) defines trust as “...a willingness to
rely on an exchange partner in whom one has confidence”. This definition means, first of all, that there has to be a
belief in the other partner’s trustworthiness that results from the expertise, reliability or intentionality of that partner.
Second, it views trust as a behavioural intention or behaviour that reflects reliance on the other partner and involves
uncertainty and vulnerability on the part of the trustor. If there is no vulnerability and uncertainty, trust is unnecessary,
because the trustor can control the other partner’s actions (Zaltman et al., 1988). Trust is an important part of
relationship marketing. Kotler (1992) concludes that “companies must move from a short-term transaction-oriented
goal to a long-term relationship-building goal”. Webster (1992), comes to a similar conclusion: “There has been a shift
15
from a transactions to a relationship focus”, and “from an academic or theoretical perspective, the relatively narrow
conceptualization of marketing as a profit maximization problem, focused on market transactions or series of
transactions, seems increasingly out of touch with an emphasis on long-term customer relationships and the formation
and management of strategic alliances”.
Because of the lack of personal contacts with their customers and their focus on mass markets, firms pursuing a
transaction-type strategy will probably benefit most from a traditional marketing mix approach. For a firm applying a
relationship strategy, the marketing mix often becomes too restrictive. The most important customer contacts from a
marketing success point of view are the ones outside the realm of the marketing mix. In transaction marketing, there
is not much more than the core product, and sometimes the image of the firm or its brands can keep the customer
attached to the seller. When a competitor introduces a similar product, which is quite easily done in most markets
today, advertising and image may help in keeping the customers, at least for some time, but price usually becomes an
issue. A firm that offers a lower price or better terms is a dangerous competitor, because in transaction marketing the
price sensitivity of customers is often high. A firm pursuing a relationship marketing strategy, on the other hand, has
created more value for its customers than that which is provided by the core product alone. Such a firm develops over
time more and tighter ties with its customers. Such ties may, for example, be technological, knowledge-related or
information-related, or social in nature. Of course, price is not unimportant but is often much less an issue here. Thus,
relationship marketing makes customers less price sensitive (Grönroos, 1994).
Value is considered to be an important constituent of relationship marketing and the ability of a company to provide
superior value to its customers is regarded as one of the most successful competitive strategies. This ability has become
a means of differentiation and a key to the riddle of how to find a sustainable competitive advantage (Christopher et
al., 1991; Grönroos, 1994; Heskett et al., 1994; McKenna, 1991). By adding more value to the core product (the product
quality is improved, supporting services are included into the offering, etc.) companies try to improve customer
satisfaction so that the bonds are strengthened, and customer loyalty thereby achieved. Firm’s offering should be seen
as a “value carrier” and in order to achieve a sustainable competitive advantage the firm must provide an offering
which the customers perceive offers a greater net-value than the offerings of the competitors. An interesting issue
from a relationship marketing perspective, however, is how the product or the offering is to be defined.
The traditional approaches describing the firm’s total offering or augmented product (Grönroos, 1990; Levitt, 1983) as
a core product supported by surrounding services or goods consider only one episode regarding the customer. The
relational aspect as a constituent of the offering is not taken into account. The value of having a relationship, e.g. the
value of commitment from both parties, in our opinion also needs to be taken into account when analysing the offering
provided and the manner in which it influences the customer’s perception of the value. The importance of developing
relationships in building effective marketing strategies has been emphasized by researchers and practitioners in the
field of marketing (Webster, 1992; Parvatiyar et al., 1992; Grönroos, 1994). Considering, today´s dynamic business
setting, they call for a change from the dominating marketing management school epitomized by McCarthy’s (1960)
4P model and Kotler’s (1988) “analysis, planning and control” approach and referred to as transaction marketing (TM),
to the relationship marketing (RM) model.
2.4 Research gap
Porter’s five forces framework is criticized as a static model that does not include the changing competitive
environment, assess the resources and capabilities of a firm, and provide insights on how the industry participants
interact with each other in transitioning industries. Grundy (2006), in his article “Rethinking and reinventing Michael
Porter’s five forces model”, emphasizes that Porter’s work tends to over-stress macro analysis at the industry level
instead of the analysis of more specific product-market segments at micro level. He also mentions that the framework
appears to be self-contained and does not really take into consideration political, economic, social and technological
factors and the dynamics of growth in particular markets. Finally, Grundy suggested that a using a combination of
strategic tools that are interdependent would allow for a wider and more accurate analysis of a firm’s dynamic business
environment. Through combining five forces model with various other relevant strategic tools, a holistic industry
analysis can be made possible but very little literature is available on this (Williams and Figueiredo, 2011). Therefore,
16
this research addresses this scientific gap where PESTEL (Political, Economic, Social, Technological, Environmental and
Legal), Organizational and SWOT analyses are combined with Porter’s five forces model to accurately analyse the
dynamic lighting industry transitioning from conventional to fully LED based lighting.
2.5 Conclusion
An overview of the theoretical framework used in this research is given in the below table:
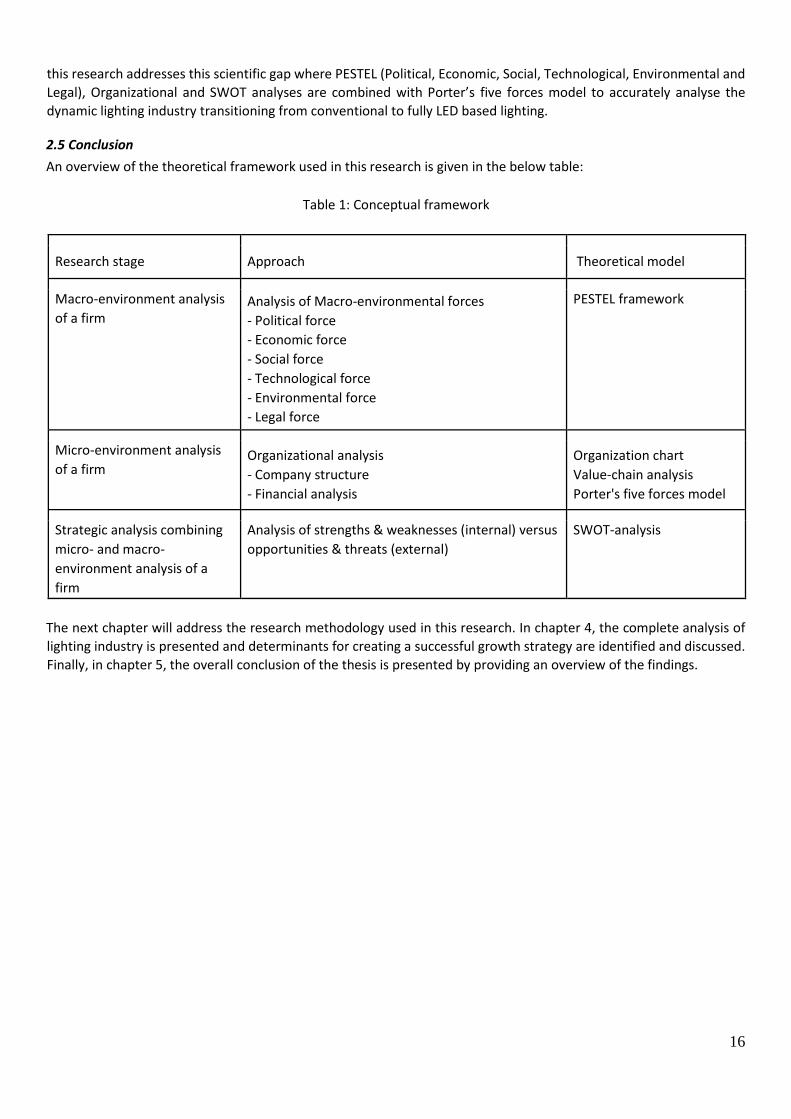
Table 1: Conceptual framework
Research stage Approach Theoretical model
Macro-environment analysis
of a firm Analysis of Macro-environmental forces
- Political force
- Economic force
- Social force
- Technological force
- Environmental force
- Legal force
PESTEL framework
Micro-environment analysis
of a firm Organizational analysis
- Company structure
- Financial analysis
Organization chart
Value-chain analysis
Porter's five forces model
Strategic analysis combining
micro- and macro-
environment analysis of a
firm
Analysis of strengths & weaknesses (internal) versus
opportunities & threats (external)
SWOT-analysis
The next chapter will address the research methodology used in this research. In chapter 4, the complete analysis of
lighting industry is presented and determinants for creating a successful growth strategy are identified and discussed.
Finally, in chapter 5, the overall conclusion of the thesis is presented by providing an overview of the findings.

3. Methodology This chapter describes the research methodology used for the research project, including data collection tools.
Furthermore, it elaborates on the details of the case study research design. The research design follows the theoretical
framework that was proposed in chapter 2. This research design was chosen because of its empirical nature and since
it was based on in-depth qualitative research. Furthermore, the research design facilitated the possibility of data
collection within the context, balancing the data available and realization of the research objectives both theoretical
and practical (Bryman, 2012). The case study research design is elaborated upon in Section 3.2. The same section also
introduces the data collection plan, followed by case study protocol in Section 3.3 and data analysis strategy in Section
3.4. The chapter ends with research quality considerations in Section 3.5.
3.1 Research strategy
The aim of a research design is to describe and analyse methods used, hence clarify their presuppositions and
consequences, and highlight their limitations (Leedy, 1993). The nature of the research problem (as discussed in section
1.2) typically suits a qualitative research approach because the latter allows for in-depth probing of issues and greater
detail in responses (Denzin and Lincoln, 1994) and can gain in-depth and holistic insights into a process or object that
is confined to a particular context (Verschuren & Doorewaard, 2010). Further, it allows for interaction between group
members in focus group interviews, which often stimulates discussion and uncovers issues unanticipated by the
researcher (Dixon et al., 1988; Hussey and Hussey, 1997). To enhance the validity and reliability of the research it is
important to be aware of the limitations of qualitative research, which are related to: subjectivity, difficulty to replicate,
problems of generalization and the lack of transparency (Bryman, 2012; Yin, 2009). In this research design, these
limitations were considered and minimized as much as possible by using a protocol.
As discussed in Section 1.3, the main research question is concerned with how a firm can identify the dynamics of
growth in a competitive lighting industry transitioning towards a disruptive technology because very little literature is
available on how it can be done, underpinning that research on this topic would be of great added value.
Methodologically, the how question refers to understanding of how strategic analysis of a company and its market
position can help to increase its market share. This study can be further categorized as exploratory research for the
same reason, as the concept of arriving at strategies to increase market share based on analysis of both internal and
external analysis and market position has attracted little attention thus far. Based on the qualitative approach, a
matching research design was defined. The research design selected is a single case study, as it allows for measuring
contemporary phenomena in its usual context. The single case study is typically used to answer research questions
concerned with how and why (Yin, 2009). Section 1.1 already stated that the objective of this research is in proposing
strategies to a company to help increase its market share in European market. By analysing external and internal
Figure 2 – Research Framework

18
environment, and market position, determinants for successful strategy are identified and subsequently used to make
recommendations. Finally, the activities involved in this research are displayed in fig. 2.
3.1.1 Desk research
To start the research, an initial literature review was carried out to build the theoretical framework. In order to fulfil
the research objective of the study, the Business Unit Strategic-Planning Process of Kotler (2003) was chosen as a basis.
For the purpose of this study, focus was on situational (external and internal environment) analysis, goal formulation
and strategy formulation. Only this way a company can responsibly choose the best matching strategies among all
those theoretically available. The internal environment analysis in this study was carried out using organizational
analysis and Porter’s value-chain analysis (Porter, 1985). The former is often used to analyse the structure of the
organization whereas the latter is used to identify the strong and weak points of the company in terms of its primary
and support activities. Both these analyses are performed through desk research using secondary data.
The external environment analysis in this study was carried using PESTEL framework. The PESTEL framework refers to
the political, economic, social, technological, environmental and legal factors influencing the environment in which a
firm must operate (Day, 1990; Sanchez and Heene, 1997; Gay, 2002; Hopkinson, 1993; Mayer-Wittman, 1989). This
framework was chosen for this study as it allows identification of the environment within which the company operates
and provides data and information that will enable the company to predict situations and circumstances that it might
encounter in future. The outcome of the PESTEL analysis provided the basics for the SWOT (Strengths, Weaknesses,
Opportunities, Threats) analysis, mainly in its opportunities and threats. After carrying out the situational analysis, the
results of the separate previous analyses were synthesized in a strategic analysis. For this a SWOT-analysis were used.
This analysis is mentioned by several authors as an instrument for the overall evaluation of a company’s strengths,
weaknesses, opportunities and threats. The Strengths (S) and Weaknesses (W) are measured by the internal analysis,
while the Opportunities (O) and Threats (T) are measured by the external analysis (Blythe, 2006; Kotler, 2003; Zikmund
&d’Amico, 1996).
In the coming sections, PESTEL framework will first be discussed. This model divides the macro environmental forces
into the following six categories: Political, Economic, Social, Technological, Environmental and Legal. Each of these
categories will be discussed in detail. In the next section, all the four dimensions (Strengths, Weaknesses,
Opportunities, Threats) of SWOT analysis will be introduced and explained in-depth. By performing PESTEL and SWOT
analysis sequentially, influence of a firm’s external and internal environment on its business can be evaluated.
3.1.2 PESTEL framework
Environmental analysis is important for developing a sustainable competitive advantage; identifying opportunities and
threats; and providing opportunities for productive co-operation with other companies. A review of the literature
reveals that different approaches and techniques were used for the analysis of macro environment (Lynch, 2009). The
framework used in this study is PESTEL analysis. PESTEL analysis has different definitions within the literature, such as
PEST (Dare, 2006) and STEPE (Richardson, 2006). The original form of PESTEL was first conceived by Aguilar as ETPS
(economic, technical, political, and social). This was subsequently reorganized as STEP for the Arnold Brown Institute
of Life Insurance for use in strategic evaluation of trends. In was later modified to address macro analysis of the external
environment or scanning for environmental change and was defined as STEPE. In the 1980s, the legal dimension was
added to this approach (Richardson, 2006). Apart from a technique for strategic analysis, PESTEL analysis began to be
used in different fields (Katko, 2006; Richardson, 2006; Shilei & Yong, 2009).
The PESTEL framework seeks to evaluate how these external forces affect the firm. Furthermore, it assists companies
in the selection of attractive markets and the appropriate entry mode. Hence, countries are often compared along the
dimensions that are identified in the PESTEL framework before the industry-specific conditions are evaluated. As the
macro-environmental forces changes over time, it is important to understand the key drivers of change and the impact
they have on particular industries, markets and companies. The key drivers of change will be different according to
various industries and also vary from nation to nation. Hence, this framework is used to analyze the current and future
impact of environmental factors, which may be different from their past impact.
19
Political environment
The political environment, in which a firm operates, has a major impact on its operations and profitability, and is mainly
influenced by the political forces in an industry or country. The political forces refer to political trends, governmental
policies and interventions, and political risks (O’ Conor, 2000). Governmental policies and regulations on taxation and
foreign trade affect companies by offering incentives for foreign investments, or on the other hand, disincentives to
engage in foreign production (Johnson et al., 2005). Also, the political stability and type of government are political
factors that determine the attractiveness of a particular market. Hence, the choice of entry mode is dependent on
whether the foreign market’s economy is a market economy or a centrally planned socialist economy (Root, 1998).
Political and social events that can have an impact on the security and profitability of a firm are considered to be
political risks. It is important that a firm is aware of the degree of political risks in a country before entering. Key types
of political risks include (Johnson et al., 2005):
- Sovereign risks which arise from the policies and decisions of host governments, including changes in tax laws,
restrictions on expatriate employment and regulations on foreign trade.
- The lack of consistent legislation and effective polices, which can lead to corruption and contractual and
financial difficulties for companies in operation.
- International risks that are linked to developments in the international political economy.
- Security risks relating to wars, civil unrest, violence and crime, diplomatic relations, trade treaties and
economic sanctions.
Economic environment
The economic environment has a significant impact on a company’s activities in the market place and the size of a
potential market both at the local and international level. The fluctuation of a country’s currency, as well as interest
and inflations rates can considerably affect a company’s revenues (Johnson et al., 2005). Moreover, GDP figures,
unemployment rates, labour cost, stock market values and business cycles are other examples of economic forces (O’
Conor, 2000). The size of the economy measured in terms of its gross domestic product per capita (GDP), is an
important determinant for firms to calculate the potential size of a market. Moreover, the GDP of a country also
influences the choice of entry mode, as smaller market favours entry modes that need low sales volumes to breakeven
and demands a low degree of control. This is also the case when a company only focusses on a smaller segment of a
larger market (Root, 1998).
Another economic factor to consider is the population’s disposable income as it influences a firm’s strategic decisions
on whether or not the potential customers will have the purchasing power to buy the firm’s product offerings (Johnson
et al., 2005). Moreover, in order to successfully compete on the local market, it is important to establish good
relationships with local distribution channels and suppliers. This is particularly important, when the total sales are too
low to justify a separate distribution channel. Other issues to consider for a company going global are the need for
local sales people and services, adjustment of prices and products to fit local needs, as well as transportation time and
costs. Transportation costs can be very high if the product needs to be delivered in a short time or if the product is of
great value and requires special delivery methods (Porter, 1998).
Social environment
Social forces can be defined as the ways in which businesses are influenced by changes in society. Even tough, most
social forces can also be classified either as political or economic, in the PESTEL framework they mostly relate to the
cultural forces of an environment. A first important social force is the cultural distance between the home and host
country of a firm and refers to the differences in cultural norms, values, language, and religion. This will affect whether
a firm will enter a particular market and also how they will enter (Johnson et al., 2005). The impacts of cultural forces
have previously been underestimated, however more and more firms understand the importance of considering
cultural differences when operating in foreign markets (Hill, 2008). Due to changes in lifestyles and differences in
consumer preferences across countries, companies might have to adapt their products and services accordingly
(Johnson et al., 2005).
Consumer lifestyles are an accepted basis for market segmentation. In consumer behaviour, lifestyles reflect different
modes of living and the patterns of consumption that tend to accompany them. As lifestyles offer more comprehensive

20
view of behaviour and the motives that underlie many of the purchases made by the consumers, they are regarded as
advantageous for market segmentation (Todd, Lawson and Faris, 1996). Many academia and marketers use the lifestyle
concept to identify existing or potential customers and to understand their decision making process (Hawkins et al.,
2004; Senauer et al., 1991) because the concept is deeply connected to consumerism (Chaney, 1996) and helps to
account for how people express their identity in many areas such as activities, interests, and opinions (AIO) (Wells &
Tigert, 1971).
Since its early introduction by Lazer in 1963, consumer lifestyle analysis information has become a very popular tool in
marketing management decision making. Segmentation using attitudinal and behavioural measures as bases was the
most popular segmentation development in 1990s (Piirto, 1990). Within this approach, consumers who hold similar
beliefs, attitudes or preferences within a particular category are grouped together (Honkanen et al, 2004). Market
researchers use psychographics to describe a consumer segment so as to help an organization better reach and
understand its customers. Thus, a study of relationship between consumer demographics and values and life-styles is
likely to provide marketing managers with valuable visions for marketing segmentation, value creation, product
positioning/re-positioning, and promotional decisions.
Technological environment
The infrastructure of national markets also is an important factor in assessing the attractiveness of markets.
Infrastructure refers to the availability of roads, electricity, telecommunications, railroads, water supply, and so on.
The availability of roads and railroads for instance, determines the choice of entry mode, as high transportation costs
make it difficult for exported products to compete with the local products. This is especially the case for logistics and
supply chain companies with large geographical distances between the two countries in trade. Infrastructure is mainly
funded through governmental investments; however, there is today an increasing trend towards privatization of
infrastructure throughout the world. Generally, national markets with good existing infrastructure are more attractive
for firms. Moreover, the availability of necessary local resources such as appropriately skilled labour and technology
are key factors in deciding what markets to enter and entry modes to pursue. The availability of new and emerging
technology depends on governments´ spending on R&D and focus on technological efforts (Johnson et al., 2005).
Environmental environment
Environmental issues refer to the matters related to environmental protection laws, waste disposal, energy
consumption and emission of greenhouses gases. In recent years environmental governance has become increasingly
important and huge resources are put in place to ensure effective and efficient environmental control. More and more
companies adapt environmentally friendly practices and try to act in a manner which is sustainable for the
environment. This applies however mainly to producing companies. Moreover, customers are demanding that
companies use environmentally friendly packaging and invest in energy saving transportation methods. Consequently,
it is important for a firm to consider the governmental regulations concerning environmental issues before entering a
new market (Johnson et al., 2005).
Legal environment
Legal forces refer to governmental regulations and policies that affect the entry of foreign companies. Examples of
legal forces can be restrictive import policies such as tariffs, quotas and other trade barriers. The purpose of tariffs is
to protect a country’s own production from foreign companies by making the foreign products more expensive.
Quotas, on the other hand, are restrictions in quantities of a certain product that are allowed to be exported to a
country and this puts a limit on the amount of products a firm can sell abroad (Porter, 1998). Hence, these barriers to
trade are important factors in a firm’s decision on whether to produce locally or to export. Furthermore, a company
entering a foreign market has to consider the local competition law, the employment law, consumer protection laws
as well as environmental laws and health and safety restrictions. Local competition laws can obstruct the entry of
companies with monopoly power or prevent anti-competitive behaviour among existing companies. Moreover,
employment laws can favour the employment of local workers, and consumer protection laws can force companies to
modify their product according to the local markets (Johnson et al., 2005).
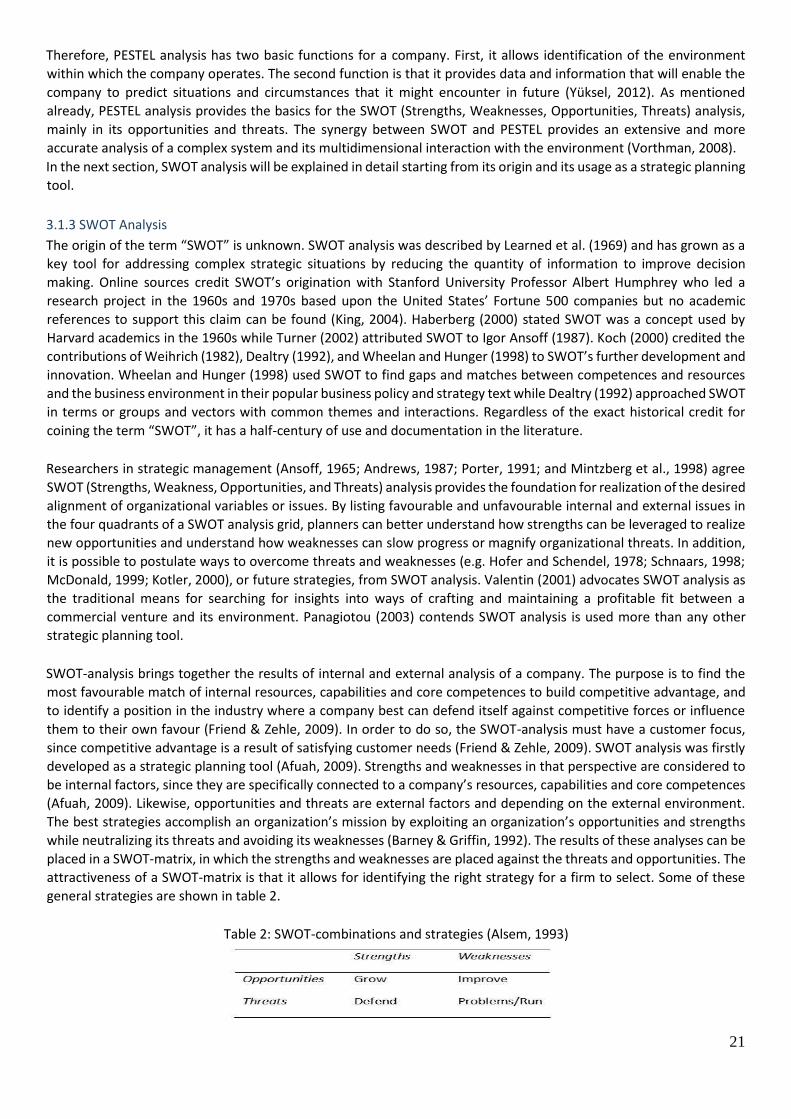
21
Therefore, PESTEL analysis has two basic functions for a company. First, it allows identification of the environment
within which the company operates. The second function is that it provides data and information that will enable the
company to predict situations and circumstances that it might encounter in future (Yüksel, 2012). As mentioned
already, PESTEL analysis provides the basics for the SWOT (Strengths, Weaknesses, Opportunities, Threats) analysis,
mainly in its opportunities and threats. The synergy between SWOT and PESTEL provides an extensive and more
accurate analysis of a complex system and its multidimensional interaction with the environment (Vorthman, 2008).
In the next section, SWOT analysis will be explained in detail starting from its origin and its usage as a strategic planning
tool.
3.1.3 SWOT Analysis
The origin of the term “SWOT” is unknown. SWOT analysis was described by Learned et al. (1969) and has grown as a
key tool for addressing complex strategic situations by reducing the quantity of information to improve decision
making. Online sources credit SWOT’s origination with Stanford University Professor Albert Humphrey who led a
research project in the 1960s and 1970s based upon the United States’ Fortune 500 companies but no academic
references to support this claim can be found (King, 2004). Haberberg (2000) stated SWOT was a concept used by
Harvard academics in the 1960s while Turner (2002) attributed SWOT to Igor Ansoff (1987). Koch (2000) credited the
contributions of Weihrich (1982), Dealtry (1992), and Wheelan and Hunger (1998) to SWOT’s further development and
innovation. Wheelan and Hunger (1998) used SWOT to find gaps and matches between competences and resources
and the business environment in their popular business policy and strategy text while Dealtry (1992) approached SWOT
in terms or groups and vectors with common themes and interactions. Regardless of the exact historical credit for
coining the term “SWOT”, it has a half-century of use and documentation in the literature.
Researchers in strategic management (Ansoff, 1965; Andrews, 1987; Porter, 1991; and Mintzberg et al., 1998) agree
SWOT (Strengths, Weakness, Opportunities, and Threats) analysis provides the foundation for realization of the desired
alignment of organizational variables or issues. By listing favourable and unfavourable internal and external issues in
the four quadrants of a SWOT analysis grid, planners can better understand how strengths can be leveraged to realize
new opportunities and understand how weaknesses can slow progress or magnify organizational threats. In addition,
it is possible to postulate ways to overcome threats and weaknesses (e.g. Hofer and Schendel, 1978; Schnaars, 1998;
McDonald, 1999; Kotler, 2000), or future strategies, from SWOT analysis. Valentin (2001) advocates SWOT analysis as
the traditional means for searching for insights into ways of crafting and maintaining a profitable fit between a
commercial venture and its environment. Panagiotou (2003) contends SWOT analysis is used more than any other
strategic planning tool.
SWOT-analysis brings together the results of internal and external analysis of a company. The purpose is to find the
most favourable match of internal resources, capabilities and core competences to build competitive advantage, and
to identify a position in the industry where a company best can defend itself against competitive forces or influence
them to their own favour (Friend & Zehle, 2009). In order to do so, the SWOT-analysis must have a customer focus,
since competitive advantage is a result of satisfying customer needs (Friend & Zehle, 2009). SWOT analysis was firstly
developed as a strategic planning tool (Afuah, 2009). Strengths and weaknesses in that perspective are considered to
be internal factors, since they are specifically connected to a company’s resources, capabilities and core competences
(Afuah, 2009). Likewise, opportunities and threats are external factors and depending on the external environment.
The best strategies accomplish an organization’s mission by exploiting an organization’s opportunities and strengths
while neutralizing its threats and avoiding its weaknesses (Barney & Griffin, 1992). The results of these analyses can be
placed in a SWOT-matrix, in which the strengths and weaknesses are placed against the threats and opportunities. The
attractiveness of a SWOT-matrix is that it allows for identifying the right strategy for a firm to select. Some of these
general strategies are shown in table 2.
Table 2: SWOT-combinations and strategies (Alsem, 1993)

22
Evaluating an organization’s strengths and weaknesses
Organizational strengths are skills, capabilities and core competences that enable an organization to conceive of and
implement its strategies. Different strategies call upon different skills and capabilities. An organization that possesses
distinctive competences and exploits them in the strategies it chooses can expect to obtain a competitive advantage.
However, the competences can be duplicated by other firms called strategic imitation. A sustained competitive
advantage that exists after all attempts at strategic imitation have ceased is therefore to be preferred. Therefore,
organizational strength defines the characteristics and situations in which an organization is more effective and
efficient compared to their competitors.
The evaluation process of an organization’s weaknesses is similar to when evaluating its strengths. Organizational
weaknesses are skills and capabilities that do not enable an organization to choose and implement strategies that
supports its mission. An organization with organizational weaknesses either can make investments to improve its
weaknesses or change its mission. When competing organizations have implemented valuable strategies that the
organization in focus has not done, it has a competitive disadvantage. Therefore, organization weakness means the
aspects or activities in which an organization is less effective and efficient compared to its competitors (Barney &
Griffin, 1992).
Evaluating an organization’s opportunities and threats
Opportunities are those that would yield positive results for the organization determined as a result of the analysis of
its environment. According to Harrison and John (2004), opportunities are conditions in the external environment that
allow an organization to take advantage of organizational strengths, overcome organizational weaknesses or neutralize
environmental threats. Evaluating an organization’s opportunities and threats is directly related to the tools described
in the chapter about the external analysis (Barney & Griffin, 1992). Moreover, organizational opportunities are events
or phenomena in an organization’s environment that, if exploited, may generate above normal economic performance.
Threats are events or phenomena in an organization’s environment that make it difficult for an organization to create
or maintain above-normal economic performance, or even normal economic performance according to Barney &
Griffin (1992). For organizational managements, a threat is the element that makes it difficult or impossible to reach
the organizational goals. Threats are the situations that come out as a result of the changes in the distant or the
immediate environment that would prevent the organization from maintaining its existence or lose its superiority in
competition, and that are not favourable for the organization (Ülgen and Mirze, 2010). They can constitute an
impediment to the success of the organization and cause unrecoverable damages. Therefore, both system enhancing
opportunities as well as threats directs organizational managements to be more careful and act strategically on the
developments in and outside their environments.
3.1.4 Expert interviews
The Expert interview is a kind of individual interview carried out with a specialist in the subject in question. Unlike an
ordinary person, this type of respondent is a carrier of deep knowledge of the research object. If the usual in-depth
interviews aimed at studying the individual's personal life and his everyday opinions, the purpose of the expert
interview is to obtain additional unknown or reliable information, authoritative opinions serious and professional
assessments of the research topic. Therefore, the expert interview cannot be formalized. This type of research involves
open nature of questions that allows the expert to tell their point of view on the issue under study, to assess or predict
the possible options.
Expert interviews have significant advantages over other methods of data collection. For example, due to the fact that
respondents are highly qualified in the subject matter, it eliminates the need to use additional screening and clarifying
questions aimed at revealing true but hidden from the interviewer respondent views. This type of survey is uniquely
aimed at obtaining reliable data because respondents’ competence is very high (Dorussen, Lenz and Blavoukos, 2005).
Expert interviews in this research helps in validating the conclusions drawn from PESTEL and SWOT Analysis.

23
3.2 Data collection
Qualitative data gathering methods consisting of desk research, individual interviews and focus group interviews were
used for this study to analyze the case company. Documentation is a stable source of evidence and was partly used to
verify the findings from the interviews. Because of their overall value, documents play an important role in the data
collection plan. The use of interviews is traditionally an important source of evidence for case study research.
Interviews were merely used to identify the current situation and future transitions. It enables the researcher to find
opinions, non-documented or sensitive information. In this case, semi-structured focused interviews were held with
open-ended questions to gain in-depth knowledge. The semi-structured interview, therefore, not only gives
interviewers some choice in the wording to each question but also in the use of probes (Hutchinson & Skodol-Wilson
1992). Probing, in particular, can be an invaluable tool for ensuring reliability of the data as it: allows for the clarification
of interesting and relevant issues raised by the respondents (Hutchinson & Skodal Wilson 1992); provides opportunities
to explore sensitive issues (Nay-Brock 1984, Treece & Treece 1986); can elicit valuable and complete information
(Gordon 1975, Austin 1981, Bailey 1987).
The criteria for triangulation, the application of different data gathering methods to study the same phenomenon, was
used to test the consistency of findings obtained through the individual interviews and focus group interviews because
it has been argued that triangulation increases the reliability and validity of the final result (Baskerville, 1999; Dixon et
al., 1988). It is based on the assumption that any bias inherent in a particular method can be neutralized when used
together with other methods, i.e. the weakness from one method can be overcome with another method (Hussey and
Hussey, 1997; Yin, 1994). A focus group takes advantage of the interaction between small groups of people.
Participants respond to, and build on, what others in the group have said. Focus group interviews allowed the
researcher to elicit ideas, insights and experiences from a small group of participants in a limited period of time (Lincoln
and Guba, 1985).
In total, 12 participants contributed to this research. Five of them were interviewed individually to gain insights for
PESTEL and SWOT analysis and another five participated together in focus group interviews for SWOT analysis. The
other two of them were experts chosen for expert interviews. All the participants were chosen through nonrandomized
purposive sampling as it adds reliability to the data (Maxwell, 1992). Participants in this study were only involved with
one data gathering method, i.e., if a participant was interviewed individually, then that candidate did not participate
in the focus group interviews. The data collection method used in this study is face to face interviews in order to have
face validity and escape the drawbacks related to phone interviews (Wilson, 2014). All individual interviews lasted
between 15 to 30 minutes. The duration of the focus group interview was between two to three hours and were
conducted as two sessions, one before and after lunch. Further, all the participants asked not to be named and are
therefore not identified in this research. It was emphasized that the interviews will solely be a contribution to science
and will not be impacting the competitive advantages of the participants. The interview questions were sent to the
participants before the interview took place. The interviews took place at the case company. To better structure the
interview questions, organizational and value chain analysis performed through desk research is explained below.
3.2.1 Case Company: Signify
The case company for the present research will be Signify which was formerly Philips Lighting. It became a standalone
company following its spin-off from Royal Philips in 2016. Signify is the world leader in lighting as the industry
transitions from conventional to LED lighting technologies and now moving towards connected lighting. Their lighting
products, systems and services are sold in 180 countries and their corporate mission is to unlock the extraordinary
potential of light for ‘Brighter Lives and a Better World’.
Signify’s current strategy is based on six key strategic priorities:
- Optimize cash from conventional lighting products to fund their growth.
- Innovate in LED products commercially and technologically to outgrow the market.
- Lead the shift to systems, building the largest connected installed base.
- Capture adjacent value through new services business models.
- Be customers’ best business partner locally, leveraging their global scale.
- Driving operational excellence improvement journey.

24
In the coming sections, Signify’s organizational structure and their individual strategies and performances will be
analysed. The organizational levels were identified as Business group, Business unit, Business division and Product
group. By broadly starting from Business group level, this section will narrow down towards the Product group level,
Linear modules, as the qualitative study was carried out in this product group. The scope of the research is based on
the interviews carried out at this product group.
3.2.2 Signify: Business group level strategy
Signify’s businesses are divided into four business groups: Lamps, LED, Professional and Home. The sales by business
groups is shown in fig. 3 below:
Lamps
Lamps is the global market leader in the conventional lighting business and comprises the company’s conventional
lamps and lamp electronics business. It produces and sells lamps based on a wide variety of non-LED based
technologies including incandescent, halogen, fluorescent and HID, as well as electronic components (electronic ballast
and drivers). Lamps aims to optimize free cash flow through its last man standing strategy. While the overall
conventional market continues to decline, Lamps’ focus is on winning market share in key segments and markets. Due
to the transition from conventional to LED lighting, the conventional lamps market is expected to continue to decline
in the coming years.
LED
LED sells a wide variety of LED lamps, namely spots, bulbs and tubes, to the professional and consumer channels. In
addition, the Business Group sells LED electronic components, consisting of LED drivers and LED modules, to luminaire
Original Equipment Manufacturers (OEMs) for professional luminaire applications in the retail & hospitality, office &
industry and outdoor segments. In the LED electronics business, the aim is to generate more revenues from global
OEMs by increasing the number of OEM customers and growing the share of wallet with existing OEM customers. The
company’s ambition is to drive market share gains and leadership in this segment as the market is forecasted to
continue its growth annually through 2020.
Professional
Professional products and Systems & Services are used in multiple market segments such as offices, commercial
buildings, shops, hospitality, industry and outdoor environments including smart cities. The products in Professional
have historically experienced a rapid shift from conventional to LED and have been integrated into broader Systems &
Services capabilities. Professional focuses on strengthening its global lighting leadership position by accelerating the
rollout of its leading architectures for connected lighting systems to customers in all market segments. One of the
contributing factors to the increased use of LED technologies is the expanding offering of systems which enable users
to program and control lights through connectivity with sensors and networks.
Figure 3 - Sales by business groups
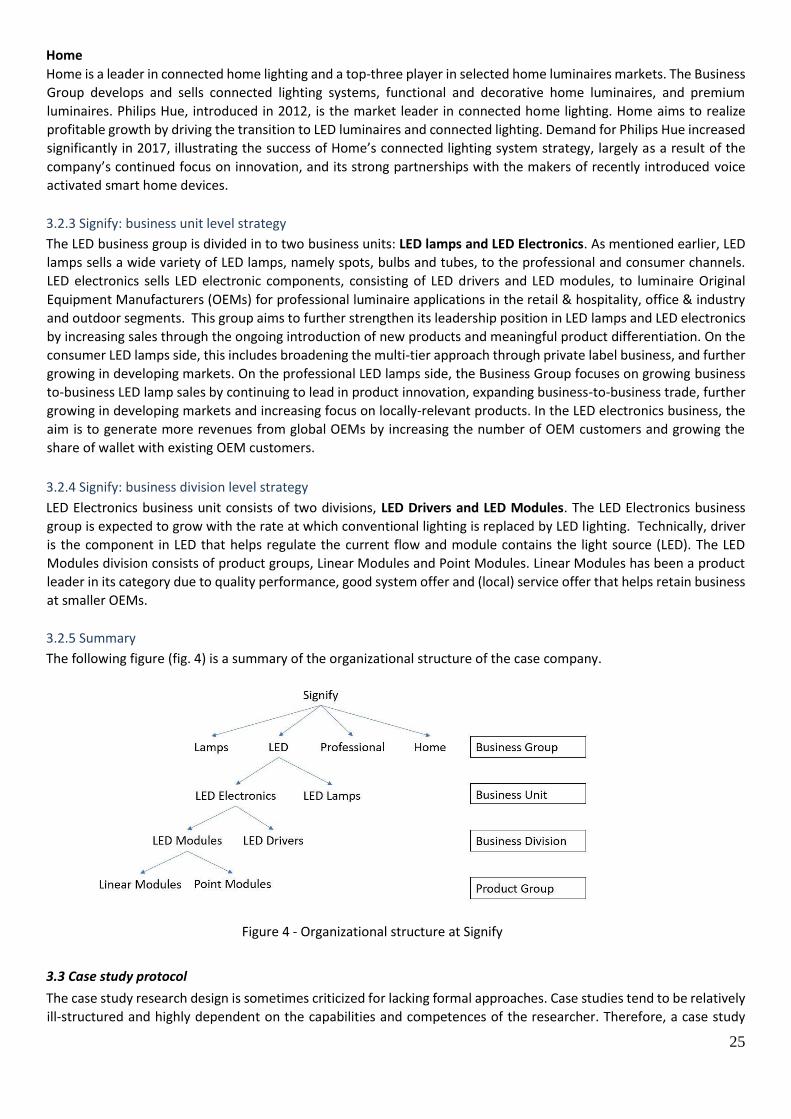
25
Home
Home is a leader in connected home lighting and a top-three player in selected home luminaires markets. The Business
Group develops and sells connected lighting systems, functional and decorative home luminaires, and premium
luminaires. Philips Hue, introduced in 2012, is the market leader in connected home lighting. Home aims to realize
profitable growth by driving the transition to LED luminaires and connected lighting. Demand for Philips Hue increased
significantly in 2017, illustrating the success of Home’s connected lighting system strategy, largely as a result of the
company’s continued focus on innovation, and its strong partnerships with the makers of recently introduced voice
activated smart home devices.
3.2.3 Signify: business unit level strategy
The LED business group is divided in to two business units: LED lamps and LED Electronics. As mentioned earlier, LED
lamps sells a wide variety of LED lamps, namely spots, bulbs and tubes, to the professional and consumer channels.
LED electronics sells LED electronic components, consisting of LED drivers and LED modules, to luminaire Original
Equipment Manufacturers (OEMs) for professional luminaire applications in the retail & hospitality, office & industry
and outdoor segments. This group aims to further strengthen its leadership position in LED lamps and LED electronics
by increasing sales through the ongoing introduction of new products and meaningful product differentiation. On the
consumer LED lamps side, this includes broadening the multi-tier approach through private label business, and further
growing in developing markets. On the professional LED lamps side, the Business Group focuses on growing business
to-business LED lamp sales by continuing to lead in product innovation, expanding business-to-business trade, further
growing in developing markets and increasing focus on locally-relevant products. In the LED electronics business, the
aim is to generate more revenues from global OEMs by increasing the number of OEM customers and growing the
share of wallet with existing OEM customers.
3.2.4 Signify: business division level strategy
LED Electronics business unit consists of two divisions, LED Drivers and LED Modules. The LED Electronics business
group is expected to grow with the rate at which conventional lighting is replaced by LED lighting. Technically, driver
is the component in LED that helps regulate the current flow and module contains the light source (LED). The LED
Modules division consists of product groups, Linear Modules and Point Modules. Linear Modules has been a product
leader in its category due to quality performance, good system offer and (local) service offer that helps retain business
at smaller OEMs.
3.2.5 Summary
The following figure (fig. 4) is a summary of the organizational structure of the case company.
3.3 Case study protocol
The case study research design is sometimes criticized for lacking formal approaches. Case studies tend to be relatively
ill-structured and highly dependent on the capabilities and competences of the researcher. Therefore, a case study
Figure 4 - Organizational structure at Signify

26
protocol was developed as an essential guide for the case study conducted in this research project. It is a standardized
data collection instrument for the researcher, based on the steps suggested by Yin (Yin, 2009). It contains the
instrument, the procedures and general rules to be followed. It gathers the conceptual and practical matters of
collecting the data and is meant to structure the inquiry (Yin, 2009). This increased the reliability of the case study. An
overview of the case study project is provided below, and the case study selection is discussed. The case study
questions, describing what information is collected and what sources are used, and interview protocols are provided
in Appendix 1.
3.3.1 Case study overview
The research goal of this project was to propose strategies to a lighting company to help increase its market share in
European market as the industry is shifting towards LED based lighting. A case study approach was used as it allows to
gain in-depth knowledge of the research problem. In this research, a qualitative study was performed at Linear
Modules product group. This product group was chosen for this research for two reasons: 1) It aimed to increase its
market share by 5% in 2017 but its strategy had failed and faced a significant drop in sales compared to previous year.
2) The Linear Modules product group is an integral division in Signify in its march towards LED based Lighting as it
contributes to 32 million euros in sales.
3.4 Data analysis strategy
After the participants had completed the individual interviews and focus group interviews, data analysis was conducted
with the data collected. According to Strauss (1987), a data analysis strategy is a process of systematically applying
logical techniques to describe, summarize, and compare data. The following strategy was applied to the analysis of
individual interviews and focus group interviews independently.
3.4.1 Data management
Data management was designed to maintain as much of the participants’ ideas as possible from the individual and
focus group interviews, as well as to permit ongoing analysis (Patton, 2001; Strauss, 1987). As previously stated, the
researcher wrote abbreviated notes in a section of the interview protocol (Maxwell, 1992) called “interview
comments” (see Appendices C and D). These are referred to as “raw” field notes gathered from individual and focus
group interviews (Patton, 2001).
After each individual and focus group interview, the “raw” field notes were transcribed by the researcher into a
notebook and are referred to as “expanded” field notes (Morse, 1994). These “expanded” field notes were written as
full sentences, with the researcher adding commentary as well as anything relevant which he remembered but had
not had time to write down (Mathison, 1988; Maxwell, 1992; Patton, 2001). The individual and focus group interviews
were analysed separately. The technique used to analyze this data follows in the next section.
3.4.2 Content analysis and analysis within and between interviews
Content analysis is a procedure for organizing non-structural information into a standardized format that allows a
researcher to make inferences about the characteristics and meaning of written or recorded material (Merriam, 1998).
Analysis within and between interviews was used to analyze the “expanded” field notes (Merriam, 1998).
“Content analysis is necessary to systematically and objectively derive categories of responses that represent
homogenous thoughts or opinions. This is done to facilitate interpretation of the large volume of lengthy and detailed
responses. This form of content analysis is known as open coding or context sensitive scheme coding. This form of
analysis involves a researcher firstly coding, and then naming categories through a detailed examination of the data. A
pre-determined framework of possible responses is not used, but the actual text provided by participants is used to
generate the categories as well as to summarize the data. This involves an iterative interpretation process of first
reading responses, then rereading to establish meaningful categories, and finally rereading select responses to refining
the number and meaning of categories in a manner deemed most representative of the participants’ text” (p106).
The “expanded” field notes from the individual and focus group interviews were analyzed independently using the
content analysis procedure above. The “expanded” field notes from each data gathering method did not influence or

27
feed into each other. Analysis within and between interviews was also conducted to increase the reliability of the data
(Merriam, 1998). The data coding approach follows in the next section.
3.4.3 Data coding
Strauss (1987) suggests that for open coding, codes may emerge from a preliminary examination of the data. He states
codes may be based upon words or themes that identify text or premises that relate to the research objectives. Using
this process, codes were assigned by the researcher, to responses received from the individual interviews and focus
group interviews. Codes were written in the margins of the notebook containing the expanded field notes (Morse,
1994; Strauss, 1987). In an effort to reduce potential coding error, responses deemed “incomprehensible” within the
context of the question were not coded (Silverman, 2000). The category construction strategy follows in the next
section.
3.4.4 Category construction
Category construction was performed using the following procedure, recommended by Strauss (1987):” The researcher
gives each response a label known as a code. The researcher assigns these labels (codes) to units or sections of
interview transcripts, notes or other sources of data. Then the researcher defines conceptual categories - i.e. clusters
of concepts or ideas that may be suggested by the research questions” (p109).
After the data coding, categories for external and internal environment analysis were defined. Based on the research
questions, categories and subcategories such as phases, activities, techniques and tools were represented in the form
of tables (Merriam, 1998; Strauss, 1987). Responses were then summarized into the tables for each question, and the
number of times each response was mentioned was counted (Merriam, 1998; Strauss, 1987). Each question’s response
was then ordered in descending number of mentions, causing the most popular responses to be at the top of each
table (Merriam, 1998; Strauss, 1987).
3.4.5 Cross-checking of results
After the data coding and category construction were performed on the individual and focus group interviews, the
data from each these methods were cross-checked against each other. Silverman (2000) suggests a researcher should
“cross-check data by selecting high frequency mentions and eliminating low frequency mentions” (p188). Therefore,
the data from the individual interviews was cross-checked against the data from the focus group interviews by selecting
the most frequently mentioned responses for each category and eliminating responses with a low frequency of
mentions. This strategy allowed the comparison of one data set against another to check for patterns, contradictions
and examine overlapping facets, to increase the reliability of the final result (Baskerville, 1999).
3.5 Research quality
3.5.1 Reliability of the research
Reliability refers to the extent to which a measure yields the same results after repeated trials (Carmines and Zeller,
1979; Yin, 1994). This research supports the diachronic, synchronic and inter-judge criteria for reliability.
Diachronic reliability refers to the stability of observed outcomes (Kirk and Miller, 1986). Content analysis showed
consistent patterns in the identification of phases, activities, techniques and tools, from the business analysts, product
managers, heads of research and development, legal officers and global product managers from the case company.
Synchronic reliability refers to the similarity of outcomes determined from multiple sources of different measures (Yin,
1994). For this research, standardized instruments were used in the form of protocols for the individual interviews and
focus group interviews, whereby similar patterns of results were produced.
Inter-judge reliability is achieved by determining the degree of agreement between participants (De Vellis, 1991). This
research compared the interview responses from the individual and focus group interview responses (Yin, 1994).
Consistent patterns in the responses from each method indicated the degree of consistent agreement in the responses
analyzed.

28
3.5.2 Validity of the research
Lincoln and Guba (1985) state that validity “determines whether the research truly measures that which it was
intended to measure and how truthful the research results are” (p57). The criteria of validity which apply to this
research appear below.
Instrumental validity addresses whether or not generated observations from one instrument match those from an
alternative measure (Kirk and Miller, 1986; Nunally, 1978). In this research, data from semi-structured interviews and
focus group interviews were compared. Similar patterns in the results from each method showed the validity of
instruments used in this research (Ragin, 1990; Trochim, 1989).
Internal validity occurs by “applying pattern-seeking and matching methods across cases” (Yin, 1994). For this
research, internal validity was achieved through pattern matching, during the content analysis which revealed
similarities in outcomes from different data collection methods and different participants (Yin, 1994; Glaser and
Strauss, 1967). Analysis within and between interviews, recommended by Merriam (1998), was conducted to increase
the internal validity of the results. Finally, the “convergence of multiple sources of evidence” (Patton, 2001, p83) from
the individual interviews and focus group interviews contributed to the internal validity of this research.
Construct validity is accomplished by the establishment of correctly defined and consistently applied operational
measures for the concepts being studied (Kirk and Miller, 1986). This was achieved with standardized protocols for
individual as well as focus group interviews. Kirk and Miller (1986) suggest multiple sources of evidence encourage
convergent lines of inquiry and this was accomplished by a diverse sample of participants consisting of business
analysts, product managers, heads of research and development, legal officers and global product managers. Finally,
construct validity was also achieved by handing over the draft of the interview data to the participants to examine
whether they agreed with the way the researcher presented the information (Patton, 2001; Yin, 1994). This method,
called re-negotiation, was utilized in this research. After the individual interviews and focus group interviews, the
transcripts were discussed with the participants for their approval (Patton, 2001).
Generalizability, also referred to as external validity (Kirk and Miller, 1986; Patton, 2001), was achieved in this study
through the use of multiple participants with different characteristics and the observed similarities within the
outcomes. These outcomes lent themselves to generalizability across cases (Kirk and Miller, 1986; Patton, 2001; Yin,
1994).

29
4. Results The qualitative research methodology used for this research was presented in the previous chapter. As discussed in
Section 1.1, the main research question is concerned with how a company can increase its market share when its whole
sector is transitioning towards an innovative technology. Therefore, identifying the determinants for creating
successful strategy to increase market share is crucial in answering the research question. By analysing external and
internal environment, and market position using PESTEL and SWOT, these determinants for creating a successful
strategy are identified and discussed in this chapter and are subsequently used to make recommendations in the next
chapter. This chapter also summarizes the findings from the individual and focus group interviews. Moreover, the
content analysis done on these findings and the categories derived are also presented. The structure of the chapter is
as follows: Section 4.1 presents the findings from interview setting and findings, Section 4.2 discusses the consolidation
and interpretation of the results and the chapter ends with Section 4.3 conclusion.
4.1 Interview setting and findings
The research goal of this project was to propose strategies to a lighting company to help increase its market share in
the European market as the industry is shifting towards LED based lighting. Qualitative data gathering methods
consisting of individual interviews and focus group interviews were used for this study to analyze the external and
internal environment of the case company. A case study approach was used as it allows to gain in-depth knowledge of
the research problem. The use of interviews is an important source of evidence for a case study research. In this
research, semi-structured focused interviews were held with open-ended questions to gain in-depth knowledge. Also,
to better structure the interview, organizational and value chain analysis was first performed through desk research,
as explained in detail in the previous chapter.
4.1.1 Sample and procedure
The unit of analysis for this study are the external and internal environment, and market position of the case company.
The method of sample selection used in this study is known as the expert sampling and is widely accepted in the field
of research (Sutherland, 1994). From this expert sample, nonrandomized purposive sampling was conducted to add
reliability to the data (Maxwell, 1992). Nonrandomized purposive sampling is a sampling method based on the
judgement of the researcher, where participants are chosen, based on their knowledge of the phenomenon the
researcher is studying (Leedy, 1993). This type of sampling technique makes the most effective use of limited resources
especially when the research involves identifying and selecting individuals or groups of individuals that are
knowledgeable about or experienced with a phenomenon of interest (Cresswell & Clark, 2011 and Patton, 2002).
The final sample of participants represented senior business analysts, project managers, global product managers,
heads of research and development, legal officers and product managers. The anonymized characteristics of the
participants are discussed in table 3 below:
Table 3 – Characteristics of interviewees
Code Role Responsibility
SBA-1 Senior business analyst Drives the business by linking analytics and commercial performance with operational execution and deployment
POM-1 Project manager End to end execution of customer projects
GPM-1 Global product manager Translate marketing strategy/plans into a business
plan and bridge the business offerings with the
local market requirements
HRD-1 Head of research and development Ensure that the company develops new products
or technologies and improve existing products to
stay ahead of the competition

30
LEG-1 Legal officer Support all the company’s legal entities in matters
relating to contracts, litigation and product and
corporate compliance
SBA-2 Senior business analyst Drives the business by linking analytics and commercial performance with operational execution and deployment
POM-2 Project manager End to end execution of customer projects
GPM-2 Global product manager Translate marketing strategy/plans into a business
plan and bridge the business offerings with the
local market requirements
LEG-2 Legal officer Support all the company’s legal entities in matters
relating to contracts, litigation and product and
corporate compliance
PDM-1 Product manager Manage the global product managers and
efficiently allocate responsibilities within the team
to maximize sales, market share and volume.
Additionally, fig. 5 summarizes the positions of the participants within the case company. The upcoming sections (4.1.1
and 4.1.2) will present the findings from individual and focus group interviews respectively.
Figure 5 – Organization chart illustrating the position of participants in the company
4.1.2 Individual interviews
The purpose of the individual interviews was to gather data on the external and internal environment of the case
company. Individual interviews in general offer researchers the chance to explore topics in depth and to gain
appreciation of the subject area (Campbell, 1996; Goguen and Linde, 1993). The general set-up of the individual
interviews was discussed in section 3.2 and as mentioned there, a total number of five people participated in the
interviews.

31
Based on the data collected through individual interviews, raw field notes were first gathered. After each interview,
these raw field notes were transcribed by the researcher in to expanded field notes. Content analysis was performed
on expanded field notes to systematically and objectively derive categories of responses that represent homogenous
thoughts or opinions. This form of content analysis known as open coding or context sensitive scheme coding was used
(Saldana, 2009). Based on the research questions, categories and subcategories were represented in form of tables
(see table 4). Responses were then summarized into the tables for each category, and the number of times each
response was mentioned was counted. Each category’s response was then ordered in descending number of mentions,
causing the most popular responses to be at the top of the table. This type of analysis is known as conceptual analysis.
Relational analysis builds on conceptual analysis by examining the relationships among concepts in a text. Atlas.ti 7.0,
a dedicated software for qualitative research that enables a more structured approach and analysis was used for
content analysis.
Through individual interviews analyses (see table 4), categories relating to external environment of the case company
were identified based on the responses of the participants. These categories were then named as Political (POL),
Economical (ECO), Social (SOC), Technological (TEC), Environmental (ENV) and Legal (LEG). These categories formed
the basis for PESTEL analysis and each of them are further discussed in detail in section 4.2.1. The second part of
analysis identified categories relating to internal environment of the case company. These categories were then named
as Strengths (STR), Weaknesses (WEA), Opportunities (OPP) and Threats (THR). These categories formed the basis for
SWOT analysis and each of them are further discussed in detail in section 4.2.2.
Table 4: Mentions and percentages from individual interviews
Codes Category Responses Mentions
POL1 Politics Banning incandescent lamps 5
POL2 Banning halogen lamps 5
POL3 EU’s energy security 3
POL4 Unstable EU political situation 2
POL5 Away from nuclear energy 2
ECO1 Economics USD vs CNY vs EUR valuation 5
ECO2 Raw material prices 3
ECO3 Europe’s GDP 3
ECO4 Increasing LED lighting applications 3
ECO5 Decreasing LED prices 4
ECO6 Manufacturing efficiency 3
SOC1 Social Payback time 3
SOC2 Country wise LED adoption rates 3
SOC3 Connected lighting 4
SOC4 Total Cost of Ownership 5
SOC5 New value proposition 3

32
SOC6 High consumer expectations 4
TEC1 Technological Commoditization of LED technology 4
TEC2 Quality of light 5
TEC3 Haitz law 3
TEC4 Standardization and quality testing 4
LEG1 Legal Regulations on Hazardous Substances 5
LEG2 Energy efficiency directives 4
LEG3 Building directives 4
LEG4 General Product Safety Directive 2
ENV1 Environmental LED dyes 4
ENV2 No mercury usage in LEDs 5
ENV3 Conventional light sources disposal 3
ENV4 Blue light emission 5
STR1 Strength Biggest buyer of LEDs 5
STR2 Product quality and reliability 4
STR3 Connected solutions 4
STR4 Market leader in LED lamps 5
STR5 Broad portfolio 3
STR6 Strong R&D Capabilities 4
STR7 Good operational setups by region 4
STR8 Strong sales team in OEM 4
WEA1 Weakness Not the cheapest 4
WEA2 Tight inventories 5
WEA3 Slower in bringing new ideas to market 5
WEA4 Data capability like internet
companies missing
3
WEA5 Educational barriers 3
OPP1 Opportunity Banning of fluorescence 5
OPP2 Quality of light 3
OPP3 Connected lighting 4

33
OPP4 New business models 2
THR1 Threat Increased competition in LED 5
THR2 Low end Chinese imports 5
THR3 Few suppliers 3
THR4 Aggressive pricing 4
4.1.3 Focus group interviews
The purpose of the focus group interviews is also to gather data on external and internal environment of case company,
but it takes advantage of the interaction between small groups of people. Focus group interviews allowed the
researcher to elicit ideas, insights and experiences from a small group of participants in a limited period (Lincoln and
Guba, 1985). The general set-up of the focus group interview was discussed in section 3.2 and as mentioned there, a
total number of five people participated in the interviews.
The raw field notes were obtained based on the data collected through focus group interview, a single interview with
5 participants. Then these notes were transcribed by the researcher into expanded field notes. Content analysis was
performed on expanded field notes to systematically and objectively derive categories of responses that represent
homogenous thoughts or opinions. This form of content analysis is known as open coding or context sensitive scheme
coding (Saldana, 2009). Based on the research questions, categories and subcategories were derived and is shown in
table 5. After arriving at categories, conceptual analysis was performed. Responses were summarized into the tables
for each category, and the number of times each response was mentioned was counted. Each category’s response was
then ordered in descending number of mentions and the most popular responses were placed at the top of the table.
Relational analysis builds further on conceptual analysis by examining the relationships among concepts in a text. Both
relational and conceptual analysis were carried out using Atlas.ti 7.0, a dedicated software for qualitative research that
enables a more structured approach.
Focus group interview analysis is similar to individual interviews analyses (see table 5). First, the categories relating to
external environment of the case company were identified based on the responses of the participants. These
categories were then named as Political (POL), Economical (ECO), Social (SOC), Technological (TEC), Environmental
(ENV) and Legal (LEG). These categories formed the basis for PESTEL analysis and each of them are further discussed
in detail in section 4.2.1. The second part of analysis identified categories relating to internal environment of the case
company. These categories were then named as Strengths (STR), Weaknesses (WEA), Opportunities (OPP) and Threats
(THR). These categories formed the basis for SWOT analysis and each of them are further discussed in detail in section
4.2.2. The only difference is in the number of responses per category. It is higher in focus group as it takes advantage
of the interaction between small groups of people. Participants respond to, and build on, what others in the group
have said.
Table 5: Mentions and percentages from focus group interviews
Codes Category Responses Mentions
POL1 Politics Banning incandescent lamps 4
POL2 Banning halogen lamps 4
POL3 EU’s energy security 3
POL4 Unstable EU political situation 2
POL5 Away from nuclear energy 3

34
ECO1 Economics USD vs CNY vs EUR valuation 5
ECO2 Raw material prices 4
ECO3 Europe’s GDP 2
ECO4 Increasing LED lighting applications 4
ECO5 Decreasing LED prices 4
ECO6 Manufacturing efficiency 3
SOC1 Social
Payback time 3
SOC2 Country wise LED adoption rates 3
SOC3 Connected lighting 4
SOC4 Total Cost of Ownership 5
SOC5 New value proposition 3
SOC6 High consumer expectations 4
TEC1 Technology Commoditization of LED technology 4
TEC2 Quality of light 5
TEC3 Haitz law 3
TEC4 Standardization and quality testing 4
LEG1 Legal Regulations on Hazardous Substances 5
LEG2 Energy efficiency directives 5
LEG3 Building directives 3
LEG4 General Product Safety Directive 3
ENV1 Environment
LED dyes 3
ENV2 No mercury usage in LEDs 4
ENV3 Conventional light sources disposal 2
ENV4 Blue light emission 4
STR1 Strength Biggest buyer of LEDs 5
STR2 Good operational setups by region 4
STR3 Product quality and reliability 4
STR4 Connected solutions 4
STR5 Market leader in LED lamps 5

35
STR6 Strong sales team in OEM 4
STR7 Strong R&D capabilities 4
STR8 Broad portfolio 3
WEA1 Weakness Not the cheapest 4
WEA2 Tight inventories 4
WEA3 Slower in bringing new ideas to market 4
WEA4 Data capability like internet
companies missing
4
WEA5 Educational barriers 3
OPP1 Opportunity Banning of fluorescence 5
OPP2 Quality of light 4
OPP3 Connected lighting 4
OPP4 New business models 3
THR1 Threat Increased competition in LED 5
THR2 Aggressive pricing 4
THR3 Low end Chinese imports 5
THR4 Few suppliers 2
4.1.4 Spearman correlation
Correlation analysis is a statistical method used to assess a possible linear association between two (continuous)
variables. There are two main types of correlation coefficients: Pearson's product moment correlation coefficient and
Spearman's rank correlation coefficient. The correct usage of correlation coefficient type depends on the types of
variables being studied. Spearman's rank correlation coefficient is denoted as ϱs for a population parameter and as rs
for a sample statistic. It is appropriate when one or both variables are skewed or ordinal and is robust when extreme
values are present. For a correlation between variables x and y, the formula for calculating the sample Spearman's
correlation coefficient is as seen below in fig. 6:
Figure 6: Formula for Spearman's correlation coefficient
The spearman correlation coefficient was calculated for PESTEL categories identified through two distinct data
collection methods, focus group and individual interviews (Table 4 and 5). Each of the PESTEL categories have various
codes under them. Therefore, the first step is to calculate the rank of each code in their category (POL1 (individual
interview) is x and POL1 (focus group) is y). Then di is calculated by the difference in x and y. The next step is to calculate
the value of ‘n’ and that is given by the total number of codes in a category. Finally, the spearman correlation coefficient
(rs) calculated for each of the PESTEL category are shown in table 6. When rs is close to 1, it signifies a strong overlap

36
between the two variables (x and y) compared. Therefore, from Spearman correlation coefficient values in table 6, it
can be concluded that there is a strong overlap in the results of the two data collection methods used in this research.
Table 6: Spearman correlation coefficient
PESTEL category Spearman correlations coefficient
Politics 0,854167
Economics 0,7
Social 0,857143
Technology 1
Environment 0,933333
Legal 0,766667
4.2 Consolidation and interpretation of results
4.2.1 PESTEL analysis
The external environment analysis in this study was carried using PESTEL framework. The PESTEL framework refers to
the political, economic, social, technological, environmental and legal factors influencing the environment in which a
firm must operate. The role of PESTEL analysis was to identify the key factors which affect the lighting industry in
general and the case company. Individual and focus group interviews were used as two distinct data collection methods
for PESTEL analysis. PESTEL factors were identified through coding, categorizing and comparing the responses of
interviewees in focus group and individual interviews. Due to larger and significant overlap in the results of the two
data collection methods (confirmed through Spearman correlation coefficient in Table 3), interpretation of the results
is condensed into one and presented. Also, the PESTEL factors were again confirmed through expert interviews.
PESTEL factors provide the input in identifying critical threats (are compounded by corresponding weaknesses) and
promising opportunities (are matched by corresponding strengths). This section discusses each of the PESTEL
categories in detail. As discussed in chapter 3, PESTEL analysis provides the input for SWOT analysis (Section 4.2.2). By
performing PESTEL and SWOT analysis sequentially, influence of a firm’s external and internal environment on its
business can be evaluated.
Political environment
In table 7 and 8 below, the findings from the individual and focus group interview for political environment are
presented. The regulation affecting lighting products is a key determinant of the future lighting market.
The shift to LEDs from conventional lighting accelerated when European Union decided to ban incandescent bulbs and
eventually completely phased it out. This ban additionally created awareness among our customers and eliminated
their doubts regarding the potential of LEDs. (GPM-1)
Incandescent bulbs made way for LEDs only because the latter is a better and much more sustainable technology.
European Union’s decision to ban incandescent bulbs was crucial for success of LED lighting especially as the latter was
in its nascent stage and needed such a huge platform to reach the masses. (SBA-1)
Governments around the globe are accelerating initiatives in the lighting industry along two dimensions. Banning
inefficient technologies is one. The other is to pass more stringent legislation on energy efficiency requirements and
offer incentives for entire building infrastructures. This in turn is further propelling energy-efficient lighting
technologies, such as Light Emitting Diodes (LEDs). The European Commission issued a press release stating, “EU
Member States experts endorsed the European Commission's proposals for a regulation progressively phasing out
incandescent bulbs starting in 2009 and finishing at the end of 2012. By enforcing the regulation of switching to energy

37
saving bulbs, EU citizens will save close to 40 TWh (roughly the electricity consumption of Romania, or of 11 million
European households, or the equivalent of the yearly output of 10 power stations of 500 megawatts) and will lead to
a reduction of about 15 million tons of CO2 emission per year.” (Member States approve the phasing-out, 2008). This
statement shows the commitment of EU in supporting the transition to LED lighting and reaching its energy efficiency
and climate protection targets.
The halogen lamps are a huge waste of energy. They consume four to five times the electricity than that of a LED lamp
and have very less lifetime compared to the latter. Therefore, banning halogen lamps is an expected move. This ban
will definitely increase the sales of LED lamps especially in homes where LED has not made heavy inroads. LED lamps
entering a home is also the first step towards connected lighting as customers can experience the benefits of LED
technology […..] Also, increased usage of LEDs means European Union can reduce its import of oil as overall electricity
consumption will fall steadily. (PDM-1)
The European Union is further accelerating the switchover to more ecological lighting sources by extending its
regulations to ban low-voltage halogen lamps. It was witnessed in 2015 when it decided to phase-out inefficient
"D"class halogen lamps, but it was eventually postponed by two years to 1 September 2018. In general, Halogen lamps
are very inefficient (energy efficiency class "D"). Novel technologies, such as LEDs offer a high savings potential: the
consumption of a halogen lamp is often more than five times higher than an energy-efficient LED. But, by analyzing the
lighting market and technological developments, the commission concluded that 1 September 2016 would be too early
for LED technology to fully replace halogen lamps; a more appropriate phase-out would be 2018 ("Phase-out of
inefficient lamps postponed to 1 September 2018 - Energy - European Commission", 2015). This is in line with the
priority of improving Europe's energy efficiency, with the final goal of ensuring secure, sustainable, competitive and
affordable energy. In fact, every day the European Union pays over 1 billion Euros for its energy imports. This is
reflected in the high electricity and fuel prices all Europeans pay, but it also has implications for the EU's security of
energy supply. The switch to energy-efficient lamps in 2018 will bring yearly energy savings equal to the annual
electricity consumption of Portugal (48.0 TWh of electricity) and will save 15.2 million tonnes of CO2 emissions by
2025. This means, reducing the EU's import of oil by 73.8 million barrels.
Lighting is an essential commodity and therefore any political pressure ranging from Brexit to Greek debt crisis will not
affect the lighting industry. When the day ends, you need light no matter what. LED lighting is just not an alternative
lighting technology, but it can make significant cut down on a country’s electricity needs […..] The numbers from the
‘En.lighten’ initiative of United Nations prove the same. (LEG-2)
With usage of LED lighting, a country’s electricity requirements can be brought down by a huge margin and that means
dependence on nuclear energy can be gradually cut down. The trend of moving away from nuclear energy picked up
after the Fukushima disaster and will only further strengthen the need for energy-efficient lighting, fuelling LED
penetration. (HRD-1)
Even though the EU faces a range of political pressures (the June 2016 vote in the United Kingdom (UK) in favour of
leaving the EU; the Greek debt crisis and lingering concerns about the Eurozone; ongoing migrant and refugee flows;
a resurgent Russia; and a heightened terrorism threat), it doesn’t pose a threat to the lighting industry, as lighting is
an essential commodity. Another transformation happening, especially after 2011 nuclear disaster in Japan, is the shift
of energy production towards more non-nuclear sources by including renewables. Germany has also implemented a
fundamental shift in energy policy by shutting down eight of its 17 nuclear power stations and committing to nuclear
free energy production by 2022. On the energy supply side, these developments will accelerate the penetration of
renewable energy sources. The demand side will also need to alter its practices as greater energy efficiency will help
to close the energy supply gap. The lighting market, which consumes approximately 20 percent of total electricity
generation, can greatly contribute by providing energy-efficient lighting solutions, such as LEDs (En.lighten, 2012).
Overall, the trend away from nuclear energy is expected to give a further boost to energy-efficient lighting, fuelling
LED penetration (McKinsey Global Lighting Market Model, 2012 and IAEA, 2012).

38
EU is making small but significant steps towards LED lighting. Therefore, currently the political scenario is favouring LED
industry and it will remain so considering the benefits LED technology brings to the table […..] The main benefit is that
it will help governments reach its climate targets and eventually earn the respect of its citizens. (SBA-2)
As summarized in table 7 and 8, through banning incandescent lamps and proposing a ban on halogen lamps, the
political environment in EU is favouring the transition of lighting industry towards LED. Also, changes in the lighting
legislation are highly visible to the public and brings immediate attention to the government. As mentioned above,
through energy efficient LED lighting, governments will be able to slowly move away from nuclear energy. Therefore,
by supporting LED transition, governments will be promoting sustainable initiatives and can earn the respect of its
citizens.
Table 7: Findings from individual interviews
Codes Category Responses Mentions
POL1 Politics Banning incandescent lamps 5
POL2 Banning halogen lamps 5
POL3 EU’s energy security 3
POL4 Unstable EU political situation 2
POL5 Away from nuclear energy 2
Table 8: Findings from focus group interviews
Codes Category Responses Mentions
POL1 Politics Banning incandescent lamps 4
POL2 Banning halogen lamps 4
POL3 EU’s energy security 3
POL4 Unstable EU political situation 2
POL5 Away from nuclear energy 3
Economic environment
In table 9 and 10 below, the findings from individual and focus group interview for economic environment are
presented.
The most used raw material used in LED lighting is aluminium and the price of it affects the production costs and
ultimately determines the Net Net Selling Price (NNSP) or the price a customer pays for a product. The second and most
important factor that needs to be continuously monitored is the behaviour of USD […...] A company’s profit, be it seller
or supplier is heavily dependent on how strong or weak the USD is. (GPM-2)
With exception of the light bulbs, the other parts of the light (bells, projectors, street lighting, etc.) are, for the most
part, made of aluminium. This means that fluctuations in the price for this material greatly affect production costs of
professional LED lighting. Another key element which determines production costs for LED lighting is the behaviour of
the US Dollar (USD). This is due to two factors: Firstly, the currency rate used for aluminium on financial markets is the
USD. If the USD is devalued, less aluminium can be bought for the same amount of dollars. Secondly, the main producer

39
and exporter of LEDs in the world is China. The benchmark currency used (which Chinese factories are paid in when
they export) is the USD. If they are paid in USD and the USD is devalued, each time material is bought they will be able
to buy less material. Whenever they change USD into the local currency, the Chinese Yuan (CNY), to pay salaries, rents,
etc., they have less CNY, resulting in a fall in their profits. This means that, if the price of aluminium rises and the value
of the USD drops, LED lighting production costs rise. This is a major economic factor that always needs to be monitored
when it comes to LED lighting.
The single market trade policy and common currency usage among EU members means that fluctuation of EU with
respect to USD is a trend that every lighting company in Europe will have a keen eye on. (LEG-1)
For lighting companies in Europe who also have their top customers located in Europe, the variation of Euro with USD
is a factor as important as the behaviour of USD. As top customers mean huge sales and volume, even the slightest
difference between currencies such a strong USD vs Euro will affect the ICOS (cost price of a product) and bring down
the profit margin for a company. (SBA-1)
Furthermore, EU members share a customs union, a single market in which goods, services, people, and capital move
freely, and have a common trade policy and currency (Euro), which is used by 19 member states (collectively referred
to as the “Eurozone”). Therefore, when it comes to lighting industry, variation of Euro with respect to USD is also a
factor that needs to be monitored continuously. The global economic situation has developed less favourably than
expected since mid2011, leading to downward adjustments of the 2016 GDP forecast by approximately 2 percent. This
adjustment stems from several unfavourable developments in the aftermath of the global financial crisis and Europe’s
ongoing debt crisis. Europe’s debt crisis is increasingly threatening the region’s economic stability especially with the
bailout of Greece in Q1 2012, a parallel government crisis in the country and disagreements between governments at
an EU level on how to best tackle fiscal issues (Hall 2013 and Copelovitch et al., 2016). Europe’s 2016 GDP forecast has
been lowered by 3 percent compared to 2011. Europe’s struggles impact the world economy as the region contributes
almost 30 percent to global GDP (IMF World Economic Outlook Database, 2016).
LED lighting market has a clear correlation with GDP. This is because LED’s lifetime is very long and therefore its market
is driven only new installations and not by replacements. So, when economy is under strain, new installations of lighting
fixtures will be very less. (POM-2)
LED Lighting is expected to further dominate the lighting industry as the price of LEDs are reducing much faster than
the anticipated trend and it mainly due to huge investments in L1 LED production line in Asia. Because of steady LED
price drop, first cost burden on the customers will reduce drastically. (GPM-1)
The market for luminaire and LED lighting system control components is predominantly driven by new installations.
New installations are linked to construction activity, and there is a clear correlation with GDP. This is supported by the
fact that heavy investments in the installation of fixtures are more likely to be postponed when the economy is under
strain. However, the conventional lamp market is mainly driven by replacements. The latter is a market by nature more
resilient to overall macroeconomic trends: it depends almost solely on the number of installed sockets and the lifetime
of the technologies in place. Even if incomes deteriorate significantly, consumers will still need to replace a failed light
source. The lamp market therefore correlates with GDP to a lesser degree (McKinsey, 2012). Next, the price of LEDs is
tumbling even faster than anticipated and this reduction in the price of LEDs is driven by several factors. One is that
considerable overcapacity of LED chips and packages has built up due to huge investments in LED chip/package
production lines in China (Strategies Unlimited, 2011 & US Department of Energy, 2012).
The new CRI 90 (notation to represent highest quality of light) market is growing because of the special lighting needs
in the application areas of architecture, horticulture and decorative lighting. In these applications, quality of light
(colour, uniform distribution) is very important and only LED lighting can provide such features. (HRD-1)
Even though the Total Cost of Ownership of LED lighting is much lower than conventional lamps, the initial cost of LED
lighting is still high. This is mainly due to small scale of production of LEDs compared to conventional sources. Increasing

40
the demand for LED fixtures and combining it with highly efficient production plants is the way forward! (POM-2)
Initially, the LED lighting market was dominated by signalling and display applications like traffic signal, exit signs and
large LED displays in highways and stadiums. Mobile, automotive and entertainment applications followed, with
lighting applications becoming more and more diversified in the last decade (Anderson, 2010). New possibilities in
decorative and architectural lighting are now presented by LED lighting, due to their superior colour and special
distribution capabilities, as well as lower maintenance costs and improved design possibilities (Aníbal et al., 2014). The
initial cost of LED-based general illumination sources is still high, in comparison with conventional lighting technologies.
Prices are high due to the smaller scale of production. Since the lighting market has historically been strongly affected
by first cost, although their life cycle cost may be lower due to their long lifetime and high energy efficiency. Therefore,
low-cost, high volume, and reliable manufacturing methods are important to drive down the first costs of LED lighting.
As summarized in Table 9 and 10, the economic environment for LED lighting is dependent on the following factors:
raw material prices (mainly aluminium), currency exchange rate (Euro vs USD and USD vs CNY), economic growth
(GDP), new LED lighting applications, price of LEDs and manufacturing techniques. These factors together will
determine the acceleration in growth of LED lighting market in the coming years and therefore have to be monitored
continuously.
Table 9: Findings from individual interviews
ECO1 Economics USD vs CNY vs EUR valuation 5
ECO2 Raw material prices 3
ECO3 Europe’s GDP 3
ECO4 Increasing LED lighting applications 3
ECO5 Decreasing LED prices 4
ECO6 Manufacturing efficiency 2
Table 10: Findings from focus group interviews
ECO1 Economics USD vs CNY vs EUR valuation 5
ECO2 Raw material prices 4
ECO3 Europe’s GDP 2
ECO4 Increasing LED lighting applications 4
ECO5 Decreasing LED prices 4
ECO6 Manufacturing efficiency 3
Social environment
In table 11 and 12 below, the findings from the individual and focus group interview for social environment are
presented.
Since the cost of LED production is falling steadily, the first cost is also reducing for the customers which means they
can break even on their investment at a much faster rate than earlier times. This is fuelling LED market penetration and
the trend is expected to continue for few more years. (SBA-2)

41
Lack of consumer awareness has been a problem for LED lighting. They are not familiar with the advantages of LED. It’s
just not end customers but customers at all experience levels must be made more aware of the benefits of LED and only
that in the long run will make LED lighting a commercial success. (GPM-2)
The payback time is the time necessary for a LED customer to break even on his/her investment in a more expensive
LED bulb. Therefore, the time to payback metric helps to predict LED adoption with some historical and empirical
accuracy. The fact that payback periods are shrinking along with LED retail prices ensure significant market penetration
in the next decade. Moving on, LED-based lighting remains a new technology that is not well known in the marketplace.
This unfamiliarity applies equally for users at all experience levels: lighting designers, residential and commercial users,
installers, building inspectors, and government code officials. Most lighting designers are used to thinking, designing,
and working with white light sources, instead of coloured light sources. They are also not accustomed to taking
advantage of the energy-efficiency, long-life and maintenance characteristics of LEDs. Therefore, consumers must be
made aware of the advantages of LED lighting by removing the educational barrier through advertisements and
government funded campaigns (Ecos Consulting, 2003).
Overall, when looking at the trends in LED adoption, Japan and China are the ones leading the LED transition followed
by Europe and North America. Developing countries still prefer cheaper lighting options but there is a possibility that
emerging markets (fast developing economies like India) can make jumps from incandescent to LED lamps directly.
(PDM-1)
The rate of LED adoption differs region by region. Japan and China are the countries that are moving most rapidly
towards LED, owing to high rates of customer acceptance and strong regulations, followed closely by Europe and North
America. LED adoption is a bit slower in developing economies as they are expensive relative to existing lighting
technologies, but as LED prices decline over the next decade, emerging markets are likely to leapfrog fluorescent lamps,
moving directly from incandescent to LED. Adoption rates for various lighting technologies and the amount that
customers are willing to pay for those technologies—also differ across geographies based on customer preference for
warm or soft light.
Connected lighting is the next significant shift in the lighting industry and with the features that LED offers, it is the ideal
candidate for light source. The reason that connected lighting is the next big thing because it can be customized for a
user’s needs and offers huge cost savings. (HRD-1)
Connected lighting has multiple dimensions. It’s just not about lighting efficiency but has two other dimensions. First, it
provides the user complete control over the lighting system (brightness control, colour options, automatic notification
for maintenance) and second, the amount of data the system generates can be analyzed and that offers huge additional
potential for cost savings. (POM-1)
The increasing popularity of LED gives momentum to another significant shift, the adoption of connected lighting
systems (also called smart systems). Given the versatility of LED in terms of factors such as brightness and colour
variation, connected systems make more sense for use with LED than when conventional lighting technology is used.
Connected lights can be programmed and controlled in an expanding variety of ways, which further strengthens the
demand for systems (Boston Consulting Group, 2012). In offices, for example, lighting can be automatically adjusted
in response to the level of natural lighting, which in turn can enhance employee productivity and smartphone apps can
be used to easily manage connected lighting systems, a feature that makes those systems increasingly accessible to a
broader group of customers. Connected lighting also offers cost-saving opportunities. Energy cost reductions from
efficiently controlled systems can be substantial—another 40 percent on top of the already hefty savings offered by
LED alone. And data generated by connected systems— automated alerts to show where lamps have burned out, for
example—can spare other costs, such as maintenance expenses.
As LED lighting comes in as an expensive replacement for existing conventional technologies, the consumer expectations
will be high and therefore, product quality is very important especially at the beginning stages. (PDM-1)

42
Expectations of LED lighting is at one end, but the other is that, LED as such is a new technology and it is therefore
susceptible to unforeseen or unanticipated consequences brought upon by field application. Also, LEDs are electronic
light sources and are sensitive to thermal and field conditions and this in turn may adversely impact the overall
performance. (POM-2)
As with any early market transformation activity, particularly with the introduction of new technology, the opportunity
for consumer issues is extremely high, stemming from unanticipated consequences with product failure. Next
generation LED lighting technology is particularly susceptible to unforeseen or unanticipated consequences because
of failures brought upon by field application. Electronic light sources like LEDs are sensitive to thermal and field
conditions and that may adversely impact the performance of the overall device. Shortened lifetime or unexpected
failures will significantly erode consumer acceptance of this technology, potentially creating long-term barriers.
Therefore, consumer perception of LED technology is driven by product quality and early prices. Additionally, there are
high consumer expectations associated with LED lighting as it is meant to replace the existing fluorescent lamp
technology and departures from this expectation could lead to consumer dissatisfaction. Early failures of LED
technology in commercial applications also will have significant influence on long-term market acceptance, particularly
by large end-use purchasers and decision makers (Siminovitch, 2010).
The value offer in terms of TCO for LED lighting is expected to saturate soon. Manufactures have always marketed their
products with TCO, but a stronger selling point will be needed for a company to differentiate itself and make significant
profit margin. (GPM-2)
Although LED technology is still more expensive than conventional lights (currently about five to ten times more), the
price is falling precipitously, owing to technological advances in manufacturing and increasing LED efficiency (fewer
LEDs are required for a similar amount of light output). It is projected that the average price of an LED point will slip
from more than $6 in 2014 to less than $3 in 2020. A saturation is being reached on the Total Cost of Ownership (TCO)
value of LED lighting technology (TCO includes not only the initial cost of lamps and luminaires but also the expense of
replacing lamps and costs for energy). Earlier, buyers paid greater attention to this measure and manufacturers
marketed their products by pushing the message about LED’s lower total costs, LED technology gained additional
traction. And as LED prices continue to fall and with a saturation being reached on TCO, an even stronger selling point
or value proposition is needed.
The opportunities that connected lighting provides are many and yet it is unexplored and remains a new territory.
Combining a new value offer with connected lighting or providing a separate new value offer for the buyers will be way
forward in the lighting industry. (SBA-1)
When it comes to social factors, there are significant factors that present both opportunities and threats to LED lighting
industry and are summarized in Table 11 and 12. The opportunities are in the form of developing a new value
proposition for buyers and exploring untapped potential of connected lighting whereas the threats are the high
consumer expectations, payback time and its influence on LED adoption and high initial cost of LED lighting.
Table 11: Findings from individual interviews
SOC1 Social Payback time 3
SOC2 Country wise LED adoption rates 3
SOC3 Connected lighting 4
SOC4 Total Cost of Ownership 5
SOC5 New value proposition 3
SOC6 High consumer expectations 4

43
Table 12: Findings from focus group interviews
SOC1 Social
Payback time 3
SOC2 Country wise LED adoption rates 3
SOC3 Connected lighting 4
SOC4 Total Cost of Ownership 5
SOC5 New value proposition 3
SOC6 High consumer expectations 4
Technological environment
In table 13 and 14 below, the findings from the individual and focus group interview for technological environment are
presented.
L1 stage of LED lighting involving LED suppliers will soon consolidate to 3-5 larger LED chip suppliers due to
commoditization of LED technology. Therefore, the next stage in LED production is device integration and system
architecture. To further drive down the already falling production costs, implementing high degree of automation is a
possibility but this is more worthwhile to look when the industry consolidates to small number of suppliers. (POM-2)
Commoditization of LED technology is happening due to overcapacity in manufacturing. Also, the performance
roadmaps of LEDs are flattening out and hence differentiation through product performance will soon diminish. It is
predicted that the LED industry will consolidate by 2020 to 3-5 large LED chip suppliers. LED lighting will clearly be able
to outperform existing lighting technologies in terms of efficacy, without sacrificing colour rendition. Therefore, the
next step is towards device integration and system architecture to serve the different applications targeted. System
architecture is the proposed way to deal with the diversity of the different segments targeted, whilst creating volume
leverage with standard processes and components. Finally, there is the need for low-cost manufacturing. High speed
assembly processes, larger area deposition and patterning processes as well as a much higher degree of automation
will be key in order to bring the manufacturing costs down from the present level.
LED efficiency will soon reach the highest possible theoretical value and therefore R&D investments into LED light
sources capabilities will decrease and research on connected lighting will increase. At the same time, the major ongoing
research is now towards quality of light. Human centric lighting is still very young but is being eagerly looked at. (HRD1)
Investments in downstream industry are shifting towards addressing controls, software, service propositions.
Therefore, there is a prediction that R&D investments into LED light sources capabilities will decrease and research on
connected lighting will increase. Another major ongoing research is in the value proposition of ‘Quality of Light’ (tight
colour control, tunable white light with the ability to combine with available the day light i.e. human centric lighting,
customized spectra for various applications like horticulture, poultry, and museums etc). Research on human centric
lighting is still very young and is further being strengthened and accelerated to take full advantage of potential benefits.
The advantages of LED are that it is efficient, more beautiful, and similar to day light, low power consumption and low
operating voltage. LED lighting also has physical robustness and compactness, small weight and size, and long lifetime
expectancy (25,000 to over 50,000 hrs of life). With special design, lifetimes of 150,000 hrs can be achieved. LED lights
can be instantaneously switched-on with no re-strike time and is mercury-free. The main disadvantages of LEDs are:
Lack of standardization, relatively high price, risk of glare as a result of small lamp size, need for thermal management
to avoid degradation in lifetime, blue pollution (this applies for cool-white LEDs which can cause light pollution) and
finally ambient temperature dependence (operating temperature greatly influences the LEDs' performance)
(Halonen,2010).

44
Like Moore’s law, the one for LED lighting is Haitz law and according to the latter, LED lighting is only expected to get
cheaper with time, but LED market lacks one significant feature when it comes to product quality and that is the lack
of availability of uniform testing standards. This means that critical performance attributes cannot be compared in a
consistent manner. (POM-1)
Haitz's Law is an observation/prediction about the steady improvement over the years of LEDs. It states that every
decade, the cost per lumen (unit of useful light emitted) falls by a factor of 10 and the amount of light generated per
LED package increases by a factor of 20 for a given wavelength (colour) of light. It is considered the LED counterpart to
Moore's Law, which states that the number of transistors in a given integrated circuit doubles every 18–24 months.
Therefore, LED lighting is expected to get cheaper with time. Finally, it is important to know that the LED market lacks
suitable uniform testing standards that measure efficacy, lifetime and other critical performance attributes such as
reliability and compatibility in a consistent manner. Also, the available LED standards only have limited coverage of
LED products, and significant variations exist between the product scope and test methods of different standards.
As discussed above, the technological factors are summarized in table 13 and 14. As such the LED lighting market is
bound to expand as LEDs get cheaper, but product performance cannot be the way companies differentiate themselves
as LED technology is becoming commoditized. Therefore, the way to go forward for firms is by offering more value in
terms of either quality of light or connected lighting, both of which requires immense technical know-how. Therefore,
failure to develop capabilities in either of these upcoming fields will pose a significant threat to firms and rob them of
their opportunities to increase their sales.
Table 13: Findings from individual interviews
TEC1 Technology Commoditization of LED technology 4
TEC2 Quality of light 5
TEC3 Haitz law 3
TEC4 Standardization and quality testing 4
Table 14: Findings from focus group interviews
TEC1 Technology Commoditization of LED technology 4
TEC2 Quality of light 5
TEC3 Haitz law 3
TEC4 Standardization and quality testing 4
Legal environment
In table 15 and 16 below, the findings from the individual and focus group interview for legal environment are
presented.
The EU is focussed on making lighting industry sustainable and energy efficient. With that in mind it came up with
initiatives like EPBD, EED and GGP. All of these are aimed at improving the lighting standards in buildings across the
member states of EU. The proposed way for that is by improving luminous efficacy of light sources and that is the core
feature of LED lighting. (LEG-1)

45
The energy efficiency of lighting is explicitly addressed as a subject, mainly for the non-residential sector, in the recast
of the Energy Performance of Buildings Directive (EPBD) of EU. Annex I point 3 stipulates that ‘the methodology shall
be laid down taking into consideration at least the following aspects: (e) built-in lighting installation (mainly in the
nonresidential sector)’. Annex I point 4 stipulates that ‘The positive influence of the following aspects shall, where
relevant in the calculation, be taken into account :...(d) natural lighting.’ (Proposal for a Directive of the European
Parliament, 2010). Also, the Energy Efficiency Directive (EED) requires Member States to set up National Energy
Efficiency Action Plans. New EU Green Public Procurement (GPP) criteria for indoor lighting were introduced in 2012
by EU. They relate not only to minimum luminous efficacy of the light sources (in lm/W), but also to lighting levels
(W/m²/100 lux), lighting controls, etc.
Design standards and energy efficiency ratings are finding widespread use now and is being increasingly adopted in EU,
Japan, China and USA. This is extremely important for consistent quality in LED products of different manufacturers.
Eventually, this makes it easier for the customer to choose his/her product for different requirements. (LEG-2)
The EU ruled that by 2020, all new building structures should consume “nearly zero” energy (European Council for an
Energy Efficient Economy, 2010). Corresponding design standards and ratings classifying energy efficiency are finding
widespread and growing adoption across geographies, such as BREEAM in the European Union, CASBEE in Japan and
standards for green construction in China. In the US, LEED and the newly introduced International Green Construction
Code (IGCC) are being adopted by an ever-greater number of local jurisdictions. In addition to regulatory action, global
campaigns to raise awareness have been put in place to emphasize the role that energy-efficient lighting can play in
reducing global energy consumption. A prominent example of this is the ‘en.lighten’ initiative by the United Nations
Environment Programme (UNEP) and key lighting players (en.lighten, 2012).
Even though the EU is favouring LED transition, it is extremely strict in enforcing safety and environmental standards.
RoHS, GPS and Low Voltage directives are a few of them. These directives from EU make it tough for low quality products
to enter the European market. (LEG-1)
The EU Restriction of Hazardous Substances (RoHS) Directive lays down rules on the restriction of the use of hazardous
substances in electrical and electronic equipment (EEE) with a view to contributing to the protection of human health
and the environment, including the environmentally sound recovery and disposal of waste EEE. The General Product
Safety (GPS) Directive 2001/95/EC and the Low Voltage Directive 2014/35/EU requires as safety principles that with
light sources and luminaires no danger from radiation can occur. In Europe, EN 62471 is the product safety standard
for lamps and lamp systems and is harmonized under the European safety directives EN 62471, which is based on the
international IEC 62471 standard, classifies light sources into Risk Groups 0, 1, 2 and 3 (from 0 = no risk through to 3 =
high risk) and provides for cautions and warnings for consumers if needed. Typical consumer products are in the lowest
risk categories and are safe for use.
All the above legislations show that the EU is increasingly extending energy efficiency requirements and incentives to
entire building infrastructures and are summarized in Table 15 and 16. This will help accelerate the transition towards
LED lighting and continuously maintain safety standards through the process. As mentioned above, the EU is also keen
on creating design standards and ratings to bring uniformity in LED lighting sector. Therefore, legislations and safety
standards are helping the lighting industry to move towards LEDs from conventional light sources.
Table 15: Findings from individual interviews
LEG1 Legal Regulations on Hazardous Substances 5
LEG2 Energy efficiency directives 4
LEG3 Building directives 4
LEG4 General Product Safety Directive 2

46
Table 16: Findings from focus group interviews
LEG1 Legal Regulations on Hazardous Substances 5
LEG2 Energy efficiency directives 5
LEG3 Building directives 3
LEG4 General Product Safety Directive 3
Environmental environment
In table 17 and 18 below, the findings from the individual and focus group interview for environmental environment
are summarized and presented.
LED lighting is competing with conventional sources not just with its efficiency features but also in its sustainability
attributes. Overall, when you look at economic and environmental advantages, LED is simply the best available
alternative to current technologies even though it is expensive. It has easier waste disposal process and leads to lower
carbon emission. (PDM-1)
LEDs are emerging not only as having high energy efficiency, but also as having some important environmental
advantages compared to conventional light sources (Gaston et al., 2012). Lower energy consumption leads to lower
carbon emissions. Additionally, LEDs do not contain glass, filaments or mercury. This makes LEDs a much safer
alternative to the current lighting technologies in retail, commercial and industrial applications (IEA, 2006). Therefore,
LEDs have many economic and environmental advantages, being one of the most cost-effective technologies to reduce
GHG. The handling of conventional light sources, metal halide, compact fluorescent, and linear fluorescent involves
the use of strict waste disposal protocols that results in a cost of ownership to any commercial venture. In addition,
the residential applications and disposal of compact fluorescent have become significant issues given the substantial
increase in production and future application. LED technology does not involve the use of mercury and therefore would
not require this level of sophistication in the waste-disposal process, thereby reducing the stress on municipal waste
disposal.
Even though LEDs don’t contain mercury like in the case of conventional light sources, it still has very small amounts of
additional metals like copper, gold, nickel and other metals in the LED chips. Also traces of group 13 elements are
present in LEDs. The other potential risks raised are in terms of spectral and energetic characteristics of LEDs but are
not proven yet. (POM-1)
However, LEDs contain one or more chips (also called dies) that may contain very small amounts of mildly problematic
materials such as arsenic, gallium, indium, and/or antimony (combined with nitrogen and phosphors) with potential
environmental impacts, human health and ecological toxicity effects, especially when disposed of at the end of their
lifecycle (Almeida et al., 2012). Furthermore, the LED chips are assembled into usable pin-type devices through the
application of leads, wires, solders, glues, and adhesives, as well as heat sinks for thermal dissipation management.
These ancillary technologies contain additional metals, such as copper, gold, nickel, and other metals, such as
aluminium. It will be desirable to find proper ways to recycle these materials as well as gallium and indium as more
LEDs enter the market. The potential health risks of these new light sources were explored. Due to the specific spectral
and energetic characteristics of white LEDs, as compared to other domestic light sources, some concerns have been
raised regarding their safety for human health, particularly potential harmful risks for the eye. In general, “cool” white
LEDs are more efficient than those having a “warm” appearance, since short-wavelength spectral content plays a role
in the photopic efficacy of LEDs.
High efficacy, low CCT LEDs will eventually minimize impact of artificial lighting. This technological achievement has
pushed the LED manufacturers to strive for further reductions in short wavelength and thereby, eliminate blue light
emission. (GPM-1)

47
The new high-efficacy (above 100 lm/W), low CCT warm-white LEDs are an environmental, ecological, and
technological breakthrough that will help over time to minimize the impact of artificial lighting on the night
environment. Their development is a significant technological achievement to encourage all LED manufacturers to
strive for further reductions in short wavelength and thereby, eliminate blue light emission (US Department of Energy,
2010). So as such there is no present environmental or safety hazard in LED lighting. Therefore, environmental factors
do not possess any threats but only certifies LED lighting in a positive way and are evident from findings in table 17 and
18.
Table 17: Findings from individual interviews
ENV1 Environment LED dyes 4
ENV2 No mercury usage in LEDs 5
ENV3 Conventional light sources disposal 3
ENV4 Blue light emission 5
Table 18: Findings from focus group interviews
ENV1 Environment
LED dyes 3
ENV2 No mercury usage in LEDs 4
ENV3 Conventional light sources disposal 2
ENV4 Blue light emission 4
4.2.2 SWOT Analysis
As discussed in previous chapter, SWOT analysis brings together the results of internal and external analysis of a
company. The purpose is to find the most favourable match of internal resources, capabilities and core competences
to build competitive advantage, and to identify a position in the industry where a company best can defend itself
against competitive forces or influence them to their own favour (Friend & Zehle, 2009). In order to do so, the
SWOTanalysis must have a customer focus, since competitive advantage is a result of satisfying customer needs (Friend
& Zehle, 2009). Strengths and Weaknesses are considered to be internal factors, since they are specifically connected
to a company’s resources, capabilities and core competences (Afuah, 2009). Likewise, Opportunities and Threats are
external factors and depend on the external environment. The best strategies accomplish an organization’s mission by
exploiting an organization’s opportunities and strengths while neutralizing its threats and avoiding its weaknesses
(Barney & Griffin, 1992).
To analyse which SWOT factors are more important than other, the different factors have been weighted (see Table
19). The number 5 means a point is very important, 3 means it is normally important, and 1 means it is not important.
These scores are based on interpretation by the researcher and discussion with two experts. The SWOT factors can
then be placed in a SWOT-matrix, in which the strengths and weaknesses are placed against the threats and
opportunities. The attractiveness of a SWOT-matrix is that it allows for identifying the right strategy for a firm to select
and is discussed in the next section.
Table 19 – SWOT analysis
Strengths Points Weaknesses Points

48
Biggest buyer of LEDs
Good operational setups by region
Product quality and reliability
Connected lighting solutions
Market leader in LED lamps
Strong sales team in OEM
Broad portfolio
Operational efficiency
Strong R&D capabilities
4
4
5
3
4
4
3
4
4
Not the cheapest
Low inventories
Slower in bringing new ideas to market
Data capability like internet companies missing
Educational barriers
3
3
5
3
3
Opportunities Points Threats Points
Quality of light value proposition
Applications based lighting
Connected smart lighting
New disruptive business models
Banning of fluorescence lamps
4
4
3
3
3
Aggressive pricing
Increased competition in LED
Low end Chinese imports
Market change (lighting as a product to service)
Few suppliers
Unclear payback time
High initial cost
5
4
3
2
3
3
4
4.3 SWOT Matrix and strategies
In this matrix, the strengths, weaknesses, opportunities and threats that are considered most important are set out
against each other, which results in several possible strategies. These strategies are based on the possible strategies
given by Alsem (1993) as described in chapter 3: grow, improve, defend or run. These identified strategies help
accomplish an organization’s mission by exploiting an organization’s opportunities and strengths while neutralizing its
threats and avoiding its weaknesses (Barney & Amp; Griffin, 1992). Each factor has been matched in a way to either
take advantage of an opportunity (grow - combines strengths and opportunities), to identify areas that can be
improved (improve - combines strengths and threats), to fight competition (defend – combines weaknesses and
opportunities) or to identify major risks and issues (run – combines weaknesses and threats).
Based on the coded interviews, a network view (visualization of system of linkages) as seen in Figure 3-6 was built using
Atlas.ti 7.0, where the most relevant codes are incorporated and analyzed in relation with each other. First, for each
of the four strategies, their relevant codes were first chosen from Table 3 and 4. Then their neighbours (other codes
connected to the chosen ones) were imported. Then a suitable layout can be chosen to visualize the imported codes.
Then the codes are connected through the default or newly created semantic linkages that captures the relationship
between the imported codes. After connecting the codes through the applicable relation, their frequencies have to be
added. This is seen in figure 3-6 as parenthesis with two numbers next to each element. The first number represents
Groundedness, the number of quotations that are connected to a code and the second one represents Density, the
inter-connections that different codes have between them.
Figure 7 displays the elements of Grow strategy (SO). It shows the relationship between different elements (strengths
and opportunities). In this strategy, pursuing new product ideas involving quality of light and connected lighting
solutions is the way forward. Both of these product ideas are made possible through strong R&D capabilities. When
entering connected lighting solutions, the case company has to start looking at new business models as the business
is no more about only hardware but also involves software. Strong R&D capabilities guarantees product quality and
reliability and that along with strong sales team and good region wise operational setups has helped the case company
remain a market leader in LED lamps.

49
Figure 7 – Grow strategy
Figure 8 displays the elements of Defend strategy (ST). It shows the relationship between different elements (strengths
and threats). Being a market leader in LED lamps, through strategic agreements, the weakness of few LED suppliers
can be negated. The increased competition in LED can be tackled by moving to new value propositions like quality of
light and connected lighting as they companies to possess strong R&D capabilities. Low end Chinese imports are
another reason for increased competition in LED lighting and it is better for large organizations like the case company
to not compete in there. Another element that needs attention is unclear payback time and it is something that
organizations need to focus on through their campaigns and advertisements.
Figure 8 – Defend strategy
Figure 9 displays the elements of Improve strategy (WO). It shows the relationship between different elements
(weaknesses and opportunities). When looking at connected lighting as the new value proposition, the internet data
mining capabilities of lighting companies including the case company are poor. So, it is crucial factor to be considered
when creating new business models. By being the first to introduce connected lighting and quality of light products,
the case company can influence its image from being a slow to a relatively fast company in bringing new ideas. Tight
inventory is a factor considered as a weakness in the lighting industry and could eventually become a threat for the
case company. The strategy must also include educational campaigns around the reason for ban of fluorescent lamps
and how and why one must transition to LED lighting.

50
Figure 9 – Improve strategy
Figure 10 displays the elements of Run strategy (WT). It shows the relationship between different elements
(weaknesses and threats). The strategy involves in identifying the significant threats and ways to handle it. The case
company has tight inventories mainly due to few suppliers, high organizational costs and aggressive market pricing.
Through strategic partnerships and offering new value propositions, a company can improve its profit margin and that
will in turn improve the supply chain flexibility. The other elements that threaten the case company are lack of data
handling capabilities and slow in bringing new ideas to the market. Unclear payback time is not a significant threat and
can be overcome through educational campaigns.
Figure 10 – Run strategy
4.4 Conclusion
Table 20 below is a summary of the SWOT analysis and it is called a SWOT matrix. The column headers are Strengths
(W) and Weaknesses (W). The row headers are Opportunities (O) and Threats (T). The possible strategies (Grow,
Defend, Improve and Run) are represented within a two by two matrix denoted by SO, ST, WO and WT respectively.
Table 20 – SWOT matrix

51
Strategies Strengths (S)
Biggest buyer of LEDs
Good operational setups by region Product quality and reliability
Connected lighting solutions
Market leader in LED lamps
Strong sales team in OEM
Broad portfolio
Strong R&D capabilities
Weaknesses (W)
Not the cheapest
Low inventories
Slower in bringing new ideas to market
Data mining capability like internet companies is missing Educational barriers
Opportunities (O) Quality of light value proposition
Connected smart lighting New disruptive business models Banning of fluorescence
lamps
SO -> Grow
1. New product ideas involving quality of light and applications based lighting. 2.Secure strong market position in connected lighting 3.Explore new business models
for lighting industry
WO -> Improve
1.Educate customers
2.Improve supply chain flexibility 3.Innovate faster and reach the market first with quality of light technology 4.Develop new skills in the
workforce regarding connectivity
and understanding lighting data
Threats (T)
Aggressive pricing
Increased competition in
LED
Low end Chinese imports Market change (lighting as a product to service) Few suppliers Unclear payback time
ST -> Defend
1.Adapt to competition price to using volumes 2.Focus on premium/mid-end segment 3.Work on further reducing costs 4.Create more value
differentiators in product
portfolio and position the firm
accordingly
WT -> Run
1.Improve supply chain flexibility 2.Innovate faster and reach the market first with quality of light technology 3.Develop new skills in the
workforce regarding connectivity
and understanding lighting data
4.Create a standardized portfolio
and specific applications only
oriented streamlined portfolio,
overall forming an efficient broad
portfolio.
In the next chapter, we will discuss the overview of the findings from the research and answer the main research
question. Also, the scientific and practical relevance of the findings will be presented together with the limitations of
this study and the chapter will conclude with suggestions on directions for future research.

52
5. Discussion and conclusions In the next sections, we first present the overall conclusion of the thesis by providing an overview of the findings. After
that, we analyze the contribution of this research from a scientific perspective followed by outlining the practical
relevance. Third, we provide a set of recommendations based on the findings. Finally, we discuss the limitations of this
study and suggest multiple directions for future research.
5.1 Key findings
The goal of this thesis was to analyze how a lighting company can increase its market share in the European market as
the industry is transitioning from conventional to LED based lighting. The findings allow us to answer the main research
question, as outlined in the next paragraphs.
As discussed above, the main research question is concerned with how a lighting company can increase its market
share in European market when the whole industry is transitioning towards an innovative LED technology. The internal
environment of a company was studied through an organizational analysis and the external environment analysis was
carried out using the PESTEL framework. The results of the separate internal and external environment analyses were
synthesized by performing a strategic SWOT analysis. Through SWOT analysis, determinants for successful strategy
were identified and used to answer the main research question and subsequently to provide recommendations.
The research indicated that the current state of the lighting industry with respect to European market is favouring the
transition of the industry towards LED based lighting from existing conventional sources. Additionally, as the case
company is a market leader in lighting sector, pursuing ‘Grow Strategy’ will be the best way for them to move forward.
In this strategy, their strengths and opportunities can be combined to pursue new product ideas like quality of light
and connected lighting solutions, both of which requires immense technical know-how. The case company’s strong
R&D capabilities guarantees product quality and reliability and that along with its massive sales team and good region
wise operational setups can help the case company gain market share in the LED lighting sector. Finally, the main
research question was answered. LED technology is rapidly being commoditized, and product performance cannot
anymore be the specification where companies differentiate themselves. Therefore, opportunities for lighting
companies to gain market share is only possible through developing new value propositions for buyers like quality of
light and exploring untapped potential of connected lighting. Lighting companies must orient their research and
development in exploring and creating these value propositions. Additionally, equipping their current workforce with
the relevant technical and business capabilities will be vital.
5.2 Theoretical contribution
This research contributes to improving the Porter’s five forces model by addressing its significant limitations. According
to Grundy (2006), the model doesn’t refer to the ‘dynamics of growth’ for a certain industry or market. This study
addresses that limitation through its detailed situational analysis by combining tools like PESTEL framework, Porter’s
five forces model, Organizational analysis and SWOT analysis. Through using strategic tools that are interdependent, a
more accurate analysis of the business environment was made possible. The threats and opportunities involved in a
rapidly changing and highly competitive lighting industry could be identified. In today’s environment, there is an
increasing power of the internet and other information technologies and therefore it becomes more and more
important to start collaboration and maintain innovation and not just protect against the five forces (Karagiannopoulos
et al., 2005; Holm, Eriksson & Johanson, 1996). This research is an additional proof to the need for collaborations in
today’s rapidly changing business environment. From the findings of this research, it was evident that the market
expansion of lighting industry as it moves towards connected lighting is purely dependent on the strategic
collaborations between different lighting companies and that in turn has the potential to disrupt the current market
position of incumbents and new entrants.
The nature of the forces in the today’s competitive landscape requires a continuous rethinking of current strategic
actions, organization structure, communication systems, corporate culture, asset deployment, investment strategies,
in short, every aspect of a firm's operation and long-term health (Hitt et al., 1991; Hitt et al; 1998). In this research,
existing strategic tools were combined to arrive at a research design that carried out strategic marketing planning for
an incumbent firm that is transitioning towards LED based lighting. This study applied the existing knowledge on
strategic management to help a firm facing significant uncertainty and ambiguity to arrive at long term strategies for
growth. Therefore, firms facing uncertainty due to changing industry structure or hyper competition can follow a
similar approach or use this study as a reference to arrive at long-term strategies for growth. Finally, the study
suggested that the use of conventional structure of marketing (Four Ps marketing mix) is not sufficient for the
transitioning lighting industry. With the advent of LED based lighting, the LED suppliers’ market is expected to
aggregate to few suppliers and the move towards connected lighting increases the role of software in lighting
technology. Strategic partnerships and maintaining stakeholder relationships will become an important part in the
future of lighting industry. Therefore, the role and need of relationship marketing (a new and leading approach) in
lighting industry is identified through this research.
5.3 Practical relevance
This study offers significant insights for LED lighting industry and they are presented in the following paragraphs.
The key PESTEL factors that affect the current lighting industry were discussed. Through banning incandescent lamps
and proposing a ban on halogen lamps, political environment in EU is favouring the transition of lighting industry
towards LED. The economic environment for LED lighting is mainly dependent on raw material prices, currency
exchange rate (Euro vs USD and USD vs CNY) and falling LED prices. These factors together determine the acceleration
in growth of LED lighting market. The social factors present both opportunities and threats to LED lighting industry.
The opportunities are in the form of developing a new value proposition for buyers and exploring untapped potential
of connected lighting whereas the threats are the high consumer expectations, payback time and high initial cost of
LED lighting. As LED technology is becoming commoditized, the way to go forward for lighting companies is by offering
more value in terms of either quality of light or connected lighting. Therefore, failure to develop capabilities in either
of these upcoming fields will pose a significant threat to firms and rob them of their opportunities to increase their
sales. The EU is increasingly extending energy efficiency requirements and incentives to entire building infrastructures
and are helping the lighting industry to move towards LEDs but at the same time is careful in determining safety
standards. EU is also keen on creating design standards and ratings to bring uniformity in LED lighting sector. Finally,
the environmental factors do not possess any threats but only certifies LED lighting in a positive way.
Since the lighting industry is rapidly moving towards LED from conventional sources, the expectations of the customers
are high, therefore product quality and reliability is very important. LED lighting being an expensive option, educational
campaigns clearing the doubts surrounding LEDs and its payback time will also be a major push to stimulate the sales.
Low-cost, high volume, and reliable manufacturing methods are important to drive down the first costs of LED lighting.
The research also mentioned the need to maintain strategic relationship with LED suppliers as it is expected that the
future will consolidate all the existing LED suppliers into 3-4 suppliers. New possibilities in decorative and architectural
lighting are now presented by LED lighting, due to their superior colour and special distribution capabilities. Finally, the
research showed that LED lighting will clearly be able to outperform existing lighting technologies in terms of efficacy,
without sacrificing colour rendition. Therefore, the next step is towards device integration and system architecture to
serve the different applications targeted.
LED lighting is expected to get cheaper with time, but it is important to know that the LED market lacks suitable uniform
testing standards that measure efficacy, lifetime and other critical performance attributes such as reliability and
compatibility in a consistent manner. Also, the available LED standards only have limited coverage of LED products,
and significant variations exist between the product scope and test methods of different standards. Next, there is a
prediction that R&D investments into LED light sources capabilities will decrease and research on connected lighting
will increase. When entering connected lighting solutions, the companies must start looking at new business models
as the business will be no more about only hardware but also involves software. Therefore, developing strategic
partnerships with software companies having data handling capabilities from early stages is important.
The main strengths, weaknesses, opportunities and threats of the case company were analyzed. Biggest buyer of LEDs,
good operational setups by region, excellent product quality and reliability, market leader in LED lighting, strong sales
team in OEM and strong R&D capabilities are its strengths. The weaknesses are that it is not cheapest, has low

54
inventories and is slower in bringing new ideas to market. The opportunities for the case company due to its R&D
capabilities are in the form of offering quality of light value proposition and new applications-based lighting whereas
the threats are the aggressive pricing due to increased competition in LED industry and high initial cost of the product.
The best possible strategy for the case company out of the available four (Grow, Defend, Improve and Run) is the ‘Grow
Strategy’ that shows the relationship between its strengths and opportunities. Therefore, pursuing new product ideas
involving quality of light and connected lighting solutions must be the included in their strategy.
5.4 Limitations
The first limitation of the research is it employs a single-case study method and the drawback of a single-case design is
its inability to offer a generalizing conclusion or external validity (Jacobsen, 2002). In multiple case study design, the
advantage is that researcher is able to analyze the data both within each situation and across situations. Multiple case
studies can be used to either augur contrasting results for expected reasons or either augur similar results in the studies
(Yin, 2003). In this way the author can clarify whether the findings are valuable or not (Eisenhardt, 1991). By
triangulating the study using two separate data collection methods, focus group and individual interview, this study
tried to overcome the limitation of a single-case study design. Additionally, in order to mitigate this effect, the high
ranks of the respondents allowed to increase the generalizability of the findings, due to their broader perspective. The
single case study design was chosen also due to time constraints and the difficulty to get into contact with other large
companies and receive permission to access the data needed for the study.
In general, the limitations of case studies methodology are that it is seen as only a preliminary research method and
cannot be used to describe or test propositions (Yin, 2009). Miles (1979) also critique case research because collecting
and analyzing the data is a highly labour-intensive activity, often causing much stress, even for skilled research staff.
Merriam (2009) agrees that although rich, thick description and analysis of a phenomenon may be desired, a researcher
may not have the time or money to devote to such an undertaking. Usually the studies take a long time to execute
(Yin, 2009) and the product may be too lengthy, too detailed, or too involved for busy practitioners to read and use
(Merriam, 2009). The next limitation of the study is that the coding procedure might have suffered from a certain level
of subjectivity, especially during the identification and categorization of patterns as the study used only one coder. Due
to time constraints, multiple-coders could not be employed for the analysis and this negatively reflects on the internal
validity of the findings. Through performing content analysis using a software called Atlas.ti and by continuously
referring to respondents’ quotes throughout the study, we tried to reduce this effect.
Since it is a single case study and the sample size was small, there is a possibility that positive factors are emphasized,
and negative factors neglected by the interviewees, since they have personal connections to the company. An
appropriate sample size for a qualitative study is one that adequately answers the research question (Marshall, 1996).
The concept data saturation entails bringing new participants continually into the study until the data set is complete,
as indicated by data replication or redundancy (Bowen, 2008 and Miles et al., 1994). While qualitative methodologists
do not agree on exact sample sizes needed for qualitative studies, they generally agree that a number of factors can
affect the number of interviews needed to achieve saturation. In addition to the nature and scope of the researcher,
some other factors that can influence sample size needed to reach saturation include quality of interviews, number of
interviews per participant, sampling procedures, and researcher experience (Morse, 2000; Richardson et al., 2005;
Sandelowski, 1985). Patton (2002) explains that sample size depends on what you want to know, the purpose of the
inquiry, what’s at stake, what will be useful, what will have credibility, and what can be done with available time and
resources. Due to limitation in resource and time, a small sample size was chosen but there was a large and significant
overlap in the results of the two seperate data collection methods with completely different set of respondents and
was confirmed through spearman correlation in section 4.1.4.
5.5 Future research
Based on the findings of this research and on its limitation, new directions for future research are proposed.
First, further research is needed to assess whether the findings of this study can hold for the whole lighting industry.
A future research with multiple-case study design and having various respondents from large lighting companies can
increase the generalizability of the results from this study. When a multiple case study is used it comes with both

benefits and difficulties, which is important to take under consideration by the researcher. According to Baxter and
Jack (2008), making a multiple case study can be an expensive and time-consuming process and Eisenhardt and
Graebner (2007) suggest that multiple case studies allow a wider discovering of theoretical evolution and research
questions. Therefore, in a multiple case study, the researcher can analyze the data within each situation and across
different situations, but it is a tedious process (Gustafsson, 2012).
Second, the future research can examine the ways to arrive at a new business model that will be needed when
connected lighting takes over the LED lighting industry. In the latter case, the lighting industry may switch to a
subscription model and research can be carried out to study the existing business models and arrive at the most
suitable one for connected lighting. Also, the research could suggest the key factors in developing a successful
subscription model. Pricing is an important strategic factor in any subscription business and the research could further
analyze this complex factor and help the LED lighting industry with its suggestions.
Third, this study shows that LEDs are fast replacing the conventional lighting sources and therefore, LED lighting would
make a solid example for researchers that study how a new innovative technology cannibalizes the sales of existing
technology. The research can analyze the willingness of the firms to cannibalize their own investments for a strong
radical product innovation. The research can identify various factors that drive a firm's willingness to cannibalize.
Finally, a framework can be developed to help firms manage the decision making and cannibalization processes when
a new and an existing technology need to be kept in parallel in the product portfolio.
Fourth, the study analyses the dynamics of a transitioning industry from Porter’s five forces model as the foundation.
Other theories analyzing industrial transition due a technological innovation could be used to find the advantages and
limitations of this study. That research can find various other factors that can help analyze the dynamics of an industry
and increase the accuracy of the analysis. By doing so, a company can formulate its growth strategy clearly oriented
towards those factors and eventually arrive at very successful strategies to increase market share. But one has to be
cautious on not over analyzing the industry dynamics trying to be extremely accurate as it might create a blind side
view.
Fifth, as discussed in the research, the LED lighting industry is lacking significant uniform testing standards. For the
industry competition to remain healthy in the long run, a uniform testing standard is a must and that will also help the
customer feel safer and more satisfied on his/her orders. So, a research in this direction interviewing key stakeholders
of lighting industry and identifying the specifications for quality control and relevant testing standards will be a massive
contribution for the future of LED industry. The results of the study could be further validated through expert
interviews. Once there are uniform quality standards, the competition between key players will push the industry to
strive for better product performance.
Finally, we advocate scholars to carry out additional studies on the need for collaborations in lighting industry as the
future is connected lighting and the existing large lighting companies lack data capabilities and therefore,
collaborations will be become an important part in the next generation of lighting industry. The study could explore
with the main dimensions of the inter-firm collaborations and identify the necessary factors to build successful
innovation partnerships. The study could choose the dependent, independent and moderator variables and study their
relationships. Also, a follow-up research could be performed to support the generalizability of the findings by carrying
out similar studies in different industries.
5.6 Conclusion
The research dealt with how a lighting company can increase its market share in the European market as the industry
is transitioning from conventional to LED based lighting. The current state of the lighting industry was analyzed and
found to be favourable towards the transition. Also, the study suggested that, as the LED technology is rapidly being
commoditized, the lighting companies can gain market share only through developing new value propositions for
buyers like quality of light and exploring untapped potential of connected lighting. Finally, the limitations and future
directions of the research was discussed.

56
6. References
Afuah, A. (2009), “Strategic innovation - New game strategies for competitive advantage “, New York: Routledge.
Aktouf, O. (2004). The false expectations of Michael Porter's strategic management framework. Revista Universidad &
Empresa, 6(6), 9-41.
Alexander, R.S., Cross, J.S., Cunningham, R.M. (1961), Industrial Marketing, re.ed. , Homewood Ill: Richard D, Irwin, Inc.
Almeida, A. D., Santos, B., Paolo, B., & Quicheron, M. (2014). Solid state lighting review – Potential and challenges in
Europe. Renewable and Sustainable Energy Reviews, 30-48.
Alsem, K.J., Strategische Marketingplanning: Theorie, technieken en toepassingen. Culemborg: Stenfert Kroese, 1993.
Andrews, K.R. (1987). The concept of corporate strategy. Homewood, IL: Irwin
Ansoff, H.I. (1965). Corporate Strategy. New York: McGraw-Hill
Bain, J. S. (1959). Industrial Organization. New York: Wiley.
Bagozzi, R., “Marketing as Exchange”, Journal of Marketing, Vol. 39, October 1975, pp. 32-9.
Baker, S. & Bass, M. 2003. New Consumer Marketing. West Sussex: John Wiley & Sons Ltd.
Barney, J. B. and Griffin R. W. (1992), “The management of organizations. Strategy, structure, behaviour“, Boston:
Houghton Mifflin Company.
Baumgartner, T., Wunderlich, F., Wee, D., & Jaunich, A. (2012, August). McKinsey & Company. Retrieved from https://www.mckinsey.com/~/media/mckinsey/dotcom/client_service/automotive%20and%20assembly/lighting_th e_way_perspectives_on_global_lighting_market_2012.ashx
Berry, L.L., “Relationship Marketing”, in Berry, L.L., Shostack, G.L. and Upah, G.D. (Eds), Emerging Perspectives of
Services Marketing, American Marketing Association, Chicago, IL, 1983, pp. 25-8.
Blomqvist, R., Dahl, J. and Haeger, T., Relationsmarknadsföring. Strategi och metod för servicekonkurren
(Relationship marketing. Strategy and methods for service competition), IHM Förlag, Göteborg, Sweden, 1993.
Blythe, J., Principles & Practice of Marketing, London: Thomson Learning, 2006
Boone, L.E. & Kurtz, D.L. 1992. Contemporary Marketing. New York: Harcourt Brace \Jovanovich Publishers.
Brandenburg, A. and Nalebuff, B. J. (1995). “The Right Game: Use Game Theory to Shape Strategy,” Harvard Business
Review 73, No. 4. Boston: Harvard Business School.
Calonius, H., “A Buying Process Model”, in Blois, K., and Parkinson, S. (Eds), Innovative Marketing – A European
Perspective, proceedings from the XVIIth Annual Conference of the European Marketing Academy, University of
Bradford, 1988, pp. 86-103
Candelon, F., Creyghton, A., Hong, M., Rubel, H., & Smits, M. (2015, November 12). BCG. Retrieved from Boston Consulting Group: https://www.bcg.com/en-nl/publications/2015/building-materials-accelerating-growth-wintransforming-lighting-industry.aspx

57
Chamberlin, E.H., The Theory of Monopolistic Competition, Harvard University Press, Cambridge, MA, 1933
Chaney, D. (1996). Lifestyles. London: Routledge.
Christopher, M., Payne, A. and Ballantyne, D., Relationship Marketing: Bringing Quality, Customer Service and
Marketing Together, Butterworth, London, 1991.
Clancy, K.J. and Shulman, R.S., The Marketing Revolution. A Radical Manifesto for Dominating the Marketplace, Harper
Business, New York, NY, 1991.
Conklin, D. W., & Tapp, L. (2000). The creative web: A new model for managing innovation. Ivey Business Journal, 64(5),
60-69.
Coulter, M. (2008). Strategic management in action. New Jersey: Pearson Education.
Craninx, P. (2017). Retrieved from IMAP: https://www.moorestephens.be/files/IMAP_Lighting-industry---
NorthEuropean-MA-report-2017.pdf
Cunnigham, M.T. and Roberts, D.A. (1974), “The role of customer service in industrial marketing”, European Journal of
Marketing, Vol. 8, Nr. 1, pp. 15 -- 28.
Dare, C. (2006). The UK tour-operating industry: A competitive analysis. Journal of Vacation Marketing, 6(4), 357-367.
Day, G.S. (1990), Market Driven Strategy: Processes for Creating Value, The Free Press/Macmillan Inc., New York, NY.
Dealtry, T. R., Dynamic SWOT Analysis': Developer's Guide: Intellectual Partnerships, 1992.
Dess, G. G., Lumpkin, G. T. and Eisher, A. B (2006). Strategic Management. Text and cases. International edition.
London: McGraw-Hill.
Downes, L. (1997). Beyond Porter. Context Magazine.
Dorussen, H., Lenz, H., Blavoukos S. (2005). Assessing the Reliability and Validity of Expert Interviews. European Union
Politics, 6(3), 315-337.
Drucker, P. (1964). Managing for Results. London: Harper and Row.
Dulčić, Ž., Gnjidić, V., & Alfirević, N. (2012). From Five Competitive Forces to Five Collaborative Forces: Revised View
on Industry Structure-firm Interrelationship. ProcediaSocial and Behavioral Sciences, 58, 1077-1084.
Fern, E.F. and Brown, J.R. (1984), “The industrial/consumer marketing dichotomy: a case of insufficient justification”,
Journal of Marketing, 48, Spring, 68-77.
Fisk, G., Marketing Systems, Harper & Row, New York, NY, 1967
Flint, D., Woodruff, R. and Gardial, S.F. (1997), “Customer Value Change in Industrial Marketing Relationships. A Call
for New Strategies and Research”, Industrial Marketing Management, Vol. 26 pp. 163 –175.
Flower, E. (2004). “Competition, Technology, and Planning: Preparing for Tomorrow’s Library Environment.”
Information Technology & Libraries 23(2): 67-69.

58
Ford, D., (Ed.), Understanding Business Markets: Interactions, Relationships and Networks, Academic Press, London,
1990.
Friend, G. and Zehle, S. (2009). Guide to business planning. United States: Bloomberg Press Published, New York.
Gay, G. (2002), “Audit risk reduction”, Australian CPA, March, pp. 68-70
Gemunden, H., & Ritter, T. (1997). Managing Technological Networks: The Concept of Network Competence. Elsevier
Science, 294-304
Grönroos, C., “Designing a Long-range Marketing Strategy for Services”, Long Range Planning, Vol. 13, April 1980, pp.
36-42.
Grönroos, C. (1990), Service Management and Marketing – Managing the Moments of Truth in Service Competition,
Lexington Books, Lexington, MA.
Grönroos, C. (1994), “Quo Vadis, Marketing? Toward a Relationship Marketing Paradigm”, Journal of Marketing
Management, Vol. 10 pp 347 - 360.
Grönroos, C. (1994), “From Marketing Mix to Relationship Marketing – Towards a Paradigm Shift in Marketing”,
Management Decision 32/2, MCB University Press.
Grundy, T. (2006). “Rethinking and reinventing Michael Porter’s five forces model.” Strategic Change 15(5): 213-229.
Gulati, R. (1998). Alliances and Networks. Strategic Management Journal, 293-317.
Gummesson, E., “The New Marketing – Developing Long-term Interactive Relationships”, Long Range Planning, Vol. 20
No. 4, 1987, pp. 10-20.
Haberberg, A., Swatting SWOT: Strategic Planning Society, 2000.
Håkansson, H., (Ed.) International Marketing and Purchasing of Industrial Goods, Wiley, New York, NY, 1982
HARRISON, J. S. & St. JOHN, C. H. (2004). Foundations in Strategic Management, (3.Baskı), USA: South Western.
Hawkins, D. I., Best, R. & Coney, (2004), “Consumer behavior: Building validity project”, Journal of Advertising Research,
vol. 40(6), pp. 114-135.
Heide, J., & Miner, A. (1992). The Shadow of the Future: Effects of Anticipated Interaction and Frequency of Contact
on Buyer-Seller Cooperation. Academy of Management Journal, 265-291.
Hertz, S., & Mattsson, L. (2001). Dynamics of Contemporary International Markets-Strategic Alliances and. European
Marketing Academy (EMAC) Conference. Bergen.
Heskett, J.L., “Lessons in the Service Sector”, Harvard Business Review, Vol. 65, March-April 1987, pp. 118-26.
Hitt, M. A., Keats, B. W., & Samuel, D. M. (1998). Navigating in the new competitive landscape: Building strategic
flexibility and competitive advantage in the 21st century. Academy of Management Executive, 22-42.
Hill, C. & Jones G. (2009). Strategic Management Theory: An Integrated Approach, Cengage Learning.

59
Hofer, C.W. & Schendel, D. (1978). Strategy formulation: Analytical concepts. St. Paul, MN: West Publishing Company.
Hollensen S (2003). Marketing Management-A Relationship Approach, Pearson Education Ltd, Essex, England.
Holm, D. B., Eriksson, K., & Johanson, J. (1996). Business networks and cooperation in international business
relationships. Journal of International Business Studies, 1033- 1053.
Homburg, C., & Workman, J. (2000). Fundamental changes in marketing organization: the movement toward a
customer-focused organizational structure. Academy of Marketing Science Journal, 78-459.
Honkanen, P. and Olsen, S., O. (2004), ‘Preference-based segmentation: a study of meal preferences among Norwegian
teenagers’, Journal of Consumer Behavior, Volume 3, Issue 3, pages 235–250.
Hopkinson, J. (1993), “Towards the year 2000 – a personal view of future changes”, Management Services, May, pp.
18-22.
Hubbard, G. & P. Beamish (2011). Strategic management: thinking, analysis, action, Pearson Education Australia.
Hussey, D. (1979). Introducing Corporate Planning. Oxford: Pergamon Press.
Jackson, B.B., Winning and Keeping Industrial Customers. The Dynamics of Customer Relationships, Lexington Books,
Lexington, MA, 1985
Jain, S.C. 1997. Marketing Planning and Strategy. Ohio: South Western College Publishers.
Johnson, G., Scholes, K. and Whittington, R. (2005). Exploring Corporate Strategy, 7th edition. Harlow, US: Financial
Times Prentice Hall
Karagiannopoulos, G. D., Georgopoulos, N., & Nikolopoulos, K. (2005). Fathoming Porter's five forces model in the
internet era. info, 7(6), 66-76.
Katko, T. S. (2006). Road Safety Fatalities, Management, and Policy in Finland, 1970-2003. Public Works Management
& Policy, 11(2), 126-138. http://dx.doi.org/10.1177/1087724X06294066
King, R. K., Enhancing SWOT analysis using TRIZ and the bipolar conflict graph: A case study on the Microsoft
Corporation. Paper presented at the Proceedings of TRIZCON2004, 6th Annual Altshuller Institute, 2004.
Klemperer, P. (1995). Competition when consumers have switching costs: An overview with applications to industrial
organization, macroeconomics, and international trade. The Review of Economic Studies, 62(4), 515-539.
Koch, A. J. SWOT does not need to be recalled: It needs to be enhanced, Available at:
http://www.westga.edu/~bquest/2000/swot1.html, 2000.
Kotler, P. (1967), Marketing Management, Englewood Cliffs, New Jersey; Prentice-Hall, 1st edition.
Kotler, P. (1984), Marketing Management: Analysis, planning and Control, Fifth edition, Prentice-Hall, Englewood Cliffs,
New Jersey.
Kotler, P., “It’s Time for Total Marketing”, Business Week ADVANCE Executive Brief, Vol. 2, 1992.

60
Kotler, P. (2000). Marketing management. Upper Saddle River, NJ: Prentice Hall
Kotler, P. & Keller, K.L. 2006. Marketing Management. New Jersey: Pearson Education.
Levitt, T. (1983), The Marketing Imagination, Free Press, New York, NY.
Louw, L. & Venter, P. 2010. Strategic Management: Developing Sustainability in Southern Africa. Cape Town: Oxford
University Press.
Lynch, R. (2009). Strategic management. England: Pearson Education Limited.
Malcolm, M. And Martin, C. 2003. Marketing: A Complete Guide. New York: Palgrave Macmillan Ltd.
Mason, E. (1949). The current state of the monopoly problem in the U.S. Harvard Law Review, 1265-1285.
Mayer-Wittman, K.M. (1989), “Economic analysis and corporate strategic planning”, Business Economics, April, pp.
2731.
McCarthy, E.J., Basic Marketing, Irwin, Homewood, IL, 1960.
McDonald, M. (1982). The theory and practice of marketing planning for industrial goods in international markets.
Cranfield: Cranfield University.
McDonald, M. (1996). Strategic marketing planning: theory, practice and research agendas. Journal of Marketing
Management, 5-28.
McGarry, E.D., “Some Functions of Marketing Reconsidered”, in Cox, R. and Alderson, W. (Eds), Theory in Marketing,
Richard D. Irwin, Homewood, IL, 1950, pp. 263-79
McKenna, R., Relationship Marketing. Successful Strategies for the Age of the Customer, Addison-Wesley, Reading,
MA, 1991.
Michael E. Dobbs, (2014) "Guidelines for applying Porter's five forces framework: a set of industry analysis templates",
Competitiveness Review, Vol. 24 Issue: 1, pp.32-45, https://doi.org/10.1108/CR-06-2013-0059
Mintzberg, H., Ahlstrand, B. & Lampel, J. (1998). Strategy Safari: A guide through the wilds of strategic management.
New York: Free Press.
Moorman, C., & Rust, R. (1999). The role of marketing. Journal of Marketing, 97-180.
Moorman, C., Deshpandé, R. and Zaltman,G., “Relationships between Providers and Users of Market Research: The
Role of Personal Trust”, Working Paper No. 93-111, Marketing Science Institute, Cambridge, MA, 1993
Moriarty, R. T. (1983). Industrial Buying Behaviour: Concepts, issues and applications. Canada: Lexington Books.
O’Conor, D. (2000). Business planning. Broadstairs, UK: Scitech Educational., available at
http://site.ebrary.com/lib/jonhh/Doc?id=10040407 , 05.04.07.
O'shaughnessy, J. (1984). Competitive marketing: a strategic approach. Boston: Allen & Unwin.
61
Panagiotou, G. (2003). Bringing SWOT into focus. Business Strategy Review, 14(2), 8-10.
Parvatiyar, A. and Sheth, J.N. (1997), “Paradigm Shift in Interfirm Marketing Relationships, Emerging Research Issues”,
Research in Marketing, Vol. 13, 233-256.
Penrose, E. (1959). The Theory of the Growth of the firm. London: Basil Blackwell.
Pfeffer, J., Veiga, J.F. Putting people first for an organizational success. The Academy of Management EXECUTIVE; May
1999; 13, 2; ABI/INFORM Global pg.37
Piirto, R. (1990), ‘‘Global psychographics’’, American Demographics, December, No. 12, pp. 30-36.
Porter, M. E. (1980). Competitive Strategy. New York: Free press.
Porter M. 1991. Towards a dynamic theory of strategy. Strategic Management Journal, 12, 95-117
Porter. (1996). What Is Strategy. Harvard Business Review, 61-78.
Porter, M.E. 2001. Strategy and the Internet. Harvard Business Review, 79(3), 63-78.
Porter, M. E. (1998). Competitive strategy: techniques for analyzing industries and competitors: with a new
introduction, New York: Free Press.
Pust, P., Schmidt, P. J., & Schnick, W. (2015). A revolution in lighting. Nature Materials, 454-458.
Rapp, S. and Collins, T., The Great Marketing Turnaround, Prentice-Hall, Englewood Cliffs, NJ, 1990.
Reichheld, F.E. and Sasser, Jr, W.E., “Zero Defections: Quality Comes to Service”, Harvard Business Review, Vol. 68,
September-October, 1990 pp. 105-11.
Richardson, Jr. J. V. (2006). The library and information economy in Turkmenistan. IFLA Journal, 32(2), 131-139.
http://dx.doi.org/10.1177/0340035206066410
Rivard, S. Raymond L., Verreault D. (2006). “Resource-based view and competitive strategy: An integrated model of the contribution of information technology to firm performance.” Journal of Strategic Information Systems 15(1): 2950. Root, R. (1998). Entry Strategies for International Markets – revised and expanded, San Francisco, US: Jossey-Bass.
Rumelt, R. P. (1984). Towards a strategic theory of the firm. Competitve Strategic Management, 556-570.
Sanchez, R. and Heene, A. (1997), “Managing for an uncertain future: a systems view of strategic organizational
change”, International Studies of Management & Organization, Vol. 27 No. 2, pp. 21-42
Sanderson, S. W., Simons, K. L., Walls, J. L., & Lai, Y.-Y. (2008). Lighting Industry: Structure and Technology in the
Transition to Solid State. Industry studies (pp. 1-64). Boston: Alfred P. Sloan Foundation.
Schnaars, S.P. (1998). Marketing strategy. New York: Free Press.
Shapiro, C. (1989). The theory of business strategy. Journal of Economics, 125-137.
Shaw, V. (1995), “Successful Marketing Strategies, A Study of British and German Companies in the Machine Tool
Industry”, Industrial Marketing Management, Vol. 21, Issue 4 pp 329-339.

62
Sheth, J.N., Gardner, D.M., Garett, D.M. (1988). Marketing Theory: Evolution and Evaluation, New York: John Wiley &
Sons, Inc.
Shilei, L., & Yong, W. (2009). Target-oriented obstacle analysis by PESTEL modelling of energy efficiency retrofit for
existing residential buildings in China’s northern heating region. Energy Policy, 37, 2098-2101.
http://dx.doi.org/10.1016/j.enpol.2008.11.039
Senauer, B. n., Kinsey, J. n., & Asp, E. e. (1991), ‘Food trends and the changing consumer’, In St. Paul, Minn., U.S.A.:
Eagan Press, c1991.
Slater, S. F., & Olson, E. M. (2002). A fresh look at industry and market analysis. Business Horizons, 45(1), 15-22.
Srivastava R.M., Verma, S. Strategic Management: Concepts, Skills and Practices
Teece, D. J. (1984). Economic analysis and strategic management. California Management Review, 87-110.
Teece, D. J., Gary, P., & Shuen, A. (1997). DYNAMIC CAPABILITIES AND STRATEGIC MANAGEMENT. Strategic
Management Journal, 509-533.
Thurlby, B. (1998). Competitive forces are also subject to change. Management decision, 36(1), 19-24.
Todd, S., Lawson, R. and Faris, F. (1996), “A Lifestyle Analysis of New Zealand Consumers”, Asia Pacific journal of
Marketing and Logistics, pp. 30- 47.
Turnbull, P.W., and Valla, J-P. (Ed.), Strategies for International Industrial Marketing, Groom Helm, London, 1986.
Turner, S., Tools for Success: A Manager’s Guide, London: McGraw-Hill, 2002.
Urban, G., & Star, S. (. (1991). Advanced Marketing Strategy: Phenomena, Analysis and Decisions. Englewood Cliffs:
Prentice-Hall.
Valentin, E.K. (2001). SWOT analysis from a resource-based view. Journal of Marketing Theory and Practice, 9, 54-68.
Van Waterschoot, W. and Van den Bulte, C., “The 4P Classification of the Marketing Mix Revisited”, Journal of
Marketing, Vol. 56, October 1992, pp. 83-93.
Vorthman. R.G. Jr (2008). Toward best-practices program management. Sigma 8. Noblis. Falls Church.
Wang, W., Chang, P. (2009). “Entrepreneurship and strategy in China: why ‘Porter's five forces’ may not be”, Journal
of Chinese Entrepreneurship, ISBN: 1756-1396, Vol. 1 No.1, pp.53-64.
Wells, W. and Tigert, D. (1971), ‘‘Activities, interests, and opinions’’, Journal of Advertising Research, Vol. 11 No. 4, pp.
27-35.
Webster, Jr, F.E., “The Changing Role of Marketing in the Corporations”, Journal of Marketing, Vol. 56, October 1992,
pp. 1-17.
Weihrich, H., “The TOWS matrix—A tool for situational analysis”, Long Range Planning, Vol. 15(2): 54- 66, 1982.

63
Wernerfelt, B. (1984). A resource-based view of the firm. Strategic Management Journal, 171-180.
Wheelen, T. L., & Hunger, J. D., Strategic Management and Business Policy (5th ed.), Reading, MA: Addison-Wesley,
1998.
Williams, G. (1994). The airline industry and the impact of deregulation.
Wind, Y. and Webster, F. (1972), “On the Study of Industrial Buying Behavior: Current Practices and Future Trends”,
Industrial Marketing Management, Vol. 1, nr 4, pp 411 –416.
Yuksel, I. (2012). Developing a Multi-Criteria Decision-Making Model for PESTEL Analysis. International Journal of
Business & Management, 7 (24).
Zaltman, G. and Moorman, C., “The Role of Personal Trust in the Use of Research”, Journal of Advertising Research,
Vol. 28, October-November 1988, pp. 16-24.
Zikmund, W.G., & d’Amico, M., Effective Marketing: Creating and Keeping Customers, St. Paul, MN: West Publishing
Company, 1995.
Zhu, D., & Humphreys, C. J. (2016). Solid-State Lighting Based on Light Emitting Diode Technology. In M. D, A.-A.
ElGomati, & M. S. Zubairy, Optics in our time (pp. 87-118). Springer, Cham.

64
Appendix 1
Interview protocol
This protocol is used as a guide by the researcher when conducting interviews. The protocol provides continuity of
questions asked across several interviews. The proposed interview scheme is used to define the data collection
procedure of this thesis research project. Data collection is focused on gathering insights for PESTEL analysis, SWOT
analysis and Expert interviews. Due to the semi-structured nature of the interview, the questions are meant as a
guidance and are not supposed to be articulated to their full extend. Prior to the interview the interviewee was
identified by searching for essential background information. An email was sent with a short explanation of the
research project and the contact details of the interviewer. The time and date of interview were arranged, and
interview questions was sent up front. Additionally, introductive and closing questions have been incorporated in the
interview protocol in order to contextualize the study case, identify background conditions and collect overall
conclusions and opinions from the interviewees.
Interview’s structure and questions
Opening
Introduction of myself and of the thesis project
Methodology
Interview objectives
Confidentiality
The researcher writes contextual interview notes. Only the researcher will access the notes. The researcher will keep the names of participants anonymous in the report. Notes will not be archived after this project. Letter of confidentiality can be signed upon request.
PESTEL analysis: Questions
Political environment
What are the governmental policies aiding the transition towards LED based lighting?
What are the sovereign risks (changes in tax laws and regulations on foreign trade) in EU that can affect the lighting
industry?
What are the security risks (diplomatic relations, trade treaties and economic sanctions) in EU that can affect the
lighting industry?
What regulations must a lighting company follow in EU, and have they changed in the last 5,10, 20 years?
What are the incentives for foreign investments or on the other hand, disincentives to engage in foreign production in
EU?
Are the political governments stable across EU and how does this affect attractiveness of a market?
Economic environment
What taxations must a lighting company follow in EU?
How do the following economic forces affect a lighting company’s activities in the market place? Currency
rates
Raw material prices
Interest rates
Inflation rates
How do variations in Gross Domestic Product (GDP) of EU affect the lighting industry?
Social environment
How do growing or slowing down population demographic affect the business of lighting companies?

How do consumer attitudes and beliefs in EU regarding LED based lighting impact the lighting industry?
What role do cultural trends in EU play in the business of a lighting company?
How important is the brand image and advertisements of a company in lighting industry? What
role do lifestyle trends in EU play in the business of a lighting company?
Technological environment
What are the emerging technologies in lighting industry with regards to LED?
How is the R&D spending of companies in the lighting industry?
What are the technological advancements needed in LED based lighting to further increase its usage?
What is the role of production efficiency in the lighting industry?
How do patents and licenses play a role in the lighting industry? What
is the role of quality and pricing in the lighting industry?
Environmental environment
What are the environmental regulations in EU with respect to LED based lighting?
What are the ecological regulations in EU with respect to LED based lighting? How
does LED based lighting contribute to sustainability?
Legal environment
What is the current and future legislations in EU with regards to LED based lighting?
What are the governmental regulations and policies in EU that affect the entry of foreign companies? What
are the health and safety restrictions when it comes to LED lighting?
SWOT analysis: Questions
Strengths
What is Signify’s unique selling proposition?
What are the advantages Signify has over its rivals?
What are Signify’s assets and which of those are the strongest?
Does Signify have a strong customer base?
What resources does Signify have readily available?
What do customers love about Signify’s product(s)?
Weaknesses
What do customers dislike about Signify’s product(s)?
What is the competition doing better than Signify?
What resources does Signify lack?
What’s the main area that Signify needs to improve on immediately? What
factors are making Signify lose sales?
Opportunities
What changes in government policy related to LED lighting will bring in new opportunities for Signify?
What advancements in LED technology will bring in new opportunities for Signify?
What is the lighting industry market missing and can Signify provide that missing link for the customers? Will
natural causes like weather and climatic changes give you the competitive edge?
How is the lighting market changing?
Will changes in social patterns, population profiles, lifestyle changes etc. bring in new opportunities for Signify? What
would be the ideal opportunity for Signify?
Threats
Will changes in government regulations negatively impact Signify’s business?
Has there been an increase in competition lately? Where and why?
What are the costs of Signify’s resources? Is it affecting the bottom line?

66
Are there potential competitors who can steal market share from Signify? If so, why?
Are Signify’s key staff members satisfied with their wages and other benefits? Are they poached by rival companies?
Are Signify’s suppliers reliable and how crucial is their role?
Are quality standards for Signify’s products or services changing? Could
any of Signify’s weakness seriously threaten its business?
Expert interviews: Questions
1. Is the LED lighting industry moving towards the value proposition of quality of light from only
2. Is quality performance the primary differentiating factor in LED lighting?
3. Who are the key competitors to Signify and what is their current strategy and market share?
4. What are the key success factors for Signify?
5. Do any of Signify’s product features have unique selling propositions?
6. Who holds the major market share in the low-end solutions of LED lighting?
7. Is it better to have broad or narrow portfolio of products when it comes to Signify?
8. Has the ban on incandescent lamps helped Signify grow its business?
9. How are Signify’s customers classified and what are each of their requirements?
10. What are the application segments in LED lighting that Signify is strong footed and weak footed?
11. How important is strategic partnerships when it comes to LED lighting?
12. What is Signify’s vision for 2021 and how does it plan to increase its market share?
13. What are the strategies of Signify for each of its application segments?
Ending
Did I miss something important, could you elaborate on that? What
did you think of the interview?


![05[2] Strategy competitors, competitive rivalry, competitive behavior, and competitive dynamics · PDF fileDefine competitors, competitive rivalry, competitive behavior, and competitive](https://img.pdfslide.net/doc/110x75/5aa5b2eb7f8b9ac8748d8018/052-strategy-competitors-competitive-rivalry-competitive-behavior-and-competitive.jpg)