Embed Size (px)
Citation preview
Identifying freshwaterecosystems of nationalimportance for biodiversity
Criteria, methods, and candidate list ofnationally important rivers
W. Lindsay Chadderton, Derek J. Brown, and R. Theo Stephens
DISCUSSION DOCUMENT, DECEMBER 2004
Published by
Department of Conservation
PO Box 10-420
Wellington, New Zealand
Cover: A highly natural brown-water stream on Stewart Island, showing intact riparian linkages and
a diversity of in-stream habitat. (Photo by L. Chadderton.)
This report was prepared for publication by DOC Science Publishing, Science & Research Unit;
editing and layout by Jaap Jasperse. Publication was approved by the Manager, Science & Research
Unit, Science Technology and Information Services, Department of Conservation, Wellington.
© Copyright December 2004, New Zealand Department of Conservation
ISBN 0-478-22589-X
In the interest of forest conservation and free international access, DOC Science Publishing supports
paperless electronic publishing: see http://www.doc.govt.nz > Publictions > Science and research
When printing, recycled paper is used wherever possible.
Disclaimer: This discussion document was prepared specifically for the Waters of National
Importance sub-project of The Sustainable Development Programme of Action for Freshwater (or
�Water Programme of Action�). It is a working draft that presents a proposed methodology and a
preliminary list of candidate rivers of national importance based on their biodiversity values. This list
needs to be further refined, firstly because some data quality and systems problems could not be
resolved within reporting time frames; and secondly following the public consultation and peer
review during 2005. The report does not define waters of regional or local importance, so should
not be interpreted at those scales. The authors should be consulted prior to formal citation of, or
reliance on, this report.
CONTENTS
EXECUTIVE SUMMARY 5
1. Introduction 9
1.1 New Zealand�s natural heritage 9
1.2 Policy context (background) 10
1.3 Process for identifying Waters of National Importance (WONI) 10
2. Methods 13
2.1 Biogeographic framework 13
2.2 Scale of WONI assessment 14
2.3 Calculating Natural Heritage Value scores 14
2.4 Characterising environment 16
2.5 Determining anthropogenic pressure 16
2.6 Special features 18
2.7 Connectivity/buffering function 21
2.8 Developing a candidate list 21
3. Results 23
3.1 Component variables 23
3.2 Deriving a candidate list 26
3.3 Candidate list of nationally important rivers 32
4. Discussion 36
4.1 Assessment framework 36
4.2 The candidate list of rivers of national importance 37
4.3 Strengths of the WONI assessment 39
4.4 Weaknesses of the WONI assessment 40
5. Acknowledgements 42
6. References 43
(Combined for main text and Appendix 1 )
Appendix 1. Candidate list 49
Map explanations 50
Table layout 51
Biogeographic units 52
Auckland 52
Banks Peninsula 54
Bay of Plenty 56
Canterbury 58
Clutha 62
Coromandel 64
East Cape 66
Fiordland 68
Grey-Buller 70
Hawke�s Bay 72
Manawatu-Wairarapa 74
Marlborough 76
Mokau 78
Motueka-Nelson 80
Northland�eastern 82
Northland�northern 84
Northland�western 86
Northwest Nelson-Paparoa 88
Otago Peninsula 90
Palliser-Kidnappers 92
Southland 94
Stewart Island 96
Taieri 98
Taranaki 100
Waikato 102
Waitaki 104
Wanganui-Rangitikei 106
Wellington 108
Westland 110
5Discussion document, December 2004
E X E C U T I V E S U M M A R Y
Conservation management of freshwater is a complex activity. The
responsibility is fragmented across different agencies, and no single agency is
accountable for the overall condition of freshwater natural heritage. However,
pressures on New Zealand freshwater ecosystems are intensifying: water is
increasingly in demand for irrigation and energy generation; water quality is
declining as a result of increasing nutrient loading associated with changes in
land use; and with the continued spread of introduced pest species. The
Sustainable Development Programme of Action for Freshwater was established
by Government to reconcile the competing demands for freshwater. A sub-
project involves identifying Waters of National Importance (WONI) for tourism,
irrigation, energy generation, industrial uses, recreation, natural heritage and
cultural heritage. The Department of Conservation (DOC) was given the task to
identify a candidate list of nationally important aquatic systems for freshwater
natural heritage (natural heritage being divided into physical and biological
diversity). This candidate list may assist decision making about the use and
allocation of freshwater resources.
The present report describes the results and process used to identify the
minimum set of catchment units that best represent the full range of
indigenous biodiversity, in New Zealand�s freshwater riverine ecosystems.
Our assessment caters for two contrasting objectives:
� Maintenance of viable populations of all indigenous freshwater species and
subspecies.
� Protection of a full range of remaining natural freshwater habitats and
ecosystems.
Our analysis was based on river catchment units as defined by the river
catchment network, developed as part of the River Environment Classification
(REC)*. A total of 4706 river catchment units were defined at five hierarchical
levels, representing catchments or major tributaries nested within larger
catchments. The candidate list of Waters of National Importance was drawn
from this set of 4706 river catchment units.
Because the data describing the distribution of freshwater species and
communities (i.e. actual biodiversity) are inadequate, an assessment based
primarily on biotic databases was not possible. Instead, we derived surrogate
biodiversity information from environmental, biogeographic and human
disturbance information: these are known to determine much of the spatial
pattern in the distribution of native biodiversity. Thus our candidate list is
founded on the assumption that biogeographic, environmental, and disturbance
patterns collectively predict ecological variation.
We characterised environmental pattern by first dividing New Zealand into 29
biogeographic units based around catchment boundaries: 15 in the North
Island, and 13 in the South Island plus Stewart Island. Our decision to separate
areas into biogeographic units was made on the basis that variation in the
* REC was published in 2002 by T.H. Snelder and B.J.F. Biggs in the Journal of the American Water
Resources Association 38: 1225�1240.
6 Chadderton et al. �Creating a candidate list of Rivers of National Importance
character of freshwater ecosystems reflects both the responses of individual
species to contemporary environments, and the effects of historic disturbance
and recolonisation events. Glaciation, sea level change and volcanic eruptions
are known to be major determinants of biological distributions, particularly of
species with limited dispersal ability (comprising many freshwater organisms).
The biogeographic framework identifies geographic units that are likely to have
experienced similar physical disturbance regimes, and have shared source
populations and pathways for recolonisation, or geographic barriers to the
dispersal of freshwater biota.
We then used river classes defined within REC to characterise environmental
variance within river catchments. These river classes represent finer-scale
environmental variation, known to influence freshwater community
composition. Hence each river class should contain unique elements of
biodiversity (i.e. distinctive communities or species assemblages): capturing a
full range of environments (river classes) should therefore ensure
representation of a full range of biological diversity.
Catchment units were then ranked according to the degree of human-induced
disturbance pressure, on the basis that the least disturbed systems have retained
most indigenous biodiversity and are therefore the highest priorities for
protection. Human disturbance pressure was calculated by combining seven
pressure measures:
� percentage natural land cover
� urbanisation
� land use intensity
� fish passage
� downstream dam effects
� exotic fish
� point source pollution.
We developed a single natural heritage score for each catchment unit by
combining:
� measures of environmental representativeness, and pressure
with
� information on the presence of threatened species
and
� connectivity to nationally important wetlands, estuaries or lakes.
This index of natural heritage value was used to rank each catchment unit within
its biogeographic unit.
Conservation of at least the one catchment unit of greatest natural heritage value
(large, diverse and little-modified) within each of these 29 biogeographic units
is one conceptually simple and moderately efficient way to sustain a range of
New Zealand�s natural freshwater biological diversity. However, this approach
was tested and found to be inadequate because it accounted for an average of
32% of the environmental and ecological variance (indicated by the number of
river classes represented) within a biogeographic unit.
7Discussion document, December 2004
In order to make the candidate list more representative, we developed a list of
the minimum set of least disturbed catchments within each biogeographic unit
required to protect the full range of river classes. We compared this with a
second list of the top ten systems within each biogeographic unit ranked by
natural heritage value score, and a third list of catchments ranked by their
combined threatened species scores. From these comparisons, a final candidate
list of catchment units was derived on the basis of one or both of two rules:
1. The site was listed in the minimum set required for representation of 100% of
the river classes, and listed among the top ten sites ranked by natural
heritage value within the biogeographic unit;
and/or:
2. The site contained special features (i.e threatened species, floodplain
forests), or was connected to a nationally important wetland, lake or estuary.
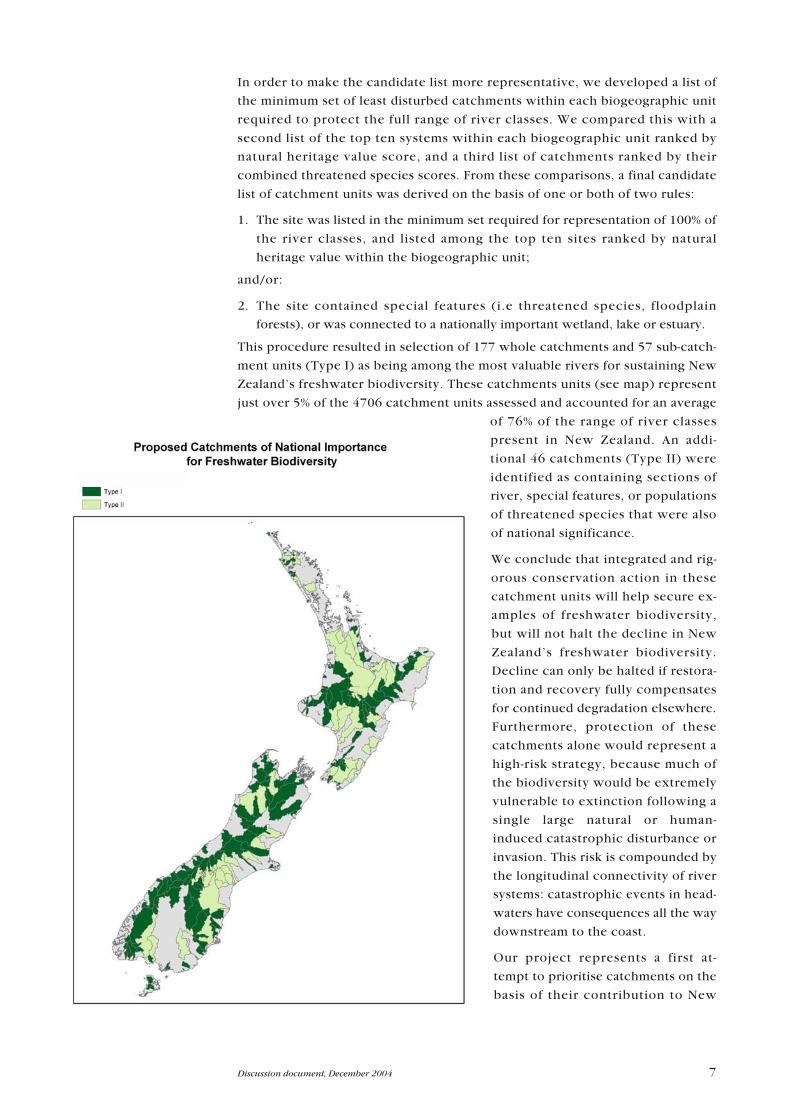
This procedure resulted in selection of 177 whole catchments and 57 sub-catch-
ment units (Type I) as being among the most valuable rivers for sustaining New
Zealand�s freshwater biodiversity. These catchments units (see map) represent
just over 5% of the 4706 catchment units assessed and accounted for an average
of 76% of the range of river classes
present in New Zealand. An addi-
tional 46 catchments (Type II) were
identified as containing sections of
river, special features, or populations
of threatened species that were also
of national significance.
We conclude that integrated and rig-
orous conservation action in these
catchment units will help secure ex-
amples of freshwater biodiversity,
but will not halt the decline in New
Zealand�s freshwater biodiversity.
Decline can only be halted if restora-
tion and recovery fully compensates
for continued degradation elsewhere.
Furthermore, protection of these
catchments alone would represent a
high-risk strategy, because much of
the biodiversity would be extremely
vulnerable to extinction following a
single large natural or human-
induced catastrophic disturbance or
invasion. This risk is compounded by
the longitudinal connectivity of river
systems: catastrophic events in head-
waters have consequences all the way
downstream to the coast.
Our project represents a first at-
tempt to prioritise catchments on the
basis of their contribution to New
8 Chadderton et al. �Creating a candidate list of Rivers of National Importance
Zealand freshwater biodiversity. It will continue to be refined as data sets and
systems are improved, for example by developing analyses undertaken at the
scale of reaches (where each reach is part of a fully defined network) rather than
at the scale of whole catchments arranged in a fixed hierarchy. The present ap-
proach is a precursor to the Natural Heritage Management Systems (NHMS) that
the Department of Conservation (DOC) is developing to support and prioritise
its conservation management and advocacy functions. These tools are being de-
veloped as part of a broader government agency partnership between DOC, the
Ministry for the Environment (MfE), regional councils, and iwi.
This work may be cited as: Chadderton, W.L; Brown, D.J.; Stephens, R.T. 2004: Identifying freshwater
ecosystems of national importance for biodiversity: criteria, methods, and candidate list of
nationally important rivers. Discussion document. Department of Conservation, Wellington, 112 p.
9Discussion document, December 2004
1. Introduction
1 . 1 N E W Z E A L A N D � S N A T U R A L H E R I T A G E
The New Zealand landscape is geologically diverse, tectonically and volcanically
active, and subject to climatic extremes. It has also experienced biological
isolation from other large landmasses for 80 million years. These factors
combine to produce a diverse and distinctive biota occupying mountainous
terrain, dissected by an abundance of streams and rivers, lakes, wetlands,
ground waters, geothermal features and estuaries�these comprise New
Zealand�s freshwater natural heritage. Our natural heritage can be divided into
abiotic or physical diversity (i.e. geological and environmental) and biological
diversity. Abiotic diversity represents the physical attributes that characterise
New Zealand�s landscape, and include internationally renowned features such as
the volcanic geysers and mud fields of Rotorua, braided shingle rivers of the
South Island, Canterbury glacial lakes, Pupu Springs, cave and karst systems of
Northwest Nelson-Paparoa, and Waitomo.
The 1992 Convention on Biological Diversity defined biological diversity as �the
variability among living organisms from all sources including, inter alia,
terrestrial, marine and other aquatic ecosystems and the ecological complexes
of which they are part; this includes diversity within and between species and of
ecosystems.� New Zealand�s freshwater biological diversity is less well known
than its terrestrial counterpart, but it is just as ecologically and internationally
significant. Isolation over geological time, during which our rich and dynamic
landscapes developed, has led to high levels of endemism, as well as the
persistence of many rare and several primitive groups (Boothroyd 2000).
Strong affinities to South America and Australia at genus and family levels reflect
historic Gondwanaland connections. Divergence of localised endemics is
common: these species are native only to New Zealand, and are restricted to
small localised areas measured in tens of kilometres, (e.g. Banks Peninsula).
Divergence partly also reflects New Zealand�s turbulent geological history and
the numerous catastrophic disturbance events (e.g. the Taupo eruption) that
have further isolated communities.
Freshwater rivers provide habitat for over 38 species of native freshwater fish,
for 38 native aquatic plant species, and for hundreds of aquatic and semi-aquatic
invertebrate species. In addition, there are over 160 species of water birds,
including five endemic species that spend all or crucial parts of their lifecycles
on our rivers (O�Donnell in press).
For many New Zealanders, these places, and the creatures that live in them, are
taken for granted as part of our national life. However, most of New Zealand�s
freshwater ecosystems have already been degraded to some degree (Winter-
bourn 1995) and are under increasing pressure from land use intensification,
demand for water and invasion by exotic species. The majority of these iconic fresh-
water systems exist today because they are actively protected, either through
the Resource Management Act (1991) or because they are part of the public
conservation estate. Loss or degradation of any of them diminishes both the natural
biodiversity of our archipelago, and the quality of our lives as New Zealanders.
10 Chadderton et al. �Creating a candidate list of Rivers of National Importance
1 . 2 P O L I C Y C O N T E X T ( B A C K G R O U N D )
New Zealand government departments are developing an integrated approach
to freshwater resources management as part the Government�s �Sustainable
Development Programme of Action for Freshwater� (Department of Prime
Minister and Cabinet, January 2003). The programme covers three themes:
Water Quality, Water Quantity, and Waters of National Importance (WONI).
The WONI project requires several government departments to identify Waters
of National Importance in respect to their values for natural heritage
conservation, recreation, culture and heritage, irrigation, energy generation,
industrial use and tourism. This project assumes that nationally important
values need to be secured at a place in order to achieve a nationally agreed
policy goal (expressed in legislation or Cabinet-approved policy) and
recognises the competing demands for water use in New Zealand.
The main aim of the WONI project is to develop candidate lists of water bodies
that can contribute to a process seeking to sustain national important
freshwater assets. The Department of Conservation was given the task to
identify aquatic systems of national importance for freshwater natural heritage,
specifically indigenous biological and physical diversity. For biological diversity,
the aim is to protect the full range of remaining biodiversity (species, natural
habitats and ecosystems) and maintain viable populations of all indigenous
species and subspecies. This goal is derived from, and consistent with, the
requirements of the New Zealand Biodiversity Strategy (Anonymous 2000), and
Reserves Act 1977. The latter requires �the preservation of representative
samples of all classes of natural ecosystems and landscapes which in the
aggregate gave New Zealand its own recognisable character�.
This report1 addresses the biodiversity component of the WONI project. It
focuses on river systems as this was the most immediate priority within the
multi-agency WONI working party; limited resources and short time frames
precluded an analysis of other freshwater ecosystems.
1 . 3 P R O C E S S F O R I D E N T I F Y I N G W A T E R S O FN A T I O N A L I M P O R T A N C E ( W O N I )
The conservation of biodiversity requires avoidance of biological information
loss, from any of three mutually exclusive categories of information, namely:
� Properties or Components: equivalent to inter-species and intra-species
genetic diversity
1 The outputs of this WONI project are the first step in a larger programme of work by the
Department of Conservation, called the Natural Heritage Management Systems. This NHMS
programme, in conjunction with the Freshwater Heritage Strategy, will help direct and prioritise
the Department�s freshwater management and advocacy functions. The freshwater component of
NHMS will be developed as a broader government agency partnership between DOC, MfE, regional
councils, and iwi. The databases and results presented in this report will therefore continue to be
refined as data sets, models, and the spatial resolution are refined.
11Discussion document, December 2004
� Patterns: equivalent to the interactions between components (or the
relationships among biota and between the biota and their
environment), which in combination, yield biological pattern
� Processes: ecological system dynamics and resultant ecosystem structure
(Richmond 1999).
Waters of national significance for biodiversity can be identified through
consensus of opinion, or by technical assessment based on data, criteria and
models.
Consensus approaches achieve buy-in through participation and hence broad-
based ownership of the result. They are also relatively quick, technically
straightforward and cheap. The disadvantages are:
� Absence of transparency in what attributes of the resource lead to its
recognition
� Inability to easily repeat the assessment given different assumptions, and
with new or improved information
� Whether or how to weight opinions from people with variable values,
expertise and credibility
� Limited or biased geographic knowledge of participants.
Thus major and irresolvable credibility may be a major problem.
The alternative is to make technical assessments. Such approaches combine
verifiable resource data, explicit models and criteria based on transparent and
testable assumptions. A well designed technical approach is fully repeatable,
allowing the impact of new data or different assumptions to be explored. Thus
technical approaches offer the basis for addressing credibility issues, learning
and continual refinement. The disadvantages lie in the data volumes, mathematical
models and the complexities of interacting assumptions. They may render the
process leading to the results inaccessible to people who do not engage with the
technical nature of the methodology. This is compounded by the fact that
resource data can rarely offer more than a partial and biased description of the
resource. Moreover, the models and criteria used are inevitably incomplete,
simplistic and generalised depictions of real relationships and interactions.
Acceptance of results may therefore be compromised, and some people may be
inclined to reject the overall result on the basis of one particular flaw.
We chose to adopt a technical approach as it offered a comprehensive
assessment, greater consistency and objectivity; and also because it presents
opportunities for future learning, improvement and exploration of alternative
assumptions.
Prior to the WONI project the Department undertook an extensive review of
current literature, classifications, and criteria with a view of developing a
process for identifing a minimum set of nationally important freshwater
ecosystems that would encompass the full range of New Zealand�s biodiversity
(Collier et al. 2003). The review concluded that any framework or process
should account for variability at the local environment scale (river reach) that is
known to determine aquatic community composition (Vinson & Hawkins 1998;
Stephens et al. 2002), and historic (biogeographic) processes that are known to
have influenced large-scale biotic patterns (McDowall 1996; Leathwick et al.
2003; Harding & Winterbourn 1997; Townsend et al. 2003).
12 Chadderton et al. �Creating a candidate list of Rivers of National Importance
Here we identify the set of nationally important water bodies for biodiversity
protection by combining environmental and biogeographic frameworks with
information about the distribution of threatened species, and communities, and
a range of human pressure variables that collectively indicate the naturalness of
the system. If representative and ecologically viable units of the full range of
environments and species within each biogeographic units are protected, then it
should be possible to conserve a full range of what remains of New Zealand�s
freshwater biodiversity for future generations. Successful conservation of this
range will at least set a base level at which the decline in our natural freshwater
biodiversity will be halted.
Our approach is based on the following principles:
� The least disturbed waters have retained most natural biodiversity and are
therefore the highest priorities for protection if further loss is to be
minimised.
� All river environment types or hydro-classes must be represented among
those protected, in order to retain the full range of natural habitat and
ecosystems.
� Remaining threatened native species or community types where known also
need to be protected, so that viable populations of all indigenous species and
subspecies can be maintained.
13Discussion document, December 2004
2. Methods
2 . 1 B I O G E O G R A P H I C F R A M E W O R K
Existing spatially explicit freshwater classifications (e.g. REC�Snelder & Biggs
2002; Lotic Ecoregions�Harding & Winterbourn 1997) do not account for
historic determinants of contemporary biodiversity patterns (Harding &
Winterbourn 1997). These determinants include large-scale disturbance events
like glaciation, and volcanic eruptions that devastate biological communities;
and the presence of colonisation pathways and barriers (e.g. alpine ridgelines,
coastal straits) that have affected the ability of surviving taxa to reoccupy
former or habitable ranges. A biogeographic framework was therefore
developed to delineate areas likely to contain similar freshwater assemblages as
a result of shared large-scale historic events (both temporal and spatial) that
have shaped freshwater community compositions (Leathwick et al. 2003).
We used data describing the history of major disturbances (principally the last
glacial maximum and/or volcanic deposition), and the presence of geographic
barriers to recolonisation or dispersal pathways, to define a series of the
biogeographic units. Four sources of evidence were used:
� Distributions of aquatic biota as recorded in a range of databases, with
particular emphasis on the distributions of non-diadromous fish as recorded
in the New Zealand Freshwater Fish Database.
� Evidence of genetic similarity between different populations of various
freshwater species, as determined from analyses using molecular genetics
tools.
� Evidence of physical disturbances affecting New Zealand�s landscapes with
particular emphasis on the Last Glacial Maximum, volcanic eruptions in the
central North Island, and seismic activity (particularly in mountainous parts
of the South Island).
� Presence of regional-scale barriers or pathways to dispersal including
contiguous multi-catchments� alpine ridgelines, areas of nearshore deep
marine water (> 120 m), straits and shared flow plains.
The final biogeographic framework was derived from consensus among a panel
of freshwater scientists with representation from most of New Zealand�s
freshwater science providers (see Leathwick et al. 2003). It represents a first
rapid attempt to classify New Zealand freshwater ecosystems according to their
biogeographic history. The biogeographic units are conservative, and based on
either biological evidence or inferred from physical evidence of isolation or
catastrophic disturbance. There are good biotic data to support the separation
of biogeographic units over most of the South Island. Biological evidence for
separation of some North Island units is limited, despite strong physical
evidence of isolation and/or catastrophic disturbance. This is because we have
limited genetic and distributional data for obligate freshwater species (e.g. non-
diadromous fish and crustaceans, molluscs) whose entire life cycle is spent in
freshwater. Such species provide the best surrogate measures of the minimum
spatial scales required for conservation of entire freshwater ecosystems (Abell
et al. 2000) as their distribution patterns more closely correspond to
14 Chadderton et al. �Creating a candidate list of Rivers of National Importance
catchments. Geographic evidence of isolation and catastrophic disturbance was
therefore a stronger driver in the development of some North Island units. Even
at the scale of our biogeographic classification, it must be noted, that some
groups of poor-dispersing species (crustaceans and molluscs) can vary at finer
spatial scales that correspond to first-order catchment units, or even to springs
within a unit (Ponder et al. 1996). Thus our biogeographic classification resolution
is more likely to under-estimate than over-estimate actual biological variation.
2 . 2 S C A L E O F W O N I A S S E S S M E N T
The WONI assessment was undertaken at the river catchment unit scale.
Catchment units were based upon the River Environment Classification (Snelder
& Biggs 2002) modified to define whole-river catchments (i.e., headwater to
river mouth).
� Sub-catchments greater than approximately 2000 hectares entering a major
regulated lake were split at the point where they entered the lake (major
lakes included, roughly from north to south: Taupo, Ohakuri, Atiamuri,
Whakamaru, Maraetai, Arapuni, Karapiro, Waikaremoana, Tekapo, Pukaki,
Ohau, Benmore, Aviemore, Waitaki, Dunstan, Roxburgh, Te Anau,
Manapouri).
� Sub-catchments greater than approximately 100,000 hectares were split at
points where major tributaries entered the mainstem river.
� Sub-catchments were further broken where tributary catchments still
exceeded approximately 100 000 hectares.
The boundaries of the underlying whole catchment were preserved so that each
new sub-catchment was a polygon overlying a portion of the underlying parent
polygon. This created a nested hierarchy in which generations of sub-
catchments overlay each other, producing a total of 284 sub-catchments
(including all generations of sub-catchments) for the three main islands of New
Zealand (for further detail see Norton et al. 2004). Each river system or sub-
catchment was given its own unique identifier.
Rivers with catchment size under 100 ha were excluded from the assessment to
reduce the data set from over 10,000 possible catchments to a more tractable
4706 catchments. We assumed that catchments <100 ha would not be consid-
ered nationally important in other WONI assessments (particularly irrigation,
energy generation or industrial use) and hence they would not be relevant to the
WONI ranking process. We note however, that some of these smaller catch-
ments will contain nationally important natural heritage values.
The WONI analysis included all large inshore islands but did not consider the
Chatham or Kermadec Islands, or the New Zealand sub-antarctic islands.
2 . 3 C A L C U L A T I N G N A T U R A L H E R I T A G E V A L U E S C O R E S
To determine a candidate list of rivers and lakes we need to cater for two
contrasting objectives:
1. Maintenance of viable populations of all indigenous species and subspecies.
15Discussion document, December 2004
2. Protection of a full range of remaining natural habitats and ecosystems.
The first objective requires that rivers are ranked according to their overall
�natural heritage value� and to the vulnerability of key natural features to loss.
The second objective requires construction of a list of catchments ranked
according to the cumulative contribution each progressively makes to the full
range of New Zealand�s freshwater-dependent natural heritage. The two tasks
differ in that the first is concerned primarily with catchment naturalness,
whereas the latter is context-dependent: it is determined by how much new
biodiversity a catchment unit contributes to that represented in the set of
catchments already selected for the list.
The information required to develop this list includes data describing:
� A classification of river reaches to indicate what each catchment contributes
to the range of environments represented (i.e. the river reach classification
within the River Environment Classification).
� The quantity of biodiversity likely to be present (catchment area, number of
river reach types present, catchment distinctiveness).
� The degradation pressure on the catchment as a surrogate for naturalness
(land clearance; land use intensity; discharges; dams; exotic fish).
� The vulnerable natural features present (threatened species; natural
floodplain forest; national or internationally significant features).
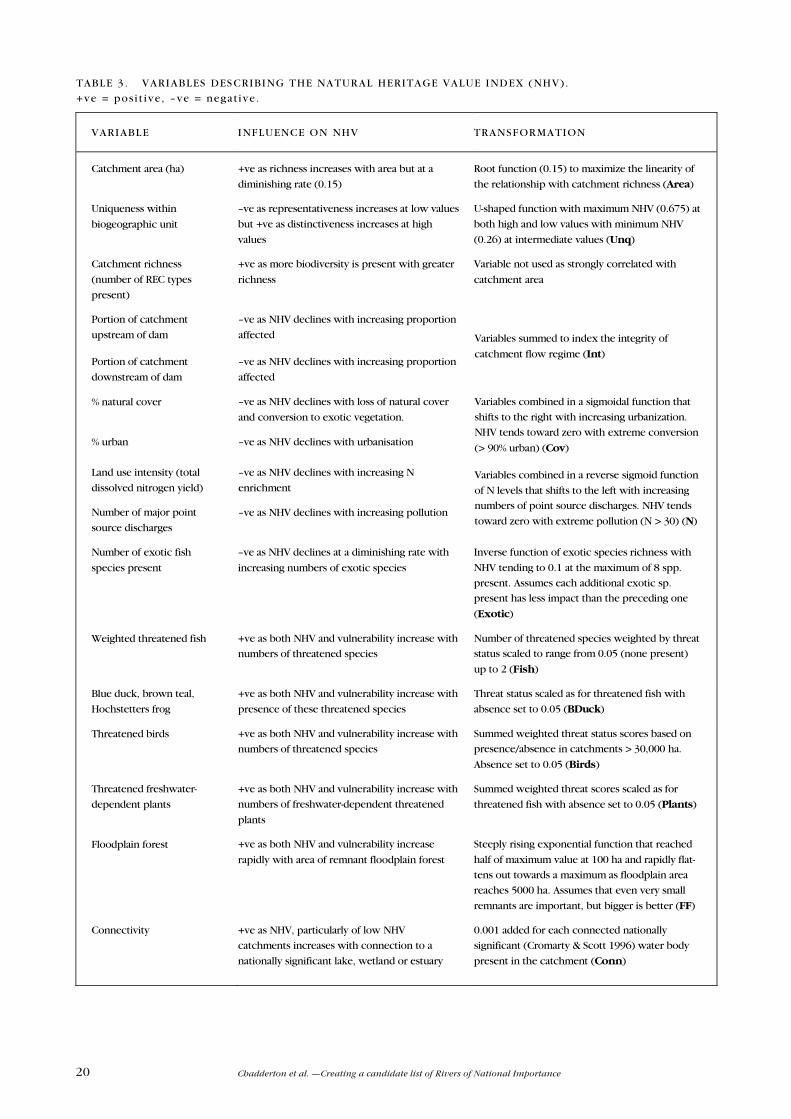
Variables describing the quantity, degradation and vulnerability of biodiversity
present were transformed to explicitly depict the relationship that each was
thought to have with natural heritage value. The characteristics of each
relationship were defined by expert judgement; then a function was chosen to
describe these characteristics and transform each variable. The input variables,
assumptions about relationships with natural heritage, and the transformations
applied are listed in Table 3. All variables (except catchment area) were similarly
(but not identically) scaled so that all values were > 0 and only outliers were > 1.
A correlation analysis of all transformed variables was undertaken to identify
redundant variables. If one variable was both highly correlated with another and
the functional connection was well understood (e.g. catchment area and number
of reach types present), then one was not included in the multiplicative index of
natural heritage value. If high correlation was more likely a consequence of a
shared driver (e.g. nitrogen levels and the number of major discharges; or
threatened species of plant, bird and fish), the variables were combined to
reflect the assumed nature of the interaction. Thus the form of the function
defining the index of natural heritage value (NHV) was primarily multiplicative,
with special features combined additively; then a minor additive adjustment was
made for connection to nationally significant water bodies. This additive
adjustment reflects the reality that a system may have no significant inherent
natural heritage values, but still provide a nationally important buffering or
connectivity function for a nationally important wetland, lake or estuarine
feature (Collier et al. 2003). The national heritage value is therefore calculated
from the equation:
NHV = (Area0.27 x Unq x Int x Cov x N x Exotic x [Fish + BDuck + Birds +
Plants + FF]) + Conn
Variables are listed and described in Table 3 (p. 20).
16 Chadderton et al. �Creating a candidate list of Rivers of National Importance
2 . 4 C H A R A C T E R I S I N G E N V I R O N M E N T
River reach types were classified using the River Environment Classification,
REC (Snelder & Biggs 2002). Source of Flow, Geology, Network Position and
Valley Landform variables of REC were combined to generate a physical
typology. Climate variables were removed because they were unlikely to add
further discriminatory power. (Climate is relatively homogenous within each
biogeographic unit and would increase the number of potential river types six-
fold, creating unnecessary complexity.) Contemporary land cover data was also
excluded, because this reflects human disturbance over much of New Zealand�s
land area (> 80%) and so is not a good surrogate for underlying environmental
conditions. For example, pasture and plantation forest occur in both Southland
and Northland despite very different environments. Also, inclusion of land cover
data would have increased the number of river types eight-fold, creating more
unnecessary complexity.
The number of river environment classes (referred to as �river classes�
hereafter) generated, reflects our assumption that river type is an adequate
surrogate for biological variance. Although this assumption requires further
testing, we believe that the scale chosen is likely to reflect variation in species
assemblages. The number of river classes generated from the four levels of REC
used (Geology, Source of Flow, Valley Landform, and Network Position: Snelder
& Biggs 2002) is similar to the number that would be generated from a
combination of Rosgen�s (1994) classification of natural rivers based on their
morphology (7�9 types) and the inclusion of source of flow, stream size and
catchment geology. These physical factors are known to have significant
influences on biotic pattern (Harding 1992; Harding et al. 1997; Vinson &
Hawkins 1998). The use of both regional and local or reach variables is also
consistent with the findings of recent studies (see Vinson & Hawkins 1998;
Duggan et al. 2002; Death & Joy 2004) and the principle that physical
complexity should promote biological richness (Vinson & Hawkins 1998). Thus
we believe the river environment class resolution used for this analysis will
prove to be a reasonable surrogate description of biological pattern.
2 . 5 D E T E R M I N I N G A N T H R O P O G E N I C P R E S S U R E
Much of New Zealand�s landscape outside a few offshore islands, and the alpine,
subalpine, and forested montaine regions is highly modified (Winterbourn
1995). Land clearance, pastoral development, urbanisation, industrial point
source discharges, water abstraction, flow alterations, artificial barriers and
introduced species have resulted in marked changes to biological characteristics
of freshwater ecosystems (Winterbourn 1995, see also reviews in Collier &
Winterbourn 2000). These anthropogenic factors can be viewed as disturbance
pressures affecting natural heritage. Measurement of pressure provides an
indication of the intensity of various human-induced disturbances affecting the
condition of native biota (Stephens et al. 2002). Hence those systems with least
human-induced disturbance pressure are likely to be of the highest natural
condition. That is, they should have retained most of their natural biodiversity
content.
17Discussion document, December 2004
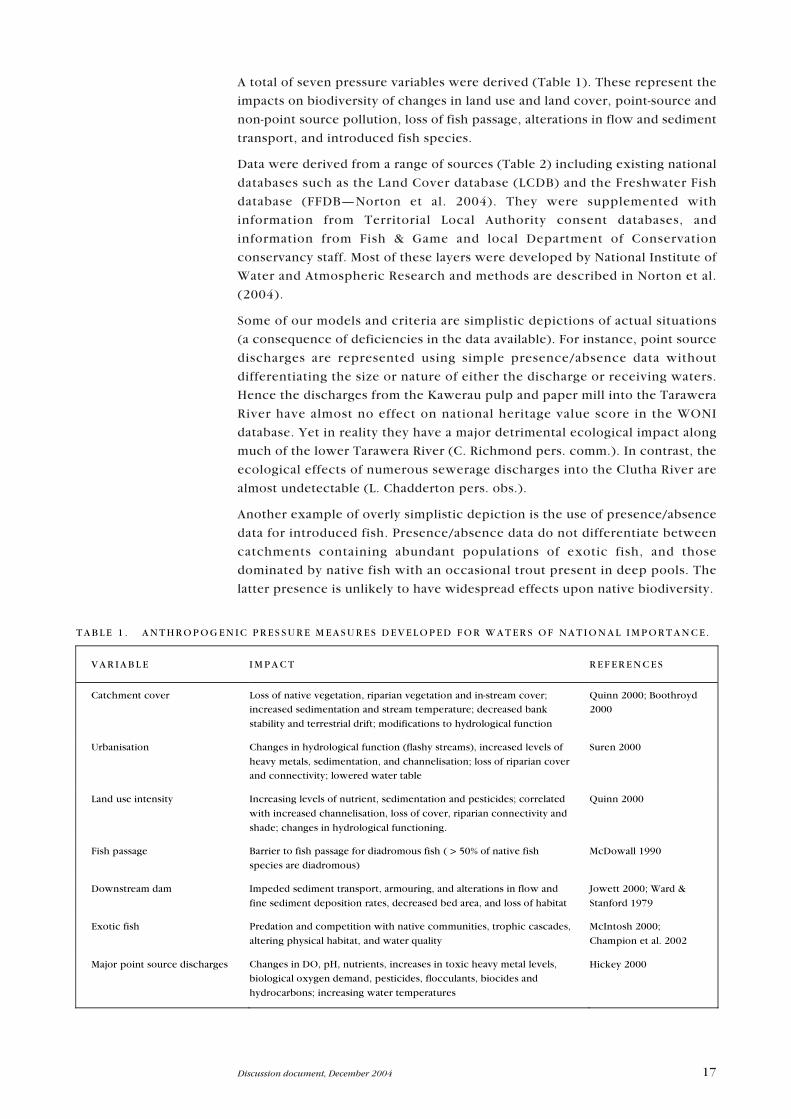
A total of seven pressure variables were derived (Table 1). These represent the
impacts on biodiversity of changes in land use and land cover, point-source and
non-point source pollution, loss of fish passage, alterations in flow and sediment
transport, and introduced fish species.
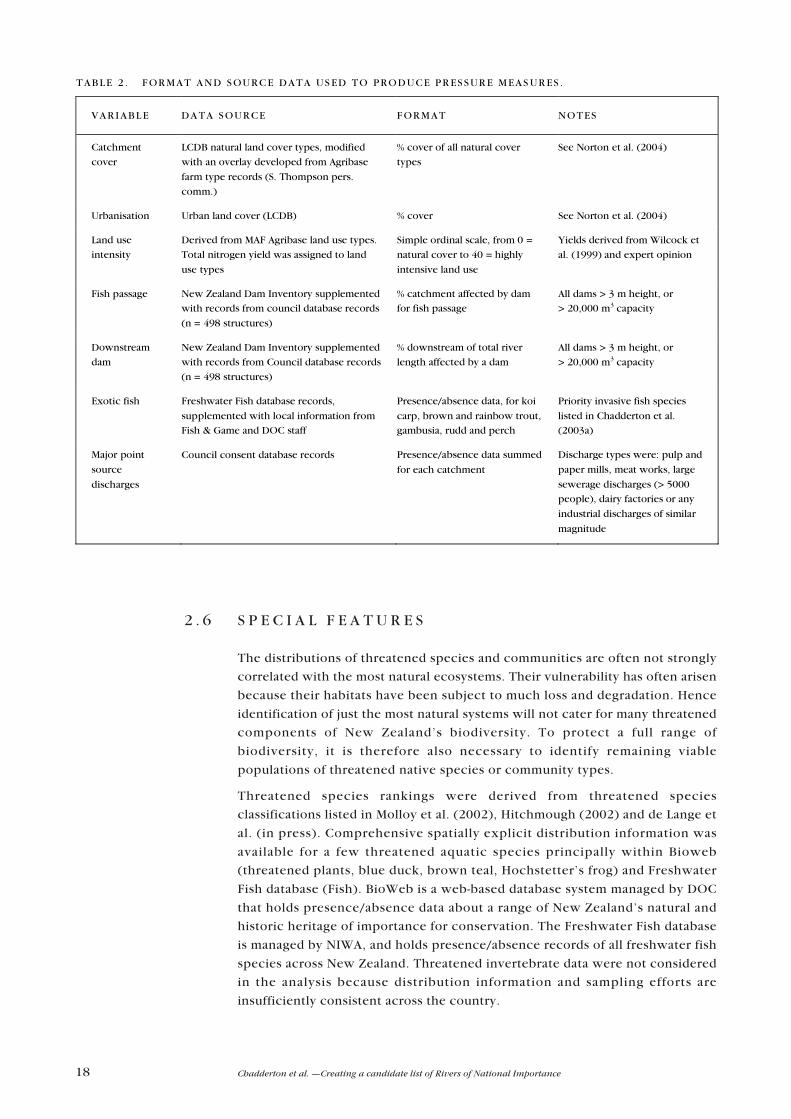
Data were derived from a range of sources (Table 2) including existing national
databases such as the Land Cover database (LCDB) and the Freshwater Fish
database (FFDB�Norton et al. 2004). They were supplemented with
information from Territorial Local Authority consent databases, and
information from Fish & Game and local Department of Conservation
conservancy staff. Most of these layers were developed by National Institute of
Water and Atmospheric Research and methods are described in Norton et al.
(2004).
Some of our models and criteria are simplistic depictions of actual situations
(a consequence of deficiencies in the data available). For instance, point source
discharges are represented using simple presence/absence data without
differentiating the size or nature of either the discharge or receiving waters.
Hence the discharges from the Kawerau pulp and paper mill into the Tarawera
River have almost no effect on national heritage value score in the WONI
database. Yet in reality they have a major detrimental ecological impact along
much of the lower Tarawera River (C. Richmond pers. comm.). In contrast, the
ecological effects of numerous sewerage discharges into the Clutha River are
almost undetectable (L. Chadderton pers. obs.).
Another example of overly simplistic depiction is the use of presence/absence
data for introduced fish. Presence/absence data do not differentiate between
catchments containing abundant populations of exotic fish, and those
dominated by native fish with an occasional trout present in deep pools. The
latter presence is unlikely to have widespread effects upon native biodiversity.
T A B L E 1 . A N T H R O P O G E N I C P R E S S U R E M E A S U R E S D E V E L O P E D F O R W A T E R S O F N A T I O N A L I M P O R T A N C E .
V A R I A B L E I M P A C T R E F E R E N C E S
Catchment cover Loss of native vegetation, riparian vegetation and in-stream cover;
increased sedimentation and stream temperature; decreased bank
stability and terrestrial drift; modifications to hydrological function
Quinn 2000; Boothroyd
2000
Urbanisation Changes in hydrological function (flashy streams), increased levels of
heavy metals, sedimentation, and channelisation; loss of riparian cover
and connectivity; lowered water table
Suren 2000
Land use intensity Increasing levels of nutrient, sedimentation and pesticides; correlated
with increased channelisation, loss of cover, riparian connectivity and
shade; changes in hydrological functioning.
Quinn 2000
Fish passage Barrier to fish passage for diadromous fish ( > 50% of native fish
species are diadromous)
McDowall 1990
Downstream dam Impeded sediment transport, armouring, and alterations in flow and
fine sediment deposition rates, decreased bed area, and loss of habitat
Jowett 2000; Ward &
Stanford 1979
Exotic fish Predation and competition with native communities, trophic cascades,
altering physical habitat, and water quality
McIntosh 2000;
Champion et al. 2002
Major point source discharges Changes in DO, pH, nutrients, increases in toxic heavy metal levels,
biological oxygen demand, pesticides, flocculants, biocides and
hydrocarbons; increasing water temperatures
Hickey 2000
18 Chadderton et al. �Creating a candidate list of Rivers of National Importance
2 . 6 S P E C I A L F E A T U R E S
The distributions of threatened species and communities are often not strongly
correlated with the most natural ecosystems. Their vulnerability has often arisen
because their habitats have been subject to much loss and degradation. Hence
identification of just the most natural systems will not cater for many threatened
components of New Zealand�s biodiversity. To protect a full range of
biodiversity, it is therefore also necessary to identify remaining viable
populations of threatened native species or community types.
Threatened species rankings were derived from threatened species
classifications listed in Molloy et al. (2002), Hitchmough (2002) and de Lange et
al. (in press). Comprehensive spatially explicit distribution information was
available for a few threatened aquatic species principally within Bioweb
(threatened plants, blue duck, brown teal, Hochstetter�s frog) and Freshwater
Fish database (Fish). BioWeb is a web-based database system managed by DOC
that holds presence/absence data about a range of New Zealand�s natural and
historic heritage of importance for conservation. The Freshwater Fish database
is managed by NIWA, and holds presence/absence records of all freshwater fish
species across New Zealand. Threatened invertebrate data were not considered
in the analysis because distribution information and sampling efforts are
insufficiently consistent across the country.
TAB LE 2 . F ORMAT AND S OURC E D ATA US ED TO P ROD UCE P R ES S UR E MEAS UR ES .
VAR IAB L E D A TA S OUR CE F ORMAT NOTES
Catchment
cover
LCDB natural land cover types, modified
with an overlay developed from Agribase
farm type records (S. Thompson pers.
comm.)
% cover of all natural cover
types
See Norton et al. (2004)
Urbanisation Urban land cover (LCDB) % cover See Norton et al. (2004)
Land use
intensity
Derived from MAF Agribase land use types.
Total nitrogen yield was assigned to land
use types
Simple ordinal scale, from 0 =
natural cover to 40 = highly
intensive land use
Yields derived from Wilcock et
al. (1999) and expert opinion
Fish passage New Zealand Dam Inventory supplemented
with records from council database records
(n = 498 structures)
% catchment affected by dam
for fish passage
All dams > 3 m height, or
> 20,000 m3 capacity
Downstream
dam
New Zealand Dam Inventory supplemented
with records from Council database records
(n = 498 structures)
% downstream of total river
length affected by a dam
All dams > 3 m height, or
> 20,000 m3 capacity
Exotic fish Freshwater Fish database records,
supplemented with local information from
Fish & Game and DOC staff
Presence/absence data, for koi
carp, brown and rainbow trout,
gambusia, rudd and perch
Priority invasive fish species
listed in Chadderton et al.
(2003a)
Major point
source
discharges
Council consent database records Presence/absence data summed
for each catchment
Discharge types were: pulp and
paper mills, meat works, large
sewerage discharges (> 5000
people), dairy factories or any
industrial discharges of similar
magnitude
19Discussion document, December 2004
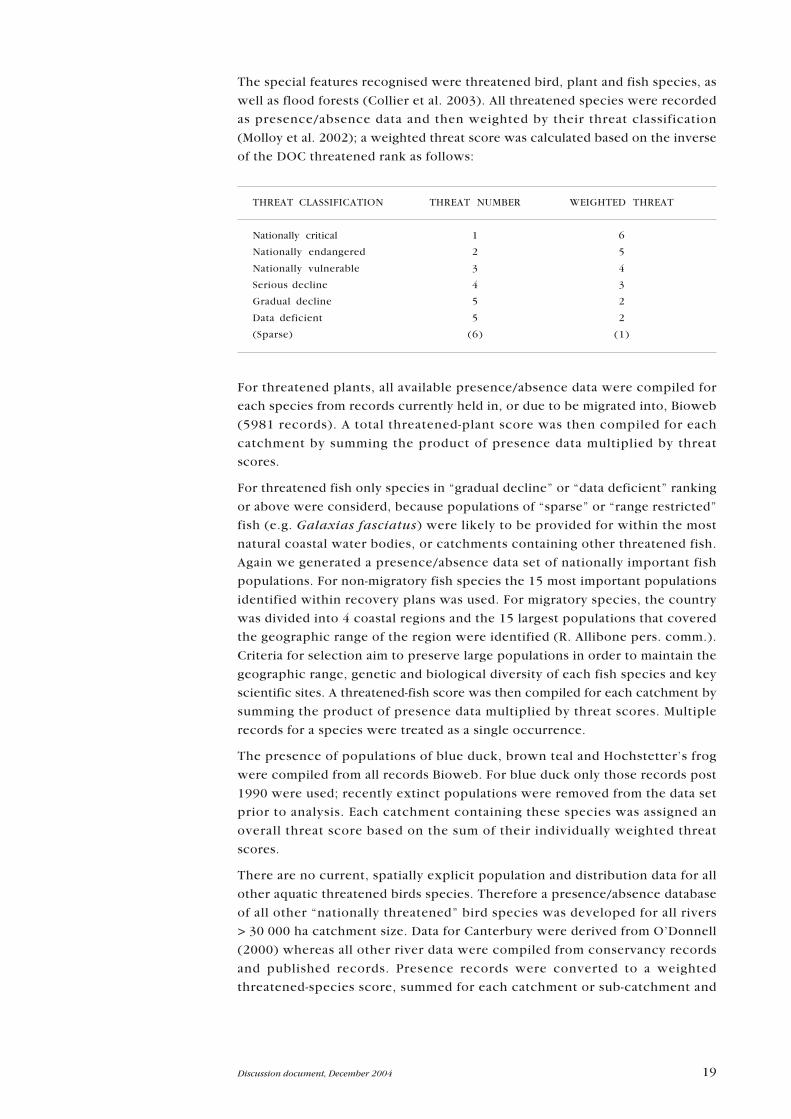
The special features recognised were threatened bird, plant and fish species, as
well as flood forests (Collier et al. 2003). All threatened species were recorded
as presence/absence data and then weighted by their threat classification
(Molloy et al. 2002); a weighted threat score was calculated based on the inverse
of the DOC threatened rank as follows:
For threatened plants, all available presence/absence data were compiled for
each species from records currently held in, or due to be migrated into, Bioweb
(5981 records). A total threatened-plant score was then compiled for each
catchment by summing the product of presence data multiplied by threat
scores.
For threatened fish only species in �gradual decline� or �data deficient� ranking
or above were considerd, because populations of �sparse� or �range restricted�
fish (e.g. Galaxias fasciatus) were likely to be provided for within the most
natural coastal water bodies, or catchments containing other threatened fish.
Again we generated a presence/absence data set of nationally important fish
populations. For non-migratory fish species the 15 most important populations
identified within recovery plans was used. For migratory species, the country
was divided into 4 coastal regions and the 15 largest populations that covered
the geographic range of the region were identified (R. Allibone pers. comm.).
Criteria for selection aim to preserve large populations in order to maintain the
geographic range, genetic and biological diversity of each fish species and key
scientific sites. A threatened-fish score was then compiled for each catchment by
summing the product of presence data multiplied by threat scores. Multiple
records for a species were treated as a single occurrence.
The presence of populations of blue duck, brown teal and Hochstetter�s frog
were compiled from all records Bioweb. For blue duck only those records post
1990 were used; recently extinct populations were removed from the data set
prior to analysis. Each catchment containing these species was assigned an
overall threat score based on the sum of their individually weighted threat
scores.
There are no current, spatially explicit population and distribution data for all
other aquatic threatened birds species. Therefore a presence/absence database
of all other �nationally threatened� bird species was developed for all rivers
> 30 000 ha catchment size. Data for Canterbury were derived from O�Donnell
(2000) whereas all other river data were compiled from conservancy records
and published records. Presence records were converted to a weighted
threatened-species score, summed for each catchment or sub-catchment and
THREAT CLASSIFICATION THREAT NUMBER WEIGHTED THREAT
Nationally critical 1 6
Nationally endangered 2 5
Nationally vulnerable 3 4
Serious decline 4 3
Gradual decline 5 2
Data deficient 5 2
(Sparse) (6) (1)
20 Chadderton et al. �Creating a candidate list of Rivers of National Importance
TABLE 3 . VARIABLES DESCRIBING THE NATURAL HERITAGE VALUE INDEX (NHV).
+ve = posi t i ve, �ve = negat ive.
VARIABLE INFLUENCE ON NHV TRANSFORMATION
Catchment area (ha) +ve as richness increases with area but at a
diminishing rate (0.15)
Root function (0.15) to maximize the linearity of
the relationship with catchment richness (Area)
Uniqueness within
biogeographic unit
�ve as representativeness increases at low values
but +ve as distinctiveness increases at high
values
U-shaped function with maximum NHV (0.675) at
both high and low values with minimum NHV
(0.26) at intermediate values (Unq)
Catchment richness
(number of REC types
present)
+ve as more biodiversity is present with greater
richness
Variable not used as strongly correlated with
catchment area
Portion of catchment
upstream of dam
�ve as NHV declines with increasing proportion
affected
Portion of catchment
downstream of dam
�ve as NHV declines with increasing proportion
affected
Variables summed to index the integrity of
catchment flow regime (Int)
% natural cover �ve as NHV declines with loss of natural cover
and conversion to exotic vegetation.
% urban �ve as NHV declines with urbanisation
Variables combined in a sigmoidal function that
shifts to the right with increasing urbanization.
NHV tends toward zero with extreme conversion
(> 90% urban) (Cov)
Land use intensity (total
dissolved nitrogen yield)
�ve as NHV declines with increasing N
enrichment
Number of major point
source discharges
�ve as NHV declines with increasing pollution
Variables combined in a reverse sigmoid function
of N levels that shifts to the left with increasing
numbers of point source discharges. NHV tends
toward zero with extreme pollution (N > 30) (N)
Number of exotic fish
species present
�ve as NHV declines at a diminishing rate with
increasing numbers of exotic species
Inverse function of exotic species richness with
NHV tending to 0.1 at the maximum of 8 spp.
present. Assumes each additional exotic sp.
present has less impact than the preceding one
(Exotic)
Weighted threatened fish +ve as both NHV and vulnerability increase with
numbers of threatened species
Number of threatened species weighted by threat
status scaled to range from 0.05 (none present)
up to 2 (Fish)
Blue duck, brown teal,
Hochstetters frog
+ve as both NHV and vulnerability increase with
presence of these threatened species
Threat status scaled as for threatened fish with
absence set to 0.05 (BDuck)
Threatened birds +ve as both NHV and vulnerability increase with
numbers of threatened species
Summed weighted threat status scores based on
presence/absence in catchments > 30,000 ha.
Absence set to 0.05 (Birds)
Threatened freshwater-
dependent plants
+ve as both NHV and vulnerability increase with
numbers of freshwater-dependent threatened
plants
Summed weighted threat scores scaled as for
threatened fish with absence set to 0.05 (Plants)
Floodplain forest +ve as both NHV and vulnerability increase
rapidly with area of remnant floodplain forest
Steeply rising exponential function that reached
half of maximum value at 100 ha and rapidly flat-
tens out towards a maximum as floodplain area
reaches 5000 ha. Assumes that even very small
remnants are important, but bigger is better (FF)
Connectivity +ve as NHV, particularly of low NHV
catchments increases with connection to a
nationally significant lake, wetland or estuary
0.001 added for each connected nationally
significant (Cromarty & Scott 1996) water body
present in the catchment (Conn)
21Discussion document, December 2004
then multiplied by the product of Area (raised to power of 0.15) as a surrogate
estimate of abundance. This function is based on species richness/area
relationships (see Stephens et al. 2002 for further explanation). The rankings
produced by this approach compared favourably with those produced by
O�Donnell (2000) from a semi-quantitative data set that assessed a range of
criteria including population size, diversity, and viability measures (Spearman
rank correlation R2 was 0.84).
The amount of riverine floodplain forest was quantified on GIS by selecting all
areas of native forest from the Land Cover Data Base present on riverine basins
with a catchment slope less than one degree, and within a 110-metre buffer of a
river line in the REC network.
2 . 7 C O N N E C T I V I T Y / B U F F E R I N G F U N C T I O N
This variable recognises that some systems have value because they provide a
critical ecological buffer for, or connection to, other nationally important
aquatic ecosystems (e.g. wetlands, estuaries, lakes: Collier et al. 2003). Loss of
the hydrological connection or corridor provided by the river or lake would
significantly lower the value of these nationally important systems. Nationally
important non-riverine and lacustrine freshwater/estuarine systems were
identified to include:
1. Wetlands of International Importance (Cromarty & Scott 1996).
2. Estuaries of International Importance (Cromarty & Scott 1996).
3. Areas of Significant Conservation Value (ASCVs) listed by conservancy
experts as part of DOC�s submissions to regional coastal plans.
4. The least human-disturbed lake in a biogreographic unit, or any lake
containing nationally significant bird populations.
A value equivalent to the lower 10-percentile of all heritage value scores (0.001)
was then added to the natural heritage value score of each catchment that
contained a nationally or internationally important wetland, estuary or lake.
2 . 8 D E V E L O P I N G A C A N D I D A T E L I S T
Our procedure was designed to ensure that the list of Waters of National
Importance identified catchment units with the highest natural heritage value
score (NHV score), as well as those known to contain a range of special
vulnerable features, distinctive river classes, or unique biological communities.
The candidate list was therefore developed to include where possible:
1. At least 70% of the environmental variance (as measured by the number of
river classes captured) within each biogeographic unit.
2. Catchments with the highest NHV score within each biogeographic unit.
3. Known special features (threatened species or nationally important
wetlands, lakes or estuaries).
22 Chadderton et al. �Creating a candidate list of Rivers of National Importance
The Sort function in MS Excel® was used to determine the minimum area and
smallest set of sites within each biogeographic unit required to protect at least
70% of the full range of river classes. The sort was hierarchical, starting with a
subset of sites that represented the smallest sub-catchments within any given
river system (i.e. only those catchments and tributaries that did not contain sub-
catchments nested within their catchment), sorting by highest NHV score. Thus
a site was added to the candidate list only if it added new river classes to the
combined pool of river classes already selected and was the smallest highest
ranked (by NHV) sub-catchment that could provide the new addition.
Consequently, the largest parent catchments (e.g. Waiau and Waikato), with
many sub-catchments nested upstream, were included last so that they did not
mask the analysis.
A separate list of the ten top-ranked (by NHV only) systems within each
biogeographic unit was developed. Finally catchments were also ranked within
each unit by total threatened species scores.
From these lists, a single list of candidate catchment units was then produced on
the basis of two rules:
1. The site was both listed in the minimum set, and also listed among the top ten
sites ranked by natural heritage value score within each biogeographic unit.
2. The site contained one or more special vulnerable features (threatened
species; flood forest); or connected to a nationally important wetland, lake
or estuary.
The catchment list derived by this process represented what we have termed
Type I catchments, where the majority of the catchment is nationally
significant. A second group of catchments, termed Type II, were selected on
the basis that they contained special features of national significance, usually a
wetland or nationally important population of a threatened species. Only
sections of the Type II catchments are of national importance; the entire
catchment would not require protection in order to conserve these values.
23Discussion document, December 2004
3. Results
3 . 1 C O M P O N E N T V A R I A B L E S
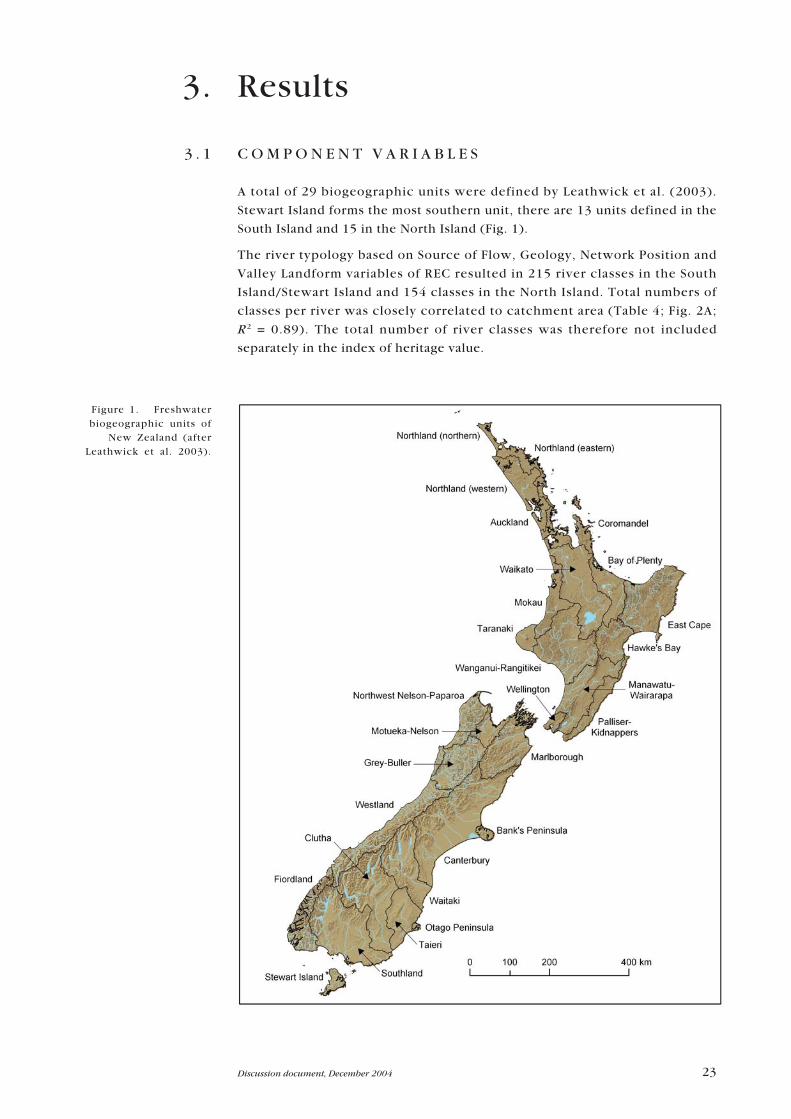
A total of 29 biogeographic units were defined by Leathwick et al. (2003).
Stewart Island forms the most southern unit, there are 13 units defined in the
South Island and 15 in the North Island (Fig. 1).
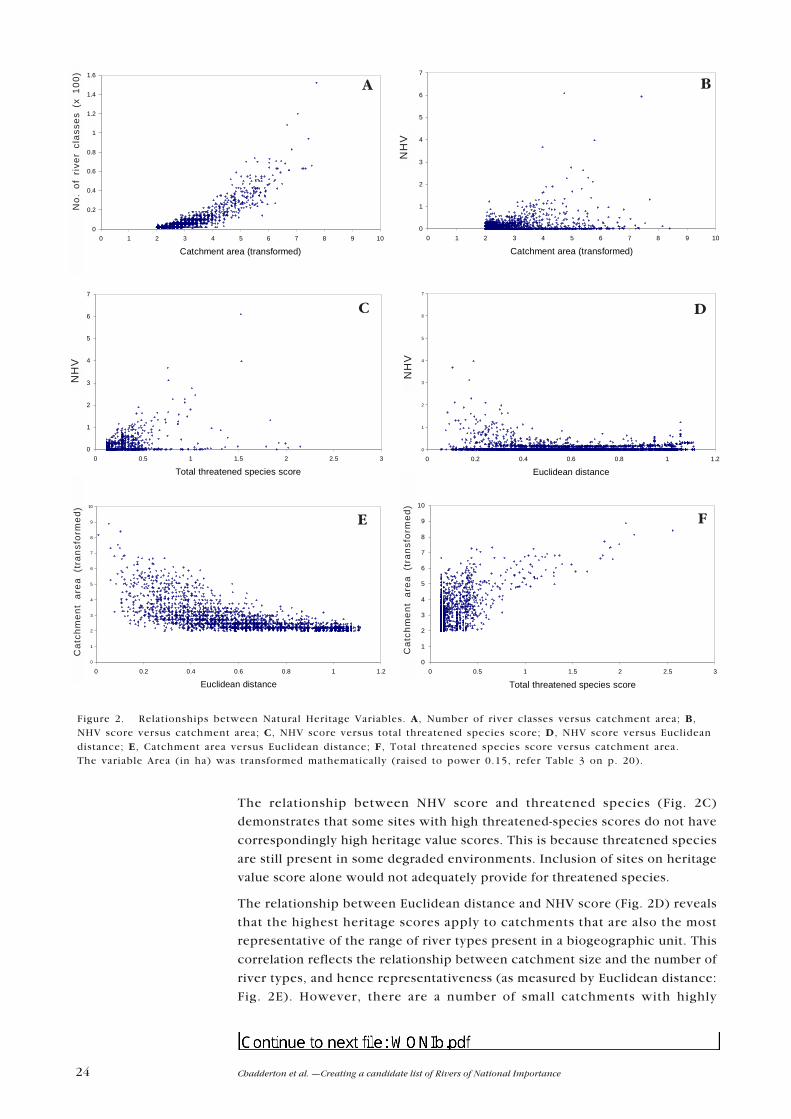
The river typology based on Source of Flow, Geology, Network Position and
Valley Landform variables of REC resulted in 215 river classes in the South
Island/Stewart Island and 154 classes in the North Island. Total numbers of
classes per river was closely correlated to catchment area (Table 4; Fig. 2A;
R2 = 0.89). The total number of river classes was therefore not included
separately in the index of heritage value.
Figure 1. Freshwaterbiogeographic units of
New Zealand (afterLeathwick et al. 2003).
24 Chadderton et al. �Creating a candidate list of Rivers of National Importance
Figure 2. Relationships between Natural Heritage Variables. A, Number of river classes versus catchment area; B ,NHV score versus catchment area; C, NHV score versus total threatened species score; D , NHV score versus Euclideandistance; E, Catchment area versus Euclidean distance; F , Total threatened species score versus catchment area.The variable Area (in ha) was transformed mathematically (raised to power 0.15, refer Table 3 on p. 20).
0
0.2
0.4
0.6
0.8
1
1.2
1.4
1.6
0 1 2 3 4 5 6 7 8 9 10
Catchment area (transformed)
Num
ber o
f riv
er c
lass
es (t
rans
form
e
0
1
2
3
4
5
6
7
0 1 2 3 4 5 6 7 8 9 10
Catchment area (transformed)
NH
V
0
1
2
3
4
5
6
7
0 0.5 1 1.5 2 2.5 3
Total threatened species score
NH
V
0
1
2
3
4
5
6
7
0 0.2 0.4 0.6 0.8 1 1.2
Euclidean distance
NH
V
0
1
2
3
4
5
6
7
8
9
10
0 0.2 0.4 0.6 0.8 1 1.2
Euclidean distance
Cat
chm
ent a
rea
(tran
sfor
med
0
1
2
3
4
5
6
7
8
9
10
0 0.5 1 1.5 2 2.5 3
Total threatened species score
Cat
chm
ent a
rea
(tran
sfor
med
A B
C D
E F
The relationship between NHV score and threatened species (Fig. 2C)
demonstrates that some sites with high threatened-species scores do not have
correspondingly high heritage value scores. This is because threatened species
are still present in some degraded environments. Inclusion of sites on heritage
value score alone would not adequately provide for threatened species.
The relationship between Euclidean distance and NHV score (Fig. 2D) reveals
that the highest heritage scores apply to catchments that are also the most
representative of the range of river types present in a biogeographic unit. This
correlation reflects the relationship between catchment size and the number of
river types, and hence representativeness (as measured by Euclidean distance:
Fig. 2E). However, there are a number of small catchments with highly
NH
V
NH
VN
HV
Cat
chm
ent
area
(tr
ansf
orm
ed)
Cat
chm
ent
area
(tr
ansf
orm
ed)
No.
of
rive
r cl
asse
s (x
100
)