Embed Size (px)
Citation preview
Identifying Genetic Factors and Processes Involved in the Cardiac Perinatal
Transitional Program
Lara Kouri
Hon. B.Sc., Minor B.A.
Thesis submitted to the Faculty of Graduate and Postdoctoral Studies, in partial fulfillment
of the requirements for the M.Sc. degree in Biochemistry
Department of Biochemistry, Microbiology and Immunology
Faculty of Medicine
University of Ottawa
© Lara Kouri, Ottawa, Canada, 2011
II
ABSTRACT
Cardiomyocyte perinatal development is characterized by the transition from a hyperplastic
to a hypertrophic growth. We hypothesize that genetic factors and processes in the cardiac
perinatal transitional program can be identified by a systematic analysis of different stages in
heart development. Microarray expression patterning of mRNAs and microRNAs uncovered
a perinatal cardiogenomic switch between 5 and 7 days post-birth. Gene ontology analysis
revealed cellular and metabolic processes as highly representative Biological Processes.
Moreover, approximately 40% of known mice transcription factors are significantly
(p<0.05) fluctuating between embryonic day 19 and 10 days post-birth. As the heart
matures, cardiomyocytes progressively exit cell cycle with day 5 as a pivotal point.
Hypertrophy entails cardiomyocyte binucleation which may be promoted by Protein
Regulator of Cytokinesis (Prc1) and its interactors. Temporal cardiac transcription
expression analysis provides insight into underlining effectors within the cardiac perinatal
transitional program as well as cardiac pathology.

III
ACKNOWLEDGEMENTS
First and foremost, I would like to thank my Supervisor, Dr. Patrick Burgon, for
wholeheartedly welcoming me into his lab and for his continuous involvement and guidance
throughout my Master‟s research project. You have given me the opportunity to explore an
exciting field in amazing company.
I would like to express my gratitude to my thesis advisory committee, Dr. Jocelyn
Côté and Dr. Balwant Tuana, for their constructive feedback and support. You have been
key in the development of this project.
I would like to acknowledge the funding provided by the Ontario Graduate
Scholarship (OGS) and the CIHR Frederick Banting and Charles Best Canada Graduate
Scholarship Master‟s Award.
I am particularly indebted to my fellow lab mates and friends: Karen Soueidan,
Shelley Deeke, Seham Rabaa, Elmira Ahmady, Allen Teng, Branka Vulesevic, and Jennifer
Kasbary. I cannot stress enough how much your smiles, encouragement, help,
brainstorming, care and kindness, have been my motivational factor. Also a great big thank
you to my study buddies at SITE. I would also like to thank Dr. Alexandre Stewart, Lan Vo,
Yanqing Wang, and Robbie Davies for their help during my microarray deciphering days.
I must express my gratitude to my neighbouring lab members Dr. Adolfo de Bold,
Dr. Mercedes de Bold, Linda Connor, Asna Choudhry, Monica Forero, Amy Martinuk,

IV
Cassandra Roeske and Shahreen Amin. Thank you for your advice, support and great
stories. Our lab office events are not the same without you.
Last but certainly not least, I must express my gratitude to my family for all their
infinite love, support and encouragement. Unfortunately I still have not solved heart disease;
however you may continue calling me Dr. Lara.
Without you all, my Master‟s project would not have been possible or enjoyable.
Thank you!
V
TABLE OF CONTENTS
ABSTRACT ......................................................................................................................................... II
ACKNOWLEDGEMENTS ................................................................................................................ III
LIST OF ABBREVIATIONS ........................................................................................................... VII
LIST OF FIGURES ......................................................................................................................... VIII
LIST OF TABLES .............................................................................................................................. IX
INTRODUCTION, RATIONALE, HYPOTHESIS, AND EXPERIMENTAL AIMS ...................... 10
Heart Development ............................................................................................................................. 11
Transitioning Toward Maturation ................................................................................................... 12
Regenerating Muscle ....................................................................................................................... 15
Genetically Engineered to Grow ..................................................................................................... 17
The Prenatal Heart ....................................................................................................................... 18
The Perinatal Heart ..................................................................................................................... 19
The Adult Heart........................................................................................................................... 20
Cardiomyocyte Cellular Regulation ................................................................................................ 22
microRNA in Heart Development and Disease .................................................................................. 25
microRNA Discovery...................................................................................................................... 26
microRNA Biogenesis and Silencing Activity................................................................................ 27
Mice Versus Humans ...................................................................................................................... 28
microRNA and Heart Disease ......................................................................................................... 28
Cardiomyocyte Multinucleation .......................................................................................................... 31
RATIONALE ...................................................................................................................................... 35
HYPOTHESIS .................................................................................................................................... 35
EXPERIMENTAL AIMS ................................................................................................................... 35
MATERIALS AND METHODS ........................................................................................................ 36
VI
Mouse Model ...................................................................................................................................... 37
RNA Isolation, Quantification and Qualification ............................................................................... 37
RNA Isolation ............................................................................................................................. 37
RNA Quantity and Quality .......................................................................................................... 38
Microarrays ......................................................................................................................................... 38
Gene Expression Microarray ....................................................................................................... 38
microRNA Expression Microarray ............................................................................................. 38
Microarray Quality Control ............................................................................................................. 39
Microarray Analysis ........................................................................................................................ 40
Microarray Validation ..................................................................................................................... 41
Reverse Transcriptase Polymerase Chain Reaction (RT-PCR) .................................................. 41
Quantitative Real-Time PCR ...................................................................................................... 42
Cell Cycle and Prc1 Immunoblotting .................................................................................................. 43
EXPERIMENTAL RESULTS ............................................................................................................ 46
Aim 1: Determine Transcriptional Patterns of mRNA and microRNA During the Murine Cardiac
Perinatal Transitional Program ........................................................................................................... 48
Aim 2: Elucidate Key Factors Involved in Cardiomyocyte Maturation and Binucleation ................. 77
DISCUSSION ..................................................................................................................................... 94
CONCLUSION ................................................................................................................................. 115
REFERENCES .................................................................................................................................. 120
CONTRIBUTIONS OF COLLABORATORS ................................................................................. 132
APPENDIX ....................................................................................................................................... 133
PERMISSIONS ................................................................................................................................. 143
CURRICULUM VITAE ................................................................................................................... 158
VII
LIST OF ABBREVIATIONS
ASB15: Ankyrin repeat and SOCS Box-
containing 15
ANOVA: Analysis Of Variance
bp: base pair
BP: Biological Processes
CDC2: Cell Division Cycle 2 (Cyclin-
Dependent Kinase 1 – CDK1)
CDK4: Cyclin-Dependent Kinase 4
cDNA: Complementary DNA
CT: Cycle Threshold
d: Day
DAPI: 4‟, 6-diamidino-2-phenylindole
DMEM: Dulbecco‟s Modified Eagle‟s
Medium
DNA: Deoxyribonucleic Acid
EDTA: Ethylenediaminetetraacetic acid
EPAS1: Endothelial PAS domain protein 1
ES: Enrichment Score
FBS: Fetal bovine serum
FBXW7: F-Box and WD repeat domain
containing 7
FDR: False-Discovery Rate
GAPDH: Glyceraldehyde-3-Phosphate
Dehydrogenase
GO: Gene Ontology
HDAC: Histone Deacetylase
HEPES: 4-(2-hydroxyethyl)-1-
piperazineethanesulfonic acid
HIF3α: Hypoxia Inducible Factor 3, alpha
HRP: Horseradish Peroxidase
kDa: KiloDalton
MAD2l1: MAD2 mitotic arrest deficient-
like 1 (yeast)
MHC: Myosin Heavy Chain
MOP: Multicellular Organismal Process
mRNA: Messenger Ribonucleic Acid
miRNA: microRNA
NEB: New England Biolabs
NLS: Nuclear localization signal
NP-40: Nonidet P-40
N.S.: Non-Significant
PBS: Phosphate-Buffered Saline
pCDC2(Tyr15): Phosphorylated CDC2 at
Tyrosine 15
PCR: Polymerase Chain Reaction
PFKM: Phosphofructokinase, muscle
PGK2: Phosphoglycerate kinase 2
PLIER: Probe Logarithmic Intensity Error
PLN: Phospholamban
PPIA: Peptidylprolyl isomerase A
(cyclophilin A)
pRB(Ser780): Phosphorylated Rb at Serine
780
PRC1: Protein Regulator of Cytokinesis 1
PVDF: Polyvinylidene Fluoride
O/N: Over Night
OR: Olfactory Receptor
RB: Retinoblastoma
RMA: Robust Multi-Array Average
RNA: Ribonucleic Acid
RT: Room Temperature
RT-PCR: Reverse-Transcriptase PCR
RXRγ: Retinoid X Receptor, gamma
SDS-PAGE: Sodium Dodecyl Sulfate
Polyacrylamide Gel Electrophoresis
TBE: Tris Borate EDTA
TBST: Tris-Buffered Saline Tween-20
TF: Transcription Factor
VIII
LIST OF FIGURES
Figure 1: Cardiomyocyte transition from a hyperplastic to a hypertrophic growth ............................................ 13
Figure 2: microRNA Involvement in Cardiac Disease........................................................................................ 29
Figure 3: Cytoskeletal Remodeling during Cytokinesis. ..................................................................................... 33
Figure 4: Cardiogenetic Perinatal Expression is Highly Dynamic ...................................................................... 50
Figure 5: Cardiac microRNA Perinatal Expression Patterns are Dispersed ........................................................ 52
Figure 6: Genomic Patterning Promoting Heart Maturation ............................................................................... 58
Figure 7: Gene Ontology Processes Altering During Heart Development.......................................................... 64
Figure 8: Overall Biological Processes Significantly Involved in the Heart ....................................................... 67
Figure 9: Ppia Remains Constantly Expressed during the Perinatal Cardiac Program ....................................... 72
Figure 10: Successful Validation of Exon Microarray Results through RT-PCR and Real-Time PCR .............. 74
Figure 11: Prc1 Expression Profile Decreases Throughout Perinatal Cardiac Maturation ................................. 78
Figure 12: PRC1 Monoclonal Rabbit Antibody is Specific to Endogenous Cardiac PRC1 ................................ 81
Figure 13: Murine Heart Transcript and Protein Abundance Have Dissimilar Trends ....................................... 83
Figure 14: microRNAs Putatively Targeting Prc1 .............................................................................................. 86
Figure 15: Perinatal Heart Maturation Involves Cell Cycle Withdrawal ............................................................ 90
Figure 16: Genes Interacting In Silico with Prc1 Have the Same Expression Profile as Prc1 ............................ 92
Figure 17: PRC1 is a Highly Conserved Protein Essential for Cytokinesis ...................................................... 106
Figure 18: Potential Model of the Cardiac Perinatal Transitional Program ...................................................... 118
Supplemental Figure 1: microRNA Microarray Quality Controls .................................................................... 134
Supplemental Figure 2: Prc1 GEO Profiles ...................................................................................................... 137
Supplemental Figure 3: Prc1 Immunofluorescence in HL-1, HeLa, and Primary Cardiomyocytes ................. 139
Supplemental Figure 4: GeneMANIA Prc1 Interaction Network Report ......................................................... 142
IX
LIST OF TABLES
Table 1: Transcription Factors Mediating Prenatal Cardiac Development. ........................................................ 19
Table 2: Cyclins Modulating Cell Cycle Stages. ................................................................................................ 23
Table 3: List of Primer Sequences ...................................................................................................................... 43
Table 4: Highly Expressed Mouse microRNAs within the Cardiac Perinatal Period ......................................... 54

10
INTRODUCTION, RATIONALE, HYPOTHESIS, AND
EXPERIMENTAL AIMS
11
HEART DEVELOPMENT
The heart progresses through different developmental stages (embryogenesis, postnatal
development, maturity, and senescence) and responds to environmental and pathological
stimuli (Fuster & King, 2008). The heart is composed of a complex arrangement of
cardiomyocytes, fibroblasts, as well as smooth muscle, endothelial, endocardial,
neuroendocrine and hematopoietic cells, with spatial and regional specialization (Sehl et al.,
2000). Cardiomyocytes evolve through three cellular and growth factor-dependent
developmental phases: proliferation, binucleation, and hypertrophy (Ahuja et al., 2007).
Normal heart development is regulated by growth programs, mechanical load, plus
endo- and paracrine factors (Forssmann et al., 1989; Molkentin & Dorn, 2001). Conversely
pathological cardiac growth results as an adaptive response to increased wall stress (i.e.
myocardial injury) (Francis & McDonald, 1992). Molecular pathways that modulate the
switch between physiological and pathological cardiac growth remain unclear.
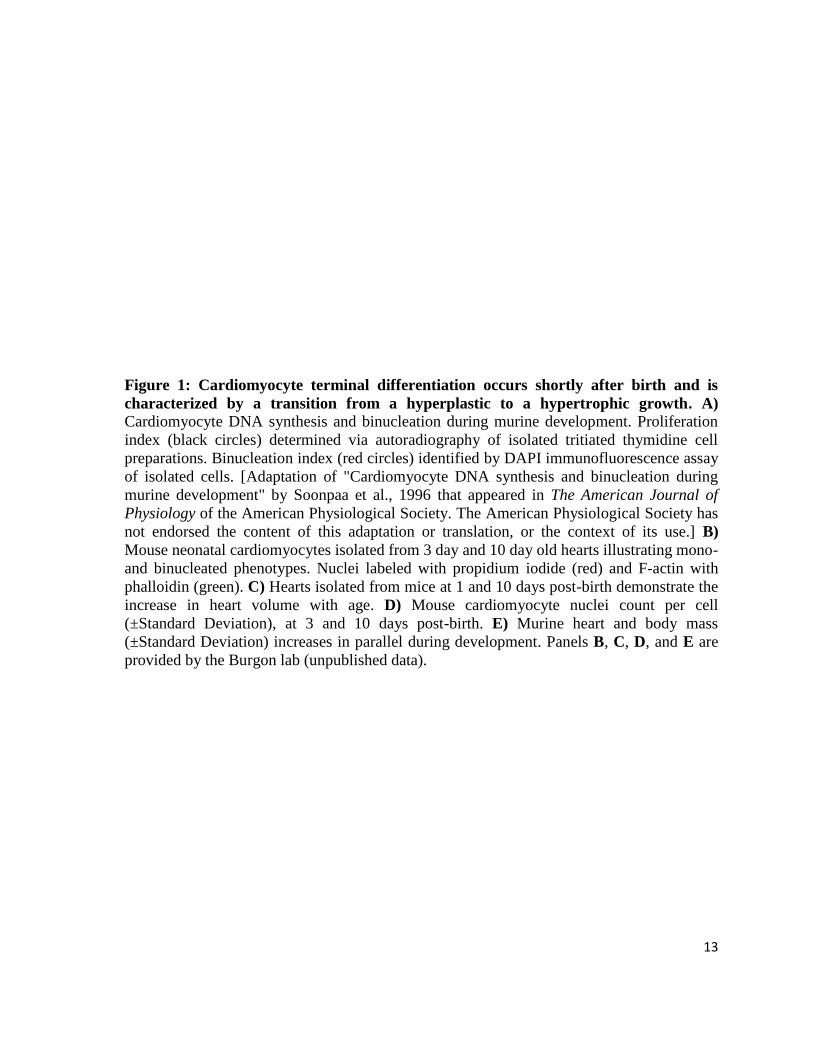
At the cellular level, the mammalian heart develops through two main growth
phases: i) hyperplasia, and ii) hypertrophy. Hyperplasia principally occurs during prenatal
heart development and entails cardiomyocyte proliferation and mononucleation (Oparil et
al., 1984; Figure 1A, B, and D). Hypertrophy predominantly characterizes postnatal cardiac
growth whereby cardiomyocyte cellular division is nearly absent and replaced by volume
increase and enhanced binucleation (Soonpaa et al., 1996; Figure 1A, B, C and D). As a
result, although cardiomyocytes constitute only about 20% of all cardiac cells within the
human myocardium, they contribute 90% of the volume and mass of the heart (Field, 2004).
Cardiomyocytes undergo dynamic growth patterns, however the heart-to-body
weight ratio remains relatively constant throughout development and into maturity (Figure
12
1E; Li et al., 1996; Leu et al., 2001). The switch between hyperplasia and hypertrophy
suggests that genetic factors regulating cardiomyocyte proliferation and expansion are likely
expressed differentially during prenatal and neonatal life.
Transitioning Toward Maturation
Certain physiological, cellular, and anatomical properties in the perinatal heart have been
identified whereas genetic regulatory factors remain poorly understood. Morphological
parameters that are altered during the transition from a prenatal to a postnatal heart include
enhanced myofibril density, mature intercalated discs, and binucleated cardiomyocytes
(Winick & Noble, 1965). Physiologically, the heart rate steadily increases with age but then
levels off at 14 days postnatally in rats (Wu & Wu, 2009). Conversely, ejection fraction (EF)
in rats fluctuates with age whereby for the first four days EF is high, declines until day 7,
rises until day 21 then stabilizes into adulthood (Dowell, 1984). In addition, left ventricle
size increases with age signifying increased stroke volume and cardiac output (Hopkins et
al., 1973).
Temporal cardiomyocyte analysis in the mouse revealed particular developmental
parameters: 1) Day 0-4: cardiomyocyte volume is constant with an increase in heart weight;
2) Day 5-14: cardiomyocyte volume substantially increases; 3) Day 14: cardiomyocyte
volume increments decreases; 4) 3 months: cardiomyocytes reach volume maturity (Leu et
al., 2001). These phenotypic changes were defined as hyperplasia (at day 0 and 4) and
hypertrophy (beginning at day 5).
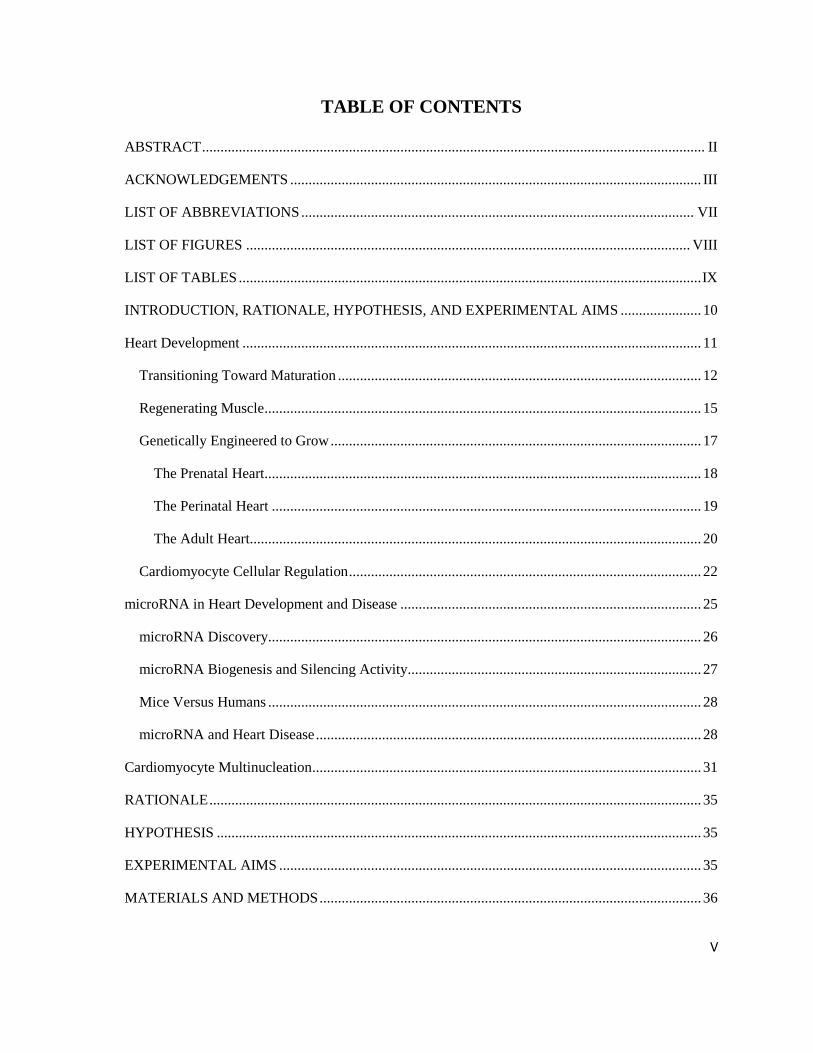
13
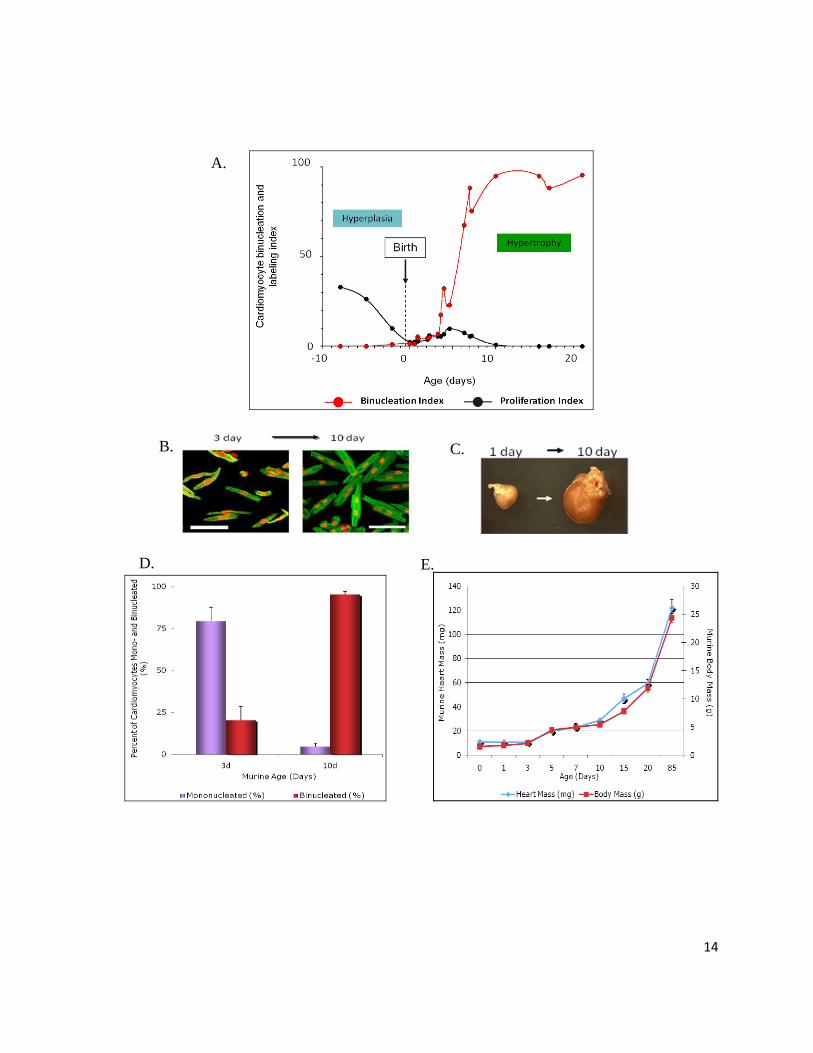
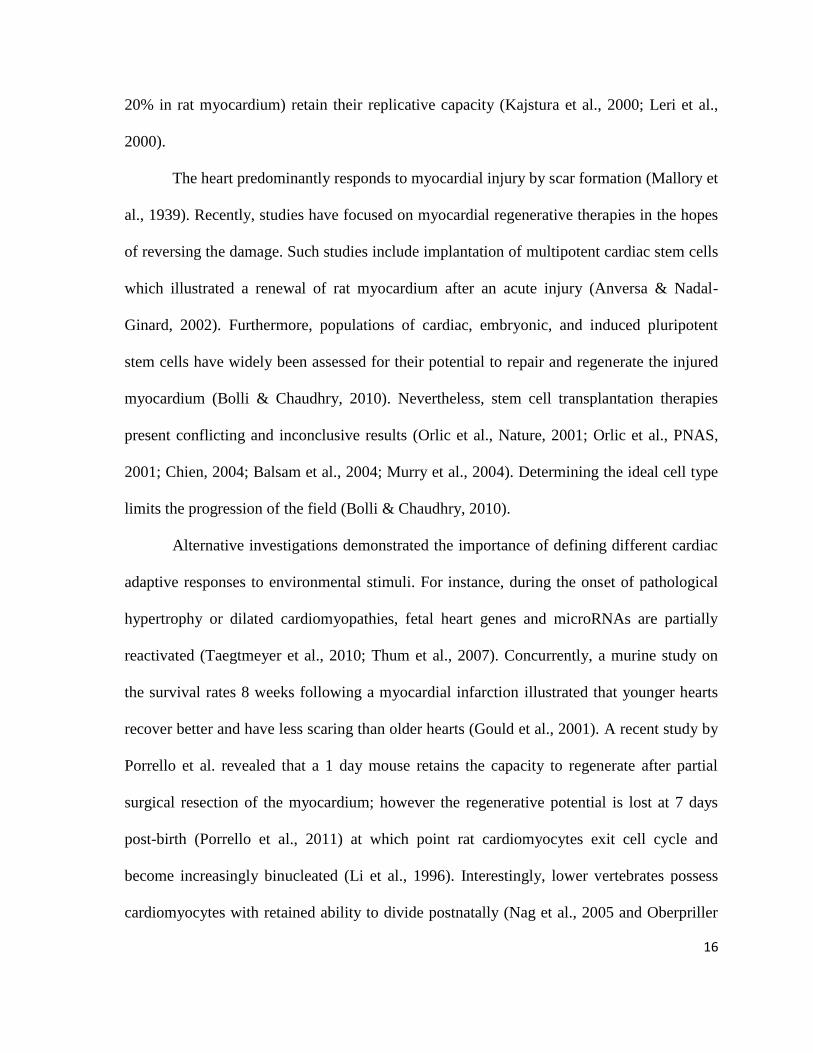
Figure 1: Cardiomyocyte terminal differentiation occurs shortly after birth and is
characterized by a transition from a hyperplastic to a hypertrophic growth. A)
Cardiomyocyte DNA synthesis and binucleation during murine development. Proliferation
index (black circles) determined via autoradiography of isolated tritiated thymidine cell
preparations. Binucleation index (red circles) identified by DAPI immunofluorescence assay
of isolated cells. [Adaptation of "Cardiomyocyte DNA synthesis and binucleation during
murine development" by Soonpaa et al., 1996 that appeared in The American Journal of
Physiology of the American Physiological Society. The American Physiological Society has
not endorsed the content of this adaptation or translation, or the context of its use.] B)
Mouse neonatal cardiomyocytes isolated from 3 day and 10 day old hearts illustrating mono-
and binucleated phenotypes. Nuclei labeled with propidium iodide (red) and F-actin with
phalloidin (green). C) Hearts isolated from mice at 1 and 10 days post-birth demonstrate the
increase in heart volume with age. D) Mouse cardiomyocyte nuclei count per cell
(±Standard Deviation), at 3 and 10 days post-birth. E) Murine heart and body mass
(±Standard Deviation) increases in parallel during development. Panels B, C, D, and E are
provided by the Burgon lab (unpublished data).
14
B. C.
D. E.
A.
15
Radiolabeling mouse cardiomyocytes with tritiated thymidine demonstrates the gradual
decrease in proliferation which coincides with the appearance of binucleation, characterizing
the hyperplastic and hypertrophic growth patterns (Figure 1A; Soonpaa et al., 1996). Thus
far, analysis of Sprague-Dawley rat cardiac development narrowed the switch from
hyperplastic and hypertrophic growth to 3 and 4 days post-birth (Li et al., 1996; Poolman &
Brooks, 1998) whereas the shift is known to manifest in humans between 3 to 6 months of
age (Tam et al., 1995).
Regenerating Muscle
The adult heart has long been believed to be incapable of regenerating injured muscle (Tam
et al., 1995; Zak, 1974). That ability is thought to be lost during the perinatal transition,
when cardiomyocytes exit the cell cycle and become terminally differentiated (Armstrong et
al., 2000). The heart‟s restricted capacity to regenerate is reinforced by the knowledge that
primary cardiac sarcomas are rare (Simpson et al., 2008). In fact, some evidence has
emerged proving that the heart may possess limited ability to renew cardiomyocyte pools.
Bergmann et al. (Bergmann et al., 2009) reported that 50% of human cardiomyocytes
are renewed during a normal life span. The Frisén group proved that human cardiomyocytes
are restored at a 1% turnover rate per year until the age of 25 followed by a decrease to
0.45% at the age of 75. This work capitalized on the release of 14
C generated by nuclear
bomb testing during the Cold War to radiocarbon date human cardiomyocytes.
Moreover, the majority of cardiomyocytes originating from a mature heart are said to
be terminally differentiated, keeping in mind that a fraction of younger cardiomyocytes (15-
16
20% in rat myocardium) retain their replicative capacity (Kajstura et al., 2000; Leri et al.,
2000).
The heart predominantly responds to myocardial injury by scar formation (Mallory et
al., 1939). Recently, studies have focused on myocardial regenerative therapies in the hopes
of reversing the damage. Such studies include implantation of multipotent cardiac stem cells
which illustrated a renewal of rat myocardium after an acute injury (Anversa & Nadal-
Ginard, 2002). Furthermore, populations of cardiac, embryonic, and induced pluripotent
stem cells have widely been assessed for their potential to repair and regenerate the injured
myocardium (Bolli & Chaudhry, 2010). Nevertheless, stem cell transplantation therapies
present conflicting and inconclusive results (Orlic et al., Nature, 2001; Orlic et al., PNAS,
2001; Chien, 2004; Balsam et al., 2004; Murry et al., 2004). Determining the ideal cell type
limits the progression of the field (Bolli & Chaudhry, 2010).
Alternative investigations demonstrated the importance of defining different cardiac
adaptive responses to environmental stimuli. For instance, during the onset of pathological
hypertrophy or dilated cardiomyopathies, fetal heart genes and microRNAs are partially
reactivated (Taegtmeyer et al., 2010; Thum et al., 2007). Concurrently, a murine study on
the survival rates 8 weeks following a myocardial infarction illustrated that younger hearts
recover better and have less scaring than older hearts (Gould et al., 2001). A recent study by
Porrello et al. revealed that a 1 day mouse retains the capacity to regenerate after partial
surgical resection of the myocardium; however the regenerative potential is lost at 7 days
post-birth (Porrello et al., 2011) at which point rat cardiomyocytes exit cell cycle and
become increasingly binucleated (Li et al., 1996). Interestingly, lower vertebrates possess
cardiomyocytes with retained ability to divide postnatally (Nag et al., 2005 and Oberpriller
17
et al., 1995). Identifying the differentiating factors between higher and lower vertebrates
may be a promising lead in reverse engineering damaged myocardium.
Given the importance of cardiomyocyte developmental capacity, understanding the
factors involved in remodeling events, in particular in the transition from a hyperplastic- to
hypertrophic-based growth, may provide insight for potential therapies in myocardial repair
and regeneration after injury.
Genetically Engineered to Grow
The initiation of cardiac growth in utero and the maintenance of adult cardiac function are
mediated by cardiogenetic programs (Fuster & King, 2008). Cardiac development research
has mainly been regarded in the literature as two separate entities, that of prenatal and adult
heart growth, with little known about the transition between the two types of growth
patterns.
Key players controlling both prenatal development and adult homeostasis include
Wnt (Grigoryan et al., 2008) and Notch signaling (Nemir & Pedrazzini, 2008). Loss- and
gain-of-function mutations of the Wnt pathway (through mutations of β-catenin) were
shown to cause defects in heart formation and ventricular outflow tract (Ai et al., 2007;
Baurand et al., 2007; Chen et al., 2006; Cohen et al., 2007; Kioussi et al., 2002; Klaus et al.,
2007; Kwon et al., 2007; Lickert et al., 2002; Liebner et al., 2004; Lin et al., 2007; Qu et al.,
2007; Qyang et al., 2007; Zamora et al., 2007; Zhou et al., 2007). Moreover, loss- and gain-
of-function mutations in the Notch pathway (notably Notch1, Notch2, RBP-J, Jagged1, Dll4,
Hey1, Hey2, and HeyL) resulted in impaired cardiac development, hypoplasia, pericardial
edema, enlarged hearts, ventricular defects, and malfunctioning hypertrophy (Swiatek et al.,
18
1994; McCright et al., 2001; Xue et al., 1999; Timmerman et al., 2004; Grego-Bessa et al.,
2007; Duarte et al., 2004; Watanabe et al., 2006; Xin et al., 2007; Donovan et al., 2002;
Gessler et al., 2002; Kokubo et al., 2005; Kokubo et al., 2004; Fischer et al., 2004; Xiang et
al., 2006; Conlon et al., 1995; Krebs et al., 2003; Oka et al., 1995; McCright et al., 2002;
Fischer et al., 2007).
The Prenatal Heart
The prenatal heart is exposed to a hypoxic environment and mainly depends on
carbohydrates (lactate and glucose) as a source of adenosine triphosphate (ATP) (Bartelds et
al., 2000). Interestingly, the heart expresses different genetic isoforms of a particular protein
dependent upon the developmental stage. In accordance, the fetal heart expresses α-skeletal
actin and compliant titin isoforms (i.e. N2BA1/N2BA2) (Lahmers et al., 2004; Schwartz et
al., 1992) as well as other factors associated with tolerance of low levels of oxygen (Bishop,
1990).
Transcription factors (TF) have been extensively studied and identified as regulators
of differentiation and growth of the developing heart. In particular, β-MHC is regulated by
Nkx2.5, MEF2C, and GATA4/5/6, and then inhibited by thyroid hormone to give rise to α-
MHC at maturity (Morkin, 2000). Other TFs encompass different stages of heart
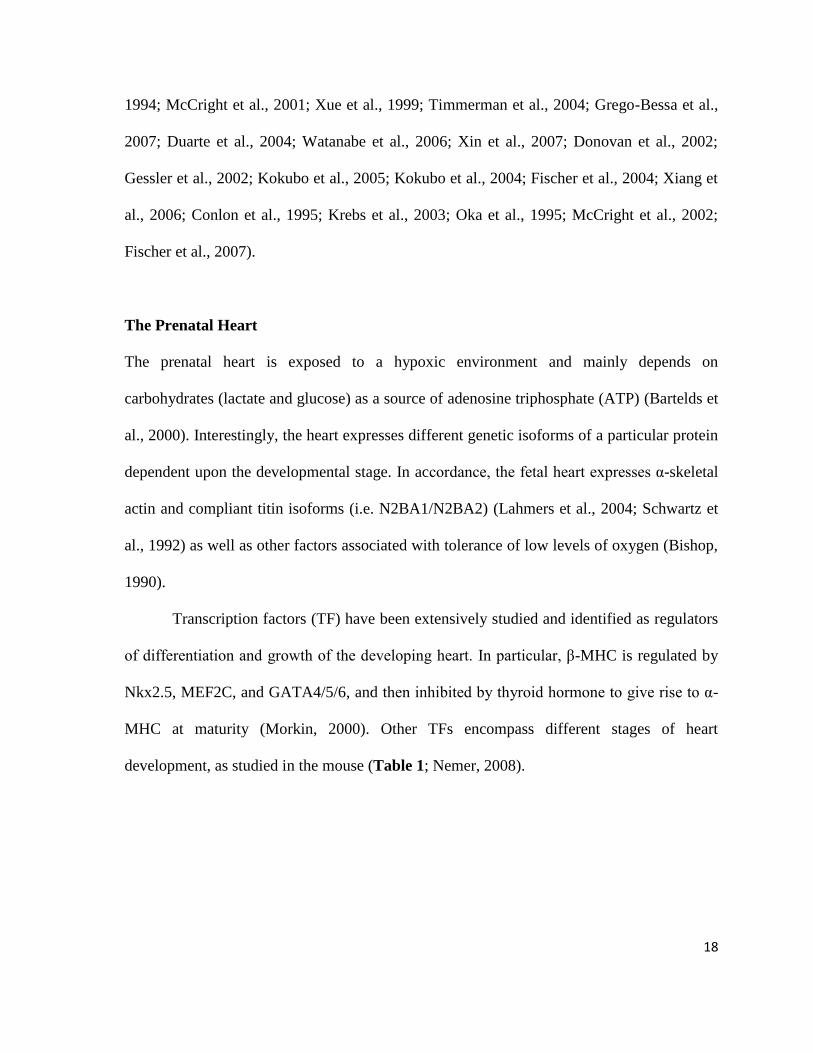
development, as studied in the mouse (Table 1; Nemer, 2008).
19
Table 1: Transcription Factors Mediating Prenatal Cardiac Development.
Cardiac Development Stage Age Transcription Factors
Cardiac Crescent E7.5 GATA4, Mesp1/2, Nkx2.5
Linear Heart E8 GATA4
Chamber Formation E8.5 to E12 GATA4, Nkx2.5, Tbx5, dHand, eHand,
Pitx2, MEF2C
Maturation and Septation E12 to birth
GATA4, Nkx2.5, Tbx5, Rxrα, FOG-2,
TEF-1, Sox4, NF-Atc, Pitx2, CITED,
ZIC3, Hey2, Tbx1
Olson et al. focus on a “core cardiac network” involving NK2, MEF2, GATA, Tbx and
Hand as essential genes in cardiomyocyte differentiation and cardiac morphogenesis,
claiming that this “heart kernel” is evolutionary inflexible (Olson, 2006). Other factors
associated with prenatal heart development include positive cell cycle regulators (ie. cyclins,
Cdks…) which coincides with a known increase in cardiomyocyte cell cycle activity
(Pasumarthi & Field, 2002).
The Perinatal Heart
The perinatal heart undergoes anatomical, physiological and biochemical changes to
promote the conversion from a hyperplastic to hypertrophic heart. Knowledge concerning
the transitional cardiac period is slowly developing, albeit with several gaps. The transitional
cardiac period in mice is believed to span embryonic day 19 until 10 days post-birth
(Soonpaa et al., 1996).
Thyroid hormone (TH) is known to be a major regulator of normal heart function
(Brent, 2000). Coined as the “Master Maturator”, thyroid hormone acts to promote (i.e. α-
MHC and sarcoplasmic reticulum calcium ATPase) and prevent (β-MHC and
phospholamban) expression of cardiac genes (Danzi & Klein, 2004; Ojamaa et al., 1992;
20
Kahaly & Dillmann, 2005). Mice have rapidly beating hearts which invokes a pressure
overload and consequently a transcriptional switch from β- to α-MHC (Fuster & King,
2008). Both isoforms are present in the heart, however the beta isoform predominates during
embryogenesis and fetal development followed by a shift to the alpha isoform soon after
birth. Transcript expression levels of both isoforms drastically plunges until one day after
birth whereby α-MHC is established and remains elevated throughout adulthood (Ng et al.,
1991).
Additionally, HDAC1 and HDAC2 were found to be associated with perinatal
development through deletion experiments. Cardiac-specific deletion of either HDAC1 or
HDAC2 in mice did not demonstrate cardiac defects, whereas mice lacking both HDAC1
and HDAC2 illustrated dilated cardiomyopathy, arrhythmia, and neonatal lethality.
Furthermore, global deletion of HDAC2 in mice did not cause any discernable effects until
the perinatal period where mice presented cardiac defects (elimination of the right ventricle
lumen, pathological hyperplasia, apoptosis of cardiomyocytes, and bradycardia)
(Montgomery et al., 2007). Lastly, cell cycle regulators are dysregulated during the
transition from a developing to a senescent heart (Brooks et al., 1997; Poolman & Brooks,
1998).
The Adult Heart
Genetic programs in the adult heart involve many homeostatic and adaptive mechanisms
including maintenance of calcium influx, calcium handling, contraction, and myocardium
survival (Cartwright et al., 2005).
21
Myocardin appears to be a leading factor in heart function and cardiomyocyte
survival as the deletion of Myocardin in the adult heart caused rapid-onset heart failure,
dilated cardiomyopathy and death within a week (Huang et al., 2009). The adult heart
endures a more stringent hemodynamic load when compared to a fetal heart which causes
the switch in metabolic pathways from glucose oxidation to fatty acid oxidation
(Taegtmeyer et al., 2010). Similar to the perinatal heart, the adult heart takes part in isoform
switching, in particular with the abundance of α-cardiac actin and adult titin isoforms
(Lahmers et al., 2004; Schwartz et al., 1992). Transcription factors regulating cardiac
hypertrophy include GATA4, NFAT, Csx/Nkx2.5, SRF, MEF2, Hand1/2, and Smad
(Akazawa & Komuro, 2003).
Hormones play a vital role in normal physiological development, barring no
exception to the heart. Hypertrophic growth of the heart is suggested to be regulated by
multiple factors including hormones such as fibroblast growth factor (FGF) (Topper, 2000)
and adrenergic receptors for norepinephrine (Barki-Harrington et al., 2004). Other common
hormones include Insulin-like Growth Factor-1 (IGF-1) (McMullen et al., 2004) and thyroid
hormone (TH) (Brent, 2000). Studies have shown the importance of IGF-1 in physiological
cardiac hypertrophy. Essentially, IGF-1 receptors are tyrosine kinases present on the
sarcolemmal membrane of cardiomyocytes involved in inducing growth signals to the
nucleus and protein synthesis machinery by activating the PI3-K/PDK1/Akt-dependent
signal transduction pathway (McMullen et al., 2004).
Conversely certain negative cell cycle regulatory genes (i.e. Cdk inhibitors) are
increased in the adult heart which coincides with decreased cardiomyocyte cell cycle
activity (Pasumarthi & Field, 2002).
22
Cardiomyocyte Cellular Regulation
The interplay between hyperplastic and hypertrophic cardiac growth entails a heterogeneous
population of mono- and binucleated cardiomyocytes as a result of cardiomyocytes
undergoing a final round of karyokinesis (nuclear division) in the absence of cytokinesis
(cell division) (Li et al., 1997; Li et al., 1997). Karyokinesis and cytokinesis are generally
tightly coupled processes but are inexplicably dissociated in cardiomyocytes. The majority
of late neonatal (after day 4 in the rat) and adult cardiomyocytes withdraw from cell cycle
and are blocked in G0/G1 or G2/M (Brooks et al., 1997; Poolman & Brooks, 1998).
Specifically, 85% of adult cardiomyocytes arrest in G0/G1 and the remaining 15% in G2/M
(Li et al., 1998). It is believed that adult cardiomyocytes lose the capacity to divide due to
negative regulators of cell cycle (Capasso et al., 1992).
Furthermore cardiogenetic programs are differentially expressed between a prenatal
and an adult heart. Late neonatal and adult hearts have depleted expression of factors
involved in cell cycle progression and growth whereas structural proteins and stress
response factors are upregulated, as determined by microarray gene expression profiles
(Chen et al., 2004).
Generally, cell cycle includes positive (cyclin and cyclin-dependent kinases) and
negative (cyclin-dependent kinase inhibitors) cell cycle regulators (McGill & Brooks, 1995).
Cell cycle progression is regulated by the interplay between cyclins and cyclin-dependent
kinases (CDKs). Moreover cyclins are classified by cell cycle phase (Table 2).
23
Table 2: Cyclins Modulating Cell Cycle Stages.
Cell Cycle Associated Cyclin Reference
G1 Cyclin D1, D2, D3, and E
Hunter & Pines, 1991
and 1994; Murray &
Hunt, 1993
S Cyclin E and A
G2 Cyclin A and B
M Cyclin B
D-type cyclins bind to CDK4 and CDK6 whereas cyclin E associates with CDK2, in
order to control progression through G1/S (Kang et al., 1997). Cyclin A interacts with CDK2
or cdc2 to allow S/G2 phase transition (Kang & Koh, 1997). Lastly, cyclin B associates with
cdc2 and regulates entry into mitosis (Lees, 1995; Morgan, 1995).
Cyclin/CDK function is controlled by cyclin availability and the phosphorylated
state of CDK residues (Morgan, 1995). In mammals, the cyclin B1/cdc2 complex is
inactivated by the Wee1 kinase which phosphorylates cdc2 on tyrosine 15 and threonine 14;
conversely, the complex is activated by the phosphatase Cdc25A, B or C (Morgan, 2007).
Wee1 and Cdc25 mediate cell cycle by preventing premature mitosis when DNA is
unreplicated or damaged (Morgan, 2007). Therefore cyclins involved in G1 and S are
expressed in parallel with DNA synthesis (embryonic and early neonatal cardiac
development); however G2 and M phase cyclins decline with an arrest in DNA synthesis
(late neonatal heart development).
Previous reports have stressed the importance of studying genetic expression patterns
in the developing heart, with a focus on positive and negative cell cycle factors (Chen et al.,
2004; Sehl et al., 2000). During early neonatal development (at 2, 3, 4 and 5 days of age in
Wistar rats), cardiomyocytes are increasingly in G0 or G1 and decreasingly in S and G2/M
24
phases of cell cycle (Poolman & Brooks, 1998). Particularly, cyclins and CDKs have been
reported to be highly expressed during embryonic development but decrease with age; G2/M
phase cyclins are depleted more rapidly than G1/S cyclins and CDKs (Kang et al., 1997).
In the rat, cyclin D1 expression decreases when comparing hearts aged 0, 7, and 14
days post-birth as well as adult hearts (Chen et al., 2004). G1 cyclins (D2 and D3) slightly
increase between 2 and 5 days post-birth while S phase cyclins (cyclin A and E) decrease
with development (Yoshizumi et al., 1995; Brooks et al., 1997). M phase cyclin B transcript
expression oscillates whereby the abundance of B1 is highest at day 0, decreases at 7 days,
slightly increases at 14 days, then redescends at adulthood (Chen et al., 2004).
Cdc2 and CDK2 proteins have been shown to decrease while CDK4 and CDK6 are
slightly enhanced during the transitional period (Poolman & Brooks, 1998). In fact, cell
cycle activators, cdc2, cdc25, cdc42 are downregulated from day 0 to 7 and 14 days post-
birth as well as adulthood (Chen et al., 2004). In contrast, CDK inhibitors (p18, p57, p21,
p27) are upregulated in cardiomyocytes through the late gestational and neonatal period
(Poolman & Brooks, 1996 and 1998; Chen et al., 2004).
It is believed that cyclin B1 and cdc2 complex formation and activation influences
entry into mitosis (Bicknell et al., 2004; Kang et al., 1997). Hypertrophic growth entails
G2/M arrest which is suggested to be mediated by the absence of the cyclin B1/cdc2
complex (Bicknell et al., 2004). Interestingly, Carmena et al. illustrated that downregulation
of cyclin B1 and cells exiting the M phase correlate with multinucleation of Drosophila
spermatids (Carmena & Riparbelli, 1998).
G1 phase CDKs mainly target the retinoblastoma protein (Rb). Cyclin D/CDK4
complex phosphorylates members of the Rb family in late G1 preventing Rb‟s inhibitory role
25
on growth which promotes the transition to the S phase (Kang & Koh, 1997). The synthesis
and abundance of D-type cyclins is highly dependent upon the stimulation of growth factors
(Sherr, 1993 and 1994). Rb, p107 and p130 make up the mammalian “pocket protein”
family responsible for governing biological processes through interactions with cellular
proteins (Poznic, 2009). Rb associates with members of the E2F family, which are
responsible for activating transcription of genes involved in DNA synthesis and cell cycle
progression (Field, 2004). The unphosphorylated state of Rb promotes binding with E2F,
while phosphorylation of Rb disrupts Rb/E2F binding. E2F may initiate transcription when
unbound to Rb. Hence, phosphorylated Rb accumulates in S phase while the
unphosphorylated form is predominantly in G1 (Poznic, 2009). There appears to be
conflicting and inconclusive results for Rb expression during perinatal heart development
(Kim et al., 1994; Jiang et al., 1997; MacLellan et al., 2005).
microRNA IN HEART DEVELOPMENT AND DISEASE
Recent findings dispute the unidirectional central dogma whereby the genetic flow of DNA
to RNA to protein is transformed into a complex system of intertwined networks. Therefore
genetic regulation should be viewed keeping in mind that the supposed „junk‟ DNA in fact
includes RNA-based regulatory factors (non-coding RNAs such as microRNA, piRNA,
rasiRNA etc.) (Condorelli and Dimmeler, 2008). Emerging studies highlight the importance
of a new class of small non-coding RNAs, microRNAs, in the regulation of post-
transcriptional gene expression. A single microRNA (miRNA) is estimated to target and
modulate more than 200 coding genes (Krek et al., 2005). miRNAs are abundant in most
tissues (1,000-30,000 copies per cell (Allawi et al., 2004)) and are believed to mediate a
26
wide variety of normal and pathological cellular processes. In particular, these small RNAs
are expressed in the heart and have been shown to modulate myogenesis, cardiac
development, cardiac performance, cardiomyocyte hypertrophy, cardiac ion channels,
myocardial growth, electrical balance, and angiogenesis (Zorio et al., 2009). Although
miRNA knowledge has seen a great growth spurt, its involvement in cardiac development
remains largely unknown.
microRNA Discovery
First described in 1993 by Victor Ambros and colleagues during an investigation of C.
elegans, lin-4, a small RNA pair that did not code for a protein, was suggested to regulate
gene expression. At the same time, Gary Ruvkun and colleagues demonstrated lin-14 as the
first miRNA target gene, describing a novel post-transcriptional gene regulation method. It
was not until seven years later that Ruvkun identified the second miRNA named let-7,
another C. elegans gene encoding the RNA that promotes the transition from late-larval to
adult cell fates. Strong conservation of the latter miRNA caused a widespread interest into
the miRNA world. miRNAs may be found in various organisms ranging from protozoans to
humans (Appasani et al., 2007).
Despite the strong conservation of miRNAs between kingdoms, there are important
differences in terms of the specialized miRNA activity. The majority of plant miRNAs have
perfect homology to their target messenger RNA (mRNA), and they act through the RNAi
pathway to cause mRNA degradation (Rhoades et al., 2002). Similar to animal miRNAs,
some plant miRNAs base-pair imperfectly with their target sites. In plants and yeast there is
also evidence that miRNAs are involved in repression of transcription by guiding chromatin
methylation (Gonzalez et al., 2008).
27
microRNA Biogenesis and Silencing Activity
Encoded in introns of non-coding or coding genes and in exons of non-coding genes (Chu &
Rana, 2007), miRNAs are estimated to be 22 nucleotide(nt)-long single-stranded regulatory
elements (Ambros, 2004). miRNAs originate from the transcription of precursor molecules,
known as pri-miRNA, by RNA polymerase II in the nucleus. The primary transcripts are
then cleaved by Drosha-DGCR8, an RNase III family endonuclease, to generate stem-loop
structured precursors (pre-miRNA) of 70-100nt long (Srivastava & Cordes, 2009). This
short hairpin-structured RNA is recognized by the nuclear export factor, Exportin-5 which
partners with Ran-GTP-binding protein to form a nuclear transport complex that translocates
pre-miRNAs into the cytoplasm (Thum et al., 2008). Once in the cytoplasm, premature
miRNAs are processed by Dicer, the second RNase III endonuclease, into 22nt duplexes of
mature miRNAs. One strand of the mature miRNA duplex is then loaded onto the RISC
(RNA-Induced Silencing Complex) and the other is degraded. A miRNA combined with the
RISC, entitled miRISC, may exert gene silencing on its target via a perfect or imperfect base
pairing interaction (Chu & Rana, 2007). It is believed that the miRISC mainly targets the
3‟UTR of transcripts but it has been recently shown that the coding sequence and the 5‟UTR
may be alternative miRNA target sites (Tay Y, 2008; Lee et al., 2009). Gene silencing is
performed by: 1) repressing protein translation; 2) accelerating mRNA degradation; or 3)
sending mRNA to P-bodies for storage. These procedures depend on the level of
complementarity between the miRNA and the transcript (Song, 2006). Messenger RNAs
sequestered to storage compartments may be released and translated as a result of an
environment change or stimuli induction (Chu & Rana, 2007).
28
Mice Versus Humans
Mice and humans have extensively been shown to have high genetic conservation through
linkage groups (DeBry and Seldin, 1996; Eppig and Nadeau, 1995), with no exceptions to
miRNA expression. There are presently 851 cloned or computer-predicted human miRNAs
in the NIH miRNA database, miRBase (Wellcome Trust Genome, 2007); however, it is
thought that there are more likely 1000 human miRNAs (Griffiths-Jones et al., 2008). Mice
have approximately 793 predicted miRNAs, 70 are suggested to be primarily acting in the
heart (Shahi et al., 2006).
microRNA and Heart Disease
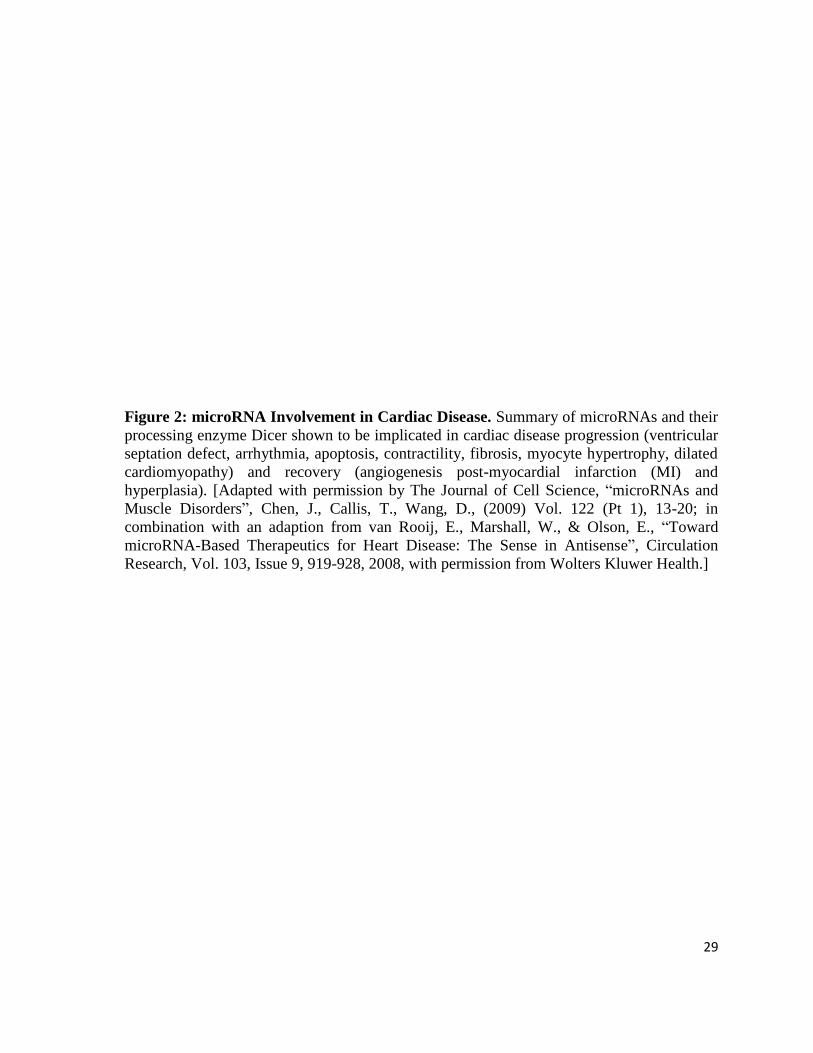
Many studies have demonstrated the great involvement of miRNA in disease. In particular, a
cardiac-specific deletion of Dicer, the miRNA processing enzyme, led to rapid progression
of dilated cardiomyopathy, heart failure, and postnatal lethality (Chen et al., 2008) which
highlights the vital role of miRNAs in normal development and survival. In addition, a
microarray study showed that 87% of the miRNAs that were downregulated in the failing
human hearts were also found to be downregulated in fetal heart tissue, a signature of
hypertrophied and failing myocardium (Divakaran & Mann, 2008). Further analysis of
miRNAs revealed miRNA-specific involvement in cardiac disease including miR-195,
whose expression is known to be upregulated during cardiac hypertrophy and can induce
hypertrophic growth in cultured cardiomyocytes and transgenic mice (van Rooij et al.,
2006). Other miRNAs have also been identified in mice and human to have concurrent roles
in cardiac hypertrophy (Shahi et al., 2006). van Rooij et al. demonstrated that the miR-29
family plays a role in cardiac fibrosis after myocardial infarction (van Rooij et al., 2008).
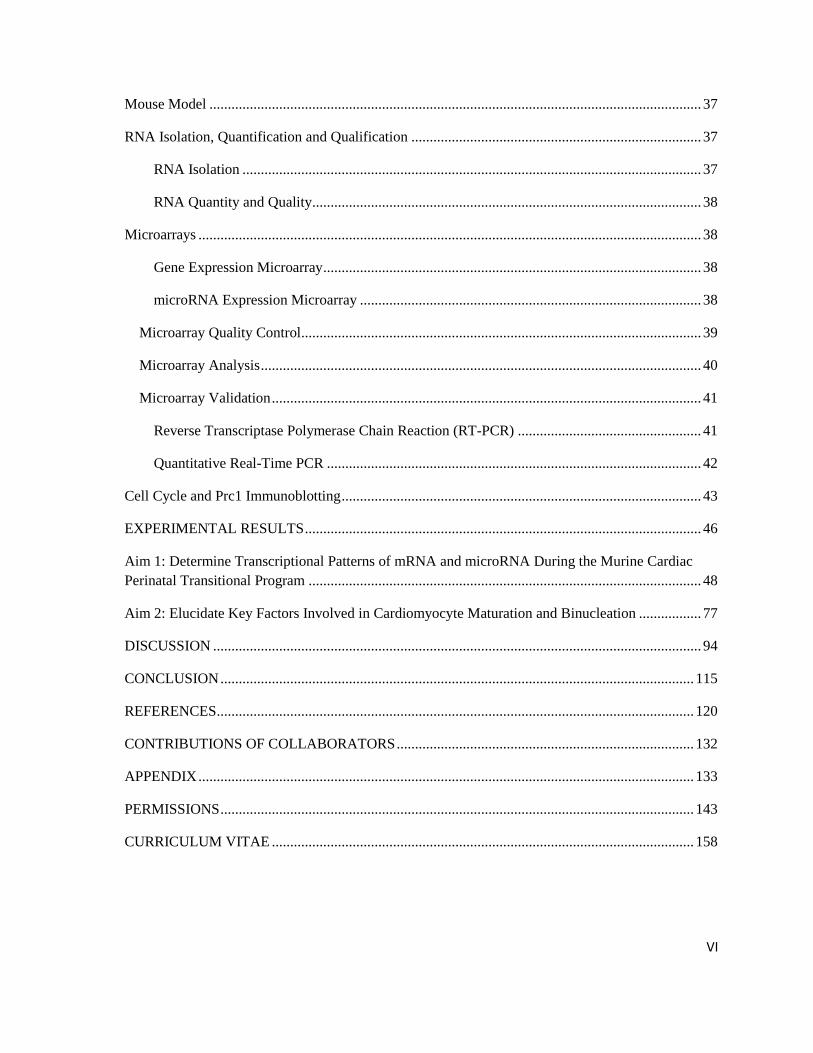
Figure 2 classifies miRNAs into various cardiac defects.
29
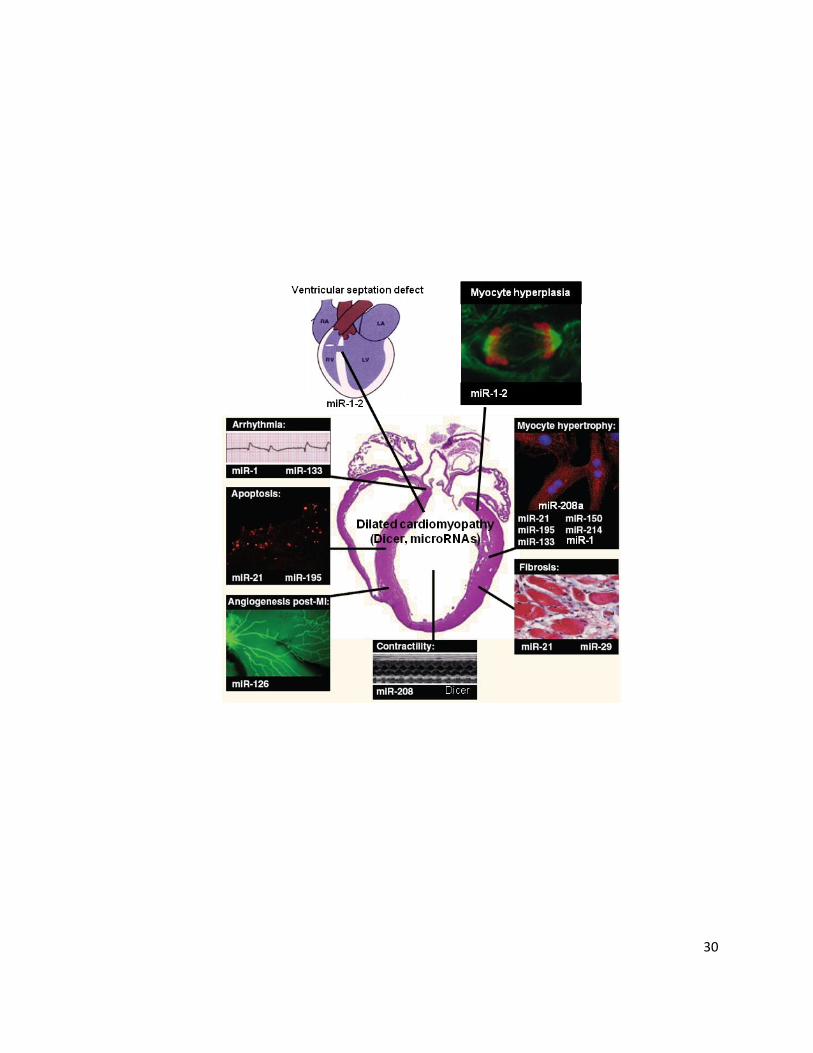
Figure 2: microRNA Involvement in Cardiac Disease. Summary of microRNAs and their
processing enzyme Dicer shown to be implicated in cardiac disease progression (ventricular
septation defect, arrhythmia, apoptosis, contractility, fibrosis, myocyte hypertrophy, dilated
cardiomyopathy) and recovery (angiogenesis post-myocardial infarction (MI) and
hyperplasia). [Adapted with permission by The Journal of Cell Science, “microRNAs and
Muscle Disorders”, Chen, J., Callis, T., Wang, D., (2009) Vol. 122 (Pt 1), 13-20; in
combination with an adaption from van Rooij, E., Marshall, W., & Olson, E., “Toward
microRNA-Based Therapeutics for Heart Disease: The Sense in Antisense”, Circulation
Research, Vol. 103, Issue 9, 919-928, 2008, with permission from Wolters Kluwer Health.]
30
31
CARDIOMYOCYTE MULTINUCLEATION
Multinucleation is the product of cardiomyocytes proceeding through nuclear division with
the absence of cytokinesis (Clubb and Bishop, 1984). Kang and Koh determined that
binucleation of rat cardiomyocytes increases from 2.5% at day 2, 14% at day 4, 50% at day
8, and reaches a plateau of 80% at day 14. In general, 60 to 90% of mammalian
cardiomyocytes become binucleated during hypertrophy (Jackson et al. 1998; Soonpaa et al.,
1996).
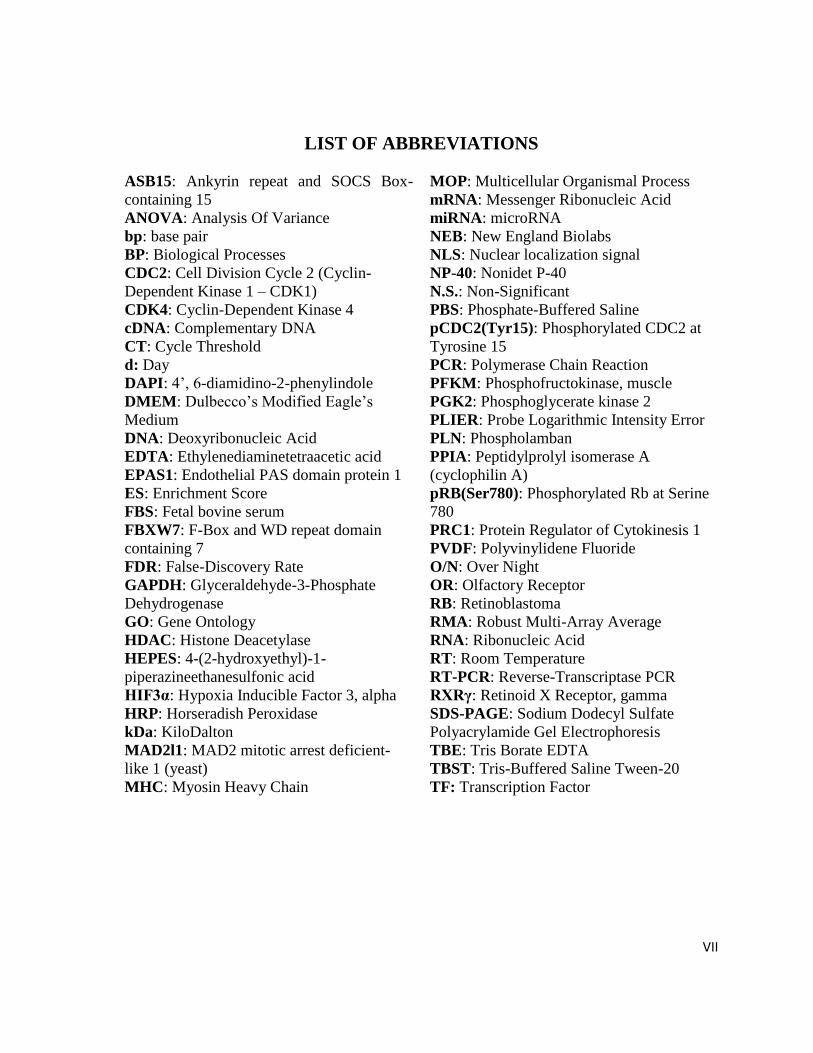
Cardiomyocytes, like all cell types, progress through cell cycle during proliferation.
Key cytoskeletal remodeling events promote cytokinesis to generate two daughter cells
(Figure 3; Glotzer et al., 2005). Between metaphase and anaphase, a network of antiparallel
nonkinetochore interdigitating microtubules are formed linking chromatid pairs, termed the
spindle midzone. The assembly of the midzone is essential in spindle architecture and
elongation as well as proper cleavage furrow alignment (D'Avino et al., 2005; McCollum,
2004). During late anaphase, each set of chromatid is bound to a dense network of
overlapping antiparallel microtubules to form a central mitotic spindle (Mastronarde et al.,
1993). Several proteins including INCENP, survivin, polo, aurora B, Rho and CENP-E
gather at the midzone of mammalian mitotic spindles to regulate cellular cleavage during
late mitosis (Drechsel et al., 1997; Lee et al., 1995; Mackay et al., 1998; Skoufias et al.,
2000; Takada et al., 1996; Terada et al., 1998; Uren et al., 2000; Yen et al., 1992). In
addition, a novel protein named protein regulator of cytokinesis 1 (PRC1) has been shown to
be associated to the central mitotic spindle (Jiang et al., 1998).

32
Recent evidence has emerged highlighting the potential roles of cyclin D1, cyclin G1
and calcyclin binding protein (through CacyBP/SIP) in cardiomyocyte multinucleation (Au
et al., 2006; Liu et al., 2010; Soonpaa et al., 1997).
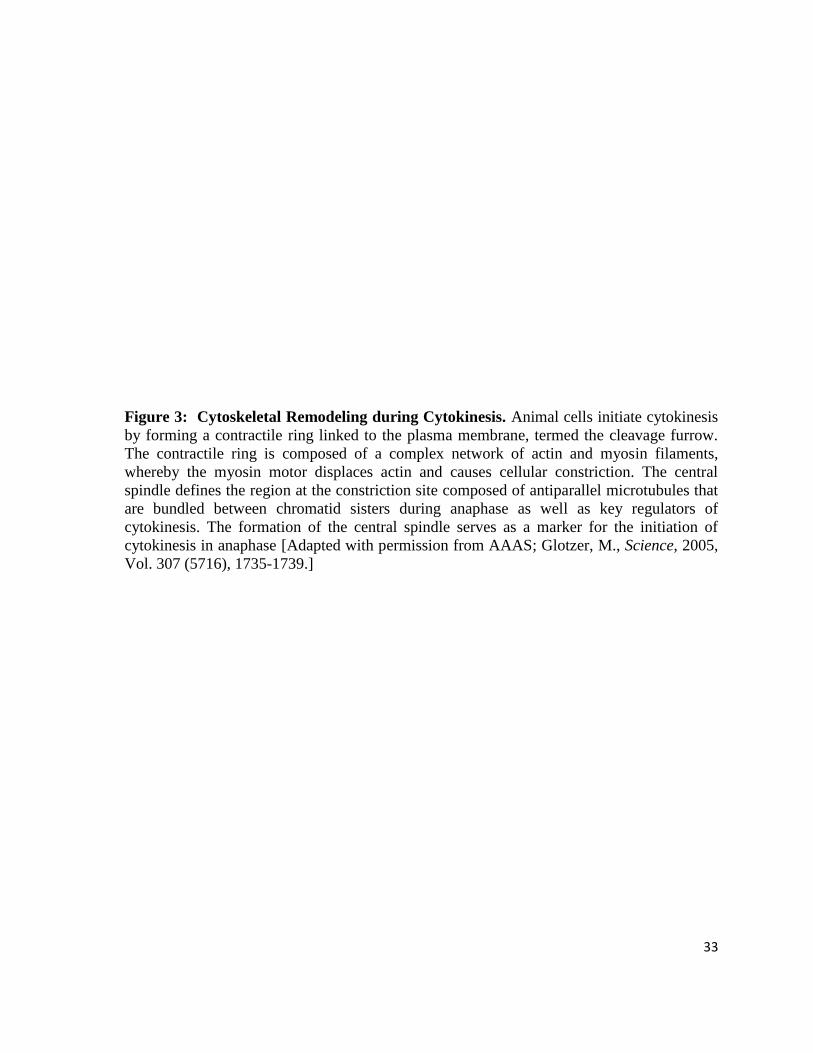
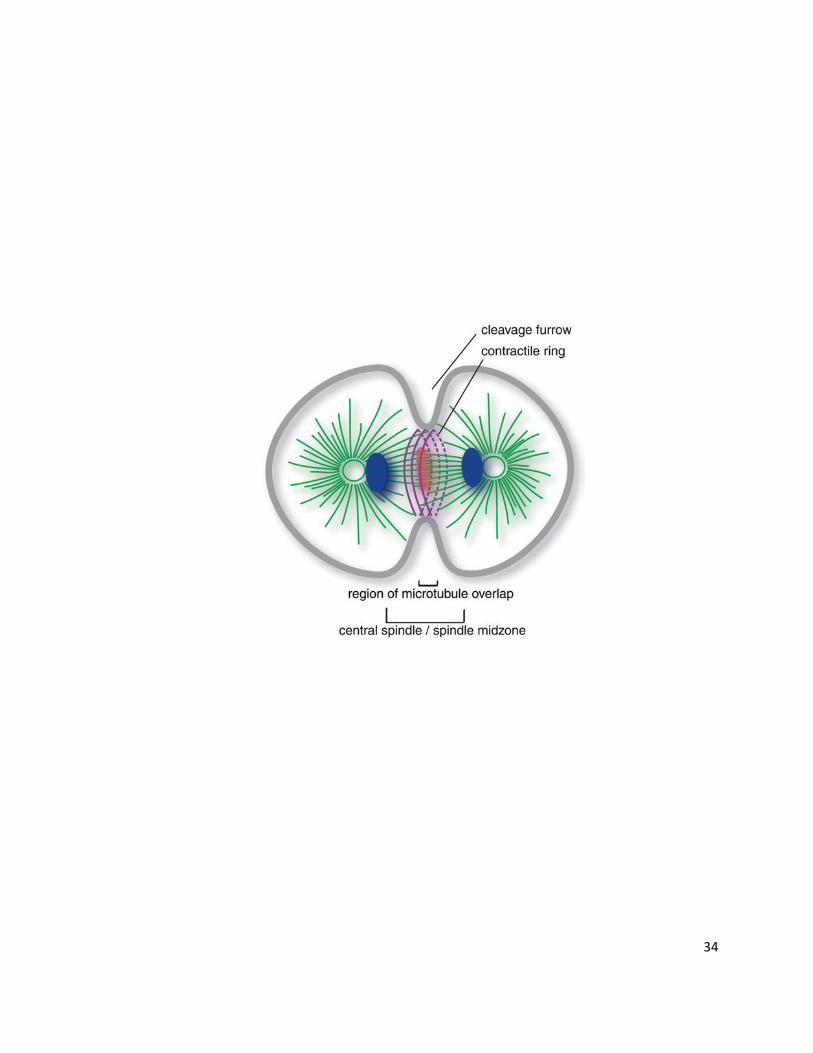
33
Figure 3: Cytoskeletal Remodeling during Cytokinesis. Animal cells initiate cytokinesis
by forming a contractile ring linked to the plasma membrane, termed the cleavage furrow.
The contractile ring is composed of a complex network of actin and myosin filaments,
whereby the myosin motor displaces actin and causes cellular constriction. The central
spindle defines the region at the constriction site composed of antiparallel microtubules that
are bundled between chromatid sisters during anaphase as well as key regulators of
cytokinesis. The formation of the central spindle serves as a marker for the initiation of
cytokinesis in anaphase [Adapted with permission from AAAS; Glotzer, M., Science, 2005,
Vol. 307 (5716), 1735-1739.]
34
35
RATIONALE
The heart undergoes various age-dependent growth stages. In mammals, cardiomyocyte
terminal differentiation occurs shortly after birth and is characterized by a transition from a
hyperplastic to a hypertrophic growth. Hypertrophy entails binucleation of cardiomyocytes
prior to marked cellular volume increase. Genetic networks modulating prenatal and adult
heart development have been separately studied. Anatomical, physiological, and cellular
observations have been revealed within the highly dynamic cardiac perinatal transition;
however key molecular mechanisms and pathways regulating the cardiac perinatal transition
have yet to be elucidated. Chen et al. first introduced global gene expression analysis of
postnatal cardiac development in the mouse; however they focused on large intervals and
disregarded the finer steps in perinatal development. Taking advantage of this knowledge,
the goal of the proposed research is to provide additional depth into the cardiogenomic
perinatal program in the mouse.
HYPOTHESIS
Genetic factors and processes in the cardiac perinatal transitional program can be identified
by systematic analysis of different stages in murine heart development.
EXPERIMENTAL AIMS
1) Determine transcriptional patterns of mRNA and microRNA during the murine
cardiac perinatal transitional program through microarray expression profiles and
gene ontologies.
2) Elucidate key factors involved in cardiomyocyte maturation and binucleation.

36
MATERIALS AND METHODS
37
MOUSE MODEL
Wild-type 129/SV-E mice were utilized to study the molecular mechanisms and factors in
perinatal cardiac development. Mice were maintained at the University of Ottawa Heart
Institute animal facility. All experiments were conducted in conformity with the ethical
standards set by the University of Ottawa Animal Care Committee and Animal Care and
Veterinary Service (ACVS). Mice were inbred and studied at embryonic day 19, as well as
1, 3, 4, 5, 6, 7, 10 days and 6 to 8 weeks post-birth.
RNA ISOLATION, QUANTIFICATION AND QUALIFICATION
RNA Isolation
Hearts were excised from 129/SV-E mice at embryonic day 19 (E19), day 1, 3, 4, 5, 6, 7 and
10 as well as 6-7 weeks post-birth and washed with 1xPBS before being snap-frozen in
liquid nitrogen and stored at -80°C. Total RNA was extracted using appropriate RNase-free
laboratory equipment and environment. Isolation was carried out via Qiagen miRNEasy
Mini Kit (Cat.# 217004) as per manufacturer‟s recommendation (using the bench-top
Polytron Homogenizer with a 7mm generator). Volume of QIAzol is as follows: 700μL for
E19, 1 day (1d), 3 day (3d), 4 day (4d), 5 day (5d), 6 day (6d), 7 day (7d), and 10 day (10d);
and 2100μL for adult. RNA was eluted from the column with nuclease-free water then with
the former eluant. E19 to 10d RNA was eluted with 50μL but adult RNA was eluted with
150μL spread over three columns.
38
RNA Quantity and Quality
After isolation, the RNA purity and yield was determined using the NanoDrop® ND-1000
spectrophotometer via the Nucleic Acid function (Agilent Technologies). The optical
density (OD) measurements were analyzed at wavelengths of 230, 260 and 280. RNA was
considered pure when the OD 260/280 ratio was approximately 2.0 and the 260/230 ratio
between 2.0 and 2.2. Further evaluation of RNA quality was performed for microarray
processing using the Agilent 2100 Bioanalyzer and RNA Nano Chips (Cat.# 5067-1511).
Electropherograms and RNA Integrity Numbers (RIN) were generated from the Total Nano
Eukaryote setting to detect RNA degradation. The RIN is calculated based on the ratio of
28S/18S bands and were between 8.0 and 10. Freeze-thaw cycles were limited as much as
possible.
MICROARRAYS
Gene Expression Microarray
One microgram of total RNA was processed in-house through the Affymetrix GeneChip®
Whole Transcript (WT) Sense Target Labeling Assay kit using Affymetrix GeneChip®
Mouse Exon 1.0 ST Arrays (3/timepoint) which covers approximately 1 million exons.
There are approximately four probes per exon and 40 probes per gene which allows to
analyze expression at the gene and exon level.
For the exon microarrays, three hearts were pooled for each timepoint of interest (E19, 1d,
3d, 5d, 7d, 10d, adult), processed into experimental triplicates, for a total of 63 hearts
analyzed over 21 chips.
39
microRNA Expression Microarray
Profiling was performed in duplicate per timepoint by the Genetic Analysis Facility – The
Center for Applied Genomics (TCAG) at The Hospital for Sick Children. The Illumina
microarray platform contains 656 miRNAs probe set (611 excluding Solexa microRNAs)
based on the Sanger software, Version 12.0. These panels cover approximately 97% of the
microRNAs described by the miRBase database.
For the microRNA microarrays, three hearts were pooled for each timepoint of interest
(E19, 1d, 3d, 5d, 7d, 10d, adult), processed into experimental duplicates, for a total of 42
hearts analyzed over 14 chips.
Microarray Quality Control
Initially, a general visual inspection of each chip was performed after scanning. There were
no white speckles, holes, smudges or areas of saturation. No outliers were found between
replicates for both the exon and microRNA microarrays.
The microRNA microarray quality control was calculated by TCAG prior to
receiving the Illumina data (.txt) (see Appendix – Suppl. Figure 1).
The exon microarray Quality Assurance/Quality Control (QA/QC) was fulfilled
through the Affymetrix Expression ConsoleTM
. Quality controls include the following tests:
1) Labeling controls whereby Lys<Phe<Thr<Dap; 2) Signal Histogram; 3) Pearson‟s
Correlation for RMA Core, PLIER Core, Controls, and RMA Extended; 4) Log Expression
Signal; 5) Relative Signal Box Plot; 6) Relative Log Expression Signal; 7) Box Plot of Probe
Cell Intensity; 8) Relative Probe Cell Intensity; 9) External Spike Controls whereby
40
BioB<BioC<BioD<Cre; 10) Report Metrics (Core and Extended): All_mean, PM_mean,
All_rle_mean, Pos_vs_neg_auc, Bgrd_mean whereby RMA, PLIER, Extended, Core,
Controls, and Samples are within bounds.
Quality of microRNA and exon intensity files were further assessed through Partek®
Principal Component Analysis (PCA) transformation.
Microarray Analysis
Data was analyzed using Partek® Genomics Suite. cDNA was normalized through Robust
Multi-Array Average (RMA) and gene level analysis was run through a 1-way Analysis Of
Variance (ANOVA). microRNA data was processed through a Log2 transformation and a 1-
way ANOVA. Exon and microRNA expression arrays were normalized differently because
of the dissimilar microarray platforms. Data was examined by contrasting one timepoint to
the following (i.e. E19 versus 1 day). All statistical results were run through the False
Discovery Rate (FDR) algorithm to correct for effects introduced by multiple testing
(FDR≤0.05). Post-hoc analysis was performed using the Tukey‟s biweight function.
The 1-way ANOVA provides analytical information including p-values and fold-
changes. Volcano plots were generated with total genes or microRNAs found on the
microarrays, using the Partek® software. To determine the number of significantly
differentially expressed genes and microRNAs, lists were filtered at a p-value≤0.05 and
ranked by fold-change. Gene lists were manually compared to known and predicted mouse
transcription factors (TF) (Riken Transcription Factor Database (TFdb), 2004; Kanamori et
al., 2004) to determine the TFs found on the chip and of those significantly changing
(p≤0.05). Filtered gene lists (p≤0.05) with a FDR≤0.05 were input into the Partek® Gene
41
Ontology (GO) algorithms (Chi-square test and restricted analysis to functional groups with
more than 2 genes and using a default mapping file) to generate GO profiles limited to
Biological Processes and thresholds at an Enrichment Score≥3 and an Age Score≥3. GO
profiles were visualized as Pie Charts (total significantly changing genes) and Forest Plots
(significantly downregulated and upregulated genes). All processes that were not found to be
significant, according to the criteria above, were manually removed.
microRNA and genetic lists were combined to assess in silico microRNA target
predictions, utilizing TargetScan (TargetScanMouse, 2006-2009). GeneMANIA allowed to
localize Prc1 within an in silico association network (Warde-Farley et al., 2010).
After analyzing the microarray data, days 4 and 6 post-birth were included in the study for
the following experiments in order to see if they possess a role in the transitional program.
Microarray Validation
Reverse Transcriptase Polymerase Chain Reaction (RT-PCR)
Transcripts were semi-quantified from wild-type 129/SV-E mice hearts at embryonic day 19
and 1, 3, 4, 5, 6, 7, 10 days post-birth as well as from adult mice (6-7 weeks). RNA was
isolated then DNase-treated using the Promega RQ1 RNase-Free DNase kit (Cat.# M6101)
according to manufacturer‟s recommendation. One microgram of RNA was reverse
transcribed via the New England BioLabs (NEB) M-MuLV Reverse Transcriptase System
(Cat.# M0253L). cDNA was amplified using the NEB Taq DNA polymerase (Cat.#
M0267L) protocol and primers designed through UCSC Blat and IDT (Table 3). All primers
were designed to span two separate exons with the exception of Pln, to prevent amplifying
42
residual genomic DNA. Thermocycler conditions were set as follows: 1 cycle at 95°C for
1min; 35 cycles at 95°C, annealing temperature (TM), and 72°C, for 30sec each; then, 72°C
for 5mins. Annealing temperature for each primer set was optimized through melting curve
experiments. Ten microliters of PCR products were confirmed by size and charge
electrophoresis using a 3% agarose gel in 1X Tris/Borate/EDTA buffer stained with 0.005%
ethidium bromide. Amplification products were approximately 200 base pairs (bp). Gene
products were analyzed and visualized throughout three independent experiments.
Quantitative Real-Time PCR
Transcripts were quantified by relative Real-Time PCR using the Roche LightCycler® 480
Multiwell PCR System, the LC480 machine and the LightCycler® 480 SYBR Green I
Master kit (Cat.# 0470751600), as per manufacturer‟s indication. Real-Time PCR
experiments were realized using 96-well PCR plates (Cat.# 04729692001). RNA was
isolated then DNase-treated using the Promega RQ1 RNase-Free DNase kit (Cat.# M6101)
according to manufacturer‟s recommendation. One microgram of RNA was reverse-
transcribed via the New England BioLabs (NEB) M-MuLV Reverse Transcriptase System
(Cat.# M0253L). Reaction mix was halved to 10μL with: 1.5μL PCR-grade water, 0.5μL
Forward and Reverse PCR primer (5μM), 5μL 2X conc. Master Mix, and, 2.5μL cDNA
(diluted 1:5). Annealing temperature and primer sequences may be found within Table 3.
PCR primer efficiency was calculated with the slope of a standard curve of known cDNA
concentrations at a standard deviation of 0.04 over 4 log quantity differences, run in
technical triplicates. CT values from experimental triplicates were normalized to a calibrator
(adult heart cDNA), reference gene (Ppia), and no-template control (NTC), diluted at 1:5.
43
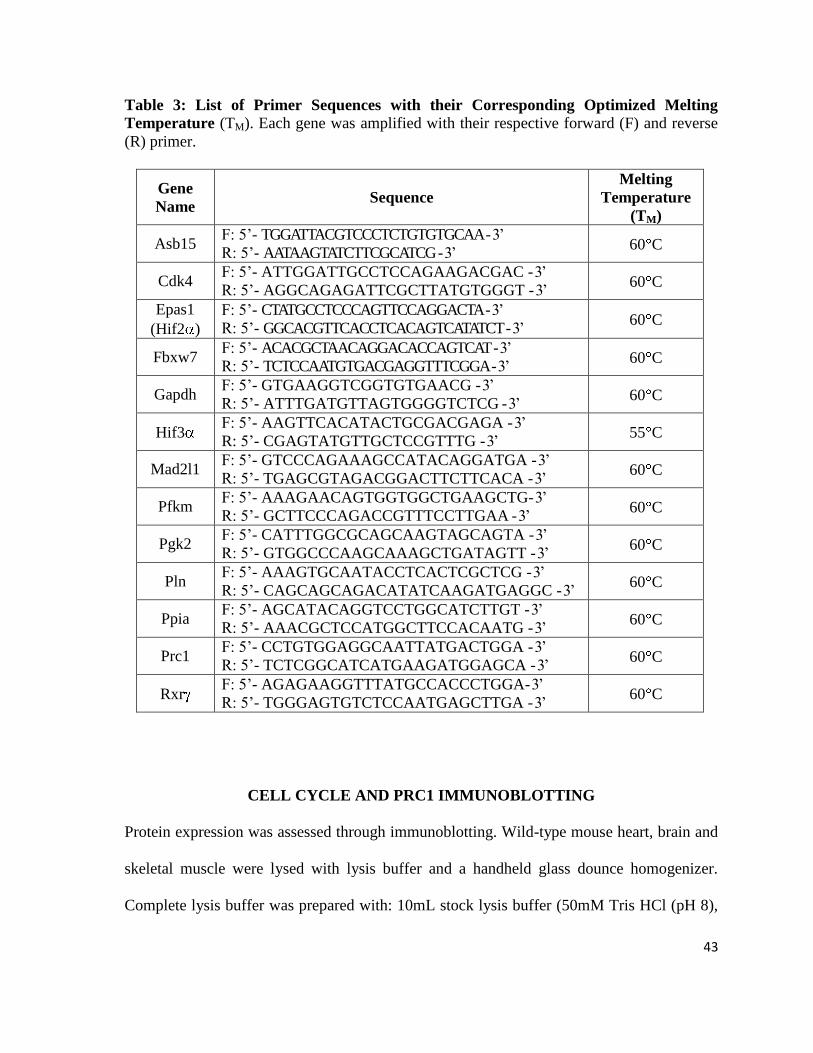
Table 3: List of Primer Sequences with their Corresponding Optimized Melting
Temperature (TM). Each gene was amplified with their respective forward (F) and reverse
(R) primer.
Gene
Name Sequence
Melting
Temperature
(TM)
Asb15 F: 5‟- TGGATTACGTCCCTCTGTGTGCAA - 3‟
R: 5‟- AATAAGTATCTTCGCATCG - 3‟ 60 C
Cdk4 F: 5‟- ATTGGATTGCCTCCAGAAGACGAC - 3‟
R: 5‟- AGGCAGAGATTCGCTTATGTGGGT - 3‟ 60 C
Epas1
(Hif2 )
F: 5‟- CTATGCCTCCCAGTTCCAGGACTA - 3‟
R: 5‟- GGCACGTTCACCTCACAGTCATATCT - 3‟ 60 C
Fbxw7 F: 5‟- ACACGCTAACAGGACACCAGTCAT - 3‟
R: 5‟- TCTCCAATGTGACGAGGTTTCGGA - 3‟ 60 C
Gapdh F: 5‟- GTGAAGGTCGGTGTGAACG - 3‟
R: 5‟- ATTTGATGTTAGTGGGGTCTCG - 3‟ 60 C
Hif3 F: 5‟- AAGTTCACATACTGCGACGAGA - 3‟
R: 5‟- CGAGTATGTTGCTCCGTTTG - 3‟ 55 C
Mad2l1 F: 5‟- GTCCCAGAAAGCCATACAGGATGA - 3‟
R: 5‟- TGAGCGTAGACGGACTTCTTCACA - 3‟ 60 C
Pfkm F: 5‟- AAAGAACAGTGGTGGCTGAAGCTG- 3‟
R: 5‟- GCTTCCCAGACCGTTTCCTTGAA - 3‟ 60 C
Pgk2 F: 5‟- CATTTGGCGCAGCAAGTAGCAGTA - 3‟
R: 5‟- GTGGCCCAAGCAAAGCTGATAGTT - 3‟ 60 C
Pln F: 5‟- AAAGTGCAATACCTCACTCGCTCG - 3‟
R: 5‟- CAGCAGCAGACATATCAAGATGAGGC - 3‟ 60 C
Ppia F: 5‟- AGCATACAGGTCCTGGCATCTTGT - 3‟
R: 5‟- AAACGCTCCATGGCTTCCACAATG - 3‟ 60 C
Prc1 F: 5‟- CCTGTGGAGGCAATTATGACTGGA - 3‟
R: 5‟- TCTCGGCATCATGAAGATGGAGCA - 3‟ 60 C
Rxr F: 5‟- AGAGAAGGTTTATGCCACCCTGGA- 3‟
R: 5‟- TGGGAGTGTCTCCAATGAGCTTGA - 3‟ 60 C
CELL CYCLE AND PRC1 IMMUNOBLOTTING
Protein expression was assessed through immunoblotting. Wild-type mouse heart, brain and
skeletal muscle were lysed with lysis buffer and a handheld glass dounce homogenizer.
Complete lysis buffer was prepared with: 10mL stock lysis buffer (50mM Tris HCl (pH 8),
44
200mM NaCl, 20mM NaF, 20mM β-glycerophosphate, 0.5% NP-40), 5μL sodium vanadate,
1 tablet phosphoStop (Roche, Cat.# 04906837001), 1 tablet complete Mini (Roche, Cat.#
11836153001), 10μL 1M dithiothreitol (DTT). Volume of lysis buffer is as follows: 100μL
for E19 and 1d; 300μL for 3d; 400μL for 4d; 500μL for 5d; 600μL for 6d; 700μL for 7d;
1000μL for 10d; and 3000μL for adult. After thorough homogenization, lysate was
transferred into a 1.5mL centrifuge tube and placed on ice for 15mins, with 5min vortexing
intervals. Lysates were centrifuged at 10,000xg for 10mins at 4°C. Protein samples were
preserved from the supernatant and the precipitate was discarded. Protein concentrations
were calculated using the Bio-Rad Protein Assay system (Cat.# 500-0006) in 96-well flat-
bottom plates. Concentrations were read with a spectrophotometer at 595nm and calculated
through a standard curve with known concentrations of bovine serum albumin (NEB, Cat.#
B9001S). Samples were diluted to 5 or 10μg with sample buffer and 1M DTT (5:1 ratio), as
well as complete lysis buffer, prior to denaturing at 95°C for 5mins.
Protein samples were resolved on 4-15% Biorad Miniprotean TGX precast
polyacrylamide gels (Cat.# 456-1096) in 1X SDS/Tris/Glycine buffer along with
GeneDireX® BLUeye prestained protein ladder (Cat.# PM007-0500). Gels were run for
30mins at 200V prior to transferring to an activated PVDF membrane (Immobilon-P
Transfer Membrane, Millipore) for an hour at 100V (Bio-Rad Criterion Gel Apparatus) in
transfer buffer (190mM glycine, 25mM Tris base, 20% chilled methanol). The gels were
subjected to Coomassie staining (0.2% Coomassie Blue, 7.5% acetic acid, 50% ethanol) for
1 hour at room temperature (RT) followed by overnight (O/N) destaining (50% methanol,
10% acetic acid) to visualize MHC. Blots were incubated with blocking buffer in 1XTBST
(500mM Tris, 1.5M NaCl and 0.05% Tween-20) for one hour at RT on shaker. Blocking
45
buffer utilized was 5% fat-free milk (for Cdc2, Rb, Cyclin B1, and Prc1) or a mix of 1%
milk and 1% BSA (for pCdc2(Tyr15) and pRb(S780)). Membranes were incubated with
primary and secondary antibody with either 1% fat-free milk (Cdc2, Rb, Cyclin B1, and
Prc1) or a mix of 1% milk and 1% BSA (pCdc2(Tyr15) and pRb(S780)) with gentle
shaking. After washing 3 times with 1XTBST, membranes were incubated O/N with
primary antibody at 4°C. The primary antibody dilutions were as follows: 1:500 for Cyclin
B1 (Santa Cruz Biotechnology (SCB), sc-245) and pRb(S780) (SCB, sc-12901); 1:1000 for
Rb (SCB, sc-50), Cdc2 (SCB, sc-747), pCdc2(Tyr15) (SCB, sc-7989); and 1:10 000 of Prc1
(Abcam, ab51248). Prior to incubating the blots with α-Prc1, the rabbit monoclonal antibody
was incubated for 30mins with a blocking peptide at double the amount of Prc1 antibody,
according to manufacturer‟s suggestions. After washing, membranes were incubated with
secondary antibody for 45mins at RT: 1:3000 α-mouse IgG-HRP (Cell Signaling, #7076) for
Cyclin B1; 1:2000 donkey α-goat IgG-HRP (SCB, sc-2020) for pCdc2(Tyr15); α-rabbit
IgG-HRP (Cell Signaling, #7074) for Prc1, Cdc2, Rb, pRb(S780). Immunoblot signals were
detected using a SuperSignal West Pico Chemiluminescent kit (Thermo Scientific, Cat.#
34080) and developed on X-Ray Film (Thermo Scientific Pierce* CL-XPosure, Cat.#
34093,) per manufacturer‟s protocol.
Protein from mouse HL-1 cells was isolated and quantified by Shelley Deeke.
Briefly, the cells were cultured in Claycomb medium supplemented with 10% fetal bovine
serum, 1% v/v penicillin-streptomycin, and 2mM L-glutamine at 37°C, in 5% CO2. HL-1
cells were lysed in 10mM HEPES (pH 7.4), 50mM NaCl, 0.5mM EDTA, 2mM MgCl2,
protease inhibitor cocktail (Roche) and 20mM N-ethylmaleimide. Cell lysates were cleared
and protein concentration was determined as described above.
46
EXPERIMENTAL RESULTS
47
Murine hearts were investigated at different ages within the perinatal cardiogenomic
program utilizing microarray bioinformatic tools. As defined by Soonpaa et al., the
transition from hyperplasia to hypertrophy spans late embryogenesis to 10 days post-birth,
which we refer to as the cardiac perinatal transitional program. As a result, hearts were
investigated prior and after birth, hence during cardiac remodeling and into early maturation.
We chose to analyze hearts initially at embryonic day 19, knowing that mouse gestational
period is between 19 and 21 days, and finally at 6-7 weeks post-birth, when mice have
reached early adulthood. In particular, we sought to determine the changes within small
intervals of the program, thus: E19 versus 1 day (d), 1d versus 3d, 3d versus 5d, 5d versus
7d, 7d versus 10d, and 10d versus adult. Narrowing the analysis permits us to identify
factors and networks regulating each step of the cardiac perinatal transitional program.
48
AIM 1: DETERMINE TRANSCRIPTIONAL PATTERNS OF MRNA AND
MICRORNA DURING THE MURINE CARDIAC PERINATAL TRANSITIONAL
PROGRAM
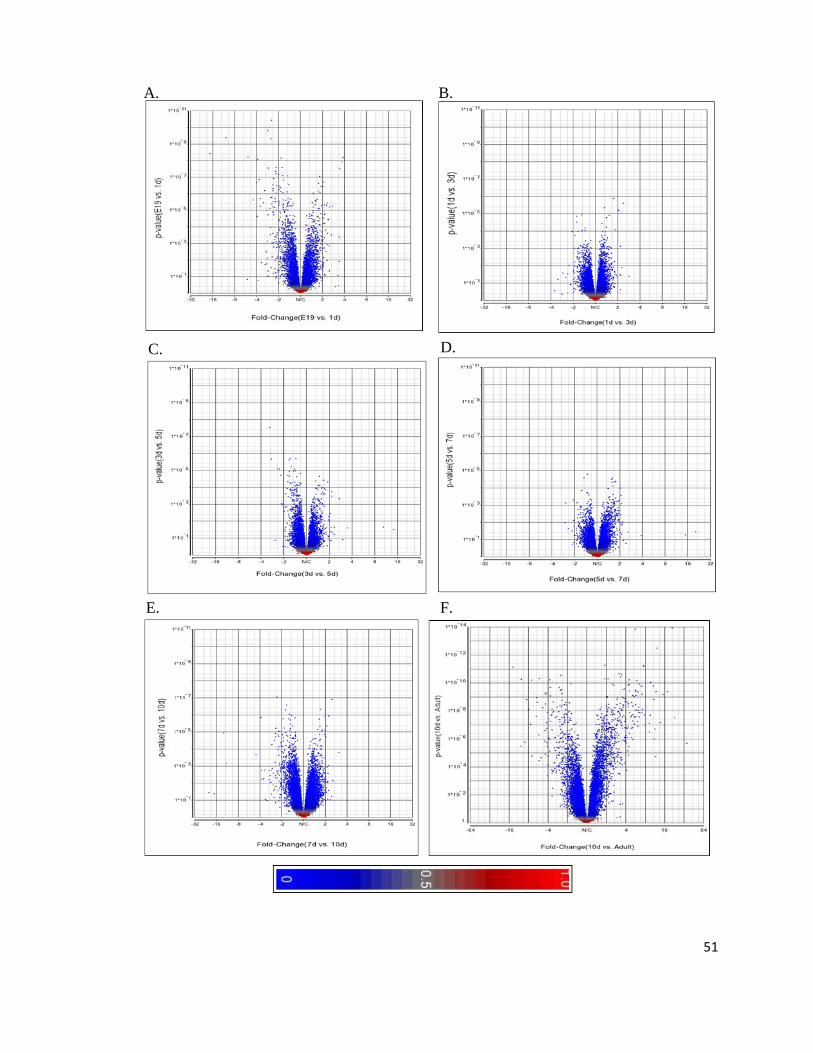
Initially, transcripts were isolated from embryonic day 19 (E19) as well as 1, 3, 5, 7, 10, and
42-49 days (6-7 weeks) post-birth. Transcriptional expression levels were investigated with
exon and microRNA microarrays. After normalizing the data signals, volcano plots were
generated to illustrate the abundance of transcripts and microRNAs changing at different
points in development (Figure 4 and 5). Volcano plots permit a clear visualization of the
number of factors significantly (p≤0.05) upregulated (positive fold-change) and
downregulated (negative fold-change) when comparing one age to another. Our focus is on
small intervals within the transitional period therefore we chose the following intervals: E19
vs. 1d; 1d vs. 3d; 3d vs. 5d; 5d vs. 7d; 7d vs. 10d; and 10d vs. adult.
At the gene level, the volcano plots include the p-value and fold-change for all
16,655 genes found on the microarray (Figure 4). Contrasts between E19 and 10 day have
the same X and Y axes in order to study each contrast in addition to gaining an overall
perspective. It appears that a smaller number of genes are expressed when comparing 1d vs.
3d (B), 3d vs. 5d (C), and 5d vs.7d (D), also there is a similar number of genes significantly
up- and downregulated. On the other hand, the largest cohort of genes significantly changing
is found at E19 vs. 1d (A) and 7d vs. 10d (F). Since an adult heart is markedly different
from a developing heart, the volcano plot for 10d vs. adult had an independent X and Y axis
to avoid misinterpretation of the other plots. As expected, genes were significantly changing
when comparing 10d to adult, with comparable amounts of genes up- and downregulated.
49
At the microRNA level (Figure 5), volcano plots summarize microRNA expression
patterns for the 655 microRNAs found on the Illumina microarray. All the panels [A (E19
vs. 1d), B (1d vs. 3d), C (3d vs. 5d), D (5d vs. 7d), E (7d vs. 10d) and F (10d vs. adult)]
appear to have more microRNAs significantly upregulated than downregulated (p≤0.05).
When comparing 5d and 7d (D), there is a striking reduction in the number of microRNAs
significantly changing (p≤0.05). Panel F further demonstrates the dramatic abundance of
significantly upregulated microRNAs when analyzing a heart aged at 10d versus adulthood
(p≤0.05).
Microarray profiling revealed numerous microRNAs changing during perinatal heart
development including the microRNAs with proven roles in heart development and disease
(Table 4). Lists of varying microRNAs during the transition were generated after filtering at
a p-value≤0.05; results were reduced to the microRNAs with the largest and significant fold-
changes as well as heart-related microRNAs. The largest fold-changes are observed for
upregulated microRNAs at 3d vs. 5d, 5d vs. 7d, and 10d vs. adult.
50
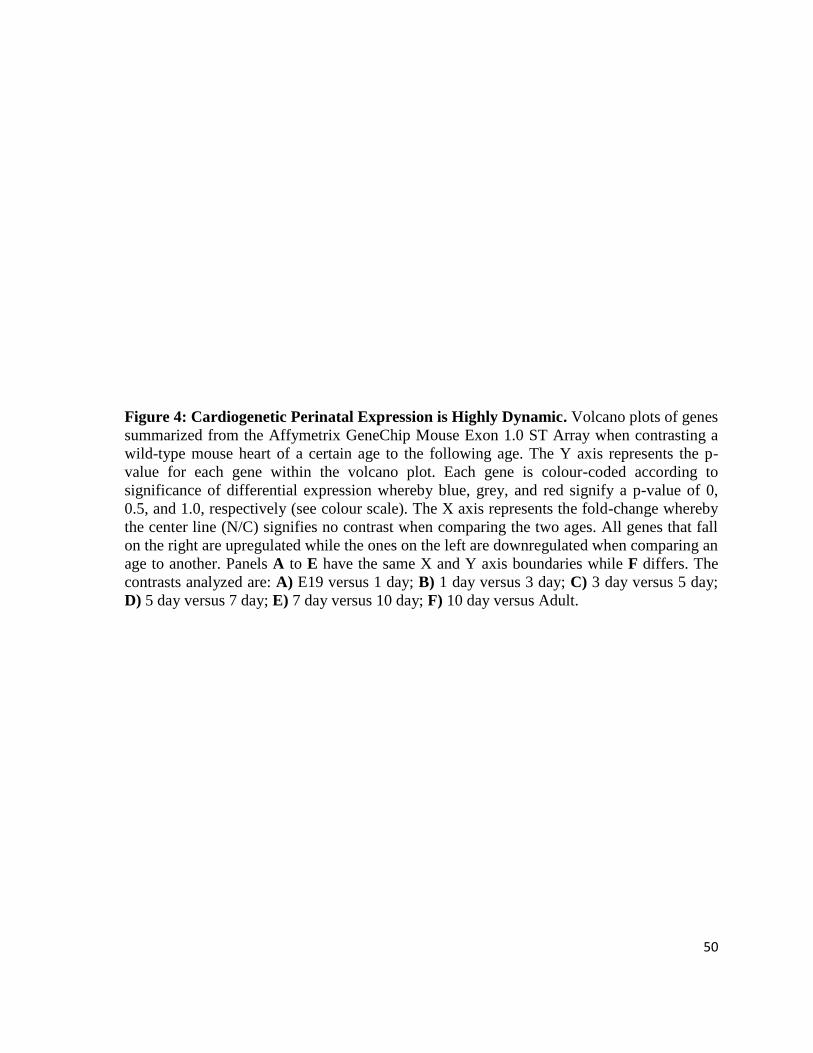
Figure 4: Cardiogenetic Perinatal Expression is Highly Dynamic. Volcano plots of genes
summarized from the Affymetrix GeneChip Mouse Exon 1.0 ST Array when contrasting a
wild-type mouse heart of a certain age to the following age. The Y axis represents the p-
value for each gene within the volcano plot. Each gene is colour-coded according to
significance of differential expression whereby blue, grey, and red signify a p-value of 0,
0.5, and 1.0, respectively (see colour scale). The X axis represents the fold-change whereby
the center line (N/C) signifies no contrast when comparing the two ages. All genes that fall
on the right are upregulated while the ones on the left are downregulated when comparing an
age to another. Panels A to E have the same X and Y axis boundaries while F differs. The
contrasts analyzed are: A) E19 versus 1 day; B) 1 day versus 3 day; C) 3 day versus 5 day;
D) 5 day versus 7 day; E) 7 day versus 10 day; F) 10 day versus Adult.
51
A. B.
C. D.
E. F.
52
Figure 5: Cardiac microRNA Perinatal Expression Patterns are Dispersed. Volcano
plots of microRNAs from the Illumina microarray platform when contrasting a wild-type
mouse heart of a certain age to the following age. The Y axis represents the p-value for each
microRNA within the volcano plot. Each microRNA is colour-coded according to
significance of differential expression whereby blue, grey, and red signify a p-value of 0,
0.5, and 1.0, respectively (see colour scale). The X axis represents the fold-change whereby
the center line (N/C) signifies no contrast when comparing the two ages. All microRNAs
that fall on the right of N/C are upregulated while the ones on the left are downregulated
when comparing an age to another. Panels A to E have the same X axis while F differs. The
contrasts analyzed are: A) E19 versus 1 day; B) 1 day versus 3 day; C) 3 day versus 5 day;
D) 5 day versus 7 day; E) 7 day versus 10 day; F) 10 day versus Adult.
53
A. B.
C. D.
E. F.

54
Table 4: Highly Expressed Mouse microRNAs within the Cardiac Perinatal Period.
Illumina normalized (Log2) microRNA microarray results highlighting the wild-type mouse
microRNAs (mmu-miR) with the highest and most significant fold-changes (p-value≤0.05)
as well as the microRNAs with known involvement in heart development and disease
(purple), with their respective p-value and fold-change. Contrasts span from E19 to adult.
55
Mouse
microRNA p-value
Fold-
Change
Mouse
microRNA p-value
Fold-
Change
E19 versus
1 day
Downregulated Upregulated
mmu-miR-200c 8.77E-07 -3.62 mmu-miR-702 2.50E-02 2.30
mmu-miR-338-5p 1.24E-02 -2.39 mmu-miR-21* 4.62E-02 2.39
mmu-miR-150 5.15E-03 -1.44 mmu-miR-325* 1.27E-02 2.61
mmu-miR-29a 2.39E-03 -1.40 mmu-miR-216a 1.75E-02 2.89
1 day
versus 3
day
Downregulated Upregulated
mmu-miR-34b-3p 7.23E-03 -3.10 mmu-miR-29b 1.74E-02 1.88
mmu-miR-429 3.21E-02 -2.78 mmu-miR-1-2-as 1.69E-02 2.10
mmu-miR-34c* 2.53E-02 -2.56 mmu-miR-19a 2.07E-02 2.35
mmu-miR-150 1.73E-04 -1.92 mmu-miR-301b 1.99E-02 2.62
3 day
versus 5
day
Downregulated Upregulated
mmu-miR-144:9.1 4.17E-02 -2.15 mmu-miR-29b* 9.02E-03 2.66
mmu-miR-19b 4.81E-02 -1.74 mmu-miR-292-5p 3.16E-02 4.63
mmu-miR-497 4.00E-02 -1.68 mmu-miR-686 6.82E-03 6.52
mmu-miR-34a 3.41E-02 -1.68 mmu-miR-705 2.98E-04 7.03
5 day
versus 7
day
Downregulated Upregulated
mmu-miR-29b* 2.32E-02 -2.21 mmu-miR-105 3.31E-02 1.73
mmu-miR-713 1.80E-02 -2.14 mmu-miR-1-2-as 1.06E-02 2.28
mmu-miR-196b 3.76E-02 -1.76 mmu-miR-344 4.19E-02 2.36
mmu-miR-29c* 1.17E-02 -1.49 mmu-miR-509-3p 3.69E-02 7.88
7 day
versus 10
day
Downregulated Upregulated
mmu-miR-689 2.09E-03 -3.11 mmu-miR-450-5p 1.85E-02 1.51
mmu-miR-15a* 2.50E-02 -2.21 mmu-miR-380-5p 1.03E-02 1.52
mmu-miR-743a 2.50E-02 -1.77 mmu-miR-302b 2.53E-04 2.13
mmu-miR-509-5p 2.50E-02 -1.69 mmu-miR-302d 1.24E-04 2.53
10 day
versus
Adult
Downregulated Upregulated
mmu-miR-705 5.08E-04 -5.96 mmu-miR-208a 2.02E-02 1.96
mmu-miR-29b* 5.47E-04 -5.16 mmu-miR-214* 2.40E-05 2.35
mmu-miR-684 1.25E-02 -4.31 mmu-miR-1-2-as 1.28E-03 3.44
mmu-miR-7b 6.12E-05 -3.11 mmu-miR-301b 2.09E-05 25.08
mmu-miR-155 4.01E-06 -3.07 mmu-miR-431 9.33E-08 25.60
mmu-miR-138* 2.19E-02 -3.11 mmu-miR-376a* 2.89E-06 26.82
mmu-miR-29a 2.10E-05 -2.09 mmu-miR-496 4.96E-09 27.26
mmu-miR-150 9.45E-05 -2.05 mmu-miR-154* 3.66E-06 37.03
mmu-miR-29b 1.31E-02 -1.96 mmu-miR-377 3.04E-08 47.08
mmu-miR-29c* 1.68E-03 -1.78 mmu-miR-380-3p 2.92E-05 114.1
56
Overall expression profiles were assessed by plotting the number of significantly
changing genetic factors over time (Figure 6). Panel A illustrates the trends of significantly
(p≤0.05) changing transcripts (mRNAs) and microRNAs (miRNAs, excluding the Solexa
sequences) within different intervals during perinatal cardiac development. The profiles
follow one another with an inflection point between 5 and 7 day for mRNAs and 5 and 10
day for miRNAs. Thus, the number of changing genes and microRNAs slightly varies until
the inflection point, at which point a dramatic increase in variability takes place. The
percentage linked to the profiles provides the amount of genetic factors increasing over time
(i.e. from the total number of microRNAs changing between E19 and 1d, 28% are
downregulated at E19 when compared to 1d, which translates to 28% of microRNAs
increasing over time, from E19 to 1d). Intriguingly, a comparable amount of transcripts are
up- and downregulated (~50%) while there is nearly double the number of microRNAs
upregulated than downregulated at each interval (i.e. 72% of microRNAs are upregulated at
E19 when compared to 1d).
Figure 6B stratifies genes to transcription factors, whereby out of 16,655 genes on
the array, 606 are known or predicted murine transcription factors (TF) (Riken Transcription
Factor Database (TFdb), 2004), of which 258 (42.6%) are significantly changing (p≤0.05)
between E19 and 10 days post-birth. The graph and table summarizes the ratios representing
the number of genes (or TFs) significantly increasing divided by those significantly
decreasing over time. A TF expression ratio of 0.61 (<1) at E19 vs. 1d refers to a greater
number of upregulated genes and a smaller number of downregulated genes at E19 as
compared to 1d. Furthermore, this ratio signifies an overall decrease of TFs at 1d.
Conversely, a ratio greater than 1 (>1) represents an increase in gene or TF expression over
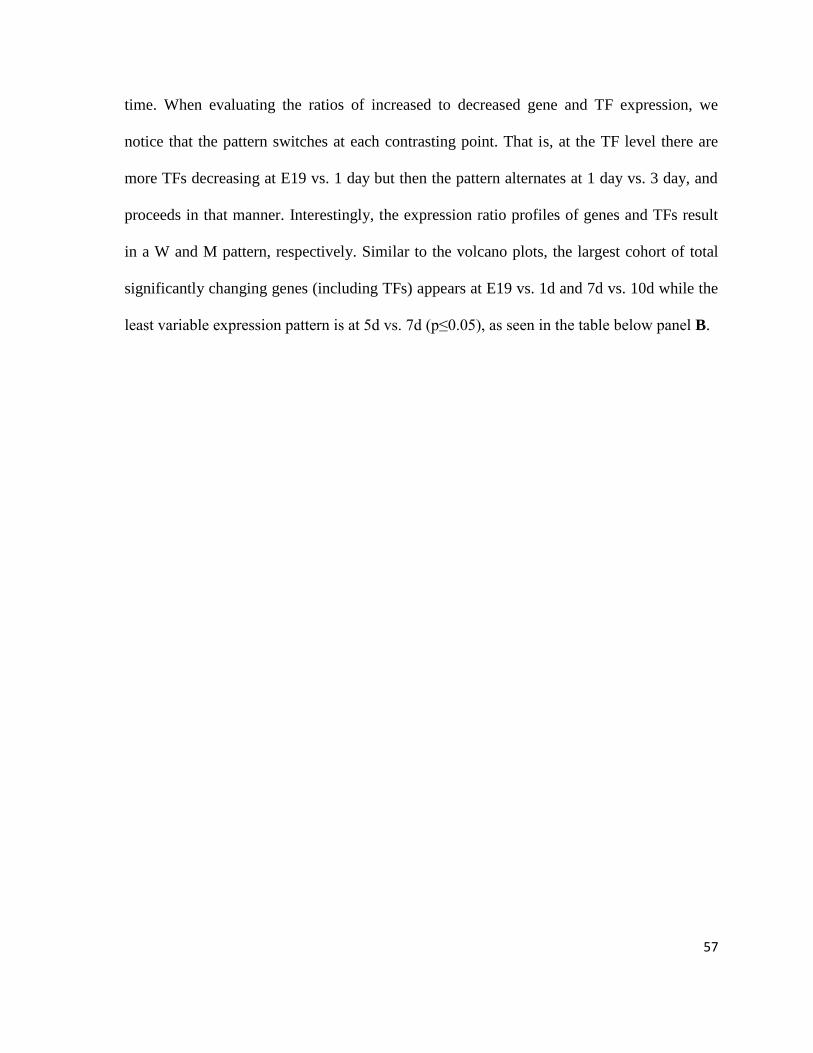
57
time. When evaluating the ratios of increased to decreased gene and TF expression, we
notice that the pattern switches at each contrasting point. That is, at the TF level there are
more TFs decreasing at E19 vs. 1 day but then the pattern alternates at 1 day vs. 3 day, and
proceeds in that manner. Interestingly, the expression ratio profiles of genes and TFs result
in a W and M pattern, respectively. Similar to the volcano plots, the largest cohort of total
significantly changing genes (including TFs) appears at E19 vs. 1d and 7d vs. 10d while the
least variable expression pattern is at 5d vs. 7d (p≤0.05), as seen in the table below panel B.
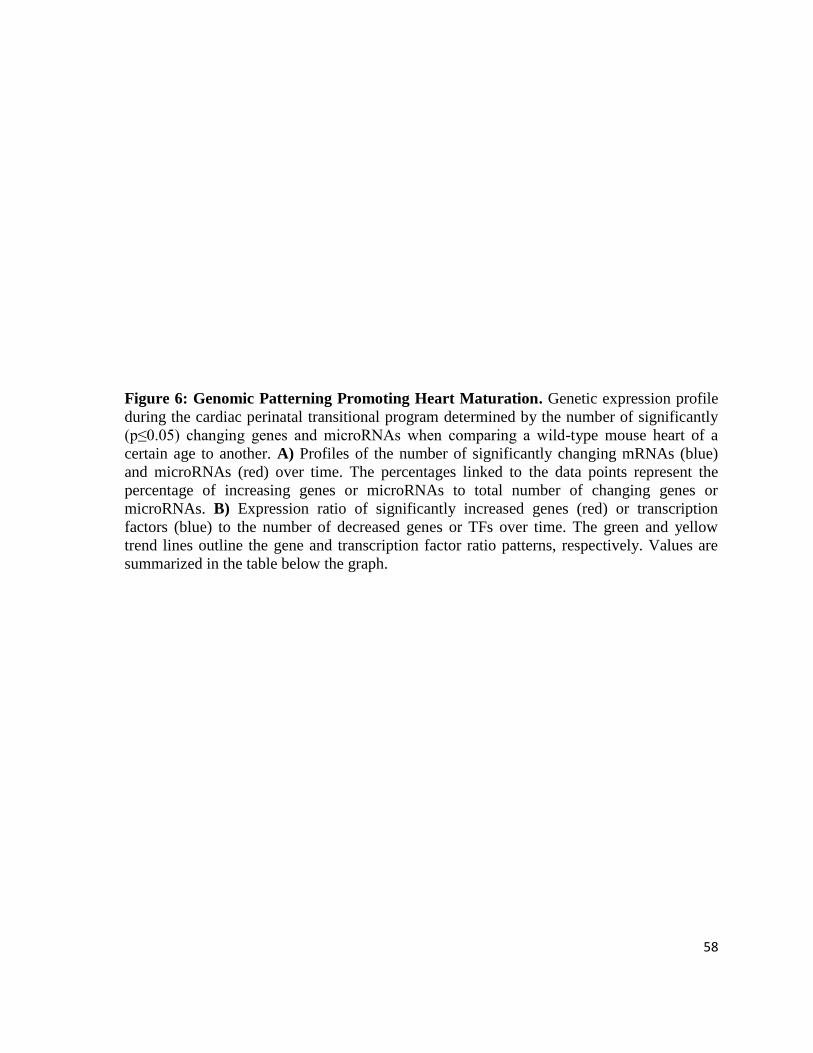
58
Figure 6: Genomic Patterning Promoting Heart Maturation. Genetic expression profile
during the cardiac perinatal transitional program determined by the number of significantly
(p≤0.05) changing genes and microRNAs when comparing a wild-type mouse heart of a
certain age to another. A) Profiles of the number of significantly changing mRNAs (blue)
and microRNAs (red) over time. The percentages linked to the data points represent the
percentage of increasing genes or microRNAs to total number of changing genes or
microRNAs. B) Expression ratio of significantly increased genes (red) or transcription
factors (blue) to the number of decreased genes or TFs over time. The green and yellow
trend lines outline the gene and transcription factor ratio patterns, respectively. Values are
summarized in the table below the graph.
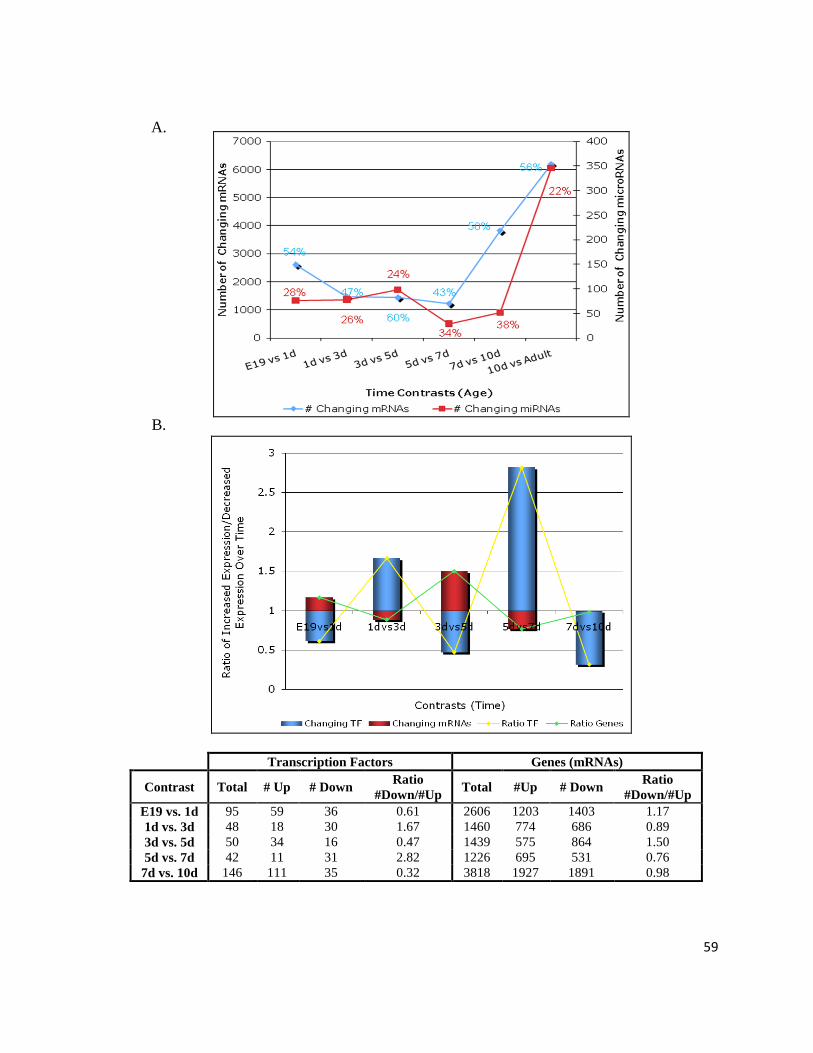
59
Transcription Factors Genes (mRNAs)
Contrast Total # Up # Down Ratio
#Down/#Up Total #Up # Down
Ratio
#Down/#Up
E19 vs. 1d 95 59 36 0.61 2606 1203 1403 1.17
1d vs. 3d 48 18 30 1.67 1460 774 686 0.89
3d vs. 5d 50 34 16 0.47 1439 575 864 1.50
5d vs. 7d 42 11 31 2.82 1226 695 531 0.76
7d vs. 10d 146 111 35 0.32 3818 1927 1891 0.98
B.
A.
60
Genetic expression patterns were mapped to gene ontology (GO) profiles to gain a
global perspective, in addition to knowing which processes are activated or inactivated
during heart maturation (Figure 7 and 8). Partek® was used to generate GO profiles from
gene lists filtered at a p-value≤0.05 and FDR≤0.05. Generally, GO profiles are divided into
Biological Processes (BP), Cellular Components (CC), and Molecular Function (MF).
Analysis was limited to Biological Processes because our interest lies within organismal
events that encompass regulatory processes involved in genetic expression and interactions.
The BP with an Enrichment Score (ES)≥3 and an Age Score≥3 were considered as
significant and were used to create Forest Plots and Pie Charts. The ES and Age Score are a
measurement of the degree at which a gene is overrepresented within BP (i.e. with an
increasing score, a gene becomes more representative within a functional group)
(Subramanian et al., 2005). As a result, the following three processes persist within our
analysis: Cellular Process, Metabolic Process, and Biological Adhesion. In addition,
Developmental Process, Biological Regulation, and Multicellular Organismal Process
appear to play a role within certain contrasting groups (e.g. 7d vs. 10d). Figure 7 and 8
enumerate the gene ontologies, however each Biological Process may be further stratified
into specific functional groups. A secondary level of analysis predominantly revealed the
following functional groups within the BP:
1) Cellular Process: cell cycle, cell division, cell cycle process, chromosome
segregation, microtubule-based process;
2) Metabolic Process: macromolecule metabolic process, primary metabolic
process, oxidation reduction, biosynthetic process;
3) Biological Adhesion: cell adhesion;
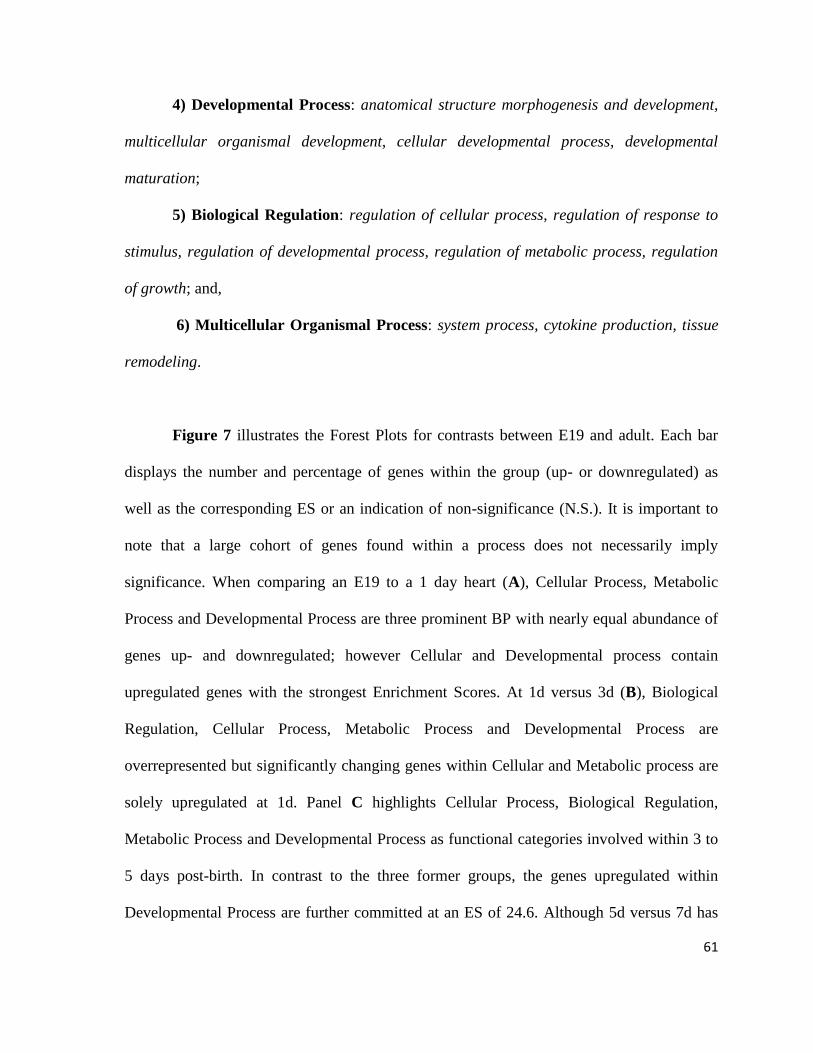
61
4) Developmental Process: anatomical structure morphogenesis and development,
multicellular organismal development, cellular developmental process, developmental
maturation;
5) Biological Regulation: regulation of cellular process, regulation of response to
stimulus, regulation of developmental process, regulation of metabolic process, regulation
of growth; and,
6) Multicellular Organismal Process: system process, cytokine production, tissue
remodeling.
Figure 7 illustrates the Forest Plots for contrasts between E19 and adult. Each bar
displays the number and percentage of genes within the group (up- or downregulated) as
well as the corresponding ES or an indication of non-significance (N.S.). It is important to
note that a large cohort of genes found within a process does not necessarily imply
significance. When comparing an E19 to a 1 day heart (A), Cellular Process, Metabolic
Process and Developmental Process are three prominent BP with nearly equal abundance of
genes up- and downregulated; however Cellular and Developmental process contain
upregulated genes with the strongest Enrichment Scores. At 1d versus 3d (B), Biological
Regulation, Cellular Process, Metabolic Process and Developmental Process are
overrepresented but significantly changing genes within Cellular and Metabolic process are
solely upregulated at 1d. Panel C highlights Cellular Process, Biological Regulation,
Metabolic Process and Developmental Process as functional categories involved within 3 to
5 days post-birth. In contrast to the three former groups, the genes upregulated within
Developmental Process are further committed at an ES of 24.6. Although 5d versus 7d has
62
the shortest list of significantly changing genes (Figure 6), there are several highly
represented genes involved in the BP, in particular within Cellular Process, Biological
Regulation and Metabolic Process (D), with the majority being upregulated at 5d. Analyzing
panel E and F revealed the importance of day 10 post-birth. That is, genes involved in BP at
7d are largely downregulated when compared to 10d while genes are mainly upregulated at
10d as compared to adult. Therefore, it appears that certain processes are being
downregulated before and after day 10. Overall, E19 vs. 1d, 7d vs. 10d, and 10d vs. adult
illustrated the largest cohort of genes significantly mediating Biological Processes. Note,
Biological Adhesion is present throughout every contrast, but the gene abundance and/or ES
(and Age Score) are minor.
Pie Charts summarize the Biological Processes as seen in the Forest Plots without
discriminating between up- and downregulated genes (Figure 8). These figures are
imperfect representations of Forest Plots because generating a Pie Chart causes certain
functional groups to be omitted. This is a result of a new background created by merging
two gene lists (up- and downregulated genes). Pie Charts are essentially an alternative
method to study global GO profiles that may influence cardiac growth, via short intervals.
As Pie Charts provide a wealth of information, only Biological Processes with prominent
roles (ES and Age Score ≥ 3) in each interval will be discussed. Panel A illustrates the
importance of Multicellular Organismal Process, Cellular Process, Biological Adhesion, and
Metabolic Process between E19 and 1d. On the other hand, functional groups that differ a 1d
and 3d heart have small Enrichment Scores (B). Comparing a 3d to a 5d heart mainly
highlights Metabolic Process, Multicellular Organismal Process and Cellular Process (C).
63
The most intriguing Pie Charts are that of 5d versus 7d and 7d versus 10d whereby Cellular
Process and Metabolic Process, respectively, constitutes approximately 50% of the
Biological Processes (D). Finally, a 10d heart differs largely from that of an adult heart as
depicted in Panel F.
Further analysis of the BP demonstrated functional groups with strong representation
(i.e. high Enrichment Scores (ES)) that may have been missed at a first pass. In particular,
when comparing 5d versus 7d (D), Cellular Process is largely upregulated at 5d and is
composed of the following functional groups (with their respective ES and percentage of
distribution): cell cycle (182.2, 33.2%), cell division (154.6, 28.2%), chromosome
segregation (35.3, 6.43%), microtubule-based process (23.5, 4.3%), cell motion (3.32,
0.61%), and cellular metabolic process (13.2, 2.4%). In addition, mitosis represents 86.7%
of the cell cycle process at an Enrichment Score of 164 (data not shown). Similar Cellular
Process functional groups are upregulated at 10d when compared to adult (F) but with
slightly smaller ES. Therefore, Cellular Processes are markedly enhanced at 5d and 10d.
64
Figure 7: Gene Ontology Processes Altering During Heart Development. Forest Plots of
Biological Processes (BP) at contrasting cardiac ages from E19 to adulthood generated with
gene lists significantly changing over time (p≤0.05, FDR≤0.05). BP significance includes an
Enrichment Score and Age Score above 3, otherwise denoted as N.S. (non-significant). The
number of genes downregulated (left, red) and upregulated (right, green) are represented on
the X axis. Numbers within bars (in black) represent the Enrichment Score. The percentage
in green or red outside the bar graphs represent the percentage of genes within the up- or
downregulated genes, respectively, as compared to the total number of genes significantly
changing. The contrasts analyzed are: A) E19 versus 1 day; B) 1 day versus 3 day; C) 3 day
versus 5 day; D) 5 day versus 7 day; E) 7 day versus 10 day; F) 10 day versus Adult.
65
A.
B.
C.
66
D.
E.
F.
67
Figure 8: Overall Biological Processes Significantly Involved in the Heart. Pie Charts of
Biological Processes (BP) significantly changing (p≤0.05, FDR≤0.05, Enrichment Score and
Age Score ≥3) at different stages during perinatal heart development. BP are assessed
through a gene list of all genes significantly changing over time, including down- and
upregulated genes. Each BP contains a corresponding Enrichment Score and percentage
distribution found within parentheses. The contrasts analyzed are: A) E19 versus 1 day; B) 1
day versus 3 day; C) 3 day versus 5 day; D) 5 day versus 7 day; E) 7 day versus 10 day; F)
10 day versus Adult.
68
A.
B.
C.
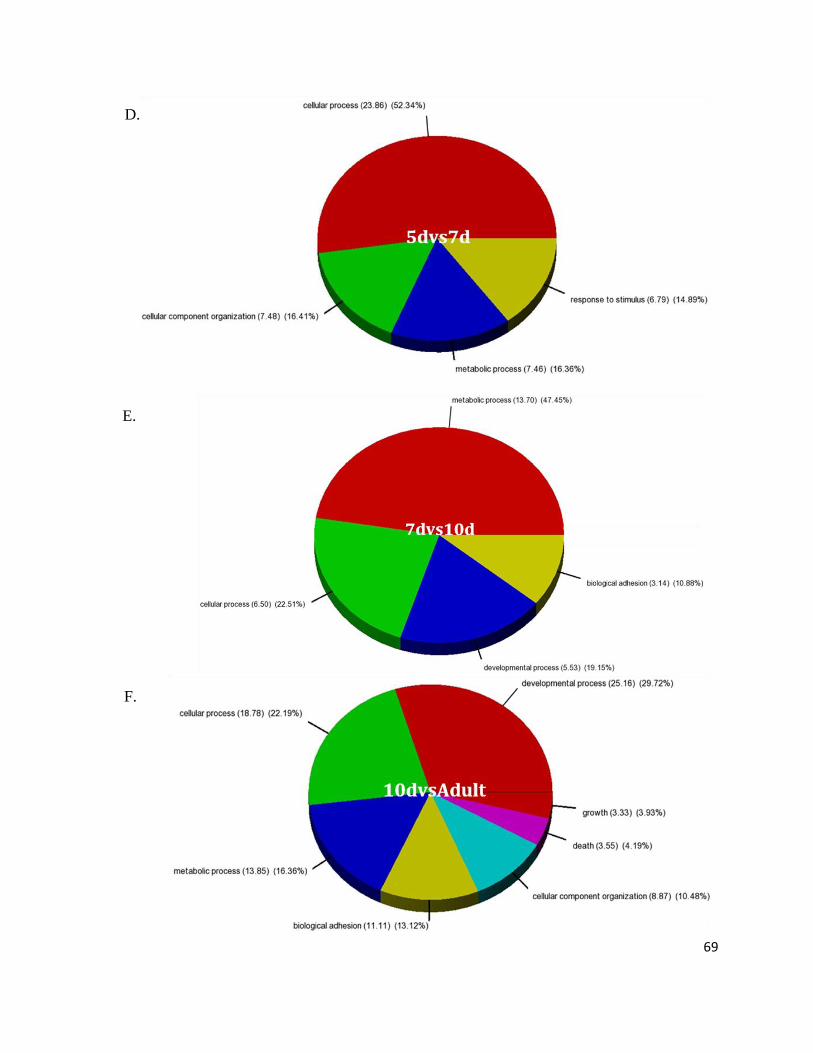
69
D.
E.
F.
70
In order to validate the quality of the cDNA microarray datasets, semi-quantitative and
quantitative PCR experiments were undertaken. Prior to validating the microarrays, we
searched for a reference gene that remained unchanged during the cardiac perinatal
transitional program. Structural genes, such as those expressing proteins involved in the
cytoskeleton and extra-cellular matrix, were not chosen since the heart undergoes dynamic
remodeling events (Chen, et al., 2004). Instead the processing genes Ppia, Pgk2, and Gapdh
were selected as their expression remained unchanged in the microarray data. Peptidylprolyl
isomerase A (Ppia) encodes enzymes responsible for cis-trans isomerization of proline
imidic peptide bonds in oligopeptides and for the acceleration of protein folding.
Phosphoglycerate kinase 2 (Pgk2) mediates glycolysis by catalyzing the conversion of 1,3-
diphosphoglycerate to 3-phosphoglycerate and releasing one molecule of ATP. Last,
glyceraldehyde-3-phosphate dehydrogenase (Gapdh) phosphorylates glyceraldehyde-3-
phosphate in the presence of inorganic phosphate and nicotinamide adenine dinucleotide
during carbohydrate metabolism (NCBI, 2011). All three genes are frequently amplified in
the literature as reference genes for RNA quantitation. Figure 9 illustrates transcript
expression profiles after RT-PCR. Ppia appears to be the sole gene with constant expression
at E19, 1d, 3d, 4d, 5d, 6d, 7d, 10d and adult.
Once Ppia was assessed as the reference gene, 9 genes (Rxrγ, Pln, Mad2l1, Epas1,
Asb15, Cdk4, Hif3α, Fbxw7, Pfkm) were chosen at random plus Prc1 as validation genes.
Protein regulator of cytokinesis 1 (Prc1) was selected since it possessed one of the highest
fold-changes when comparing 10d to adult. The False Discovery Rate (FDR) was set at
0.20, therefore an error of 20% was deemed acceptable. It is important to note that day 4 and
71
6 heart transcripts were added to the validation experiments after uncovering the inflection
point between 5d and 7d in the transcriptional profiling, as a precaution of missing vital
results. After RT-PCR, eight genes (Prc1, Rxrγ, Mad2l1, Cdk4, Asb15, Pfkm, Hif3α, and
Fbxw7) followed the microarray mean expression trend while two genes (Pln and Epas1)
deviated from the expected expression profile, which fulfills an FDR of 20% (Figure 10).
Prc1, Rxrγ and Pln were further analyzed by Real-Time PCR and the resulting fold-change
had the same directionality as the fold-change calculated and considered significant with the
microarray data. The RT-PCR and Real-Time PCR results do not converge for Pln, albeit
the microarray fold-changes hover between -1.1 and 1.0 so it is difficult to say if -1.0 is
different from 1.0.
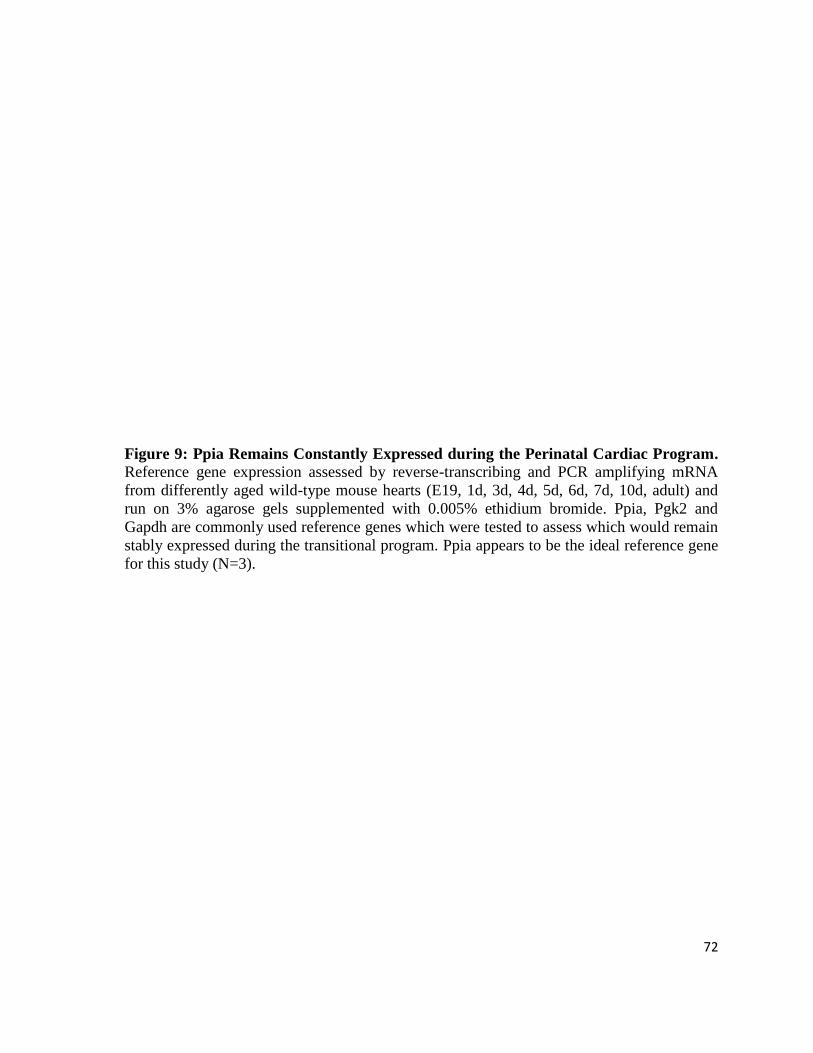
72
Figure 9: Ppia Remains Constantly Expressed during the Perinatal Cardiac Program.
Reference gene expression assessed by reverse-transcribing and PCR amplifying mRNA
from differently aged wild-type mouse hearts (E19, 1d, 3d, 4d, 5d, 6d, 7d, 10d, adult) and
run on 3% agarose gels supplemented with 0.005% ethidium bromide. Ppia, Pgk2 and
Gapdh are commonly used reference genes which were tested to assess which would remain
stably expressed during the transitional program. Ppia appears to be the ideal reference gene
for this study (N=3).
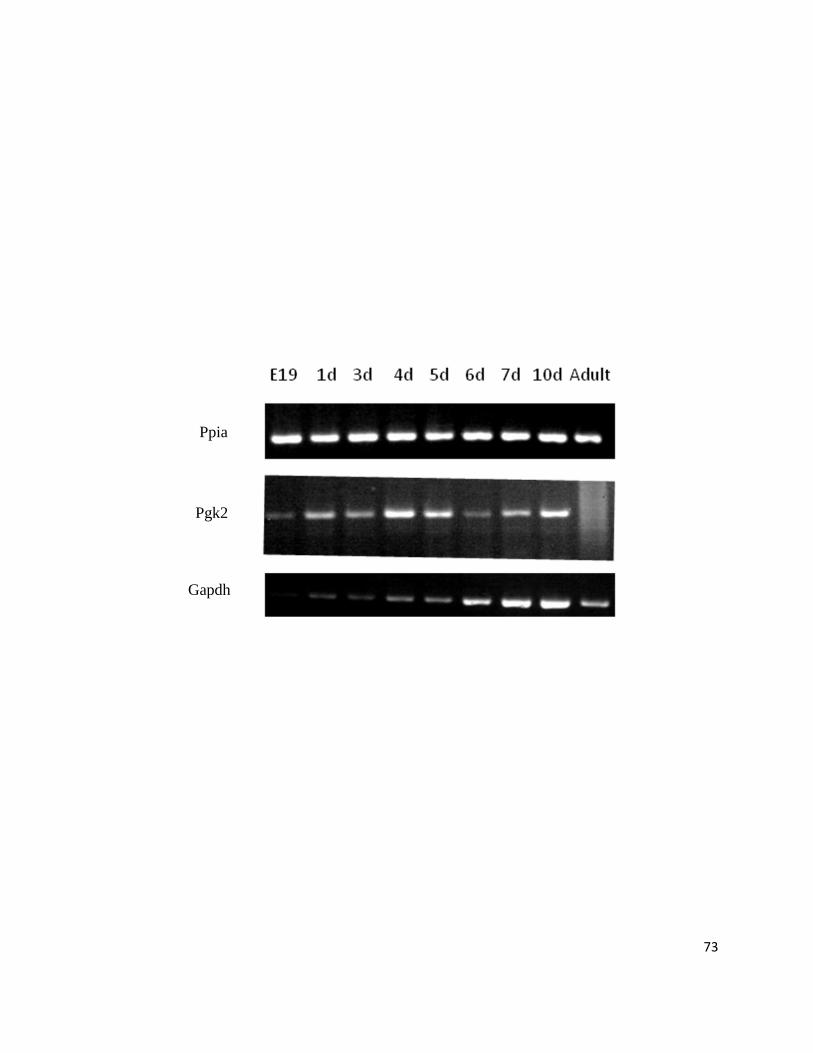
73
Ppia
Gapdh
Pgk2
.
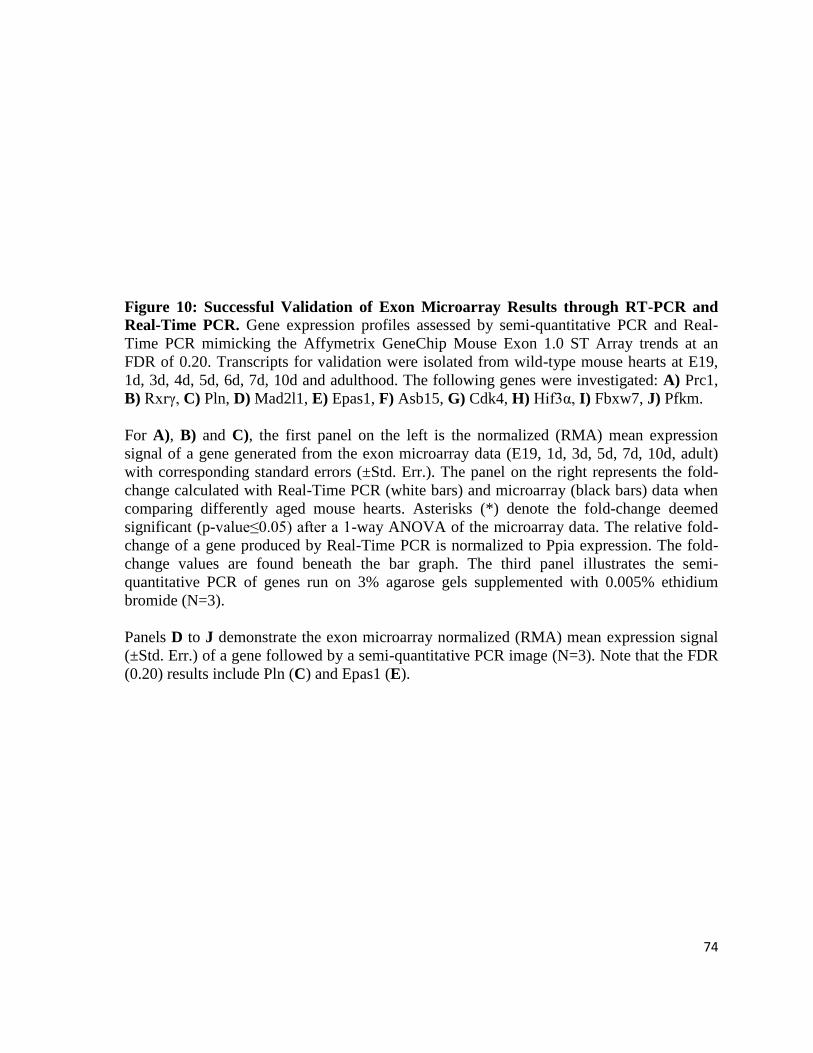
74
Figure 10: Successful Validation of Exon Microarray Results through RT-PCR and
Real-Time PCR. Gene expression profiles assessed by semi-quantitative PCR and Real-
Time PCR mimicking the Affymetrix GeneChip Mouse Exon 1.0 ST Array trends at an
FDR of 0.20. Transcripts for validation were isolated from wild-type mouse hearts at E19,
1d, 3d, 4d, 5d, 6d, 7d, 10d and adulthood. The following genes were investigated: A) Prc1,
B) Rxrγ, C) Pln, D) Mad2l1, E) Epas1, F) Asb15, G) Cdk4, H) Hif3α, I) Fbxw7, J) Pfkm.
For A), B) and C), the first panel on the left is the normalized (RMA) mean expression
signal of a gene generated from the exon microarray data (E19, 1d, 3d, 5d, 7d, 10d, adult)
with corresponding standard errors (±Std. Err.). The panel on the right represents the fold-
change calculated with Real-Time PCR (white bars) and microarray (black bars) data when
comparing differently aged mouse hearts. Asterisks (*) denote the fold-change deemed
significant (p-value≤0.05) after a 1-way ANOVA of the microarray data. The relative fold-
change of a gene produced by Real-Time PCR is normalized to Ppia expression. The fold-
change values are found beneath the bar graph. The third panel illustrates the semi-
quantitative PCR of genes run on 3% agarose gels supplemented with 0.005% ethidium
bromide (N=3).
Panels D to J demonstrate the exon microarray normalized (RMA) mean expression signal
(±Std. Err.) of a gene followed by a semi-quantitative PCR image (N=3). Note that the FDR
(0.20) results include Pln (C) and Epas1 (E).
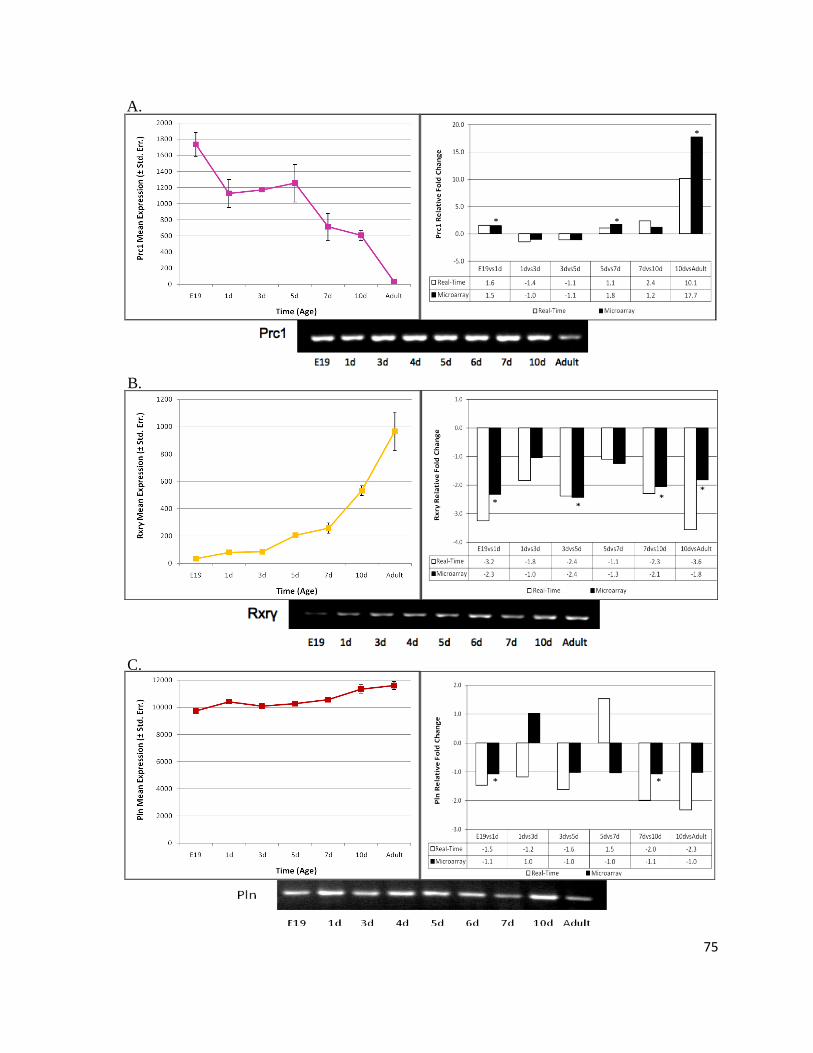
75
A.
B.
C.
* *
*
* **
*
* *
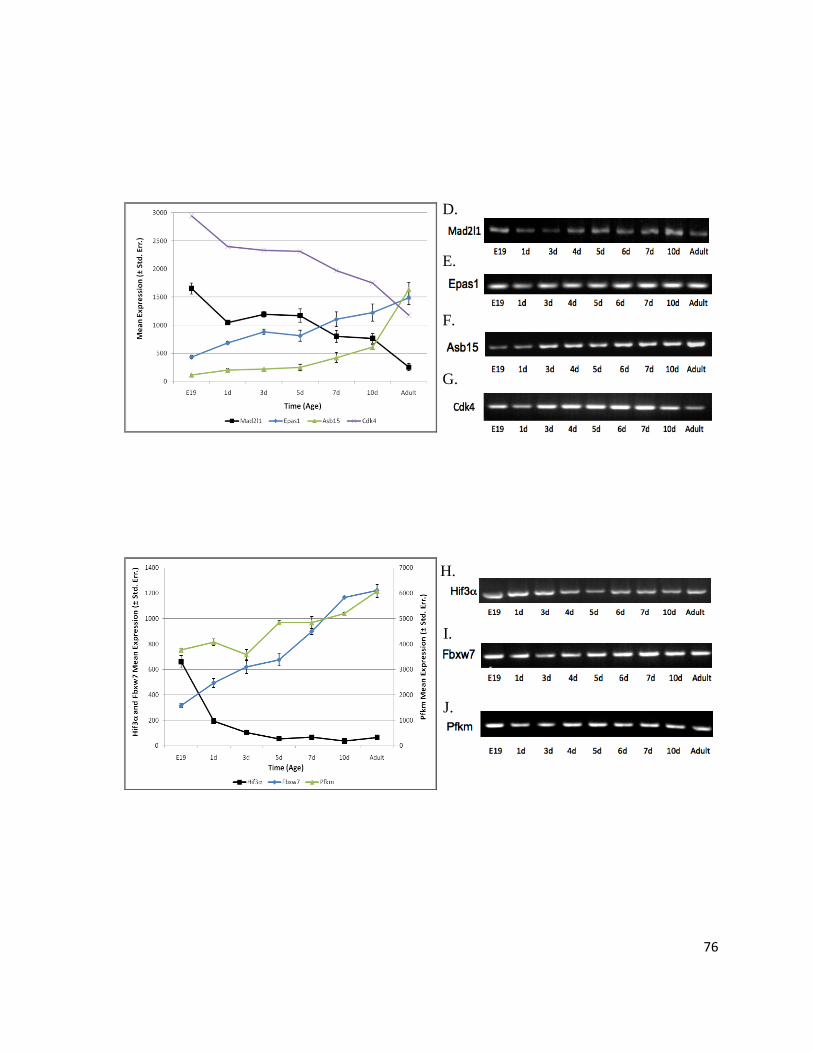
76
E.
F.
G.
H.
I.
J.
D.
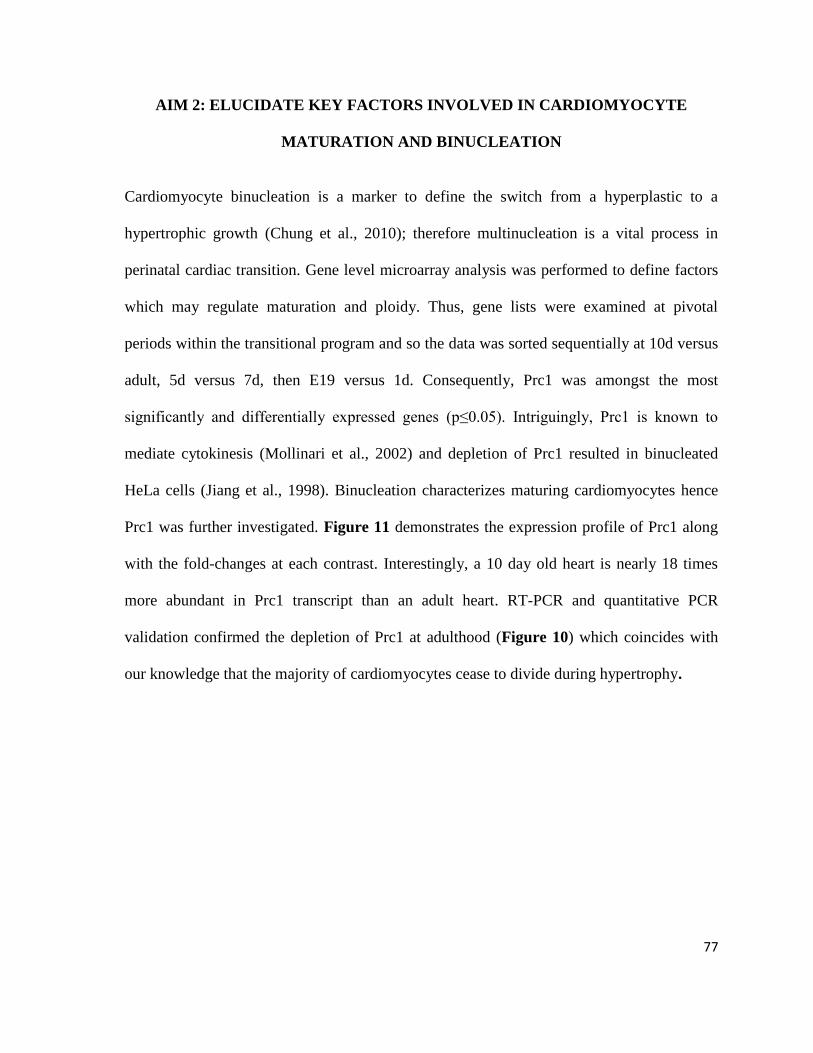
77
AIM 2: ELUCIDATE KEY FACTORS INVOLVED IN CARDIOMYOCYTE
MATURATION AND BINUCLEATION
Cardiomyocyte binucleation is a marker to define the switch from a hyperplastic to a
hypertrophic growth (Chung et al., 2010); therefore multinucleation is a vital process in
perinatal cardiac transition. Gene level microarray analysis was performed to define factors
which may regulate maturation and ploidy. Thus, gene lists were examined at pivotal
periods within the transitional program and so the data was sorted sequentially at 10d versus
adult, 5d versus 7d, then E19 versus 1d. Consequently, Prc1 was amongst the most
significantly and differentially expressed genes (p≤0.05). Intriguingly, Prc1 is known to
mediate cytokinesis (Mollinari et al., 2002) and depletion of Prc1 resulted in binucleated
HeLa cells (Jiang et al., 1998). Binucleation characterizes maturing cardiomyocytes hence
Prc1 was further investigated. Figure 11 demonstrates the expression profile of Prc1 along
with the fold-changes at each contrast. Interestingly, a 10 day old heart is nearly 18 times
more abundant in Prc1 transcript than an adult heart. RT-PCR and quantitative PCR
validation confirmed the depletion of Prc1 at adulthood (Figure 10) which coincides with
our knowledge that the majority of cardiomyocytes cease to divide during hypertrophy.

78
Figure 11: Prc1 Expression Profile Decreases Throughout Perinatal Cardiac
Maturation. Exon microarray expression analysis of Prc1. A) Normalized (RMA) mean
expression signal of Prc1 from wild-type mouse hearts at E19, 1d, 3d, 5d, 7d, 10d and
adulthood, with the corresponding standard error (±Std. Err.). B) Fold-change and p-value
of Prc1 when contrasting the ages. P-values highlighted in blue indicate significant values at
p≤0.05 while grey is non-significant; red and green highlighting signify a decrease and
increase in expression, respectively.
79
Contrast p-value Fold-
Change
E19 vs. 1d 0.0384 1.54
1d vs. 3d 0.840 -1.04
3d vs. 5d 0.725 -1.07
5d vs. 7d 0.00952 1.76
7d vs. 10d 0.416 1.17
10d vs. Adult 0.000000000403 17.7
A.
B.
80
To further investigate Prc1, an antibody and blocking peptide were purchased and
utilized. Peptide neutralization experiments proved that the antibody was specific to
endogenous cardiac Prc1 (Figure 12). Immunoblotting demonstrated that Prc1 protein
expression is the inverse of mRNA expression pattern. In essence, Prc1 protein expression
increased while transcript expression decreased with cardiac maturation, although the
loading control (Myosin Heavy Chain – MHC) was of fairly equal abundance. As expected,
skeletal muscle had abundant MHC expression, however both HL-1 and brain had
undetectable MHC at 5μg of total protein lysate. HL-1, as well as wild-type adult mouse
brain and skeletal muscle lysates were loaded as controls. All three controls were not
detected at 5μg.
Isolating mRNA and protein from wild-type murine hearts at different ages proved to
be highly erratic whereby the amount of mRNA drops while the amount of protein increased
substantially at adulthood (Figure 13). Moreover, transcript abundance slightly increased
with age, however returned to baseline at adulthood. On the other hand, protein expression
appeared relatively constant until 6-7 weeks post-birth when the heart portrays a burst in
protein abundance. Comparing the amount of protein to that of mRNA shows virtually no
changes from E19 until 10d but a large variability at adulthood.
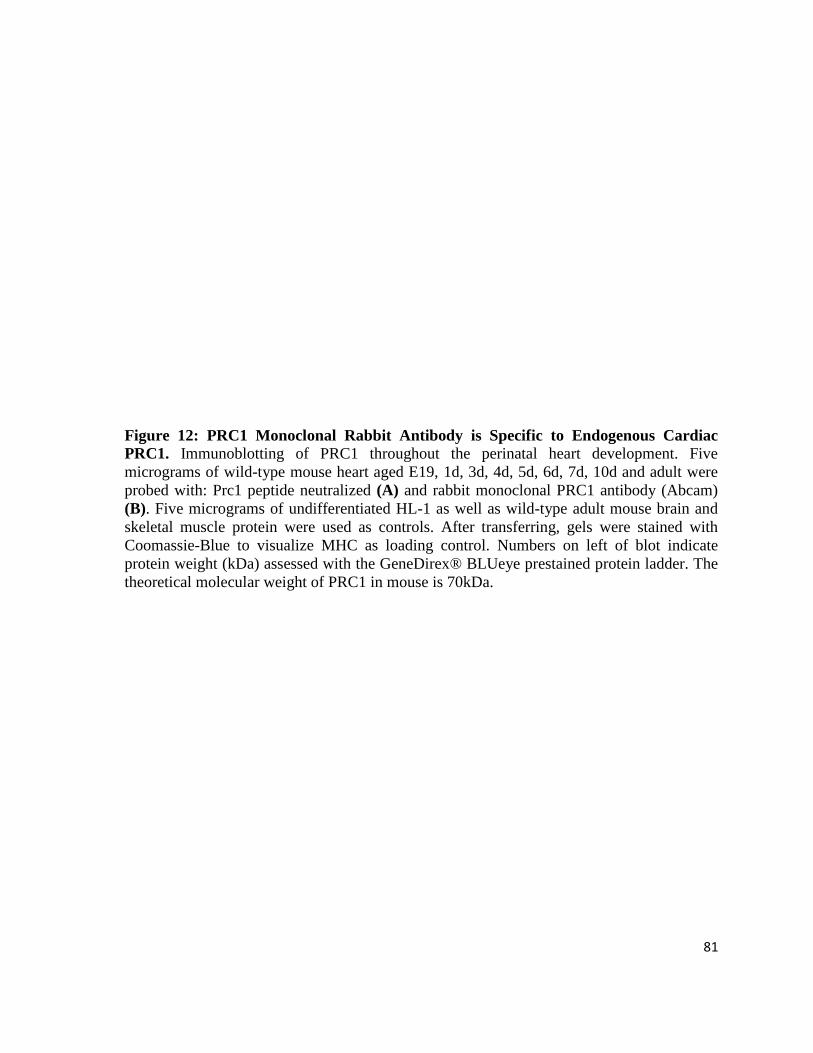
81
Figure 12: PRC1 Monoclonal Rabbit Antibody is Specific to Endogenous Cardiac
PRC1. Immunoblotting of PRC1 throughout the perinatal heart development. Five
micrograms of wild-type mouse heart aged E19, 1d, 3d, 4d, 5d, 6d, 7d, 10d and adult were
probed with: Prc1 peptide neutralized (A) and rabbit monoclonal PRC1 antibody (Abcam)
(B). Five micrograms of undifferentiated HL-1 as well as wild-type adult mouse brain and
skeletal muscle protein were used as controls. After transferring, gels were stained with
Coomassie-Blue to visualize MHC as loading control. Numbers on left of blot indicate
protein weight (kDa) assessed with the GeneDirex® BLUeye prestained protein ladder. The
theoretical molecular weight of PRC1 in mouse is 70kDa.
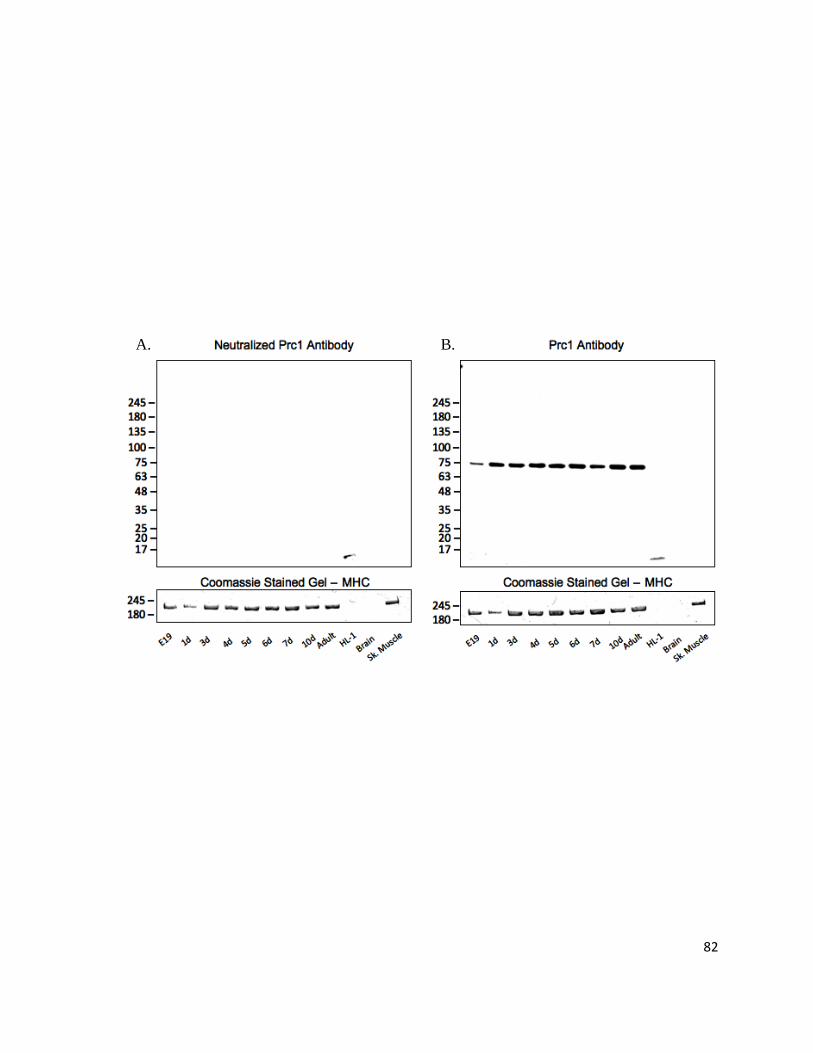
82
A. B.
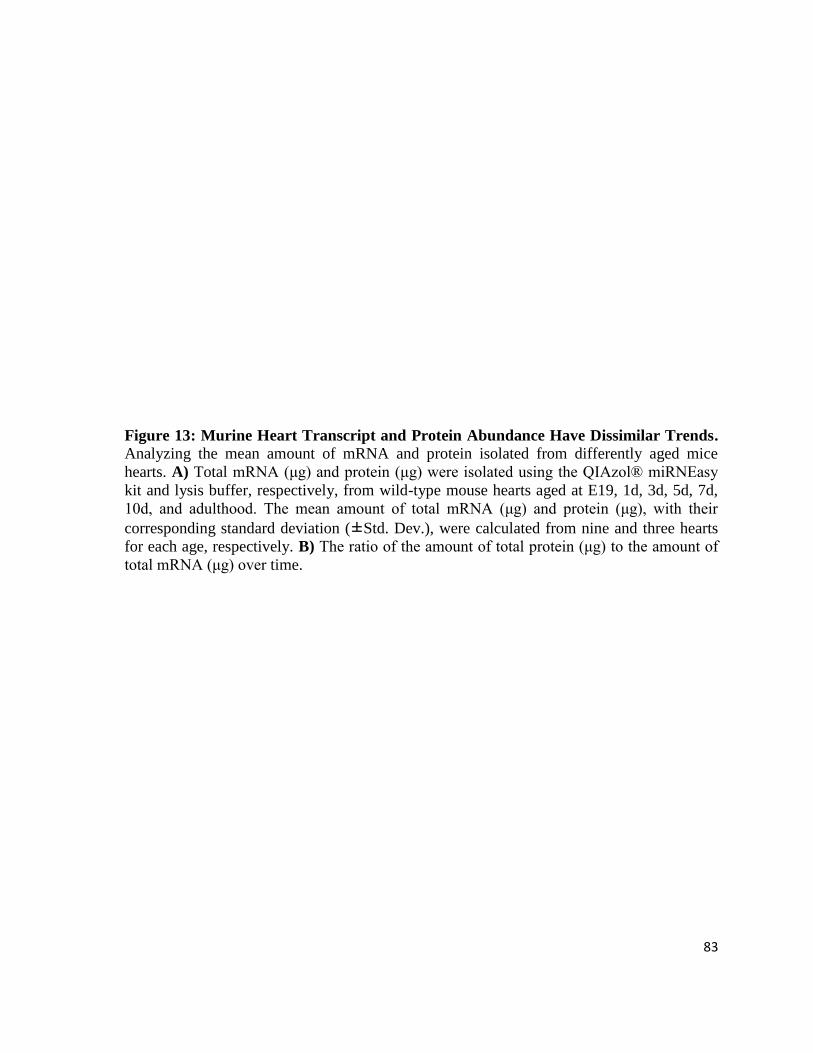
83
Figure 13: Murine Heart Transcript and Protein Abundance Have Dissimilar Trends.
Analyzing the mean amount of mRNA and protein isolated from differently aged mice
hearts. A) Total mRNA (μg) and protein (μg) were isolated using the QIAzol® miRNEasy
kit and lysis buffer, respectively, from wild-type mouse hearts aged at E19, 1d, 3d, 5d, 7d,
10d, and adulthood. The mean amount of total mRNA (μg) and protein (μg), with their
corresponding standard deviation (±Std. Dev.), were calculated from nine and three hearts
for each age, respectively. B) The ratio of the amount of total protein (μg) to the amount of
total mRNA (μg) over time.
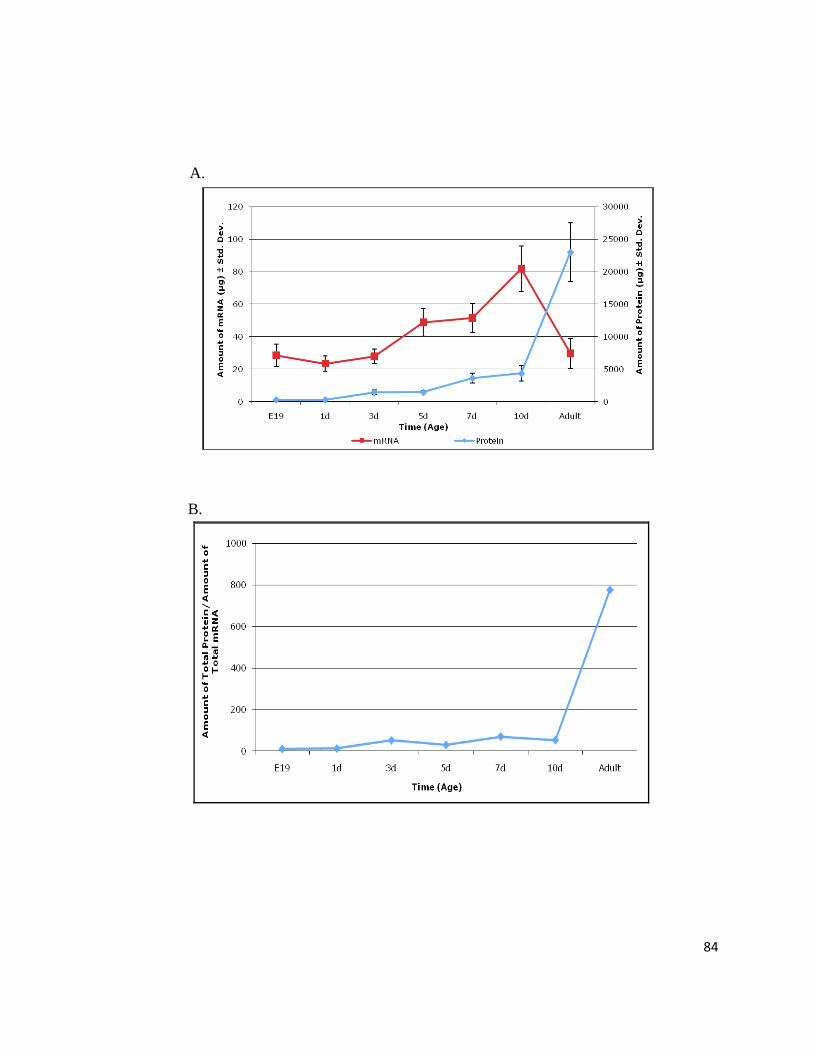
84
A.
B.
85
With microRNA microarray expression profiles at our disposal, we aimed to
determine if microRNAs are targeting Prc1, causing its dysregulation. Through TargetScan,
Partek® algorithms summarized a list of microRNAs putatively targeting Prc1 (Figure 14).
The software merges the significantly changing genes and microRNAs and matches the
microRNAs to their potential targets. This allowed us to see if a change in microRNA
expression may affect the expression of its putative targets, namely Prc1. Effectively certain
microRNAs that are predicted to target Prc1 are significantly changing between E19 and 1d
as well as 10d and adult. Although the fold-changes at E19 versus 1d were not impressive,
four (miR-19a, miR-19b, miR-363, and miR-367) out of the seven microRNAs were highly
upregulated at 10d when compared to adult.
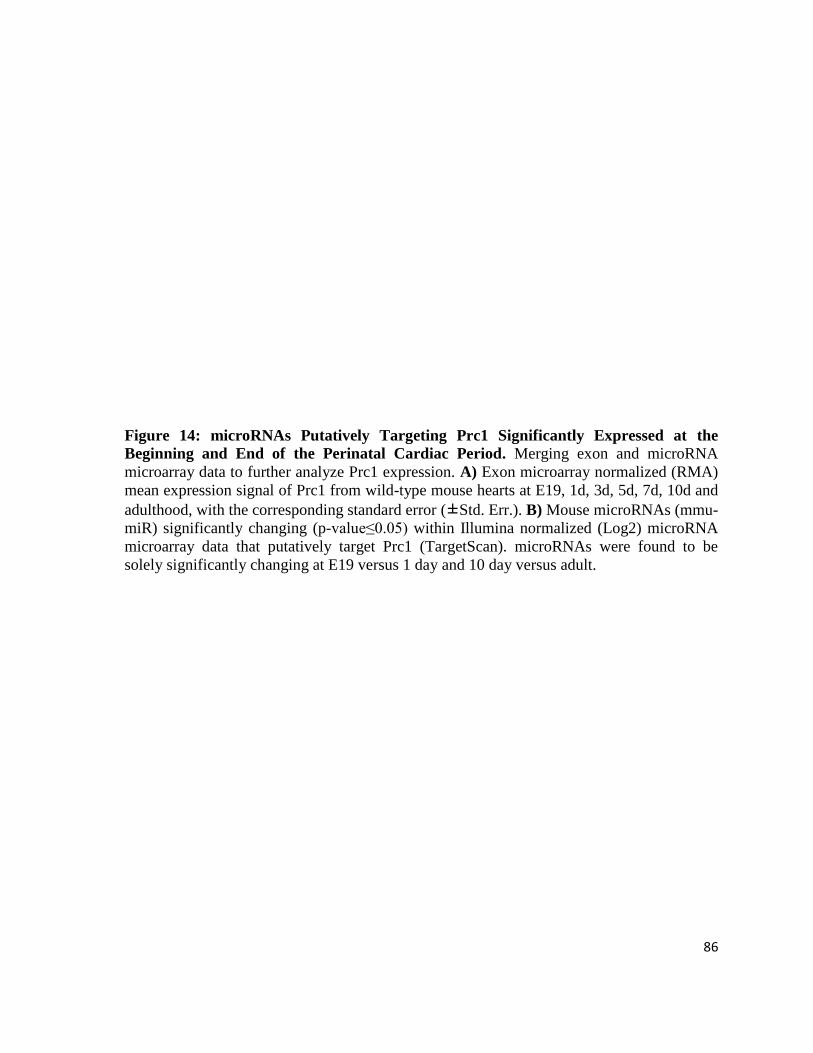
86
Figure 14: microRNAs Putatively Targeting Prc1 Significantly Expressed at the
Beginning and End of the Perinatal Cardiac Period. Merging exon and microRNA
microarray data to further analyze Prc1 expression. A) Exon microarray normalized (RMA)
mean expression signal of Prc1 from wild-type mouse hearts at E19, 1d, 3d, 5d, 7d, 10d and
adulthood, with the corresponding standard error (±Std. Err.). B) Mouse microRNAs (mmu-
miR) significantly changing (p-value≤0.05) within Illumina normalized (Log2) microRNA
microarray data that putatively target Prc1 (TargetScan). microRNAs were found to be
solely significantly changing at E19 versus 1 day and 10 day versus adult.
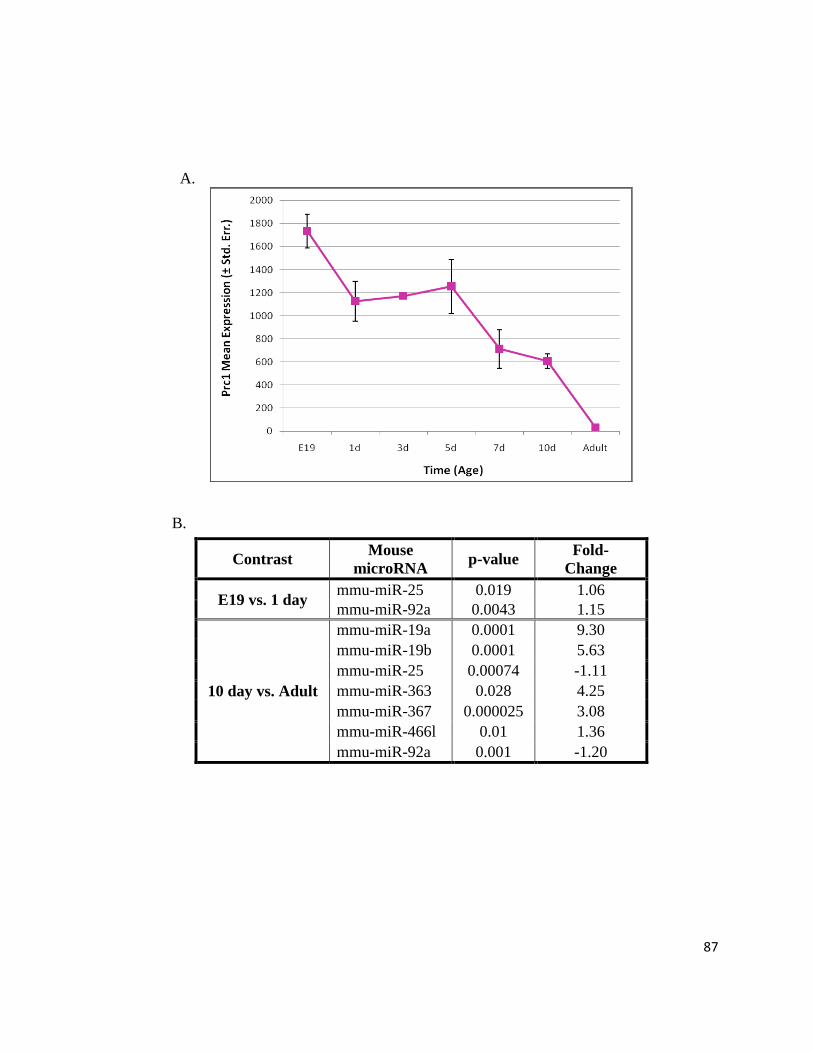
87
Contrast Mouse
microRNA p-value
Fold-
Change
E19 vs. 1 day mmu-miR-25 0.019 1.06
mmu-miR-92a 0.0043 1.15
10 day vs. Adult
mmu-miR-19a 0.0001 9.30
mmu-miR-19b 0.0001 5.63
mmu-miR-25 0.00074 -1.11
mmu-miR-363 0.028 4.25
mmu-miR-367 0.000025 3.08
mmu-miR-466l 0.01 1.36
mmu-miR-92a 0.001 -1.20
A.
B.
88
To better understand heart maturation, cardiac proteins were isolated, immunoblotted
and probed for cell cycle checkpoints throughout the transitional period. This allowed us to
determine at what stage the majority of cardiomyocytes are within cell cycle at E19, 1d, 3d,
4d, 5d, 6d, 7d, 10d, and adulthood. In addition, Prc1 expression was overlaid with cell cycle
markers to assess if Prc1 expression changes with cell cycle withdrawal. Figure 15 depicts
expression patterns of cardiac protein during hyperplastic- to hypertrophic-based growth.
First off, HL-1, as well as adult mouse brain and skeletal muscle were used as positive or
negative controls. Undifferentiated HL-1 had endogenous expression of RB, pRB(Ser780),
CDC2, and pCDC2(Tyr15), detected at 5μg. RB, pRB(Ser780), CDC2, and Cyclin B1 were
detected in adult mouse brain. Furthermore, adult mouse skeletal muscle showed expression
of CDC2, pCDC2(Tyr15) and Cyclin B1. As the loading control, MHC proved to be equally
expressed at E19 and 1day then increases and stabilizes from 3d to adult. RB, pRB(Ser780)
and CDC2 had similar patterns within the heart whereby a strong signal at E19 eventually
decreases through the perinatal program and becomes absent at adult, however with a burst
in expression at 5d. Phosphorylated CDC2(Tyr15) illustrated a bell curve distribution with
the peak at 5d and the extremities at E19 and adult. Conversely, Cyclin B1 expression
oscillated with the highest expression at E19, 1d and 10d and near depletion at adult.
Overall, cardiac cells seemed to exit cell cycle and enter senescence. PRC1 increased
and stabilized in expression from E19 to adult; therefore PRC1 did not seem to be dependent
upon cell cycle progression and withdrawal.
89
In order to determine if Prc1 acts through interactors within the perinatal
cardiogenomic program, GeneMANIA was utilized. GeneMANIA is a bioinformatic tool
that employs a large set of functional association data (genetic interactions, pathways, co-
expression, co-localization and protein domain similarity) to link genes of interest to a set of
genes in the database (Warde-Farley et al., 2010). Figure 16A depicts the in silico
interactors to Prc1, through co-expression, co-localization, or predicted interaction. Panel B
summarizes the expression profiles of each putative interactor as determined by the exon
microarray data. Fascinatingly, all the genes (Bub1, Ccna2, Racgap1, Cdc2a, Dlgap5,
Ccnb2, Birc5, and Trim2) which are predicted to interact with Prc1 follow the same pattern
as Prc1 with the exception of Trim37 and 1110008P14Rik which in fact are not significantly
changing throughout perinatal cardiac development.
90
Figure 15: Perinatal Heart Maturation Involves Cell Cycle Withdrawal.
Immunoblotting analysis for changes in cell cycle markers and Prc1 in perinatal cardiac
development (N≥3). Wild-type mouse hearts aged at E19, 1d, 3d, 4d, 5d, 6d, 7d, 10d and
adult were probed with markers for cell cycle checkpoints (RB, pRB(Ser780), CDC2,
pCDC2(Tyr15), Cyclin B1) and PRC1. Five micrograms were loaded for PRC1, RB,
pRB(Ser780) and Cyclin B1. Ten micrograms were loaded for CDC2 and pCDC2(Tyr15).
Undifferentiated HL-1 as well as wild-type adult mouse brain and skeletal muscle protein
samples were used as positive and/or negative controls at 5μg each. After transferring, gels
were stained with Coomassie-Blue to visualize MHC as loading control (image represents a
10μg loaded gel).
91
PRC1
RB
pRB
(Ser780)
CDC2
pCDC2
(Tyr15)
Cyclin B1
MHC

92
Figure 16: Genes Interacting In Silico with Prc1 Have the Same Expression Profile as
Prc1. Genes putatively interacting with Prc1, as determined by GeneMANIA, follow the
same normalized (RMA) mean expression pattern as Prc1 as found on the exon microarray.
A) Gene interaction map generated by GeneMANIA demonstrating the different interactions
linked to Prc1. The interactions entail: co-expression (Bub1, Ccna2, Racgap1, Cdc2a,
Dlgap5, Ccnb2, Birc5); co-localization (Bub1, Ccna2, Cdc2a, Dlgap5, Ccnb2); and
predicted interaction (Trim37, Racgap1, Dlgap5, Ccnb2, Trim2, 1110008P14Rik) (see
Appendix – Suppl. Figure 4 for extensive reference list). B) Normalized (RMA) mean
expression signal, with corresponding standard error bars (±Std. Err.), of all genes found to
interact with Prc1 as determined by GeneMANIA. Exon microarray data resulted from E19,
1d, 3d, 5d, 7d, 10d and adult wild-type mouse heart transcripts.
93
A.
B.

94
DISCUSSION
95
Very little research has been conducted on the perinatal period of heart development in
which the heart transitions from the fetal heart gene program to the adult heart gene
program. It has been established that cardiomyocyte proliferation is high during fetal
development and cardiomyocytes have a decreased proliferative capacity after birth.
Furthermore, cells undergo a final round of DNA synthesis and karyokinesis in the absence
of cytokinesis, causing binucleation (Li et al. I and II, 1997). This perinatal cardiac program
summarizes a hyperplastic growth phase and a subsequent hypertrophic development, that
spans between embryonic day 19 and day 10 (Soonpaa et al., 1997). The transitional period
in the mouse occurs within this perinatal period.
Cardiogenesis is principally studied at the embryonic, fetal, and adult stages of
development. The importance of the transitional program between the prenatal and adult
stages remains largely unconsidered. Microarrays allowed us to assess the physiological
manifestations through molecular changes and lead us to determine potential factors in the
cardiac perinatal transitional program. We chose to study the whole heart in order to
determine the transcriptional profiles in their organic environment. Previous reports have
indicated the importance of studying genetic expression patterns in heart development given
their highly dynamic nature (Chen et al., 2004; Sehl et al., 2000). Chen et al. claim to be the
first to introduce the perinatal cardiogenomic expression profiles utilizing murine cDNA
microarrays (6144 mouse EST); however they solely focused on hearts aged at day 0, 7, 14
and adulthood. Our study further identifies the perinatal cardiogenomic expression profile
through embryonic day 19, postnatal day 1, 3, 5, 7, and 10, as well as adulthood, at both the
transcriptional and microRNA level. Microarray profiling experiments were performed to
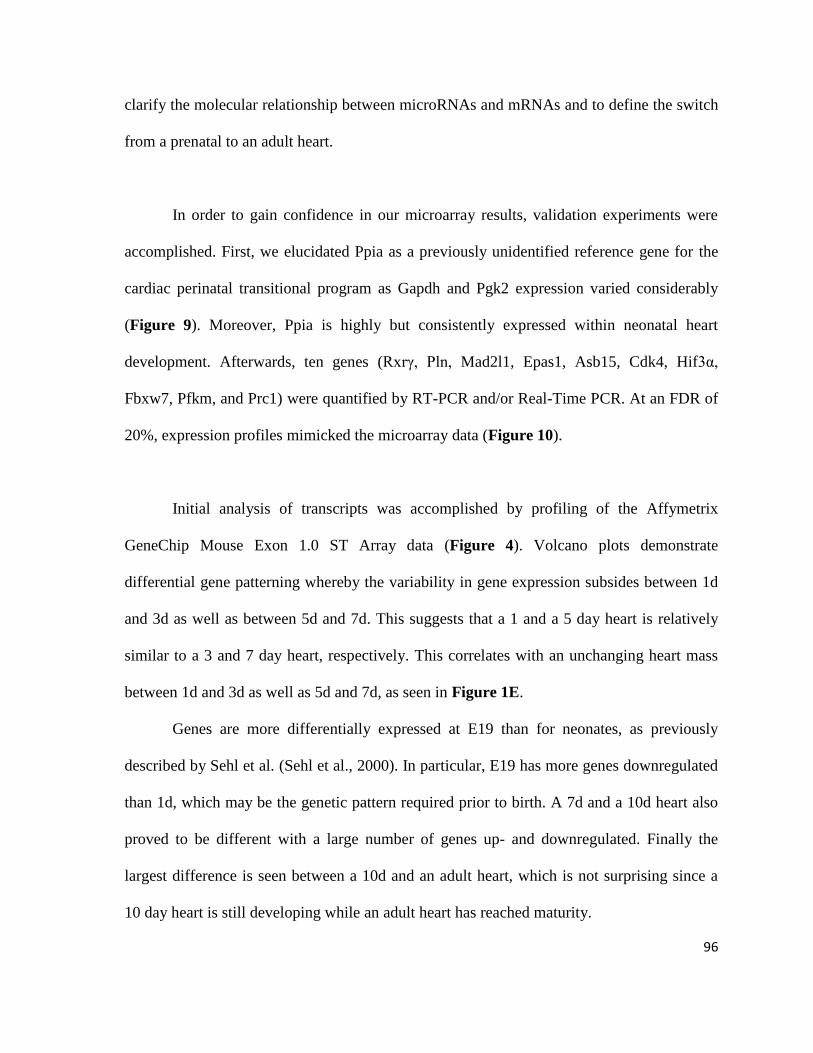
96
clarify the molecular relationship between microRNAs and mRNAs and to define the switch
from a prenatal to an adult heart.
In order to gain confidence in our microarray results, validation experiments were
accomplished. First, we elucidated Ppia as a previously unidentified reference gene for the
cardiac perinatal transitional program as Gapdh and Pgk2 expression varied considerably
(Figure 9). Moreover, Ppia is highly but consistently expressed within neonatal heart
development. Afterwards, ten genes (Rxrγ, Pln, Mad2l1, Epas1, Asb15, Cdk4, Hif3α,
Fbxw7, Pfkm, and Prc1) were quantified by RT-PCR and/or Real-Time PCR. At an FDR of
20%, expression profiles mimicked the microarray data (Figure 10).
Initial analysis of transcripts was accomplished by profiling of the Affymetrix
GeneChip Mouse Exon 1.0 ST Array data (Figure 4). Volcano plots demonstrate
differential gene patterning whereby the variability in gene expression subsides between 1d
and 3d as well as between 5d and 7d. This suggests that a 1 and a 5 day heart is relatively
similar to a 3 and 7 day heart, respectively. This correlates with an unchanging heart mass
between 1d and 3d as well as 5d and 7d, as seen in Figure 1E.
Genes are more differentially expressed at E19 than for neonates, as previously
described by Sehl et al. (Sehl et al., 2000). In particular, E19 has more genes downregulated
than 1d, which may be the genetic pattern required prior to birth. A 7d and a 10d heart also
proved to be different with a large number of genes up- and downregulated. Finally the
largest difference is seen between a 10d and an adult heart, which is not surprising since a
10 day heart is still developing while an adult heart has reached maturity.
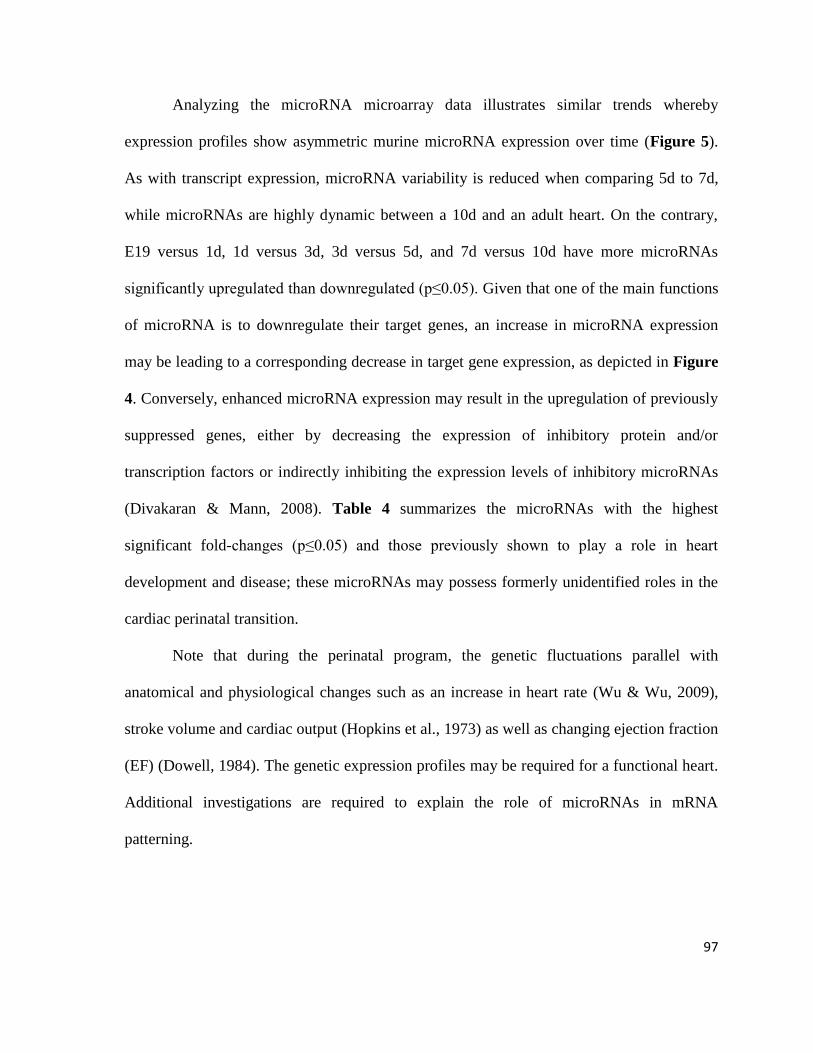
97
Analyzing the microRNA microarray data illustrates similar trends whereby
expression profiles show asymmetric murine microRNA expression over time (Figure 5).
As with transcript expression, microRNA variability is reduced when comparing 5d to 7d,
while microRNAs are highly dynamic between a 10d and an adult heart. On the contrary,
E19 versus 1d, 1d versus 3d, 3d versus 5d, and 7d versus 10d have more microRNAs
significantly upregulated than downregulated (p≤0.05). Given that one of the main functions
of microRNA is to downregulate their target genes, an increase in microRNA expression
may be leading to a corresponding decrease in target gene expression, as depicted in Figure
4. Conversely, enhanced microRNA expression may result in the upregulation of previously
suppressed genes, either by decreasing the expression of inhibitory protein and/or
transcription factors or indirectly inhibiting the expression levels of inhibitory microRNAs
(Divakaran & Mann, 2008). Table 4 summarizes the microRNAs with the highest
significant fold-changes (p≤0.05) and those previously shown to play a role in heart
development and disease; these microRNAs may possess formerly unidentified roles in the
cardiac perinatal transition.
Note that during the perinatal program, the genetic fluctuations parallel with
anatomical and physiological changes such as an increase in heart rate (Wu & Wu, 2009),
stroke volume and cardiac output (Hopkins et al., 1973) as well as changing ejection fraction
(EF) (Dowell, 1984). The genetic expression profiles may be required for a functional heart.
Additional investigations are required to explain the role of microRNAs in mRNA
patterning.
98
To determine which factors may be involved in the perinatal transition, we focused
on the genes and microRNAs that are significantly differentially expressed instead of those
with consistent expression. The number of changing transcripts and microRNAs were
plotted to visualize possible trends (Figure 6A). In fact, the temporal expression pattern of
mRNAs and microRNAs uncovered an inflection point between 5 and 7 days post-birth
representing a previously undescribed perinatal cardiogenomic switch. This switch
demonstrates that mRNA expression changes slightly prior to 5 and 7 days, at which point a
large number of genes are dramatically fluctuating into adulthood. On the other hand,
microRNA expression shows a temporary reduction between 5 and 10 days but then displays
a burst in expression after 10 days. Knowing that microRNAs cause gene silencing, the
observed increase in mRNA expression at 7 to 10 days may be the product of decreased
inhibitory microRNA expression. In addition, the general downregulation of microRNAs
during the switch may be allowing for the establishment of the adult program. Additional
investigation in microRNA target regulation is required to draw a definite conclusion.
We next sought out to identify transcription factor trends within cardiac development
(Figure 6B). As described by McKinsey and Olson, cardiac development entails signaling
pathways regulated by transcription factors (TFs) binding to DNA in promoter regions of
cardiac growth and remodeling genes through an activating or repressive capacity
(McKinsey & Olson, 2005). The gene expression profiling experiment revealed that 42% of
known mouse transcription factors are significantly variable between embryonic day 19 and
10 days post-birth (p≤0.05), suggesting a highly dynamic cardiogenomic transitional
program. This includes the following heart-related TFs changing on the arrays: Gata4,
99
Gata6, Nkx2-3, Nkx2-4, Nkx2-5, Tbx4, Tbx5, Tbx6, Tbx18, Tbx20, Hey2, Irx3, Rxrγ,
Hif3α and Evx1. Out of the 258 TFs significantly changing on the exon array, 107 fluctuate
in expression at least during two timepoints in the study. Interestingly transcription factor
profiling behaves differently than global gene expression patterning, resulting in an M and
W pattern, respectively (p≤0.05). Therefore, we propose that in order to switch from the
fetal to the adult cardiogenomic program, certain stages of development require more TFs to
be downregulated while others require an increase in TF expression. The aforementioned
cardiogenomic switch period (between 5 and 7 days) appears to have the highest genetic
variability whereby out of the 1226 genes significantly changing, there is nearly three times
more TFs down- than upregulated. However, as observed in the volcano plots, the least
number of transcriptional factors (mRNAs and miRNAs) are significantly changing is at 5d
versus 7d. This suggests that the transcriptional machinery may be subsiding prior to the
burst in transcriptional activity. On the contrary, this may simply be a result of a smaller
cohort of genes that distinguishes a 5d from a 7d heart. The dramatic increase in TFs
expression at 7 day may be the precursor to the increase in gene expression that follows at
10 days. Consequently, particular profiles have been determined as possible genetic
mechanisms that lead to the formation of a functional heart during development.
Subsequently, by filtering the gene lists, we were able to define pathways involved in
the perinatal cardiogenomic program. Figures 7 and 8 demonstrate the gene ontologies
differentially expressed, illustrated as Forest Plots and Pie Charts. The Forest Plots (Figure
7) highlight the genes up- and downregulated while the Pie Charts summarize total
Biological Processes (BP) (Figure 8), at each contrasting point. When studying GO profiles,
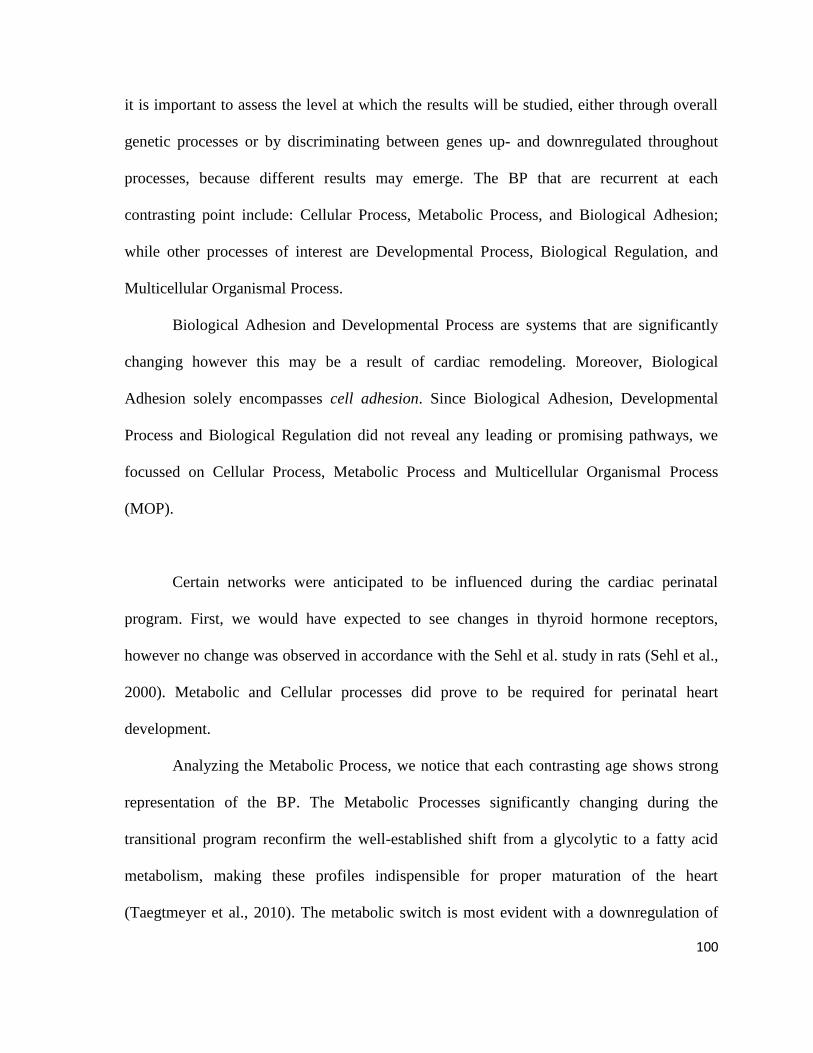
100
it is important to assess the level at which the results will be studied, either through overall
genetic processes or by discriminating between genes up- and downregulated throughout
processes, because different results may emerge. The BP that are recurrent at each
contrasting point include: Cellular Process, Metabolic Process, and Biological Adhesion;
while other processes of interest are Developmental Process, Biological Regulation, and
Multicellular Organismal Process.
Biological Adhesion and Developmental Process are systems that are significantly
changing however this may be a result of cardiac remodeling. Moreover, Biological
Adhesion solely encompasses cell adhesion. Since Biological Adhesion, Developmental
Process and Biological Regulation did not reveal any leading or promising pathways, we
focussed on Cellular Process, Metabolic Process and Multicellular Organismal Process
(MOP).
Certain networks were anticipated to be influenced during the cardiac perinatal
program. First, we would have expected to see changes in thyroid hormone receptors,
however no change was observed in accordance with the Sehl et al. study in rats (Sehl et al.,
2000). Metabolic and Cellular processes did prove to be required for perinatal heart
development.
Analyzing the Metabolic Process, we notice that each contrasting age shows strong
representation of the BP. The Metabolic Processes significantly changing during the
transitional program reconfirm the well-established shift from a glycolytic to a fatty acid
metabolism, making these profiles indispensible for proper maturation of the heart
(Taegtmeyer et al., 2010). The metabolic switch is most evident with a downregulation of
101
genes at E19, where the Metabolic Process encompasses the functional groups: lipid
metabolic process, oxidation reduction, and lipid catabolic process. Metabolic Process
remains significantly overrepresented throughout the contrasts, in particular at 7d versus 10d
where it represents nearly 50% of the BP. Interestingly the genes included in Metabolic
Processes are significantly and predominantly up at 1d versus 3d, down at 3d versus 5d, up
at 5d versus 7d, then down at 7d versus 10d but equally expressed at E19 versus 1d and 10d
versus adult. Therefore, this expression profile of up- and downregulated genes within
Metabolic Processes may be a result of normal heart development.
Next, Cellular Processes play a fundamental role in cardiac development knowing
that cardiomyocytes are rapidly proliferating near birth and eventually pass through a last
round of cell cycle during early hypertrophy (Soonpaa et al., 1996). Similar to Metabolic
Process, Cellular Process has specific patterns. Genes within Cellular Process are solely
significantly up at 1d versus 3d and 5d versus 7d, but down at 7d versus 10d, then return up
at 10d versus adult, whereas E19 versus 1d and 3d versus 5d have genes both significantly
up- and downregulated. Cellular Process particularly influences the contrasts 5d versus 7d
and 10d versus adult. When comparing 5d to 7d, Cellular Process is composed of functional
groups with very strong enrichment scores (ES). Thus the genes that are upregulated at 5d
within this process may suggest that 5 days post-birth is a pivotal point in cardiomyocyte
cell cycle activity. Genes upregulated at 10d include those involved in cell proliferation,
chromosome segregation, and actin-filament-based process, which are events that may
summarize cardiomyocyte binucleation. The increase in Cellular Process activity at 10d as
compared to adult may substantiate the fact that cell cycle remains active at 10d while it is
inexistent or limited at adulthood (Brooks et al., 1997; Poolman & Brooks, 1998).
102
Moreover, a 10d heart is finalizing multinucleation of cardiomyocytes to exit the transitional
program while an adult heart loses the ability to regenerate (Li et al., I & II, 1997). And so,
Cellular Processes are critical at 5 and 10 days post-birth.
The last Biological Process of interest is Multicellular Organismal Process (MOP).
MOP is present at E19 versus 1d, 3d versus 5d, 7d versus 10d and 10d versus adult within
the Forest Plots (Figure 7), but only found at E19 versus 1d and 3d versus 5d in the Pie
Charts (Figure 8). MOP can be further stratified into System Process Neurological
System Process Cognition Sensory Perception. The MOP GO root revealed that
olfactory receptor genes are a large representation of this BP. That is, ten out of the eighteen
genes that make up Sensory Perception are olfactory receptors and the rest are channel-
related. This represents ectopic expression of olfactory receptor genes within the heart, a
non-olfactory tissue. Over 900 olfactory receptor genes (OR) are found in the human and
nearly 1500 in mice (Niimura & Nei, 2003). Olfactory receptor genes have been previously
shown to have nonconventional expression within the heart. Similar to our results, OR genes
were detected in postnatal cardiogenesis (Drutel et al., 1995) but were absent in adult heart
(Feingold et al., 1999). Therefore, OR genes may hold an alternative function, especially in
heart development, but further experiments are required.
In search of a factor(s) with a potential role in cardiomyocyte binucleation, we
identified Prc1 as a gene highly and differentially expressed at pivotal ages in the perinatal
cardiac transitional program (E19 versus 1d, 5d versus 7d, 10d versus adult). In particular,
Prc1 displays one of the highest fold-changes at 10d as compared to adult. Figure 11
103
summarizes the microarray-generated expression profile of Prc1 with the corresponding
fold-changes and p-values for each contrast.
Protein Regulator of Cytokinesis (Prc1) was first described in 1998 by Jiang et al.
PRC1 amino acid sequence has strong conservation (at 40%) with yeast anaphase spindle
elongation factor, Ase1p (Jiang et al., 1998). Ase1p is known to mediate spindle assembly,
elongation and disassembly in mitosis (Juang et al., 1997; Pellman et al., 1995). Similar to
Ase1p, PRC1 protein is highly expressed during S and G2/M but depleted after mitosis and
during G1 (Jiang et al., 1998). PRC1 sequence is highly conserved among eukaryotic species
at residues 273 to 486, which is illustrated to be necessary for microtubule binding and
bundling activity (Mollinari et al., 2002). The human Prc1 transcript encodes a protein of
620 amino acids (aa) at 71kDa, whereas mouse Prc1 produces a protein of 603aa at 70kDa
(Jain et al., 2009; Jiang et al., 1998; The UniProt Consortium, 2010). The PRC1 protein
constituents were assessed through consensus and mutagenesis analysis (Jiang et al., 1998;
Mollinari et al., 2002). Human PRC1 is comprised of: β-sheets and turns in the carboxy-
terminus; two CDK consensus phosphorylation sites at Thr470 and Thr481
(TPSKRRGLAPNTPGKARKL), two nuclear localization signals, two destruction boxes,
and one KEN box, in the center; and α-helices and coiled-coil motifs in the amino-terminus
(Figure 17A; Mollinari et al., 2002). PRC1 protein truncation experiments revealed that the
N-terminal region of PRC1 is required for its association to the cleavage furrow and the
center of the midbody.
In HeLa cells, PRC1 expression is nuclear during interphase, gets localized to
mitotic spindle poles during prophase, associates to the entire mitotic spindle in metaphase
and early anaphase, and moves to the spindle midzone and cleavage furrow during mid- and
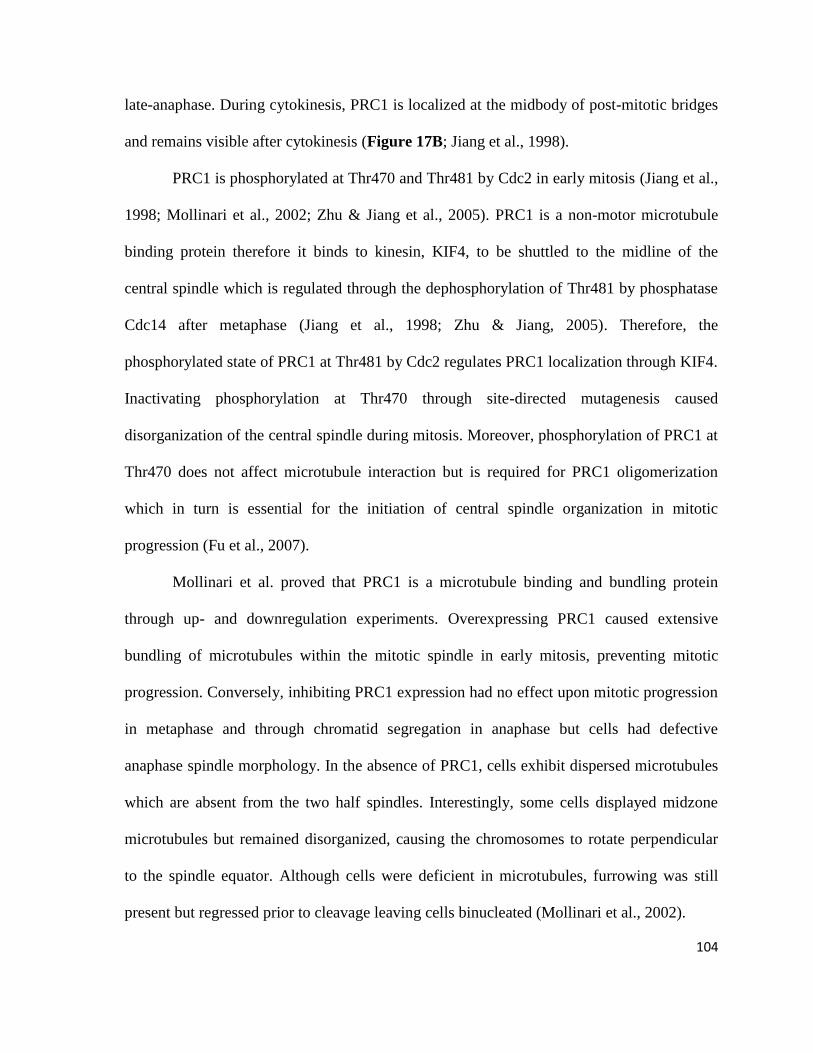
104
late-anaphase. During cytokinesis, PRC1 is localized at the midbody of post-mitotic bridges
and remains visible after cytokinesis (Figure 17B; Jiang et al., 1998).
PRC1 is phosphorylated at Thr470 and Thr481 by Cdc2 in early mitosis (Jiang et al.,
1998; Mollinari et al., 2002; Zhu & Jiang et al., 2005). PRC1 is a non-motor microtubule
binding protein therefore it binds to kinesin, KIF4, to be shuttled to the midline of the
central spindle which is regulated through the dephosphorylation of Thr481 by phosphatase
Cdc14 after metaphase (Jiang et al., 1998; Zhu & Jiang, 2005). Therefore, the
phosphorylated state of PRC1 at Thr481 by Cdc2 regulates PRC1 localization through KIF4.
Inactivating phosphorylation at Thr470 through site-directed mutagenesis caused
disorganization of the central spindle during mitosis. Moreover, phosphorylation of PRC1 at
Thr470 does not affect microtubule interaction but is required for PRC1 oligomerization
which in turn is essential for the initiation of central spindle organization in mitotic
progression (Fu et al., 2007).
Mollinari et al. proved that PRC1 is a microtubule binding and bundling protein
through up- and downregulation experiments. Overexpressing PRC1 caused extensive
bundling of microtubules within the mitotic spindle in early mitosis, preventing mitotic
progression. Conversely, inhibiting PRC1 expression had no effect upon mitotic progression
in metaphase and through chromatid segregation in anaphase but cells had defective
anaphase spindle morphology. In the absence of PRC1, cells exhibit dispersed microtubules
which are absent from the two half spindles. Interestingly, some cells displayed midzone
microtubules but remained disorganized, causing the chromosomes to rotate perpendicular
to the spindle equator. Although cells were deficient in microtubules, furrowing was still
present but regressed prior to cleavage leaving cells binucleated (Mollinari et al., 2002).
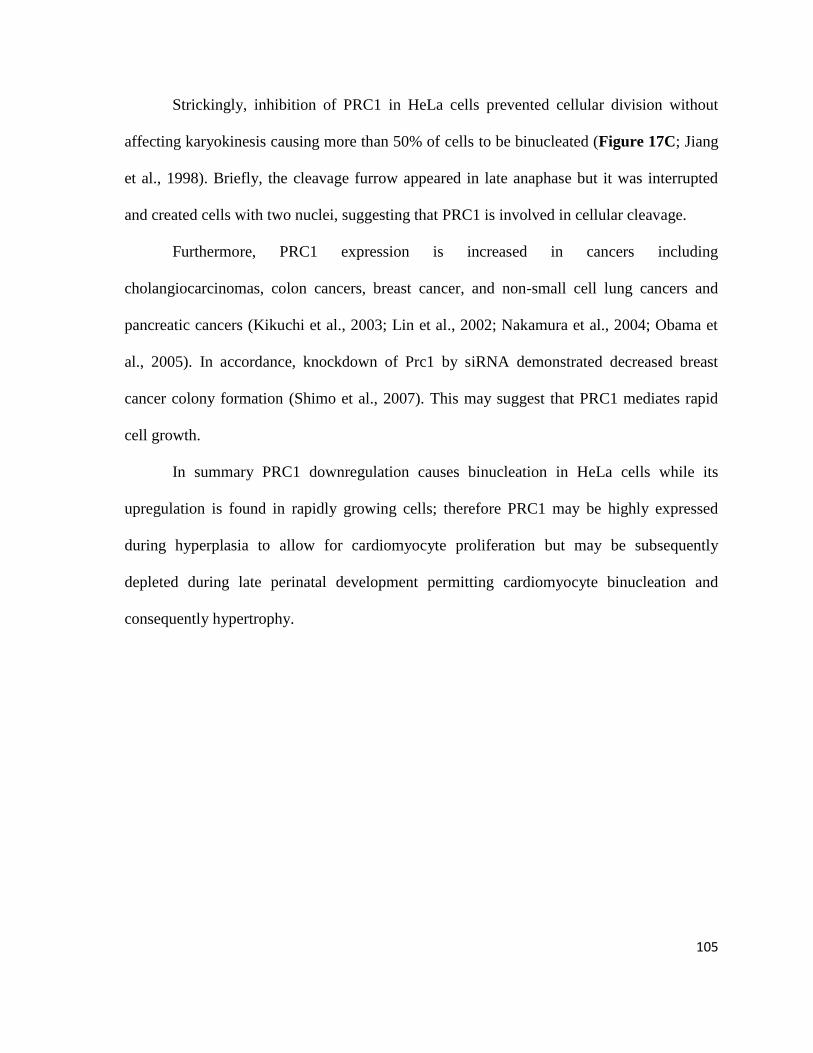
105
Strickingly, inhibition of PRC1 in HeLa cells prevented cellular division without
affecting karyokinesis causing more than 50% of cells to be binucleated (Figure 17C; Jiang
et al., 1998). Briefly, the cleavage furrow appeared in late anaphase but it was interrupted
and created cells with two nuclei, suggesting that PRC1 is involved in cellular cleavage.
Furthermore, PRC1 expression is increased in cancers including
cholangiocarcinomas, colon cancers, breast cancer, and non-small cell lung cancers and
pancreatic cancers (Kikuchi et al., 2003; Lin et al., 2002; Nakamura et al., 2004; Obama et
al., 2005). In accordance, knockdown of Prc1 by siRNA demonstrated decreased breast
cancer colony formation (Shimo et al., 2007). This may suggest that PRC1 mediates rapid
cell growth.
In summary PRC1 downregulation causes binucleation in HeLa cells while its
upregulation is found in rapidly growing cells; therefore PRC1 may be highly expressed
during hyperplasia to allow for cardiomyocyte proliferation but may be subsequently
depleted during late perinatal development permitting cardiomyocyte binucleation and
consequently hypertrophy.
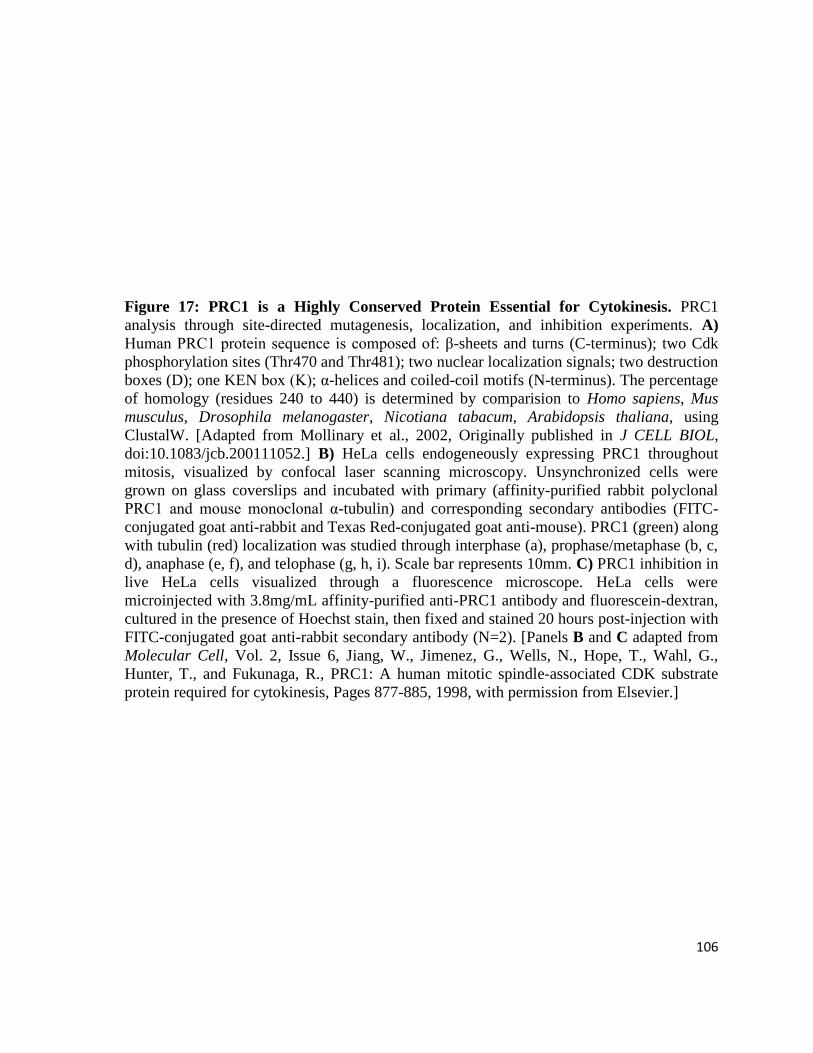
106
Figure 17: PRC1 is a Highly Conserved Protein Essential for Cytokinesis. PRC1
analysis through site-directed mutagenesis, localization, and inhibition experiments. A)
Human PRC1 protein sequence is composed of: β-sheets and turns (C-terminus); two Cdk
phosphorylation sites (Thr470 and Thr481); two nuclear localization signals; two destruction
boxes (D); one KEN box (K); α-helices and coiled-coil motifs (N-terminus). The percentage
of homology (residues 240 to 440) is determined by comparision to Homo sapiens, Mus
musculus, Drosophila melanogaster, Nicotiana tabacum, Arabidopsis thaliana, using
ClustalW. [Adapted from Mollinary et al., 2002, Originally published in J CELL BIOL,
doi:10.1083/jcb.200111052.] B) HeLa cells endogeneously expressing PRC1 throughout
mitosis, visualized by confocal laser scanning microscopy. Unsynchronized cells were
grown on glass coverslips and incubated with primary (affinity-purified rabbit polyclonal
PRC1 and mouse monoclonal α-tubulin) and corresponding secondary antibodies (FITC-
conjugated goat anti-rabbit and Texas Red-conjugated goat anti-mouse). PRC1 (green) along
with tubulin (red) localization was studied through interphase (a), prophase/metaphase (b, c,
d), anaphase (e, f), and telophase (g, h, i). Scale bar represents 10mm. C) PRC1 inhibition in
live HeLa cells visualized through a fluorescence microscope. HeLa cells were
microinjected with 3.8mg/mL affinity-purified anti-PRC1 antibody and fluorescein-dextran,
cultured in the presence of Hoechst stain, then fixed and stained 20 hours post-injection with
FITC-conjugated goat anti-rabbit secondary antibody (N=2). [Panels B and C adapted from
Molecular Cell, Vol. 2, Issue 6, Jiang, W., Jimenez, G., Wells, N., Hope, T., Wahl, G.,
Hunter, T., and Fukunaga, R., PRC1: A human mitotic spindle-associated CDK substrate
protein required for cytokinesis, Pages 877-885, 1998, with permission from Elsevier.]
107
A.
B.
C.
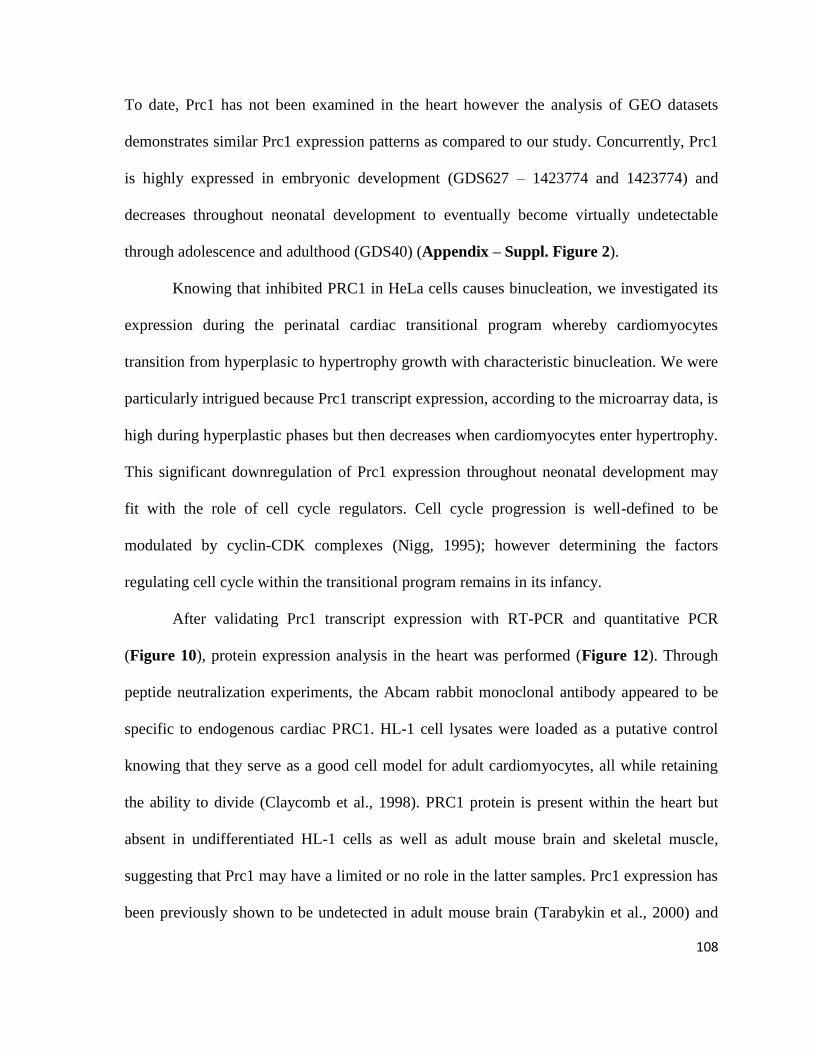
108
To date, Prc1 has not been examined in the heart however the analysis of GEO datasets
demonstrates similar Prc1 expression patterns as compared to our study. Concurrently, Prc1
is highly expressed in embryonic development (GDS627 – 1423774 and 1423774) and
decreases throughout neonatal development to eventually become virtually undetectable
through adolescence and adulthood (GDS40) (Appendix – Suppl. Figure 2).
Knowing that inhibited PRC1 in HeLa cells causes binucleation, we investigated its
expression during the perinatal cardiac transitional program whereby cardiomyocytes
transition from hyperplasic to hypertrophy growth with characteristic binucleation. We were
particularly intrigued because Prc1 transcript expression, according to the microarray data, is
high during hyperplastic phases but then decreases when cardiomyocytes enter hypertrophy.
This significant downregulation of Prc1 expression throughout neonatal development may
fit with the role of cell cycle regulators. Cell cycle progression is well-defined to be
modulated by cyclin-CDK complexes (Nigg, 1995); however determining the factors
regulating cell cycle within the transitional program remains in its infancy.
After validating Prc1 transcript expression with RT-PCR and quantitative PCR
(Figure 10), protein expression analysis in the heart was performed (Figure 12). Through
peptide neutralization experiments, the Abcam rabbit monoclonal antibody appeared to be
specific to endogenous cardiac PRC1. HL-1 cell lysates were loaded as a putative control
knowing that they serve as a good cell model for adult cardiomyocytes, all while retaining
the ability to divide (Claycomb et al., 1998). PRC1 protein is present within the heart but
absent in undifferentiated HL-1 cells as well as adult mouse brain and skeletal muscle,
suggesting that Prc1 may have a limited or no role in the latter samples. Prc1 expression has
been previously shown to be undetected in adult mouse brain (Tarabykin et al., 2000) and
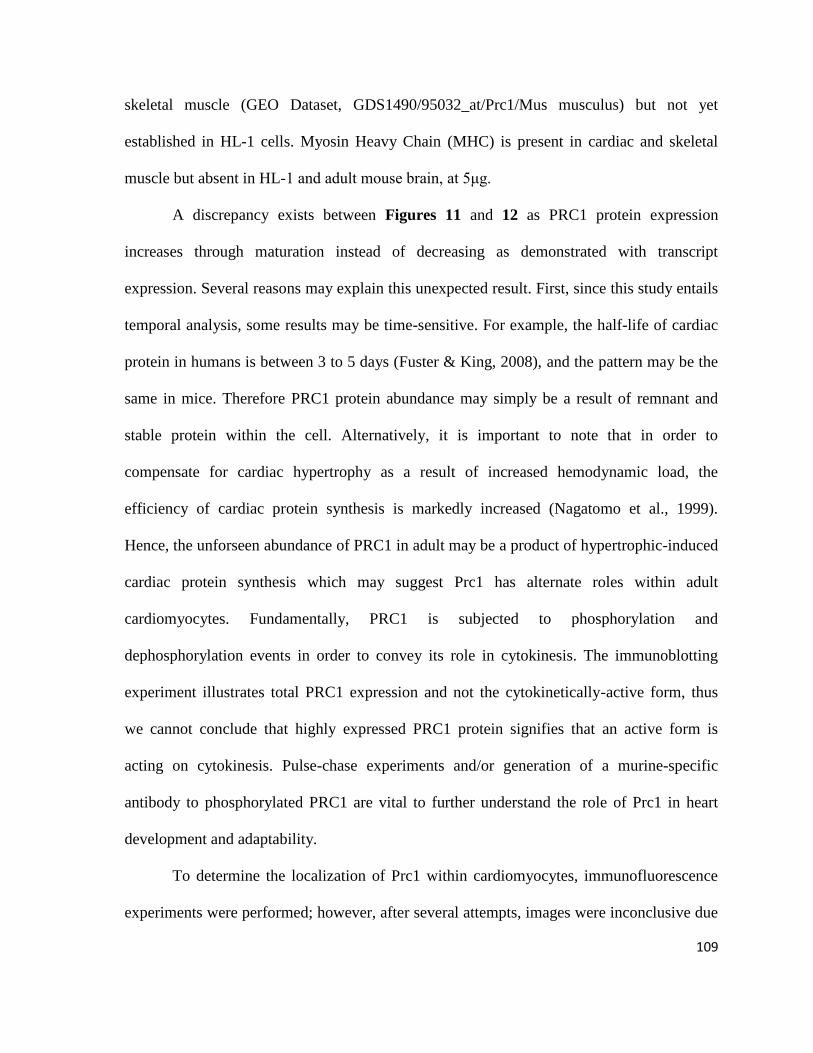
109
skeletal muscle (GEO Dataset, GDS1490/95032_at/Prc1/Mus musculus) but not yet
established in HL-1 cells. Myosin Heavy Chain (MHC) is present in cardiac and skeletal
muscle but absent in HL-1 and adult mouse brain, at 5μg.
A discrepancy exists between Figures 11 and 12 as PRC1 protein expression
increases through maturation instead of decreasing as demonstrated with transcript
expression. Several reasons may explain this unexpected result. First, since this study entails
temporal analysis, some results may be time-sensitive. For example, the half-life of cardiac
protein in humans is between 3 to 5 days (Fuster & King, 2008), and the pattern may be the
same in mice. Therefore PRC1 protein abundance may simply be a result of remnant and
stable protein within the cell. Alternatively, it is important to note that in order to
compensate for cardiac hypertrophy as a result of increased hemodynamic load, the
efficiency of cardiac protein synthesis is markedly increased (Nagatomo et al., 1999).
Hence, the unforseen abundance of PRC1 in adult may be a product of hypertrophic-induced
cardiac protein synthesis which may suggest Prc1 has alternate roles within adult
cardiomyocytes. Fundamentally, PRC1 is subjected to phosphorylation and
dephosphorylation events in order to convey its role in cytokinesis. The immunoblotting
experiment illustrates total PRC1 expression and not the cytokinetically-active form, thus
we cannot conclude that highly expressed PRC1 protein signifies that an active form is
acting on cytokinesis. Pulse-chase experiments and/or generation of a murine-specific
antibody to phosphorylated PRC1 are vital to further understand the role of Prc1 in heart
development and adaptability.
To determine the localization of Prc1 within cardiomyocytes, immunofluorescence
experiments were performed; however, after several attempts, images were inconclusive due
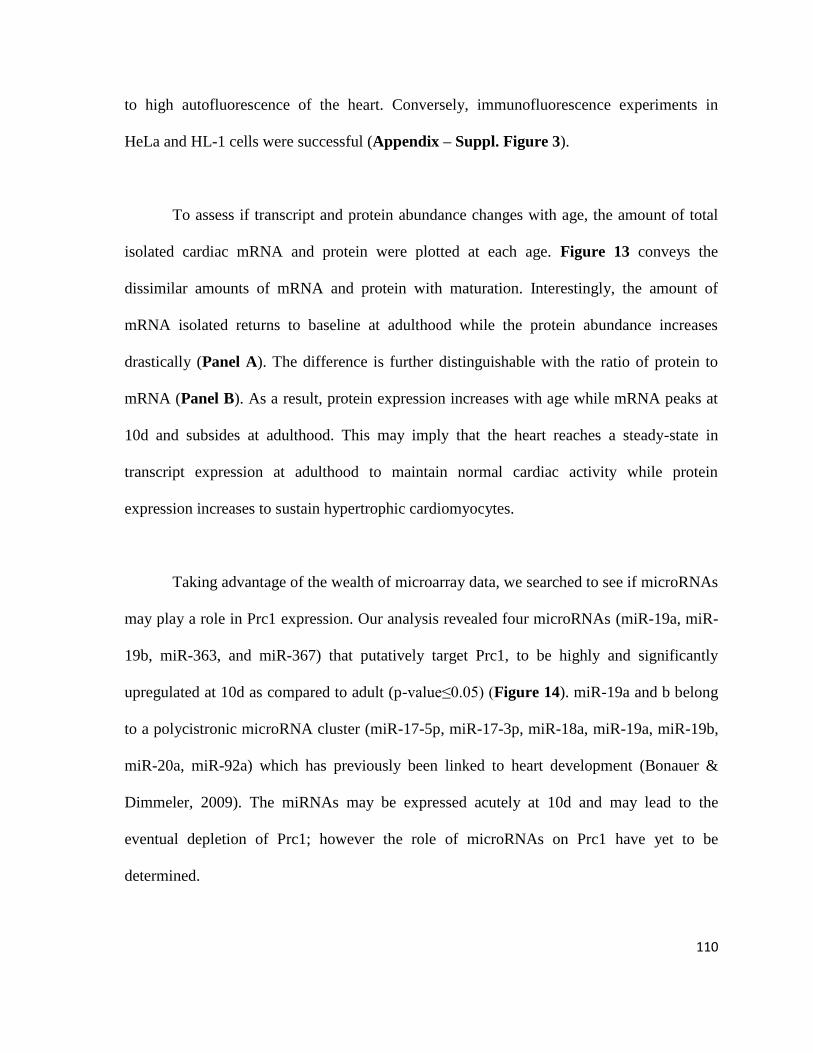
110
to high autofluorescence of the heart. Conversely, immunofluorescence experiments in
HeLa and HL-1 cells were successful (Appendix – Suppl. Figure 3).
To assess if transcript and protein abundance changes with age, the amount of total
isolated cardiac mRNA and protein were plotted at each age. Figure 13 conveys the
dissimilar amounts of mRNA and protein with maturation. Interestingly, the amount of
mRNA isolated returns to baseline at adulthood while the protein abundance increases
drastically (Panel A). The difference is further distinguishable with the ratio of protein to
mRNA (Panel B). As a result, protein expression increases with age while mRNA peaks at
10d and subsides at adulthood. This may imply that the heart reaches a steady-state in
transcript expression at adulthood to maintain normal cardiac activity while protein
expression increases to sustain hypertrophic cardiomyocytes.
Taking advantage of the wealth of microarray data, we searched to see if microRNAs
may play a role in Prc1 expression. Our analysis revealed four microRNAs (miR-19a, miR-
19b, miR-363, and miR-367) that putatively target Prc1, to be highly and significantly
upregulated at 10d as compared to adult (p-value≤0.05) (Figure 14). miR-19a and b belong
to a polycistronic microRNA cluster (miR-17-5p, miR-17-3p, miR-18a, miR-19a, miR-19b,
miR-20a, miR-92a) which has previously been linked to heart development (Bonauer &
Dimmeler, 2009). The miRNAs may be expressed acutely at 10d and may lead to the
eventual depletion of Prc1; however the role of microRNAs on Prc1 have yet to be
determined.
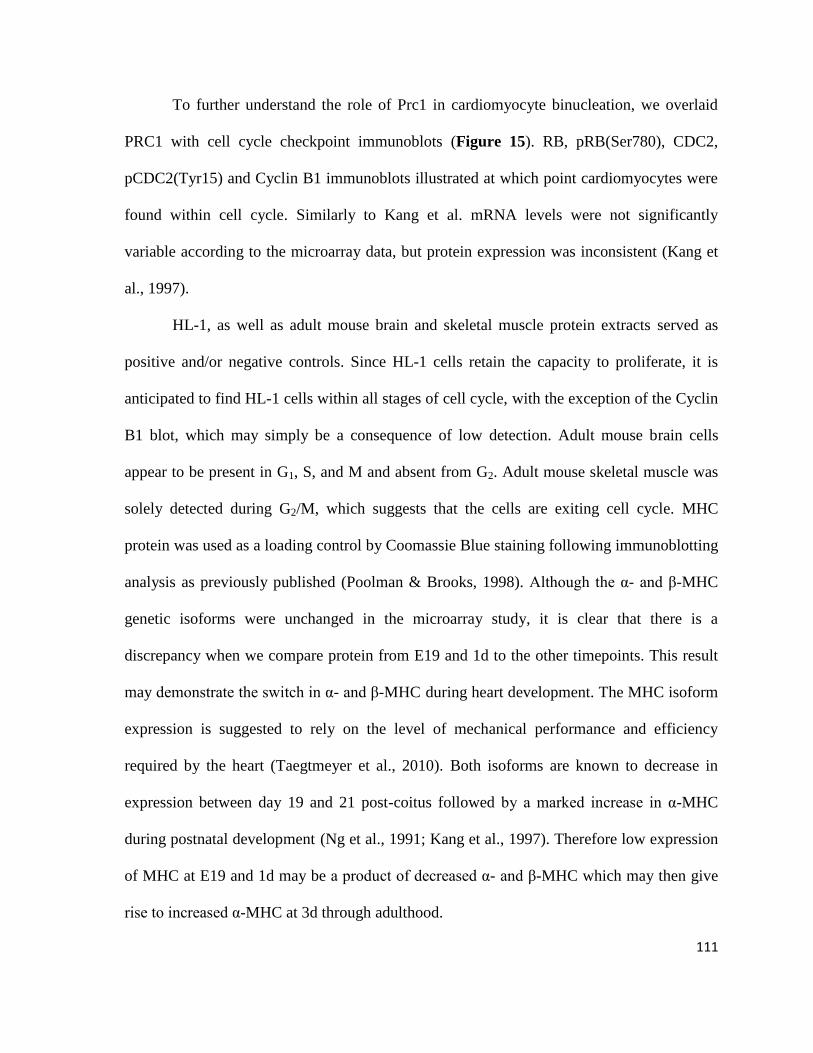
111
To further understand the role of Prc1 in cardiomyocyte binucleation, we overlaid
PRC1 with cell cycle checkpoint immunoblots (Figure 15). RB, pRB(Ser780), CDC2,
pCDC2(Tyr15) and Cyclin B1 immunoblots illustrated at which point cardiomyocytes were
found within cell cycle. Similarly to Kang et al. mRNA levels were not significantly
variable according to the microarray data, but protein expression was inconsistent (Kang et
al., 1997).
HL-1, as well as adult mouse brain and skeletal muscle protein extracts served as
positive and/or negative controls. Since HL-1 cells retain the capacity to proliferate, it is
anticipated to find HL-1 cells within all stages of cell cycle, with the exception of the Cyclin
B1 blot, which may simply be a consequence of low detection. Adult mouse brain cells
appear to be present in G1, S, and M and absent from G2. Adult mouse skeletal muscle was
solely detected during G2/M, which suggests that the cells are exiting cell cycle. MHC
protein was used as a loading control by Coomassie Blue staining following immunoblotting
analysis as previously published (Poolman & Brooks, 1998). Although the α- and β-MHC
genetic isoforms were unchanged in the microarray study, it is clear that there is a
discrepancy when we compare protein from E19 and 1d to the other timepoints. This result
may demonstrate the switch in α- and β-MHC during heart development. The MHC isoform
expression is suggested to rely on the level of mechanical performance and efficiency
required by the heart (Taegtmeyer et al., 2010). Both isoforms are known to decrease in
expression between day 19 and 21 post-coitus followed by a marked increase in α-MHC
during postnatal development (Ng et al., 1991; Kang et al., 1997). Therefore low expression
of MHC at E19 and 1d may be a product of decreased α- and β-MHC which may then give
rise to increased α-MHC at 3d through adulthood.
112
RB and pRB(Ser780) are checkpoints for G1/S while CDC2, pCDC2(Tyr15) and
Cyclin B1 are G2/M checkpoints. Moreover, RB is unphosphorylated during G1 while the
phosphorylated form is in S phase (Poznic, 2009). Cyclin B1 is responsible for the transition
from G2 to M (Bicknell et al., 2004). Lastly, phosphorylated CDC2 at residue tyrosine 15
maintains the cell in G2 but once unphosphorylated the cell enters M phase (Morgan, 2007).
According to Figure 15, cardiomyocytes exit cell cycle as the heart matures. First, RB and
pRB(S780) are highly expressed at E19 until day 3, which signifies that the majority of
cardiomyocytes are found within G1/S phase. The retinoblastoma protein decreases in
expression with age as previously shown (Soonpaa et al., 1996), but with a spike at day 5.
Simultaneously, CDC2 expression pattern mimics that of retinoblastoma protein.
Alternatively, pCDC2(Tyr15) expression profile portrays a bell curve whereby the
expression peaks at 5 day. Consequently, between E19 and 4 days post-birth, the heart is
majorly found in G1, S, and M phase. At 5 days post-birth, there appears to be a last push in
cell cycle activity, which coincides with increased Cellular Processes (Figures 7 and 8).
Finally, after day 5 the cellular activity subsides. On the contrary, Cyclin B1 expression
varies, which may indicate a continuous transition between G2 and M, ending at adulthood.
Also, the heart may require enhanced Cyclin B1 expression in order to proceed through
complete binucleation at 10d. Likewise, Chen et al. put forward the possibility that Cyclin
B1 may be involved in binucleation. Bicknell et al. further proposed that the loss of Cyclin
B1 and Cdc2 complex regulates hypertrophic growth.
The cell cycle checkpoint temporal profiles are confirmed with the literature. First,
Cyclin B1 expression has been shown to oscillate, whereby the expression is highest at day
0, then decreases at day 7 and adulthood (Chen et al., 2004). Concurrently, CDC2 decreases
113
within the transitional period (Poolman & Brooks, 1998). Lastly, Kang et al. concluded that
Cyclins and CDKs are highly expressed during embryonic development but then G1/S and
G2/M Cyclins and CDKs decreased with age. Thus, depletion of CDKs and Cyclins may be
responsible for cardiomyocyte cell cycle withdrawal and resulting binucleation. There were
inconclusive results for RB and pRB(Ser780). Knowing that E2F initiates transcription
when unbound to RB, through the phosphorylation of RB, increased abundance of
phosphoRB eventually leads to increased transcription (Poznic, 2009). As a result, high
expression of pRB during early transition may be involved in the coincidentally large cohort
of genes at E19 (Figure 6).
Overall, cell cycle regulators (CDKs and Cyclins) and oncogenes (RB and pRB) are
highly expressed during embryonic development but subside at different points in heart
maturation. Therefore, as the heart progresses through maturation, cardiomyocytes
increasingly withdraw from cell cycle and cytokinesis.
Finally, Prc1 may be exerting its role on binucleation through a network of genes. To
determine putative interactors of Prc1, an algorithm was run using GeneMANIA (Figure
16A; Warde-Farley et al., 2010). As a result, eleven genes (Prc1, Bub1, Ccna2, Racgap1,
Cdc2a, Dlgap5, Ccnb2, Birc5, Trim2, Trim37, 1110008P14Rik) were mapped into an
interaction network, either through co-expression, co-localization, or as predicted
interactions. The expression profiles of the eleven genes were extracted and plotted from the
exon microarray data to assess if their expression reveals a pattern (Figure 16B). As a result,
the genes predicted to interact with Prc1 are significantly changing (excluding Trim37 and
1110008P14Rik) during the transition. In particular, Bub1, Ccna2, Racgap1, Cdc2a, Dlgap5,
114
Ccnb2, and Birc5 follow a similar expression pattern to Prc1, with the highest fold-changes
at 10d versus adult. We propose that these genes are required for a 10d heart but have a
limited or absent role during adulthood. Furthermore, the seven genes have been previously
shown to be involved in: spindle checkpoint function (Bub10) (Goto et al., 2011);
cardiomyocyte mitosis (Ccna2) (Chaudhry et al., 2004); microtubule function in cytokinesis
(Racgap1) (Jones et al., 2010); G1/S and G2/M phase transition (Cdc2a) (Gavet & Pines,
2010); central spindle formation (Dlgap5) (Uehara & Goshima, 2010); the control of G2/M
transition (Ccnb2) (RefSeq, 2011); and, microtubule binding through the chromosomal
passenger complex (Birc5) (Ruchaud et al., 2007). These functions further support the belief
that Prc1 and its factors may mediate cardiomyocyte binucleation. Ccna2 may appear to
have the largest variability in expression, however once the normalized data is run through a
1-way ANOVA, Prc1 remains the gene with the highest fold-change.
In conclusion, depletion of Prc1 may mediate binucleation of cardiomyocytes
through or in conjunction with Bub1, Ccna2, Racgap1, Cdc2a, Dlgap5, Ccnb2, and Birc5.
Further experiments will determine the role of these factors in cardiac maturation.

115
CONCLUSION
116
A diseased or injured adult heart compensates through hypertrophy as it is incapable of
regenerating muscle. To better understand the underlining effectors in cardiac disorders, the
mechanisms or factors mediating the transition to a hypertrophic heart need to be elucidated.
A normal murine heart transitions from a hyperplastic to a hypertrophic growth between E19
and 10 days post-birth. This transition is characterized by a switch from a prenatal to an
adult gene program.
Microarray analysis proved that gene and microRNA expression are highly regulated
and dynamic processes during the cardiac perinatal transitional program. Temporal
expression patterning of mRNAs and microRNAs uncovered a point of inflection centered
around 5 and 7 days post-birth, representing a previously undescribed perinatal
cardiogenomic switch. We believe that the transitional heart program is initiated at birth
and is required for the normal neonatal maturation of the fetal heart into the adult heart.
The largest cohort of transcriptional factors (mRNAs and microRNAs) is present
when comparing E19 to 1d, 7d to 10d, and 10d to adult. Furthermore, total gene expression
pattern differs from that of transcription factors. Approximately 40% of known mice
transcription factors are significantly (p≤0.05) fluctuating between embryonic day 19 and 10
days post-birth.
Gene Ontology analysis demonstrated an interplay between Cellular and Metabolic
Processes as a result of a developing heart progressing through the transition. Although 5d
versus 7d displays the smallest list of genes significantly changing, the genes that form the
Biological Processes have the strongest Enrichment Scores.
Validation of the microarrays by PCR quantification was successful at an FDR of
20%. Ppia proves to be a reliable reference gene when studying perinatal heart growth.
117
Progression of the heart through the perinatal period includes cardiomyocyte
withdrawal from cell cycle. In particular, cell cycle regulator (Cyclins and CDKs) and
oncogene (RB) expression decreases with perinatal cardiac development with a secondary
peak at 5 days post-birth. In addition, the depletion of Prc1 and its interactors may promote
cardiomyocyte binucleation.
The mechanistic switch between physiological and pathological heart development
still remains unclear. This study provides a temporal analysis of factors and processes
mediating different perinatal growth patterns. Understanding the perinatal period and how
the fetal heart gene program is downregulated may uncover key mechanistic clues into
cardiomyocyte cell cycle re-entry and myocyte regeneration.
118
Figure 18: Potential Model of the Processes and Factors Regulating Cardiomyocyte
Maturation during the Cardiac Perinatal Transitional Program. A) Normal progression
through cell cycle demonstrates increased Prc1 expression during M phase and has limited
to absent expression during G1/S phase (Jiang et al., 1998). B) The cardiac perinatal
transitional program encompasses the switch from hyperplasia and mononucleation to
hypertrophy and binucleation. The transition entails Cellular and Metabolic Processes as
well as dynamic genomic programs. As cardiomyocytes proceed through the cardiac
perinatal transitional program (from birth unto adulthood), cell cycle activity decreases with
age, with peaked expression at 5 days. Knowing the role that Prc1 plays in cytokinesis and
with our perinatal cardiogenomic expression analysis, we propose that Prc1 may play a role
in cardiomyocyte binucleation whereby the expression of Prc1 during the transition from a
hyperplastic to a hypertrophic heart entails a depletion of Prc1 and its interactors (Bub1,
Ccna2, Racgap1, Cdc2a, Dlgap5, Ccnb2, and Birc5). In addition, upregulated microRNA
expression at adulthood may play an important role in hypertrophic growth. These processes
are believed to mediate heart maturation through the perinatal cardiac transitional program.
119
A.
B.
120
REFERENCES
Ahuja, P., Sdek, P., & Maclellan, W. R. (2007). Cardiac Myocyte Cell Cycle Control in Development, Disease,
and Regeneration. Physiol Rev , 521-544.
Ai, D., Fu, X., Wang, J., Lu, M., Chen, L., Baldini, A., et al. (2007). Canonical Wnt signaling functions in
second heart field to promote right ventricular growth. PNAS , 104, 9319-9324.
Akazawa, H., & Komuro, I. (2003). Roles of cardiac transcription factors in cardiac hypertrophy. Circ Res , 92,
1079-1088.
Allawi, H., Dahlberg, J., Olson, S., Lund, E., Olson, M., Ma, W., et al. (2004). Quantitation of microRNAs
using a modified Invader assay. RNA , 10 (7), 1153-61.
Ambros, V. (2004). The function of animal microRNAs. Nature , 431 (7006), 350-355.
Ambros, V., & Lee, R. (2004). Identification of microRNAs and other tiny noncoding RNAs by cDNA
cloning. Methods in Molecular Biology , 265, 131-58.
Anversa, P., & Nadal-Ginard, B. (2002). Myocyte renewal and ventricular remodeling. Nature , 415, 240-243.
Appasani, K., Altman, S., & Ambros, V. R. (2007). microRNAs: From Basic Science to Disease Biology.
Cambridge: Cambridge University Press.
Armstrong, M., Lee, D., & Armstrong, P. (2000). Regulation of proliferation of the fetal myocardium. Dev.
Dyn. , 219, 226-236.
Au, K., Kou, C., Woo, A., Chim, S., Fung, K., Cheng, C., et al. (2006). Calcyclin binding protein promotes
DNA synthesis and differentiation in rat neonatal cardiomyocytes. J Cell Biochem , 98, 555-566.
Balsam, L., Wagers, A., Christensen, J., Kofidis, T., Weissman, I., & Robbins, R. (2004). Haematopoietic stem
cells adopt mature haematopoeitic fates in ischaemic myocardium. Nature , 428, 668-673.
Barki-Harrington, L., Perrino, C., & Rockman, H. (2004). Network integration of the adrenergic system in
cardiac hypertrophy. Cardiovasc Res , 63, 391-402.
Bartelds, B., Knoester, H., Smid, G., Takens, J., Visser, G., Penninga, L., et al. (2000). Perinatal changes in
myocardial metabolism in lambs. Circulation , 102, 926-931.
Baurand, A., Zelarayan, L., Betney, R., Gehrke, C., Dunger, S., Noack, C., et al. (2007). Beta-catenin
downregulation is required for adaptive cardiac remodeling. Circ Res , 100, 1353-1362.
Bergmann, O., Bhardwaj, R., Bernard, S., Zdunek, S., Barnabé-Heider, F., Walsh, S., et al. (2009). Evidence
for cardiomyocyte renewal in humans. Science , 324 (5923), 98-102.
Bicknell, K. A., Coxon, C. H., & Brooks, G. (2004). Forced expression of the cyclin B1-CDC2 complex
induces proliferation in adult rat cardiomyocytes. Biochem. J. , 411-416.
Bishop, S. (1990). The myocardial cell: normal growth, cardiac hypertrophy and response to injury.
Toxicologic Pathology , 18, 438-453.
121
Bolli, P., & Chaudhry, W. (2010). Molecular physiology of cardiac regeneration. Ann N Y Acad Sci , 1211,
113-126.
Bonauer, A., & Dimmeler, S. (2009). The microRNA-17-92 cluster: still a miRacle? Cell Cycle , 8, 3866-3873.
Brent, G. (2000). Tissue-specific actions of thyroid hormone: insights from animal models. Rev Endocr Metab
Disord , 1, 27-33.
Brooks, G., Poolman, R. A., & Li, J.-M. (1998). Arresting developments in the cardiac myocyte cell cycle:
Role of cyclin-dependent kinase inhibitors . Cardiovascular Research , 301-311.
Brooks, G., Poolman, R., McGill, C., & Li, J.-M. (1997). Expression and activities of cyclins and cyclin-
dependent kinases in developing rat ventricular myocytes. J Mol Cell Cardiol , 29, 2261-2271.
Capasso, J., Bruno, S., Cheng, W., Li, P., Rodgers, R., Darzynkiewicz, Z., et al. (1992). Ventricular loading is
coupled with DNA syntesis in adult cardiac myocytes after acute and chronic myocardial infarction in rats.
Circ Res , 71, 1379-1389.
Carmena, M., & Riparbelli, M. M. (1998). Drosophila polo kinase is required for cytokinesis. J Cell Biol , 143,
659-671.
Cartwright, E., Schulh, K., & Neyses, L. (2005). Calcium transport in cardiovascular health and disease - the
sarcolemmal calcium pump enters the stage. J. Mol. Cell Cardiol. , 403-406.
Chaudhry, H., Dashoush, N., Tang, H., Zhang, L., Wang, X., Wu, E., et al. (2004). Cyclin A2 mediates
cardiomyocyte mitosis in the postmitotic myocardium. J Biol Chem , 279, 35858-35866.
Chen, H.-W., Yu, S.-L., Chen, W.-J., Yang, P.-C., Chien, C.-T., Chou, H.-Y., et al. (2004). Dynamic changes
of gene expression profiles during postnatal development of the heart in mice. Heart , 90, 927-934.
Chen, J., Callis, T., & Wang, D. (2009). microRNAs and Muscle Disorders. J Cell Sci , 122, 13-20.
Chen, J., Murchison, E., Tang, R., Callis, T., Tatsuguchi, M., Deng, Z., et al. (2008). Targeted deletion of
Dicer in the heart leads to dilated cardiomyopathy and heart failure. Proc Natl Aca Sci USA , 105 (6), 2111-6.
Chen, J., Murchison, E., Tang, R., Callis, T., Tatsuguchi, M., Deng, Z., et al. (2008). Targeted deletion of
Dicer in the heart leads to dilated cardiomyopathy and heart failure. Neuroscience , 105 (6), 2111-2116.
Chen, X., Shevtsov, S., Hsich, E., Cui, L., Haq, S., Aronovitz, M., et al. (2006). The beta-catenin/T-cell
factor/lymphocyte enhancer factor signaling pathway is required for normal and stress-induced cardiac
hypertrophy. Mol Cell Biol , 26, 4462-4473.
Chien, K. (2004). Lost in Translation. Nature , 428, 607-608.
Chu, C., & Rana, T. (2007). Small RNAs: Regulators and Guardians of the Genome. Journal of Cellular
Physiology , 213, 412-419.
Chung, C., Bien, H., Sobie, E., Dasari, V., McKinnon, D., Rosati, B., et al. (2010). Hypertrophic phenotype in
cardiac cell assemblies solely by structural cues and ensuing self-organization. Epub ahead of print.
122
Claycomb, W., Lanson, N. J., Stallworth, B., Egeland, D., Delcarpio, J., Bahinski, A., et al. (1998). HL-1 cells:
A cardiac muscle cell line that contracts and retains phenotypic characteristics of the adult cardiomyocyte.
Proc. Natl. Acad. Sci. , 2979-2984.
Clubb, F. J., & Bishop, S. (1984). Formation of binucleated myocardiac cells in the neonatal rat: An index for
growth hypertrophy. Lab. Invest. , 571-577.
Cohen, E., Wang, Z., Lepore, J., Lu, M., Taketo, M., Epstein, D., et al. (2007). Wnt/Beta-catenin signaling
promotes expansion of Isl-1-positive cardiac progenitor cells through regulation of FGF signaling. J Clin
Invest, 117, 1794-1804.
Condorelli, G., & Dimmeler, S. (2008). MicroRNAs: components of an integrated system controlling cardiac
development, physiology, and disease pathogenesis. Cardiovasc. Res. , 551-2.
Conlon, R., Reaume, A., & Rossant, J. (1995). Notch1 is required for the coordinate segmentation of somites.
Development , 121, 1533-1545.
Danzi, S., & Klein, I. (2004). Thyroid hormone and the cardiovascular system. Minerva Endocrinol , 29, 139-
150.
D'Avino, P., Savoian, M., & Glover, D. (2005). Cleavage furrow formation and ingression during animal
cytokinesis: a microtubule legacy. J Cell Sci , 118, 1549-1558.
DeBry, R., & Seldin, M. (1996). Human/mouse homology relationships. Genomics , 33, 337-351.
Divakaran, V., & Mann, D. (2008). The Emerging Role of MicroRNAs in Cardiac Remodeling and Heart
Failure. Circ Res , 103, 1072-1083.
Donovan, J., Kordylewska, A., Jan, Y., & Utset, M. (2002). Tetralogy of fallot and other congenital heart
defects in Hey2 mutant mice. Curr Biol , 12, 1605-1610.
Dowell, R. (1984). Metabolic and contractile function enhancement during rat heart postnatal development.
Mech Ageing Dev , 25, 307-321.
Drechsel, D., Hyman, A., Hall, A., & Glotzer, M. (1997). A requirement for Rho and Cdc42 during cytokinesis
in Xenopus embryos. Curr Biol , 7, 12-23.
Drutel, G., Arrang, J., Diaz, J., Wisnewsky, C., Schwartz, K., & Schwartz, J. (1995). Cloning of OL1, a
putative olfactory receptor and its expression in the developing rat heart. Receptors and Channels , 3, 33-40.
Duarte, A., Hirashima, M., Benedito, R., Trindade, A., Diniz, P., & Bekman, E. (2004). Dosage-sensitive
requirement for mouse Dll4 in artery development. Genes Dev , 18, 2474-2478.
Eppig, J., & Nadeau, J. (1995). Comparative maps: The mammalin jigsaw puzzle. Curr. Opin. Genet. Dev. , 5,
709-716.
Feingold, E., Penny, L., Nienhuis, A., & Forget, B. (1999). An olfactory receptor gene is located in the
extended human beta-globin gene cluster and is expressed in erythroid cells. Genomics , 61, 15-23.
Field, L. (2004). Modulation of the cardiomyocyte cell cycle in genetically altered animals. Ann NY Acad Sci ,
1015, 160-170.
123
Fischer, A., Schumacher, N., Maier, M., Sendtner, M., & Gessler, M. (2004). The Notch target genes Hey1 and
Hey2 are required for embryonic vascular development. Genes Dev , 18, 901-911.
Fischer, A., Steidl, C., Wagner, T., Lang, E., Jakob, P., & Friedl, P. (2007). Combined loss of Hey1 and HeyL
causes congenital heart defects because of impaired epithelial to mesenchymal transition. Circ Res , 100, 856-
863.
Forssmann, W., Nokihara, K., Gagelmann, M., Hock, D., Feller, S., Schulz-Knappe, P., et al. (1989). The heart
is the center of a new endocrine, paracrine, and neuroendocrine system. Arch. Histol. Cytol. , 52, 293-315.
Francis, G., & McDonald, K. (1992). Left ventricular hypertrophy: An initial response to myocardial injury.
The American Journal of Cardiology , 69 (18), 3-9.
Fu, C., Yan, F., Wu, F., Wu, Q., Whittaker, J., Hu, H., et al. (2007). Mitotic phosphorylation of PRC1 at
Thr470 is required for PRC1 oligomerization and proper central spindle organization. Cell Res , 17, 449-457.
Fuster, V., & King, S. B. (2008). Hurst's The Heart (12th ed. ed.). New York: McGraw-Hill Medical.
Gavet, O., & Pines, J. (2010). Progressive activation of CyclinB1-Cdk1 coordinates entry to mitosis. Dev Cell ,
18, 533-543.
Gessler, M., Knobeloch, K., Helisch, A., Amann, K., Schumacher, N., & Rohde, E. (2002). Mouse gridlock: no
aortic coarctation of deficiency, but fatal cardiac defects in Hey2-/- mice. Curr Biol , 12, 1601-1604.
Glotzer, M. (2005). The molecular requirements for cytokinesis. Science , 307, 1735-1739.
Gonzalez, S., Pisano, D., & Serrano, M. (2008). Mechanistic principles of chromating remodeling guided by
siRNAs and miRNAs. Cell Cycle , 7 (16), 2601-8.
Goto, G., Mishra, A., Abdulle, R., Slaughter, C., & Kitagawa, K. (2011). Bub1-mediated adaption of the
spindle checkpoint. PLoS Genet , 7, e1001282.
Gould, K., Taffet, G., Michael, L., Christie, R., Konkol, D., Pocius, J., et al. (2001). Heart failure and greater
infarct expansion in middle-aged mice: a relevant model for postinfarction failure. Am J Physiol Heart Circ
Physiol , 282, H615-21.
Grego-Bessa, J., Luna-Zurita, L., Del, M., Bolos, V., Melgar, P., & Arandilla, A. (2007). Notch signaling is
essential for ventricular chamber development. Dev Cell , 12, 415-429.
Griffiths-Jones, S., Saini, H., van Dongen, S., & Enright, A. (2008). miRBase: tools for microRNA genomics.
NAR , 36, D154-D158.
Grigoryan, T., Wend, P., Klaus, A., & Birchmeier, W. (2008). Deciphering the function of canonical Wnt
signals in development and disease: conditional loss- and gain-of-function mutations of beta-catenin in mice.
Genes Dev. , 2304-41.
Gu, J., Anand, V., Shek, E., Moore, M., Brady, A., Kelly, W., et al. (1998). Sodium induces hypertrophy of
cultured myocardial myoblasts and vascular smooth muscle cells. Hypertension , 31, 1083-1087.
Hopkins, S. J., McCutcheon, E., & Wekstein, D. (1973). Postnatal changes in rat ventricular function. Circ
Res, 32, 685-691.
124
Huang, J., Lu, M., cheng, Y. L.-J., Zhu, X., Stout, A., Chen, M., et al. (2009). Myocardin is required for
cardiomyocyte survival and maintenance of heart function. PNAS , 106, 18734-18739.
Hunter, T., & Pines, J. (1991). Cyclins and Cancer. Cell , 66, 1071-1074.
Hunter, T., & Pines, J. (1994). Cyclins and Cancer II Cyclin D and cdk inhibitors come of age. Cell , 79, 573-
582.
Jain, E., Bairoch, A., Duvaud, S., Phan, I., Redaschi, N., Suzek, B., et al. (2009). Infrastructure for the life
sciences: design and implementation of the UniProt website. BMC Bioinformatics , 10, 136-155.
Jiang, W., Jimenez, G., Wells, N., Hope, T., Wahl, G., Hunter, T., et al. (1998). PRC1: A human mitotic
spindle-associated CDK substrate protein required for cytokinesis. Molecular Cell , 2, 877-895.
Jiang, Z., Zacksenhaus, E., Gallie, B., & Phillips, R. (1997). The retinoblastoma gene family is differentially
expressed during embryogenesis. Oncogene , 14, 1789-1797.
Jones, W., Chao, A., Zavortink, M., Saint, R., & Bejsovec, A. (2010). Cytokinesis proteins Tum and Pav have
a nuclear role in Wnt regulation. J Cell Sci , 123, 2179-2189.
Juang, Y., Huang, J., Peters, J., McLaughlin, M., Tai, C., & Pellman, D. (1997). APC-mediated proteolysis of
Ase1 and the morphogenesis of the mitotic spindle. Science , 275, 1311-1314.
Kahaly, G., & Dillmann, W. (2005). Thyroid hormone action in the heart. Endocr Rev , 226, 704-728.
Kajstura, J., Pertoldi, B., Leri, A., Beltrami, C., Deptala, A., Darzynkiewicz, Z., et al. (2000). Telomere
shortening is an in vivo marker of myocyte replication and aging. Am J Pathol , 156, 813-819.
Kanamori, M., Konno, H., Osato, N., Kawai, J., Havashizaki, Y., & Suzuki, H. (2004). A genome-wide and
nonredundant mouse transcription factor database. Biochem Biophys Res Commun , 322, 787-793.
Kang, M. J., & Koh, G. Y. (1997). Differential and Dramatic Changes of Cyclin-Dependent Kinase Activities
in Cardiomyocytes During the Neonatal Period. J Mol Cell Cardiol , 1767-1777.
Kang, M., Kim, J., Chae, S., Koh, K., & Koh, G. (1997). Cyclins and cyclin dependent kinases during cardiac
development. Mol Cells , 7, 360-366.
Kikuchi, T., Daigo, Y., Katagiri, T., Tsunoda, T., Okada, K., Kakiuchi, S., et al. (2003). Expression profiles of
non-small cell lung cancers on cDNA microarrays: identification of genes for prediction of lymph-node
metastasis and sensitivity to anti-cancer drugs. Oncogene , 22, 2192-2205.
Kim, K., Soopaa, M., Daud, A., Koh, G., JS, K., & Field, L. (1994). Tumor suppressor gene expression during
normal and pathologic myocardial growth. J Biol Chem , 269, 22607-22613.
Kioussi, C., Briata, P., Baek, S., Rose, D., Hamblet, N., Herman, T., et al. (2002). Identification of a
Wnt/Dv1/beta-Catenin-Pitx2 pathway mediating cell-type-specific proliferation during development. Cell ,
111, 673-685.
Klaus, A., Saga, Y., Taketo, M., Tzahor, E., & Birchmeier, W. (2007). Distinct roles of Wnt/beta-catenin and
Bmp signlaing during early cardiogenesis. PNAS , 104, 18531-18536.
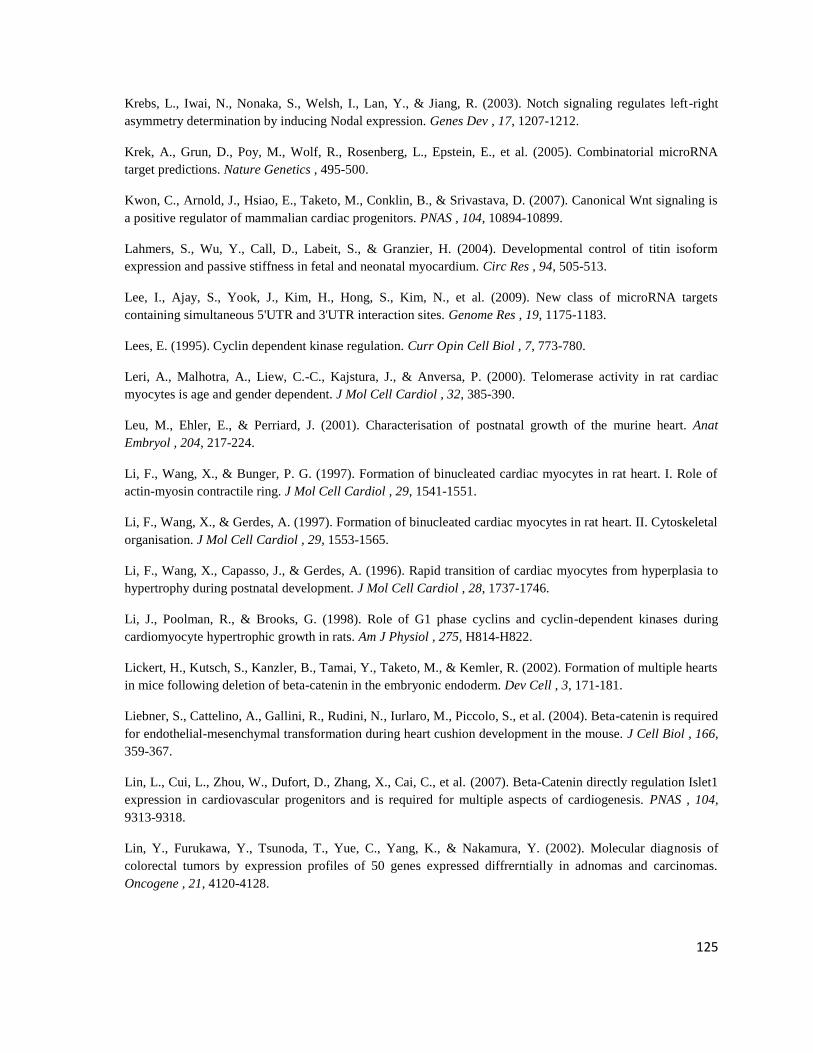
125
Krebs, L., Iwai, N., Nonaka, S., Welsh, I., Lan, Y., & Jiang, R. (2003). Notch signaling regulates left-right
asymmetry determination by inducing Nodal expression. Genes Dev , 17, 1207-1212.
Krek, A., Grun, D., Poy, M., Wolf, R., Rosenberg, L., Epstein, E., et al. (2005). Combinatorial microRNA
target predictions. Nature Genetics , 495-500.
Kwon, C., Arnold, J., Hsiao, E., Taketo, M., Conklin, B., & Srivastava, D. (2007). Canonical Wnt signaling is
a positive regulator of mammalian cardiac progenitors. PNAS , 104, 10894-10899.
Lahmers, S., Wu, Y., Call, D., Labeit, S., & Granzier, H. (2004). Developmental control of titin isoform
expression and passive stiffness in fetal and neonatal myocardium. Circ Res , 94, 505-513.
Lee, I., Ajay, S., Yook, J., Kim, H., Hong, S., Kim, N., et al. (2009). New class of microRNA targets
containing simultaneous 5'UTR and 3'UTR interaction sites. Genome Res , 19, 1175-1183.
Lees, E. (1995). Cyclin dependent kinase regulation. Curr Opin Cell Biol , 7, 773-780.
Leri, A., Malhotra, A., Liew, C.-C., Kajstura, J., & Anversa, P. (2000). Telomerase activity in rat cardiac
myocytes is age and gender dependent. J Mol Cell Cardiol , 32, 385-390.
Leu, M., Ehler, E., & Perriard, J. (2001). Characterisation of postnatal growth of the murine heart. Anat
Embryol , 204, 217-224.
Li, F., Wang, X., & Bunger, P. G. (1997). Formation of binucleated cardiac myocytes in rat heart. I. Role of
actin-myosin contractile ring. J Mol Cell Cardiol , 29, 1541-1551.
Li, F., Wang, X., & Gerdes, A. (1997). Formation of binucleated cardiac myocytes in rat heart. II. Cytoskeletal
organisation. J Mol Cell Cardiol , 29, 1553-1565.
Li, F., Wang, X., Capasso, J., & Gerdes, A. (1996). Rapid transition of cardiac myocytes from hyperplasia to
hypertrophy during postnatal development. J Mol Cell Cardiol , 28, 1737-1746.
Li, J., Poolman, R., & Brooks, G. (1998). Role of G1 phase cyclins and cyclin-dependent kinases during
cardiomyocyte hypertrophic growth in rats. Am J Physiol , 275, H814-H822.
Lickert, H., Kutsch, S., Kanzler, B., Tamai, Y., Taketo, M., & Kemler, R. (2002). Formation of multiple hearts
in mice following deletion of beta-catenin in the embryonic endoderm. Dev Cell , 3, 171-181.
Liebner, S., Cattelino, A., Gallini, R., Rudini, N., Iurlaro, M., Piccolo, S., et al. (2004). Beta-catenin is required
for endothelial-mesenchymal transformation during heart cushion development in the mouse. J Cell Biol , 166,
359-367.
Lin, L., Cui, L., Zhou, W., Dufort, D., Zhang, X., Cai, C., et al. (2007). Beta-Catenin directly regulation Islet1
expression in cardiovascular progenitors and is required for multiple aspects of cardiogenesis. PNAS , 104,
9313-9318.
Lin, Y., Furukawa, Y., Tsunoda, T., Yue, C., Yang, K., & Nakamura, Y. (2002). Molecular diagnosis of
colorectal tumors by expression profiles of 50 genes expressed diffrerntially in adnomas and carcinomas.
Oncogene , 21, 4120-4128.
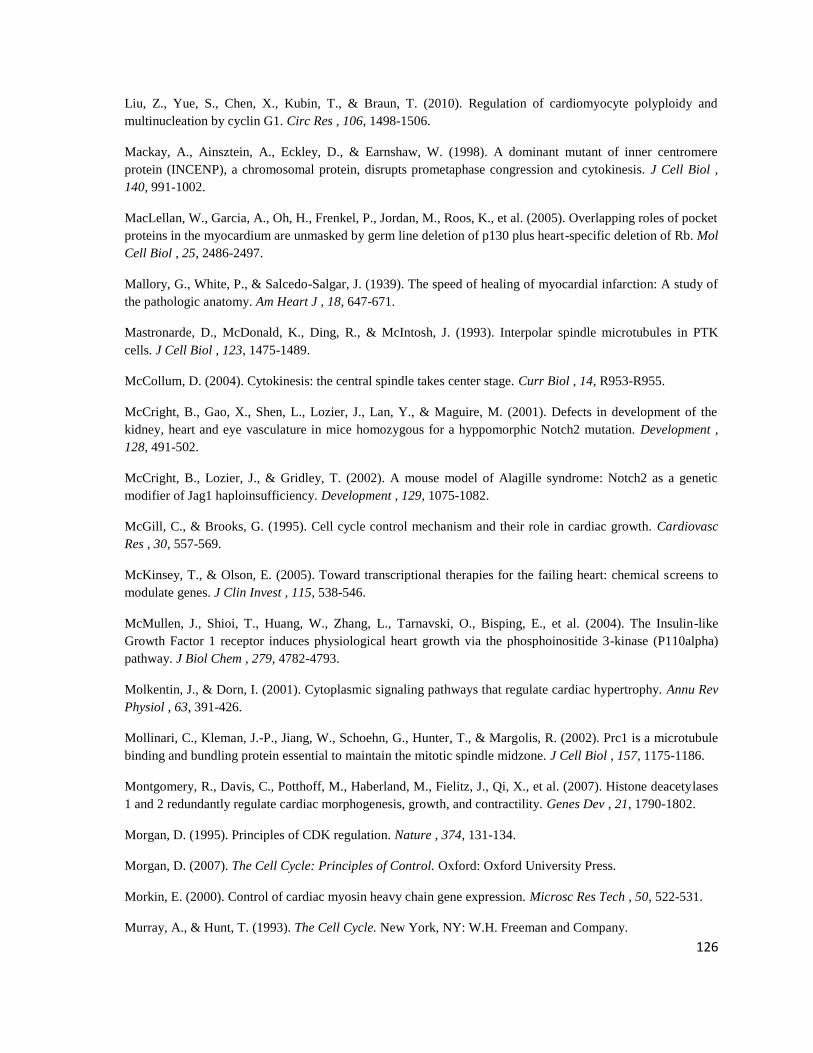
126
Liu, Z., Yue, S., Chen, X., Kubin, T., & Braun, T. (2010). Regulation of cardiomyocyte polyploidy and
multinucleation by cyclin G1. Circ Res , 106, 1498-1506.
Mackay, A., Ainsztein, A., Eckley, D., & Earnshaw, W. (1998). A dominant mutant of inner centromere
protein (INCENP), a chromosomal protein, disrupts prometaphase congression and cytokinesis. J Cell Biol ,
140, 991-1002.
MacLellan, W., Garcia, A., Oh, H., Frenkel, P., Jordan, M., Roos, K., et al. (2005). Overlapping roles of pocket
proteins in the myocardium are unmasked by germ line deletion of p130 plus heart-specific deletion of Rb. Mol
Cell Biol , 25, 2486-2497.
Mallory, G., White, P., & Salcedo-Salgar, J. (1939). The speed of healing of myocardial infarction: A study of
the pathologic anatomy. Am Heart J , 18, 647-671.
Mastronarde, D., McDonald, K., Ding, R., & McIntosh, J. (1993). Interpolar spindle microtubules in PTK
cells. J Cell Biol , 123, 1475-1489.
McCollum, D. (2004). Cytokinesis: the central spindle takes center stage. Curr Biol , 14, R953-R955.
McCright, B., Gao, X., Shen, L., Lozier, J., Lan, Y., & Maguire, M. (2001). Defects in development of the
kidney, heart and eye vasculature in mice homozygous for a hyppomorphic Notch2 mutation. Development ,
128, 491-502.
McCright, B., Lozier, J., & Gridley, T. (2002). A mouse model of Alagille syndrome: Notch2 as a genetic
modifier of Jag1 haploinsufficiency. Development , 129, 1075-1082.
McGill, C., & Brooks, G. (1995). Cell cycle control mechanism and their role in cardiac growth. Cardiovasc
Res , 30, 557-569.
McKinsey, T., & Olson, E. (2005). Toward transcriptional therapies for the failing heart: chemical screens to
modulate genes. J Clin Invest , 115, 538-546.
McMullen, J., Shioi, T., Huang, W., Zhang, L., Tarnavski, O., Bisping, E., et al. (2004). The Insulin-like
Growth Factor 1 receptor induces physiological heart growth via the phosphoinositide 3-kinase (P110alpha)
pathway. J Biol Chem , 279, 4782-4793.
Molkentin, J., & Dorn, I. (2001). Cytoplasmic signaling pathways that regulate cardiac hypertrophy. Annu Rev
Physiol , 63, 391-426.
Mollinari, C., Kleman, J.-P., Jiang, W., Schoehn, G., Hunter, T., & Margolis, R. (2002). Prc1 is a microtubule
binding and bundling protein essential to maintain the mitotic spindle midzone. J Cell Biol , 157, 1175-1186.
Montgomery, R., Davis, C., Potthoff, M., Haberland, M., Fielitz, J., Qi, X., et al. (2007). Histone deacetylases
1 and 2 redundantly regulate cardiac morphogenesis, growth, and contractility. Genes Dev , 21, 1790-1802.
Morgan, D. (1995). Principles of CDK regulation. Nature , 374, 131-134.
Morgan, D. (2007). The Cell Cycle: Principles of Control. Oxford: Oxford University Press.
Morkin, E. (2000). Control of cardiac myosin heavy chain gene expression. Microsc Res Tech , 50, 522-531.
Murray, A., & Hunt, T. (1993). The Cell Cycle. New York, NY: W.H. Freeman and Company.
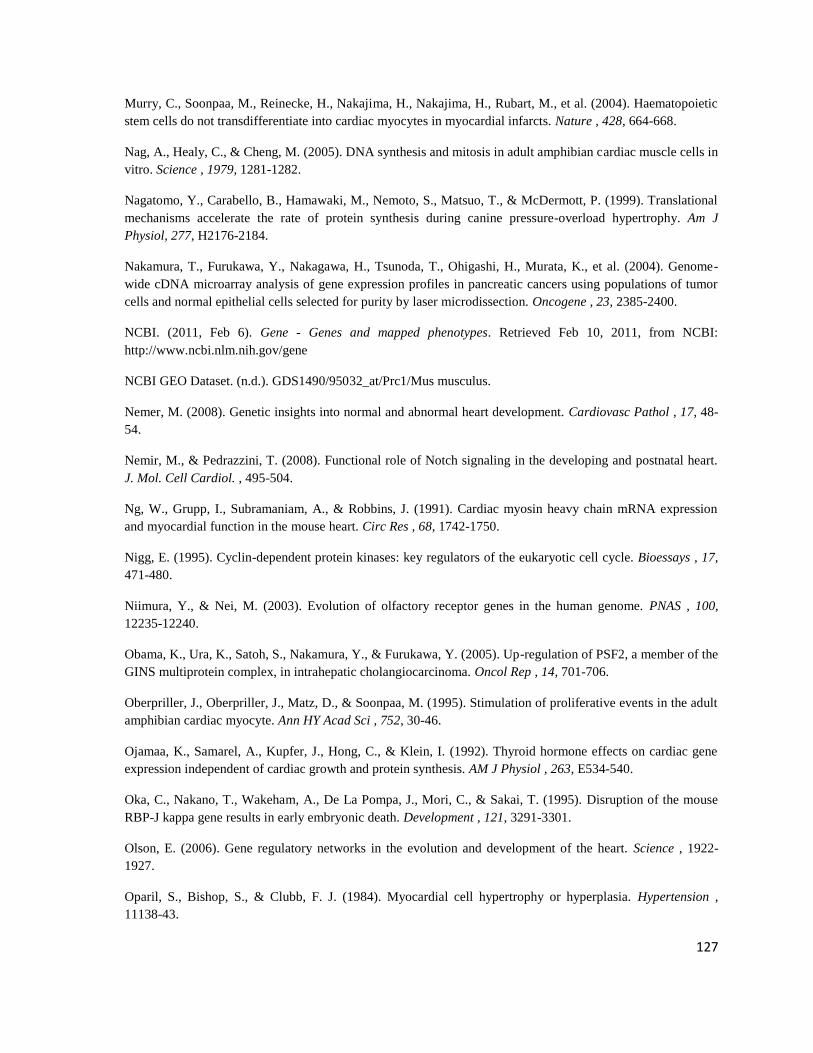
127
Murry, C., Soonpaa, M., Reinecke, H., Nakajima, H., Nakajima, H., Rubart, M., et al. (2004). Haematopoietic
stem cells do not transdifferentiate into cardiac myocytes in myocardial infarcts. Nature , 428, 664-668.
Nag, A., Healy, C., & Cheng, M. (2005). DNA synthesis and mitosis in adult amphibian cardiac muscle cells in
vitro. Science , 1979, 1281-1282.
Nagatomo, Y., Carabello, B., Hamawaki, M., Nemoto, S., Matsuo, T., & McDermott, P. (1999). Translational
mechanisms accelerate the rate of protein synthesis during canine pressure-overload hypertrophy. Am J
Physiol, 277, H2176-2184.
Nakamura, T., Furukawa, Y., Nakagawa, H., Tsunoda, T., Ohigashi, H., Murata, K., et al. (2004). Genome-
wide cDNA microarray analysis of gene expression profiles in pancreatic cancers using populations of tumor
cells and normal epithelial cells selected for purity by laser microdissection. Oncogene , 23, 2385-2400.
NCBI. (2011, Feb 6). Gene - Genes and mapped phenotypes. Retrieved Feb 10, 2011, from NCBI:
http://www.ncbi.nlm.nih.gov/gene
NCBI GEO Dataset. (n.d.). GDS1490/95032_at/Prc1/Mus musculus.
Nemer, M. (2008). Genetic insights into normal and abnormal heart development. Cardiovasc Pathol , 17, 48-
54.
Nemir, M., & Pedrazzini, T. (2008). Functional role of Notch signaling in the developing and postnatal heart.
J. Mol. Cell Cardiol. , 495-504.
Ng, W., Grupp, I., Subramaniam, A., & Robbins, J. (1991). Cardiac myosin heavy chain mRNA expression
and myocardial function in the mouse heart. Circ Res , 68, 1742-1750.
Nigg, E. (1995). Cyclin-dependent protein kinases: key regulators of the eukaryotic cell cycle. Bioessays , 17,
471-480.
Niimura, Y., & Nei, M. (2003). Evolution of olfactory receptor genes in the human genome. PNAS , 100,
12235-12240.
Obama, K., Ura, K., Satoh, S., Nakamura, Y., & Furukawa, Y. (2005). Up-regulation of PSF2, a member of the
GINS multiprotein complex, in intrahepatic cholangiocarcinoma. Oncol Rep , 14, 701-706.
Oberpriller, J., Oberpriller, J., Matz, D., & Soonpaa, M. (1995). Stimulation of proliferative events in the adult
amphibian cardiac myocyte. Ann HY Acad Sci , 752, 30-46.
Ojamaa, K., Samarel, A., Kupfer, J., Hong, C., & Klein, I. (1992). Thyroid hormone effects on cardiac gene
expression independent of cardiac growth and protein synthesis. AM J Physiol , 263, E534-540.
Oka, C., Nakano, T., Wakeham, A., De La Pompa, J., Mori, C., & Sakai, T. (1995). Disruption of the mouse
RBP-J kappa gene results in early embryonic death. Development , 121, 3291-3301.
Olson, E. (2006). Gene regulatory networks in the evolution and development of the heart. Science , 1922-
1927.
Oparil, S., Bishop, S., & Clubb, F. J. (1984). Myocardial cell hypertrophy or hyperplasia. Hypertension ,
11138-43.
128
Orlic, D., Kajstura, J., Chimenti, S., Jakoniuk, I., Anderson, S., Li, B., et al. (2001). Bone marrow cells
regenerate infarcted myocardium. Nature , 410, 701-705.
Orlic, D., Kajstura, J., Chimenti, S., Limana, F., Jakoniuk, I., Quaini, F., et al. (2001). Mobilized bone marrow
cells repair the infacrted heart, improving function and survival. PNAS , 98, 10344-10349.
Pasumarthi, K., & Field, L. (2002). Cardiomyocyte cell cycle regulation. Circ. Res. , 1044-54.
Pellman, D., Bagget, M., Tu, Y., & Fink, G. (1995). Two microtubule-associated proteins required for
anaphase spindle movement in Saccharomyces cerevisiae. J Cell Biol , 130, 1373-1385.
Poolman, R., & Brooks, G. (1996). Expression of the cip/kip family of cyclin-dependent kinase inhibitors
during cardiac development. Circulation , 94, Suppl. 1-157.
Poolman, R., & Brooks, G. (1998). Expressions and activities of cell cycle regulatory molecules during the
transition from myocyte hyperplasia to hypertrophy. J Mol Cell Cardiol , 30, 2121-2135.
Porrello, E., Mahmoud, A., Simpson, E., Hill, J., Richardson, J., Olson, E., et al. (2011). Transient regenerative
potential of the neonatal mouse heart. Science , 331, 1078-1080.
Poznic, M. (2009). Retinoblastoma protein: a central processing unit. J Biosci , 34, 305-312.
Qu, J., Zhou, J., Yi, X., Dong, B., Zheng, H., Miller, L., et al. (2007). Cardiac-specific haploinsufficiency of
beta-catenin attenuates cardiac hypertrophy but enhances fetal gene expression response to aortic constriction.
J Mol Cell Cardiol , 43, 319-326.
Qyang, Y., Martin-Puig, S., Chiravuri, M., Chen, S., Xu, H., Bu, L., et al. (2007). The renewal and
differentiation of Isl1+ cardiovascular progenitors are controlled by a Wnt/beta-catenin pathway. Cell Stem
Cell , 1, 165-179.
Rhoades, M., Reinhart, B., Lim, L., Burge, C., Bartel, B., & Bartel, D. (2002). Prediction of plant microRNA
targets. Cell , 110, 513-520.
Riken Transcription Factor Database (TFdb). (2004). (The Institute of Physical and Chemical Research)
Retrieved 01 2010, from Riken Transcription Factor Database (TFdb): http://genome.gsc.riken.jp/TFdb/
Ruchaud, S., Carmena, M., & Earnshaw, W. (2007). Chromosomal passengers: conducting cell division. Nat
Rev Mol Cell Biol , 8, 798-812.
Schwartz, K., Boheler, K., de la Bastie, D., Lompre, A., & Mercadier, J. (1992). Switches in cardiac muscle
gene expression as a result of pressure and volume overload. Am J Physiol , 262, R364-R369.
Sehl, P., Tai, J., Hillan, K., Brown, L., Goddard, A., Yang, R., et al. (2000). Application of cDNA microarrays
in determining molecular phenotype in cardiac growth, development, and response to injury. Circulation , 101,
1990-1999.
Shahi, P., Loukianiouk, S., Bohne-Lang, A., Kenzelmann, M., Kuffer, S., Maertens, S., et al. (2006).
Argonaute - a database for gene regulation by mammalian microRNAs. Nucleic Acids Res (34), D115-8.
Sherr, C. (1994). G1 phase progression: cycling on cue. Cell , 79, 551-555.
Sherr, C. (1993). Mammalian G1 cyclins. Cell , 73, 1059-1065.
129
Shimo, A., Nishidate, T., Ohta, T., Fukuda, M., Nakamura, Y., & Katagiri, T. (2007). Elevated expression of
protein regulator of cytokinesis 1, involved in the growth of breast cancer cells. Cancer Sci , 98, 174-181.
Simpson, L., Kumar, S., Okuno, S., Schaff, H., Porrata, L., Buckner, J., et al. (2008). Malignant primary
cardiac tumors: review of a single institution experience. Cancer , 112, 2440-2446.
Skoufias, D., Mollinari, C., Lacroix, F., & Margolis, R. (2000). Human survivin is a kinetochore-associated
passenger protein. J Cell Biol , 151, 1575-1582.
Song, L. a. (2006). MicroRNAs and Cell Differentiation in Mammalian Development. Birth Defects Research ,
78, 140-149.
Soonpaa, M. H., Kyung Keun, K., Pajak, L., Franklin, M., & Field, L. (1996). Cardiomyocyte DNA synthesis
and binucleation during murine development. The American Journal of Physiology , H2183-2189.
Soonpaa, M., Koh, G., Pajak, L., Jing, S., Wang, H., Franklin, M., et al. (1997). Cyclin D1 overexpression
promotes cardiomyocyte DNA synthesis and multinucleation in transgenic mice. J Clin Invest , 99, 2644-2654.
Srivastava, D., & Cordes, K. (2009). MicroRNA Regulation of Cardiovascular Development. Circulation
Research , 104, 724-732.
Subramanian, A., Tamayo, P., Mootha, V., Mukherjee, S., Ebert, B., Gillette, M., et al. (2005). Gene set
enrichment analysis: a knowledge-based approach for interpreting genome-wide expression profiles. PNAS ,
102, 15545-15550.
Swiatek, P., Lindsell, C., del Amo, F., Weinmaster, G., & Gridley, T. (1994). Notch1 is essential for
postimplantation development in mice. Genes Dev , 8, 707-719.
Taegtmeyer, H., Sen, S., & Vela, D. (2010). Return to the fetal gene program: A suggested metabolic link to
gene expression in the heart. Ann NY Acad Sci , 1188, 191-198.
Takada, M., Morii, N., Kumagai, S., & Ryo, R. (1996). The involvement of the rho gene product, a small
molecular weight GTP-binding protein, in polyploidization of a human megakaryocytic cell line, CMK. Exp
Hematol , 24, 524-530.
Tam, S., Gu, W., Mahdavi, V., & Nadal-Ginard, B. (1995). Cardiac Myocyte Terminal Differentiation:
Potential for Cardiac Regeneration. Annals New York Academy of Science , 72-79.
Tarabykin, V., Britanova, O., Fradkov, A., Voss, A., Katz, L., Lukyanov, S., et al. (2000). Expression of PTTG
and PRC1 genes during telencephalic neurogenesis. Mech Dev , 92, 301-304.
TargetScanMouse, 5.1: April 2009. (2006-2009). (Whitehead Institute for Biomedical Research) Retrieved
2010, from TargetScanMouse Prediction of microRNA targets: http://www.targetscan.org/mmu_50/
Tay Y, Z. J. (2008). MicroRNAs to Nanog, Oct4 and Sox2 coding regions modulate embryonic stem cell
differentiation. Nature , 455 (7216), 1124-8.
Terada, Y., Tatsuka, F., Suzuki, F., Yasuda, Y., Fujita, S., & Otsu, M. (1998). AIM-1: a mammalian mid-body-
associated protein required for cytokinesis. EMBO , 17, 667-676.
130
TheUniProtConsortium. (2010). The Universal Protein Resource (UniProt) in 2010. Nucleic Acids Res , 38,
D142-D148.
Thum, T., Catalucci, D., & Bauersachs, J. (2008). MicroRNAs: novel regulators in cardiac development and
disease. Cardiovascular Research , 79, 562-570.
Thum, T., Galuppo, P., Wolf, C., Fiedler, J., Kneitz, S., van Laake, L., et al. (2007). MicroRNAs in the human
heart - A clue to fetal gene reprogramming in heart failure. Circulation , 116, 258-267.
Timmerman, L., Grego-Bessa, J., Raya, A., Bertran, E., Perez-Pomares, J., & Diez, J. (2004). Notch promotes
epithelial-mesenchymal transition during cardiac development and oncogenic transformation. Genes Dev , 18,
99-115.
Topper, J. (2000). TGF-beta in the cardiovascular system: molecular mechanisms of a context-specifc growth
factor. Trends Cardiovasc Med , 10, 132-137.
Uehara, R., & Goshima, G. (2010). Functional central spindle assembly requires de novo microtubule
generation in the interchromosomal region during anaphase. J Cell Biol , 191, 259-267.
Uren, A., Wong, L., Pakusch, M., Fowler, K., Burrows, F. V., & Choo, K. (2000). Survivin and the inner
centromere protein INCENP show similar cell-cycle localization and gene knockout phenotype. Curr Biol , 10,
1319-1328.
van Rooij, E., Marshall, W., & Olson, E. (2008). Toward microRNA-Based Therapeutics for Heart Disease:
The Sense in Antisense. Circ Res , 103, 919-928.
Van Rooij, E., Sutherland, L., Liu, N., Williams, A., Mcanally, J., Gerard, R., et al. (2006). A signature pattern
of stress-responsive microRNAs that can evoke cardiac hypertrophy and heart failure. Proc Natl Acad Sci USA,
103 (48), 18255-18260.
van Rooij, E., Sutherland, L., Thatcher, J., DiMaio, J., Naseem, R., Marshall, W., et al. (2008). Dysregulation
of microRNAs after myocardial infarction reveals a role of miR-29 in cardiac fibrosis. PNAS , 105 (35),
13027-13032.
Warde-Farley, D., Donaldson, S., Comes, O., Zuberi, K., Badrawi, R., Chao, P., et al. (2010). The
GeneMANIA prediction server: biological network integration for gene prioritization and predicting gene
function. Nucleic Acids Res , 38, W214-W220.
Watanabe, Y., Kokubo, H., Miyagawa-Tomita, S., Endo, M., Igarashi, K., & Aisaki, K. (2006). Activation of
Notch1 signaling in cardiogenic mesoderm induces abnormal heart morphogenesis in mouse. Development ,
133, 1625-1634.
Wellcome Trust Genome. (2007, 09 19). miRBase Targets. Retrieved 02 18, 2009, from Wellcome Trust
Sanger Institute: http://microrna.sanger.ac.uk/cgi-bin/targets/v5/search.pl
Winick, M., & Noble, A. (1965). Quantitative changes in DNA, RNA, and protein during prenatal and
postnatal growth in the rat. Dev Biol , 12, 451-466.
Wu, Y., & Wu, E. (2009). MR study of postnatal development of myocardial structure and left ventricular
function. J Mag Res Imag , 30, 47-53.
131
Xiang, F., Sakata, Y., Cui, L., Youngblood, J., Nakagami, H., & Liao, J. (2006). Transcription factor
CHF1/Hey2 suppresses cardiac hypertrophy through an inhibitory interaction with GATA4. Am J Physiol
Heart Circ Physiol , 290, H1997-H2006.
Xin, M., Small, E., van, R., Qi, X., Richardson, J., & Srivastava, D. (2007). Essential roles of the bHLH
transcription factor Hrt2 in repression of atrial gene expression and maintenance of postnatal cardiac function.
PNAS , 104, 7975-7980.
Xue, Y., Gao, X., Lindsell, C., Norton, C., Chang, B., & Hicks, C. (1999). Embryonic lethality and vascular
defects in mice lacking the Notch ligand Jagged1. Hum Mol Genet , 8, 723-730.
Yen, T., Li, G., Schaar, B., Szilak, I., & Cleveland, D. (1992). CENP-E is a putative kinetochore motor that
accumulates just before mitosis. Nature , 359, 536-539.
Yoshizumi, M., Lee, W.-S., Hsieh, C.-M., Tsai, J.-C., Li, J., Perella, M., et al. (1995). Disappearance of cyclin
A correlates with percentage withdrawal of cardiomyocytes from the cell cycle in human and rat hearts. J Clin
Invest , 95, 2275-2280.
Zak, R. (1974). Development and proliferative capacity of cardiac muscle cells. Cir Res , Suppl. 2, 17-26.
Zamora, M., Manner, J., & Ruiz-Lozano, P. (2007). Epicardium-derived progenitor cells require beta-catenin
for coronary artery formation. PNAS , 104, 18109-18114.
Zhou, J., Qu, J., Yi, X., Graber, K., Huber, L., Wang, X., et al. (2007). Upregulation of gamma-catenin
compensates for the loss of beta-catenin in adult cardiomyocytes. Am J Physiol Heart Circ Physiol , 292,
H270-H276.
Zhu, C., & Jiang, W. (2005). Cell cycle-dependent tarnslocation of PRC1 on the spindle by KIF4 is essential
for midzone formation and cytokinesis. Proc Natl Acad Sci USA , 162, 343-348.
Zorio, E., Medina, P., Rueda, J., Millan, J., Arnau, M., Beneyto, M., et al. (2009). Insights Into the Role of
microRNAs in Cardiac Diseases: From Biological Signalling to Therapeutic Targets. Cardiovascular &
Hematological Agents in Medicinal Chemistry , 7 (1), 82-90.

132
CONTRIBUTIONS OF COLLABORATORS
Shelley Deeke provided quantified HL-1 protein extracts and HeLa cells. microRNA
profiling and microarray quality controls were performed in triplicate per timepoint by the
Genetic Analysis Facility – The Center for Applied Genomics (TCAG) at The Hospital for
Sick Children.

133
APPENDIX

134
Supplemental Figure 1: microRNA Microarray Quality Controls. Snapshots of controls
analyses as calculated by TCAG.
135
B.
A.
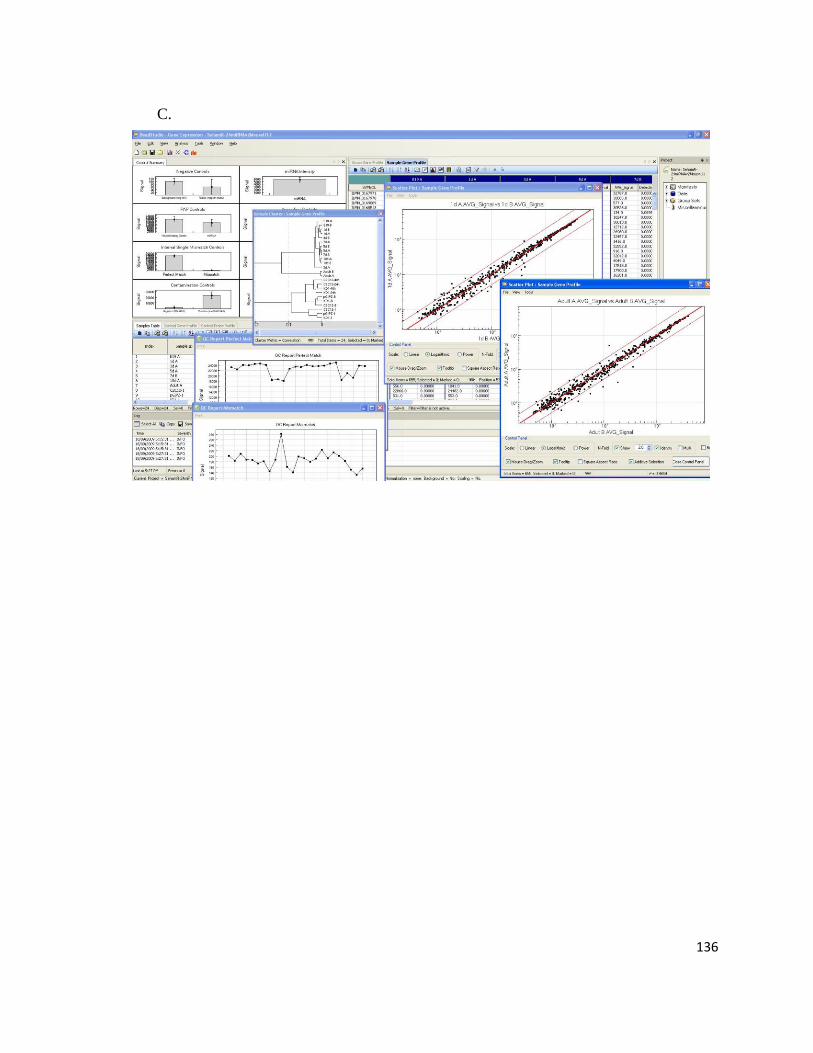
136
C.
137
Supplemental Figure 2: Prc1 GEO Profiles. Microarray expression profiles available
through NCBI Gene Expression Omnibus (GEO). A) Gene expression profile of murine
cardiac ventricle between embryonic day 12.5, neonatal day 1, 1 week, 4 week, 3 months, 5
months and 12 months of age. (NCBI, GEO profiles, record GDS40 / 95032_at / Prc1 / Mus
musculus). B) Mouse strain C57BL/6 embryonic expression profile of the atrial and
ventricular chambers between E10.5 and E18.5. (GDS627 / 1423774_a_at / Prc1 / Mus
musculus). C) Similar analysis to Panel B however with a different microarray platform.
(GDS627 / 1423775_s_at / Prc1 / Mus musculus).
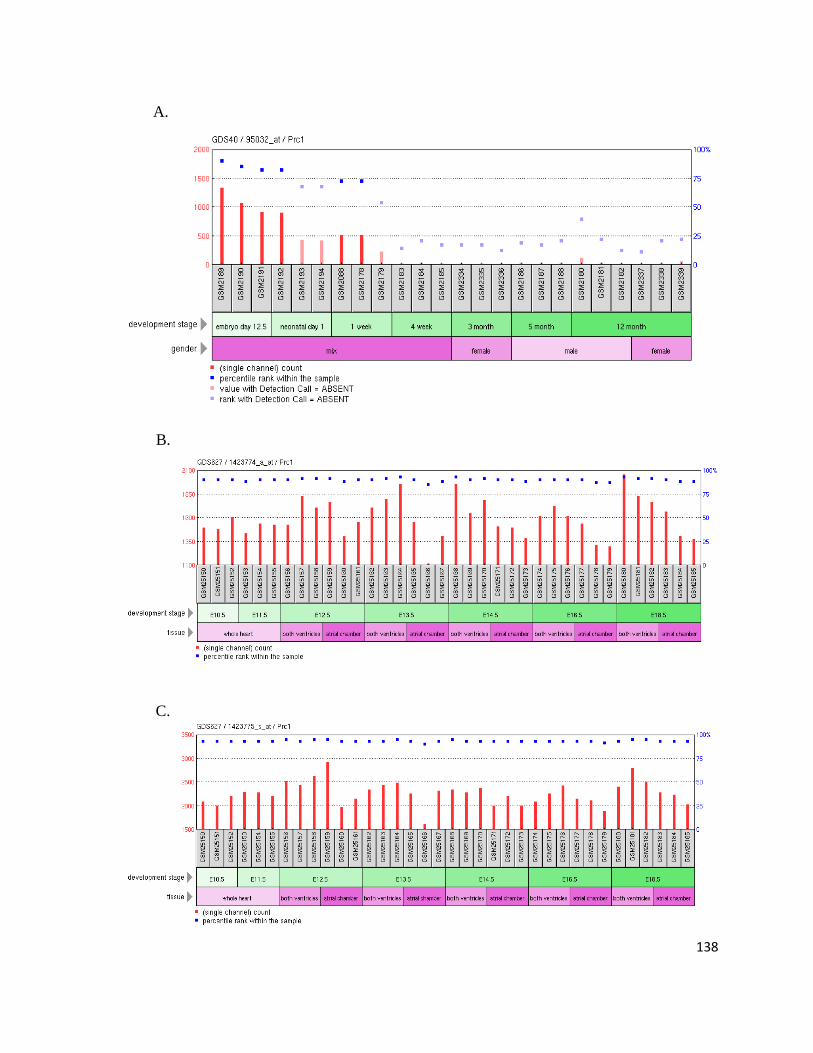
138
A.
B.
C.
139
Supplemental Figure 3: Prc1 Immunofluorescence in HL-1, HeLa, and Primary
Cardiomyocytes. Pre-immune rabbit serum served as a blocking control. The nucleus was
stained with DAPI (blue), Prc1 with an Alexa 488 secondary (green), and the plasma
membrane with wheat germ agglutinin (WGA) (red). A) Immunofluorescence experiments
in HL-1 cells. B) Prc1 localization visualized in HeLa cells by immunofluorescence. Epitope
blocking experiments were successful for Panel A and B. C) Immunofluorescence of
primary mouse cardiomyocytes at 10 days post-birth.
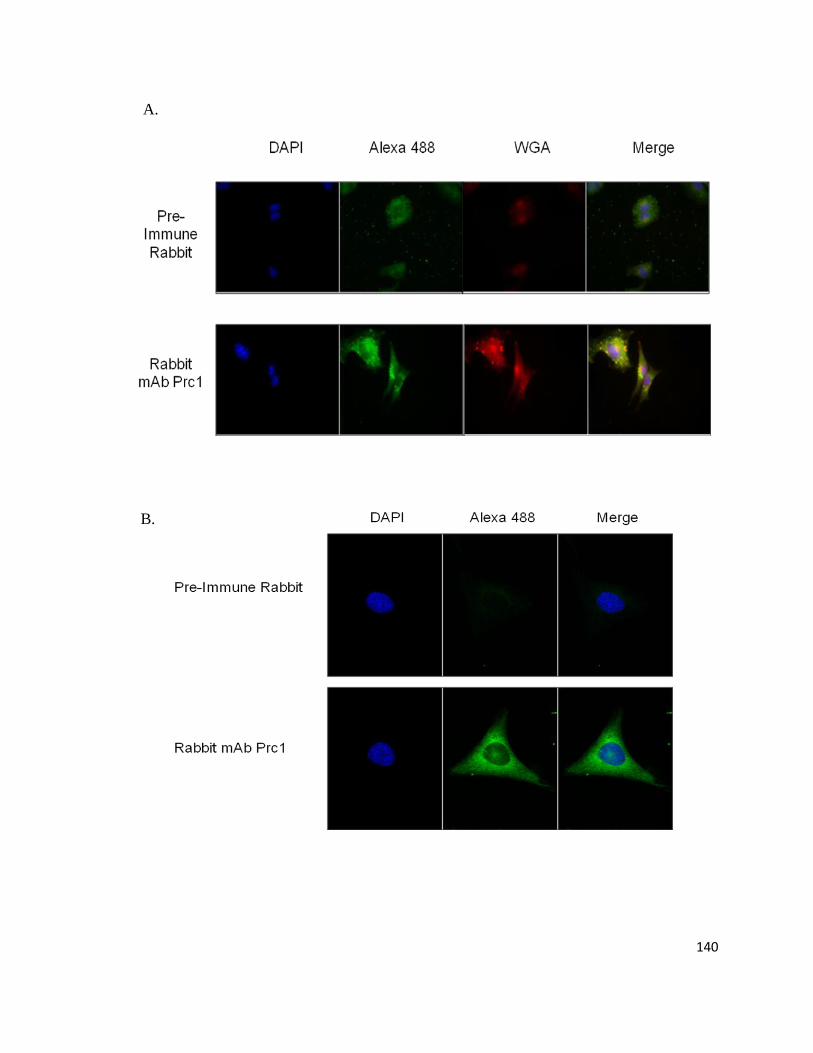
140
A.
B.
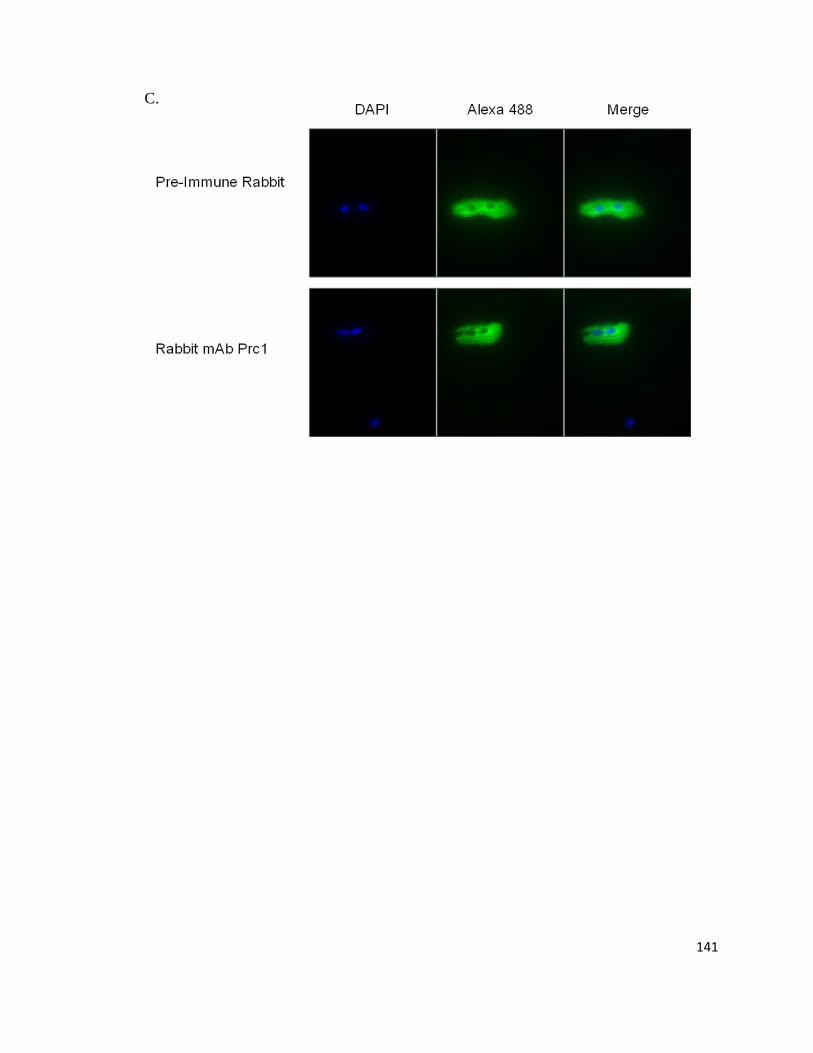
141
C.

142
Supplemental Figure 4: GeneMANIA Prc1 Interaction Network Report. Detailed report
and references of Prc1 interaction network assessed utilizing GeneMANIA.org.
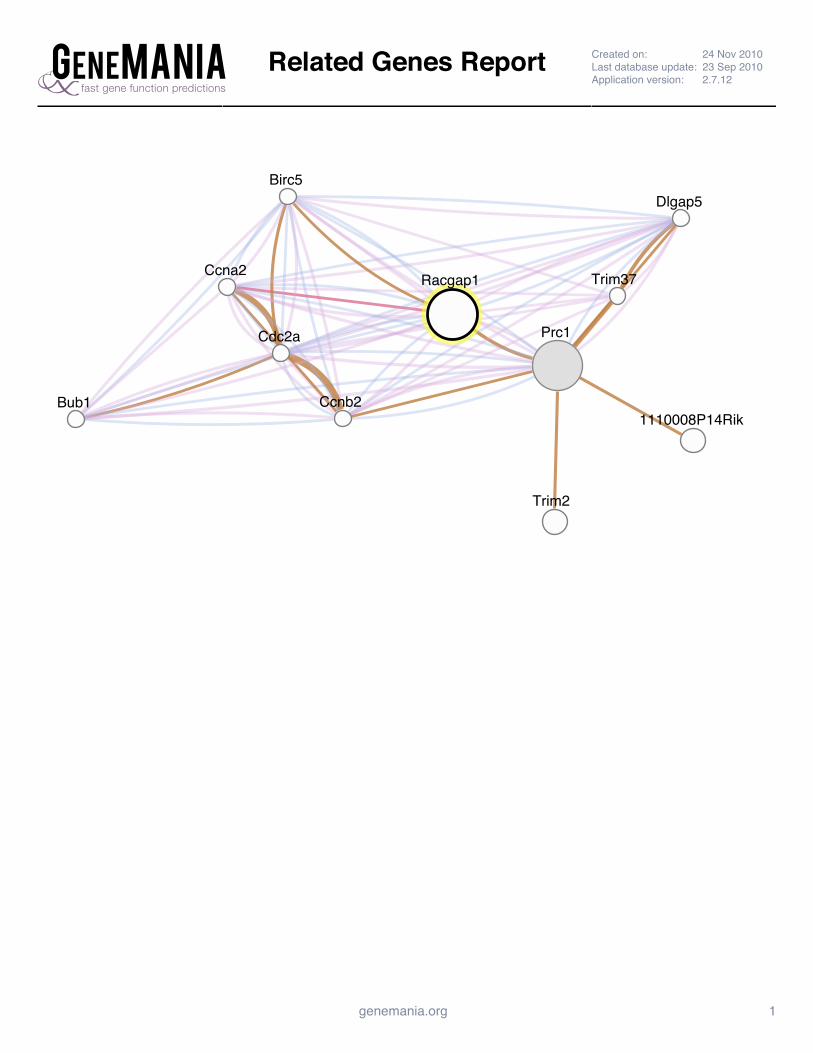
Related Genes Report Created on: 24 Nov 2010Last database update: 23 Sep 2010Application version: 2.7.12
genemania.org 1
Prc1
Racgap1
Trim2
1110008P14Rik
Birc5Dlgap5
Trim37
Cdc2a
Ccnb2
Ccna2
Bub1
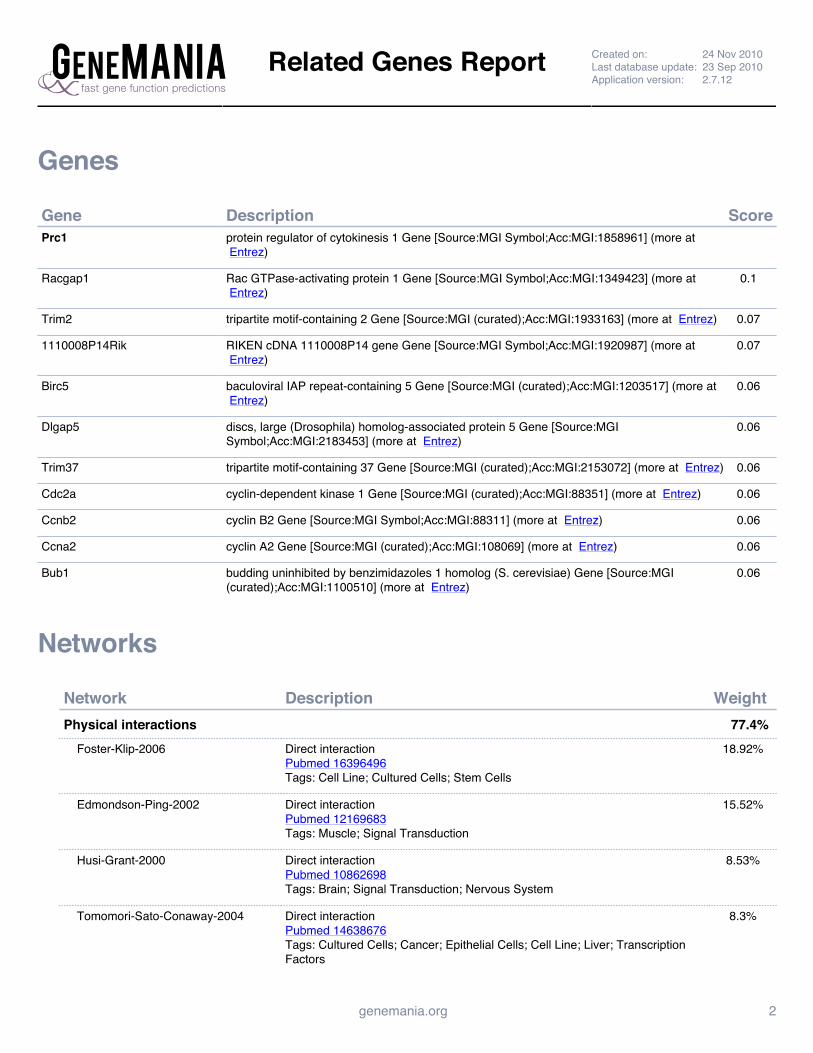
Related Genes Report Created on: 24 Nov 2010Last database update: 23 Sep 2010Application version: 2.7.12
genemania.org 2
Genes
Gene Description ScorePrc1 protein regulator of cytokinesis 1 Gene [Source:MGI Symbol;Acc:MGI:1858961] (more at
Entrez)
Racgap1 Rac GTPase-activating protein 1 Gene [Source:MGI Symbol;Acc:MGI:1349423] (more at Entrez)
0.1
Trim2 tripartite motif-containing 2 Gene [Source:MGI (curated);Acc:MGI:1933163] (more at Entrez) 0.07
1110008P14Rik RIKEN cDNA 1110008P14 gene Gene [Source:MGI Symbol;Acc:MGI:1920987] (more at Entrez)
0.07
Birc5 baculoviral IAP repeat-containing 5 Gene [Source:MGI (curated);Acc:MGI:1203517] (more at Entrez)
0.06
Dlgap5 discs, large (Drosophila) homolog-associated protein 5 Gene [Source:MGISymbol;Acc:MGI:2183453] (more at Entrez)
0.06
Trim37 tripartite motif-containing 37 Gene [Source:MGI (curated);Acc:MGI:2153072] (more at Entrez) 0.06
Cdc2a cyclin-dependent kinase 1 Gene [Source:MGI (curated);Acc:MGI:88351] (more at Entrez) 0.06
Ccnb2 cyclin B2 Gene [Source:MGI Symbol;Acc:MGI:88311] (more at Entrez) 0.06
Ccna2 cyclin A2 Gene [Source:MGI (curated);Acc:MGI:108069] (more at Entrez) 0.06
Bub1 budding uninhibited by benzimidazoles 1 homolog (S. cerevisiae) Gene [Source:MGI(curated);Acc:MGI:1100510] (more at Entrez)
0.06
Networks
Network Description Weight Physical interactions 77.4% Foster-Klip-2006 Direct interaction
Pubmed 16396496 Tags: Cell Line; Cultured Cells; Stem Cells
18.92%
Edmondson-Ping-2002 Direct interactionPubmed 12169683 Tags: Muscle; Signal Transduction
15.52%
Husi-Grant-2000 Direct interactionPubmed 10862698 Tags: Brain; Signal Transduction; Nervous System
8.53%
Tomomori-Sato-Conaway-2004 Direct interactionPubmed 14638676 Tags: Cultured Cells; Cancer; Epithelial Cells; Cell Line; Liver; TranscriptionFactors
8.3%
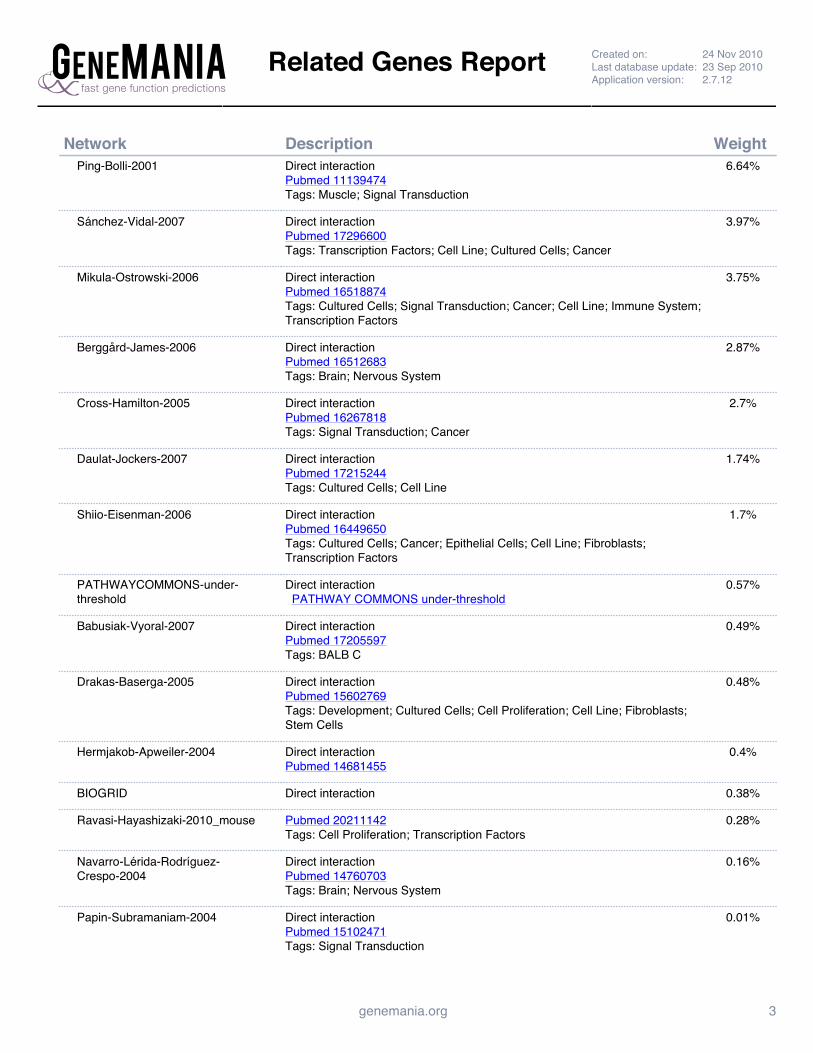
Related Genes Report Created on: 24 Nov 2010Last database update: 23 Sep 2010Application version: 2.7.12
genemania.org 3
Network Description Weight Ping-Bolli-2001 Direct interaction
Pubmed 11139474 Tags: Muscle; Signal Transduction
6.64%
Sánchez-Vidal-2007 Direct interactionPubmed 17296600 Tags: Transcription Factors; Cell Line; Cultured Cells; Cancer
3.97%
Mikula-Ostrowski-2006 Direct interactionPubmed 16518874 Tags: Cultured Cells; Signal Transduction; Cancer; Cell Line; Immune System;Transcription Factors
3.75%
Berggård-James-2006 Direct interactionPubmed 16512683 Tags: Brain; Nervous System
2.87%
Cross-Hamilton-2005 Direct interactionPubmed 16267818 Tags: Signal Transduction; Cancer
2.7%
Daulat-Jockers-2007 Direct interactionPubmed 17215244 Tags: Cultured Cells; Cell Line
1.74%
Shiio-Eisenman-2006 Direct interactionPubmed 16449650 Tags: Cultured Cells; Cancer; Epithelial Cells; Cell Line; Fibroblasts;Transcription Factors
1.7%
PATHWAYCOMMONS-under-threshold
Direct interaction PATHWAY COMMONS under-threshold
0.57%
Babusiak-Vyoral-2007 Direct interactionPubmed 17205597 Tags: BALB C
0.49%
Drakas-Baserga-2005 Direct interactionPubmed 15602769 Tags: Development; Cultured Cells; Cell Proliferation; Cell Line; Fibroblasts;Stem Cells
0.48%
Hermjakob-Apweiler-2004 Direct interactionPubmed 14681455
0.4%
BIOGRID Direct interaction 0.38%
Ravasi-Hayashizaki-2010_mouse Pubmed 20211142 Tags: Cell Proliferation; Transcription Factors
0.28%
Navarro-Lérida-Rodríguez-Crespo-2004
Direct interactionPubmed 14760703 Tags: Brain; Nervous System
0.16%
Papin-Subramaniam-2004 Direct interactionPubmed 15102471 Tags: Signal Transduction
0.01%
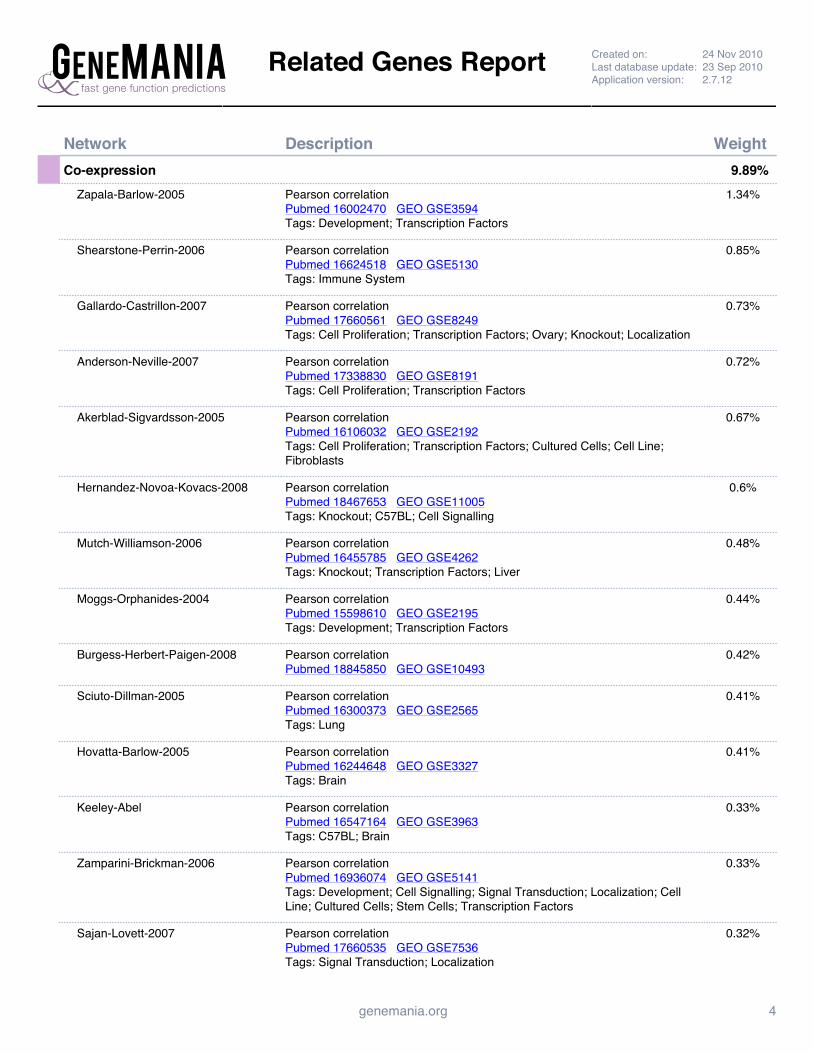
Related Genes Report Created on: 24 Nov 2010Last database update: 23 Sep 2010Application version: 2.7.12
genemania.org 4
Network Description Weight Co-expression 9.89% Zapala-Barlow-2005 Pearson correlation
Pubmed 16002470 GEO GSE3594Tags: Development; Transcription Factors
1.34%
Shearstone-Perrin-2006 Pearson correlationPubmed 16624518 GEO GSE5130Tags: Immune System
0.85%
Gallardo-Castrillon-2007 Pearson correlationPubmed 17660561 GEO GSE8249Tags: Cell Proliferation; Transcription Factors; Ovary; Knockout; Localization
0.73%
Anderson-Neville-2007 Pearson correlationPubmed 17338830 GEO GSE8191Tags: Cell Proliferation; Transcription Factors
0.72%
Akerblad-Sigvardsson-2005 Pearson correlationPubmed 16106032 GEO GSE2192Tags: Cell Proliferation; Transcription Factors; Cultured Cells; Cell Line;Fibroblasts
0.67%
Hernandez-Novoa-Kovacs-2008 Pearson correlationPubmed 18467653 GEO GSE11005Tags: Knockout; C57BL; Cell Signalling
0.6%
Mutch-Williamson-2006 Pearson correlationPubmed 16455785 GEO GSE4262Tags: Knockout; Transcription Factors; Liver
0.48%
Moggs-Orphanides-2004 Pearson correlationPubmed 15598610 GEO GSE2195Tags: Development; Transcription Factors
0.44%
Burgess-Herbert-Paigen-2008 Pearson correlationPubmed 18845850 GEO GSE10493
0.42%
Sciuto-Dillman-2005 Pearson correlationPubmed 16300373 GEO GSE2565Tags: Lung
0.41%
Hovatta-Barlow-2005 Pearson correlationPubmed 16244648 GEO GSE3327Tags: Brain
0.41%
Keeley-Abel Pearson correlationPubmed 16547164 GEO GSE3963Tags: C57BL; Brain
0.33%
Zamparini-Brickman-2006 Pearson correlationPubmed 16936074 GEO GSE5141Tags: Development; Cell Signalling; Signal Transduction; Localization; CellLine; Cultured Cells; Stem Cells; Transcription Factors
0.33%
Sajan-Lovett-2007 Pearson correlationPubmed 17660535 GEO GSE7536Tags: Signal Transduction; Localization
0.32%
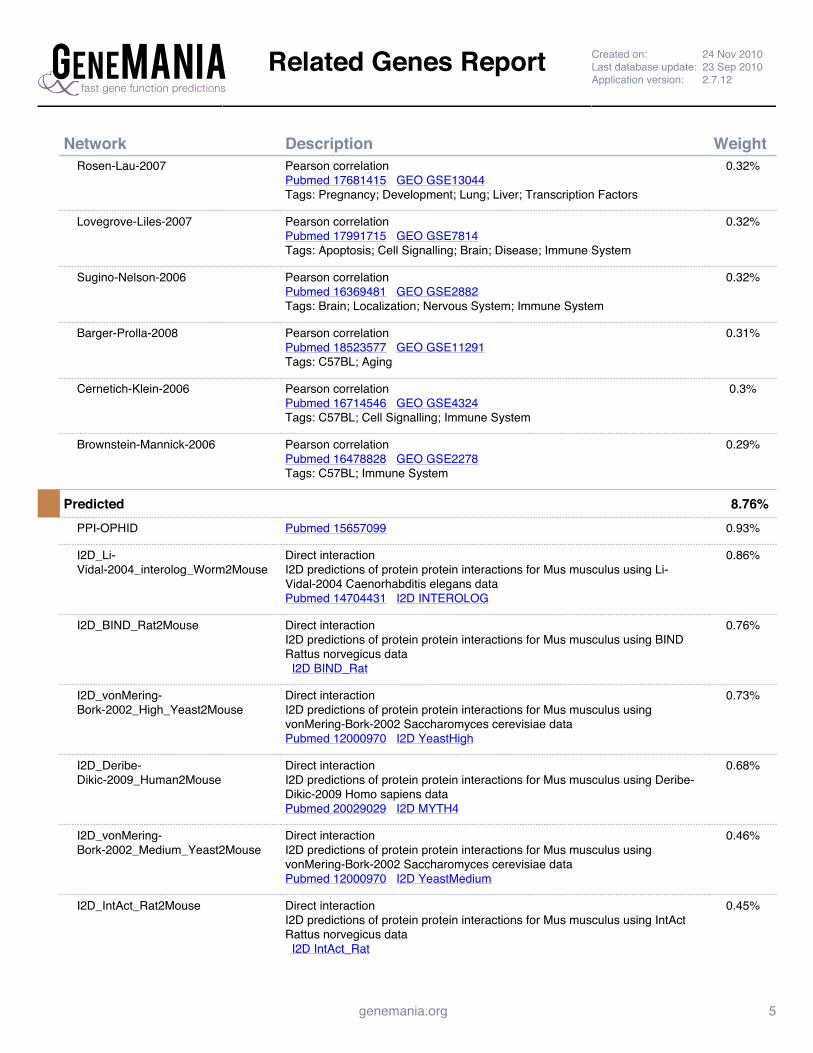
Related Genes Report Created on: 24 Nov 2010Last database update: 23 Sep 2010Application version: 2.7.12
genemania.org 5
Network Description Weight Rosen-Lau-2007 Pearson correlation
Pubmed 17681415 GEO GSE13044Tags: Pregnancy; Development; Lung; Liver; Transcription Factors
0.32%
Lovegrove-Liles-2007 Pearson correlationPubmed 17991715 GEO GSE7814Tags: Apoptosis; Cell Signalling; Brain; Disease; Immune System
0.32%
Sugino-Nelson-2006 Pearson correlationPubmed 16369481 GEO GSE2882Tags: Brain; Localization; Nervous System; Immune System
0.32%
Barger-Prolla-2008 Pearson correlationPubmed 18523577 GEO GSE11291Tags: C57BL; Aging
0.31%
Cernetich-Klein-2006 Pearson correlationPubmed 16714546 GEO GSE4324Tags: C57BL; Cell Signalling; Immune System
0.3%
Brownstein-Mannick-2006 Pearson correlationPubmed 16478828 GEO GSE2278Tags: C57BL; Immune System
0.29%
Predicted 8.76% PPI-OPHID Pubmed 15657099 0.93%
I2D_Li-Vidal-2004_interolog_Worm2Mouse
Direct interactionI2D predictions of protein protein interactions for Mus musculus using Li-Vidal-2004 Caenorhabditis elegans dataPubmed 14704431 I2D INTEROLOG
0.86%
I2D_BIND_Rat2Mouse Direct interactionI2D predictions of protein protein interactions for Mus musculus using BINDRattus norvegicus data I2D BIND_Rat
0.76%
I2D_vonMering-Bork-2002_High_Yeast2Mouse
Direct interactionI2D predictions of protein protein interactions for Mus musculus usingvonMering-Bork-2002 Saccharomyces cerevisiae dataPubmed 12000970 I2D YeastHigh
0.73%
I2D_Deribe-Dikic-2009_Human2Mouse
Direct interactionI2D predictions of protein protein interactions for Mus musculus using Deribe-Dikic-2009 Homo sapiens dataPubmed 20029029 I2D MYTH4
0.68%
I2D_vonMering-Bork-2002_Medium_Yeast2Mouse
Direct interactionI2D predictions of protein protein interactions for Mus musculus usingvonMering-Bork-2002 Saccharomyces cerevisiae dataPubmed 12000970 I2D YeastMedium
0.46%
I2D_IntAct_Rat2Mouse Direct interactionI2D predictions of protein protein interactions for Mus musculus using IntActRattus norvegicus data I2D IntAct_Rat
0.45%
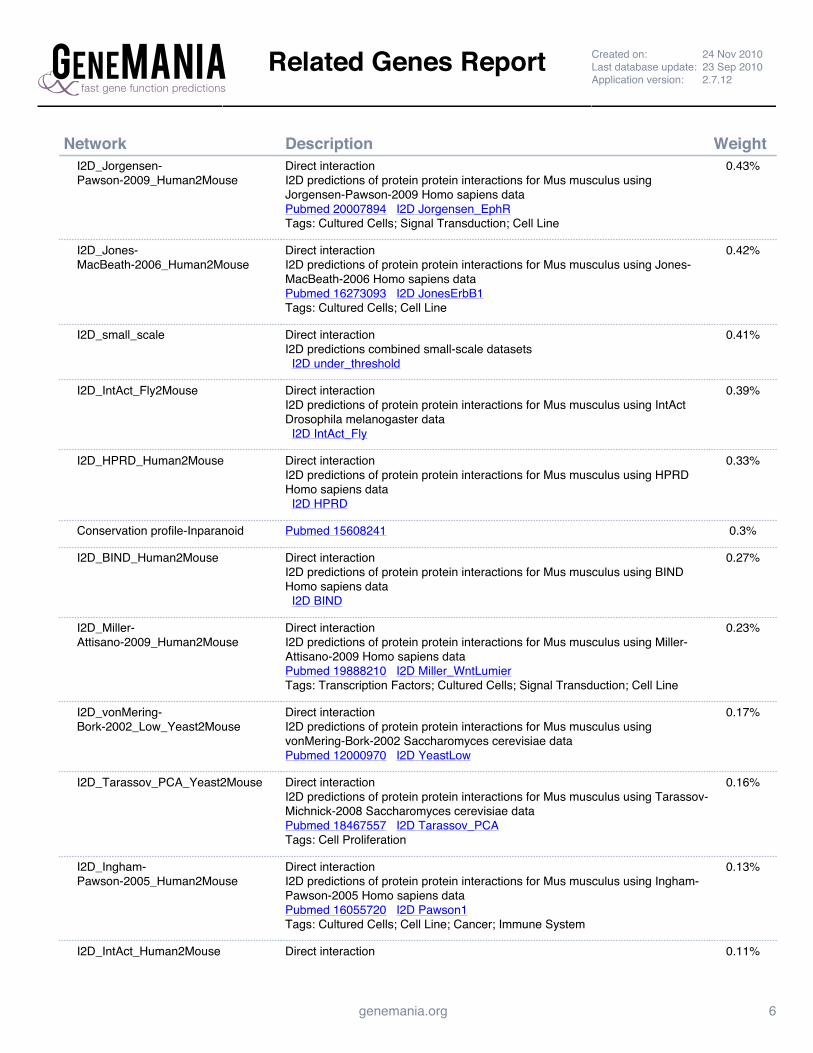
Related Genes Report Created on: 24 Nov 2010Last database update: 23 Sep 2010Application version: 2.7.12
genemania.org 6
Network Description Weight I2D_Jorgensen-
Pawson-2009_Human2MouseDirect interactionI2D predictions of protein protein interactions for Mus musculus usingJorgensen-Pawson-2009 Homo sapiens dataPubmed 20007894 I2D Jorgensen_EphRTags: Cultured Cells; Signal Transduction; Cell Line
0.43%
I2D_Jones-MacBeath-2006_Human2Mouse
Direct interactionI2D predictions of protein protein interactions for Mus musculus using Jones-MacBeath-2006 Homo sapiens dataPubmed 16273093 I2D JonesErbB1Tags: Cultured Cells; Cell Line
0.42%
I2D_small_scale Direct interactionI2D predictions combined small-scale datasets I2D under_threshold
0.41%
I2D_IntAct_Fly2Mouse Direct interactionI2D predictions of protein protein interactions for Mus musculus using IntActDrosophila melanogaster data I2D IntAct_Fly
0.39%
I2D_HPRD_Human2Mouse Direct interactionI2D predictions of protein protein interactions for Mus musculus using HPRDHomo sapiens data I2D HPRD
0.33%
Conservation profile-Inparanoid Pubmed 15608241 0.3%
I2D_BIND_Human2Mouse Direct interactionI2D predictions of protein protein interactions for Mus musculus using BINDHomo sapiens data I2D BIND
0.27%
I2D_Miller-Attisano-2009_Human2Mouse
Direct interactionI2D predictions of protein protein interactions for Mus musculus using Miller-Attisano-2009 Homo sapiens dataPubmed 19888210 I2D Miller_WntLumierTags: Transcription Factors; Cultured Cells; Signal Transduction; Cell Line
0.23%
I2D_vonMering-Bork-2002_Low_Yeast2Mouse
Direct interactionI2D predictions of protein protein interactions for Mus musculus usingvonMering-Bork-2002 Saccharomyces cerevisiae dataPubmed 12000970 I2D YeastLow
0.17%
I2D_Tarassov_PCA_Yeast2Mouse Direct interactionI2D predictions of protein protein interactions for Mus musculus using Tarassov-Michnick-2008 Saccharomyces cerevisiae dataPubmed 18467557 I2D Tarassov_PCATags: Cell Proliferation
0.16%
I2D_Ingham-Pawson-2005_Human2Mouse
Direct interactionI2D predictions of protein protein interactions for Mus musculus using Ingham-Pawson-2005 Homo sapiens dataPubmed 16055720 I2D Pawson1Tags: Cultured Cells; Cell Line; Cancer; Immune System
0.13%
I2D_IntAct_Human2Mouse Direct interaction 0.11%
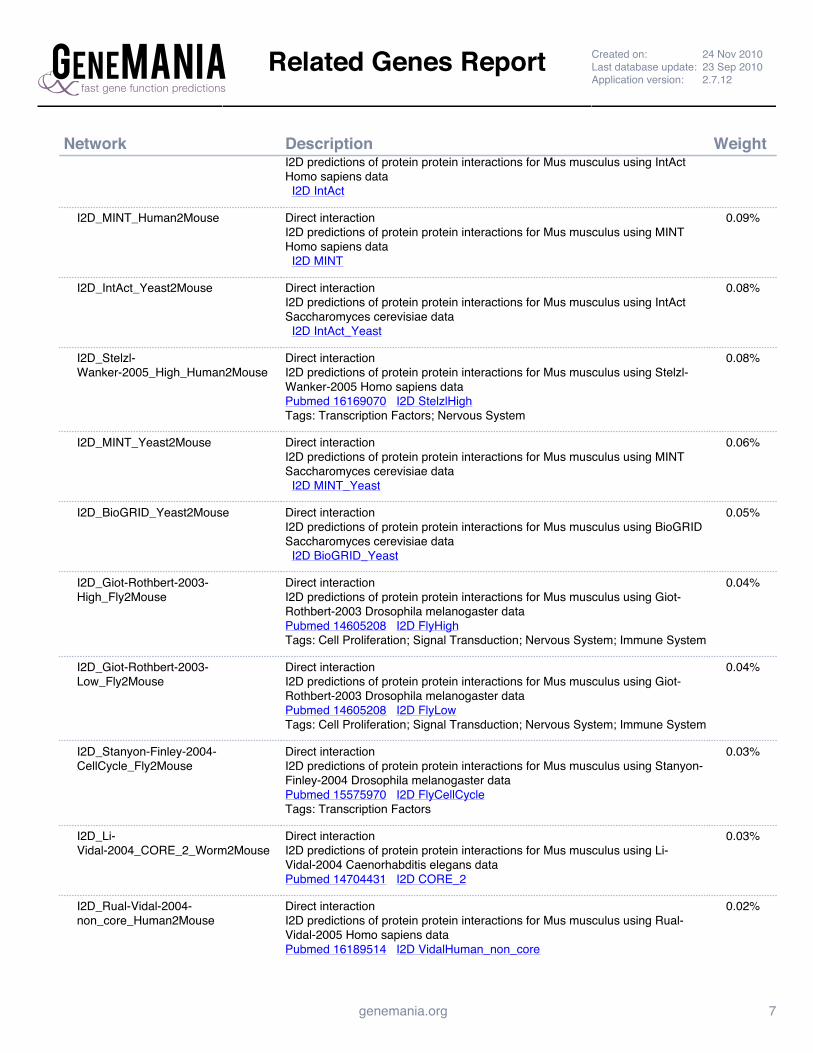
Related Genes Report Created on: 24 Nov 2010Last database update: 23 Sep 2010Application version: 2.7.12
genemania.org 7
Network Description WeightI2D predictions of protein protein interactions for Mus musculus using IntActHomo sapiens data I2D IntAct
I2D_MINT_Human2Mouse Direct interactionI2D predictions of protein protein interactions for Mus musculus using MINTHomo sapiens data I2D MINT
0.09%
I2D_IntAct_Yeast2Mouse Direct interactionI2D predictions of protein protein interactions for Mus musculus using IntActSaccharomyces cerevisiae data I2D IntAct_Yeast
0.08%
I2D_Stelzl-Wanker-2005_High_Human2Mouse
Direct interactionI2D predictions of protein protein interactions for Mus musculus using Stelzl-Wanker-2005 Homo sapiens dataPubmed 16169070 I2D StelzlHighTags: Transcription Factors; Nervous System
0.08%
I2D_MINT_Yeast2Mouse Direct interactionI2D predictions of protein protein interactions for Mus musculus using MINTSaccharomyces cerevisiae data I2D MINT_Yeast
0.06%
I2D_BioGRID_Yeast2Mouse Direct interactionI2D predictions of protein protein interactions for Mus musculus using BioGRIDSaccharomyces cerevisiae data I2D BioGRID_Yeast
0.05%
I2D_Giot-Rothbert-2003-High_Fly2Mouse
Direct interactionI2D predictions of protein protein interactions for Mus musculus using Giot-Rothbert-2003 Drosophila melanogaster dataPubmed 14605208 I2D FlyHighTags: Cell Proliferation; Signal Transduction; Nervous System; Immune System
0.04%
I2D_Giot-Rothbert-2003-Low_Fly2Mouse
Direct interactionI2D predictions of protein protein interactions for Mus musculus using Giot-Rothbert-2003 Drosophila melanogaster dataPubmed 14605208 I2D FlyLowTags: Cell Proliferation; Signal Transduction; Nervous System; Immune System
0.04%
I2D_Stanyon-Finley-2004-CellCycle_Fly2Mouse
Direct interactionI2D predictions of protein protein interactions for Mus musculus using Stanyon-Finley-2004 Drosophila melanogaster dataPubmed 15575970 I2D FlyCellCycleTags: Transcription Factors
0.03%
I2D_Li-Vidal-2004_CORE_2_Worm2Mouse
Direct interactionI2D predictions of protein protein interactions for Mus musculus using Li-Vidal-2004 Caenorhabditis elegans dataPubmed 14704431 I2D CORE_2
0.03%
I2D_Rual-Vidal-2004-non_core_Human2Mouse
Direct interactionI2D predictions of protein protein interactions for Mus musculus using Rual-Vidal-2005 Homo sapiens dataPubmed 16189514 I2D VidalHuman_non_core
0.02%
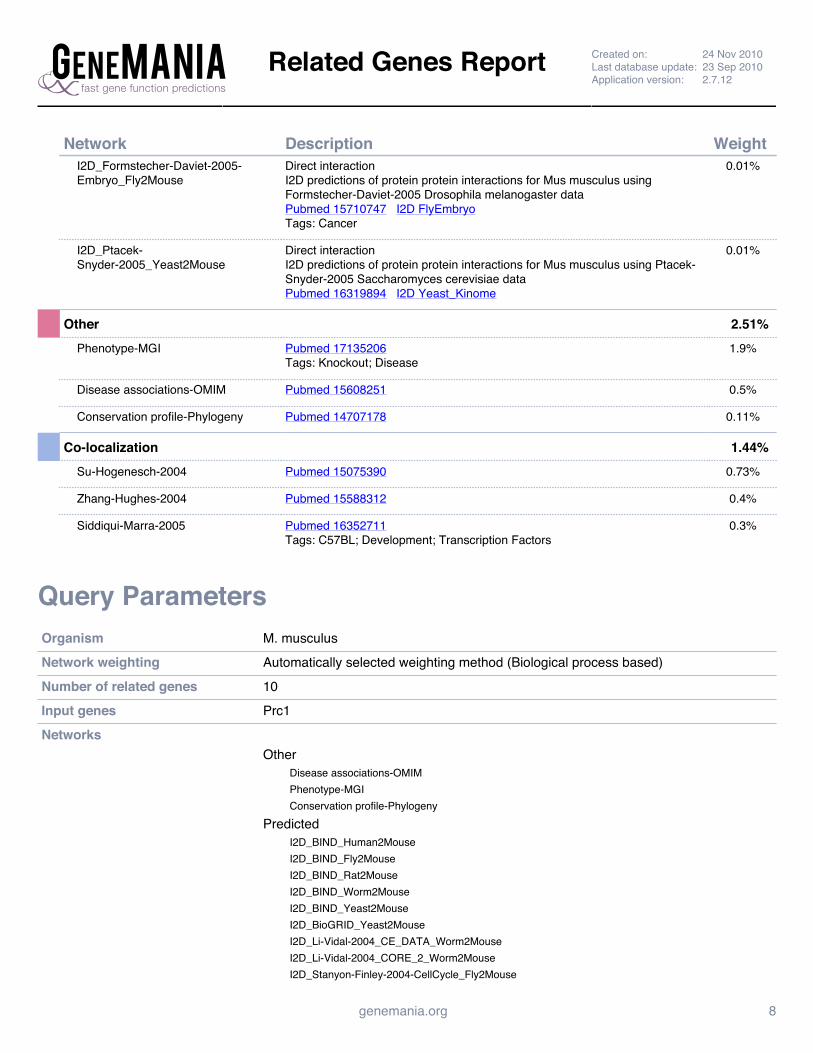
Related Genes Report Created on: 24 Nov 2010Last database update: 23 Sep 2010Application version: 2.7.12
genemania.org 8
Network Description Weight I2D_Formstecher-Daviet-2005-
Embryo_Fly2MouseDirect interactionI2D predictions of protein protein interactions for Mus musculus usingFormstecher-Daviet-2005 Drosophila melanogaster dataPubmed 15710747 I2D FlyEmbryoTags: Cancer
0.01%
I2D_Ptacek-Snyder-2005_Yeast2Mouse
Direct interactionI2D predictions of protein protein interactions for Mus musculus using Ptacek-Snyder-2005 Saccharomyces cerevisiae dataPubmed 16319894 I2D Yeast_Kinome
0.01%
Other 2.51% Phenotype-MGI Pubmed 17135206
Tags: Knockout; Disease1.9%
Disease associations-OMIM Pubmed 15608251 0.5%
Conservation profile-Phylogeny Pubmed 14707178 0.11%
Co-localization 1.44% Su-Hogenesch-2004 Pubmed 15075390 0.73%
Zhang-Hughes-2004 Pubmed 15588312 0.4%
Siddiqui-Marra-2005 Pubmed 16352711 Tags: C57BL; Development; Transcription Factors
0.3%
Query ParametersOrganism M. musculusNetwork weighting Automatically selected weighting method (Biological process based)Number of related genes 10Input genes Prc1 Networks
OtherDisease associations-OMIMPhenotype-MGIConservation profile-Phylogeny
PredictedI2D_BIND_Human2MouseI2D_BIND_Fly2MouseI2D_BIND_Rat2MouseI2D_BIND_Worm2MouseI2D_BIND_Yeast2MouseI2D_BioGRID_Yeast2MouseI2D_Li-Vidal-2004_CE_DATA_Worm2MouseI2D_Li-Vidal-2004_CORE_2_Worm2MouseI2D_Stanyon-Finley-2004-CellCycle_Fly2Mouse
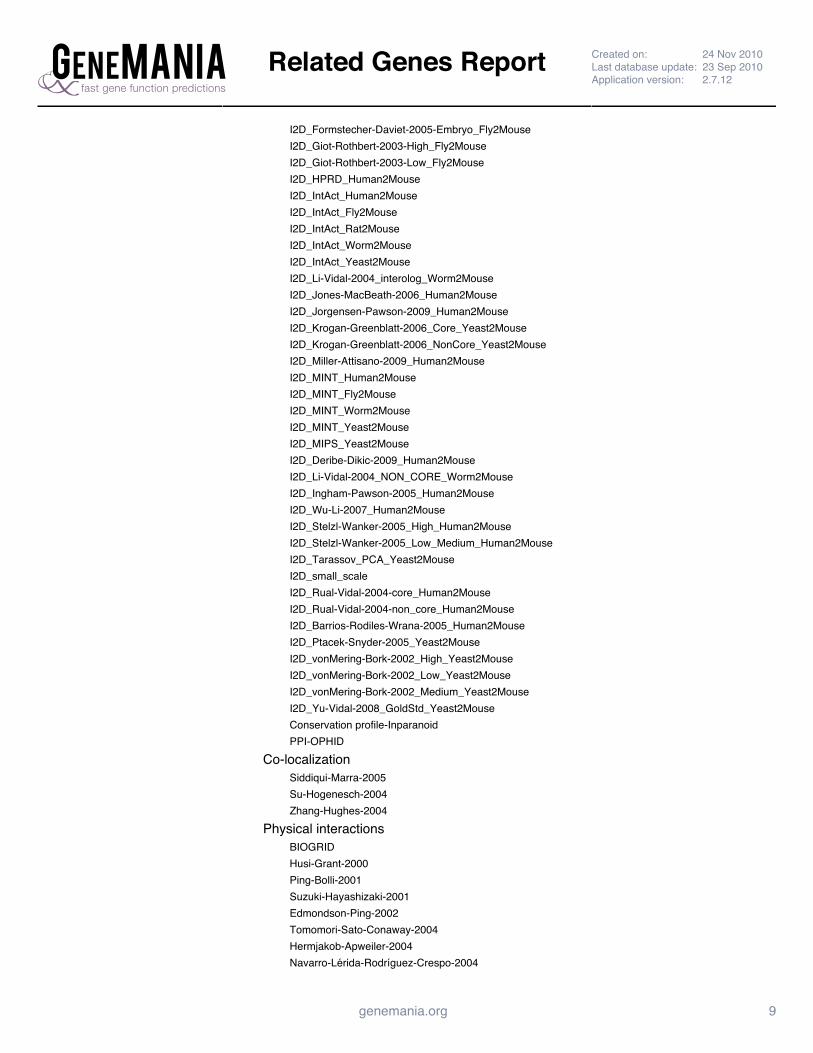
Related Genes Report Created on: 24 Nov 2010Last database update: 23 Sep 2010Application version: 2.7.12
genemania.org 9
I2D_Formstecher-Daviet-2005-Embryo_Fly2MouseI2D_Giot-Rothbert-2003-High_Fly2MouseI2D_Giot-Rothbert-2003-Low_Fly2MouseI2D_HPRD_Human2MouseI2D_IntAct_Human2MouseI2D_IntAct_Fly2MouseI2D_IntAct_Rat2MouseI2D_IntAct_Worm2MouseI2D_IntAct_Yeast2MouseI2D_Li-Vidal-2004_interolog_Worm2MouseI2D_Jones-MacBeath-2006_Human2MouseI2D_Jorgensen-Pawson-2009_Human2MouseI2D_Krogan-Greenblatt-2006_Core_Yeast2MouseI2D_Krogan-Greenblatt-2006_NonCore_Yeast2MouseI2D_Miller-Attisano-2009_Human2MouseI2D_MINT_Human2MouseI2D_MINT_Fly2MouseI2D_MINT_Worm2MouseI2D_MINT_Yeast2MouseI2D_MIPS_Yeast2MouseI2D_Deribe-Dikic-2009_Human2MouseI2D_Li-Vidal-2004_NON_CORE_Worm2MouseI2D_Ingham-Pawson-2005_Human2MouseI2D_Wu-Li-2007_Human2MouseI2D_Stelzl-Wanker-2005_High_Human2MouseI2D_Stelzl-Wanker-2005_Low_Medium_Human2MouseI2D_Tarassov_PCA_Yeast2MouseI2D_small_scaleI2D_Rual-Vidal-2004-core_Human2MouseI2D_Rual-Vidal-2004-non_core_Human2MouseI2D_Barrios-Rodiles-Wrana-2005_Human2MouseI2D_Ptacek-Snyder-2005_Yeast2MouseI2D_vonMering-Bork-2002_High_Yeast2MouseI2D_vonMering-Bork-2002_Low_Yeast2MouseI2D_vonMering-Bork-2002_Medium_Yeast2MouseI2D_Yu-Vidal-2008_GoldStd_Yeast2MouseConservation profile-InparanoidPPI-OPHID
Co-localizationSiddiqui-Marra-2005Su-Hogenesch-2004Zhang-Hughes-2004
Physical interactionsBIOGRIDHusi-Grant-2000Ping-Bolli-2001Suzuki-Hayashizaki-2001Edmondson-Ping-2002Tomomori-Sato-Conaway-2004Hermjakob-Apweiler-2004Navarro-Lérida-Rodríguez-Crespo-2004
Related Genes Report Created on: 24 Nov 2010Last database update: 23 Sep 2010Application version: 2.7.12
genemania.org 10
Papin-Subramaniam-2004Sato-Conaway-2004Hassel-Souchelnytskyi-2004Drakas-Baserga-2005Babusiak-Vyoral-2005Barrios-Rodiles-Wrana-2005Cross-Hamilton-2005Foster-Klip-2006Shiio-Eisenman-2006Berggård-James-2006Mikula-Ostrowski-2006Zong-Ping-2006Gomes-Ping-2006Qiu-Goldberg-2006Babusiak-Vyoral-2007Daulat-Jockers-2007Sánchez-Vidal-2007Vera-Jaumot-2007PATHWAYCOMMONS-under-thresholdRavasi-Hayashizaki-2010_mouse
Co-expressionBurgess-Herbert-Paigen-2008Hernandez-Novoa-Kovacs-2008Barger-Prolla-2008Rosen-Lau-2007Akerblad-Sigvardsson-2005Moggs-Orphanides-2004Brownstein-Mannick-2006Sciuto-Dillman-2005Sugino-Nelson-2006Hovatta-Barlow-2005Zapala-Barlow-2005Keeley-AbelMutch-Williamson-2006Cernetich-Klein-2006Shearstone-Perrin-2006Zamparini-Brickman-2006Sajan-Lovett-2007Lovegrove-Liles-2007Anderson-Neville-2007Gallardo-Castrillon-2007

143
PERMISSIONS
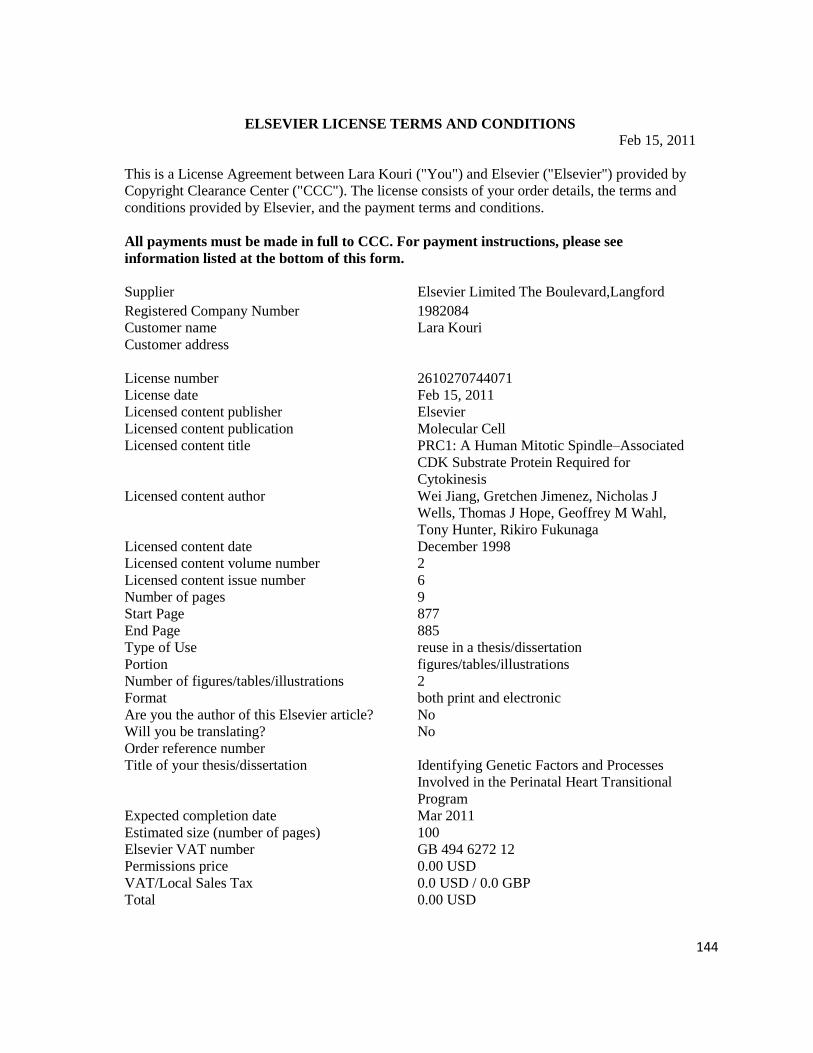
144
ELSEVIER LICENSE TERMS AND CONDITIONS
Feb 15, 2011
This is a License Agreement between Lara Kouri ("You") and Elsevier ("Elsevier") provided by
Copyright Clearance Center ("CCC"). The license consists of your order details, the terms and
conditions provided by Elsevier, and the payment terms and conditions.
All payments must be made in full to CCC. For payment instructions, please see
information listed at the bottom of this form.
Supplier Elsevier Limited The Boulevard,Langford
Registered Company Number 1982084
Customer name Lara Kouri
Customer address
License number 2610270744071
License date Feb 15, 2011
Licensed content publisher Elsevier
Licensed content publication Molecular Cell
Licensed content title PRC1: A Human Mitotic Spindle–Associated
CDK Substrate Protein Required for
Cytokinesis
Licensed content author Wei Jiang, Gretchen Jimenez, Nicholas J
Wells, Thomas J Hope, Geoffrey M Wahl,
Tony Hunter, Rikiro Fukunaga
Licensed content date December 1998
Licensed content volume number 2
Licensed content issue number 6
Number of pages 9
Start Page 877
End Page 885
Type of Use reuse in a thesis/dissertation
Portion figures/tables/illustrations
Number of figures/tables/illustrations 2
Format both print and electronic
Are you the author of this Elsevier article? No
Will you be translating? No
Order reference number
Title of your thesis/dissertation Identifying Genetic Factors and Processes
Involved in the Perinatal Heart Transitional
Program
Expected completion date Mar 2011
Estimated size (number of pages) 100
Elsevier VAT number GB 494 6272 12
Permissions price 0.00 USD
VAT/Local Sales Tax 0.0 USD / 0.0 GBP
Total 0.00 USD
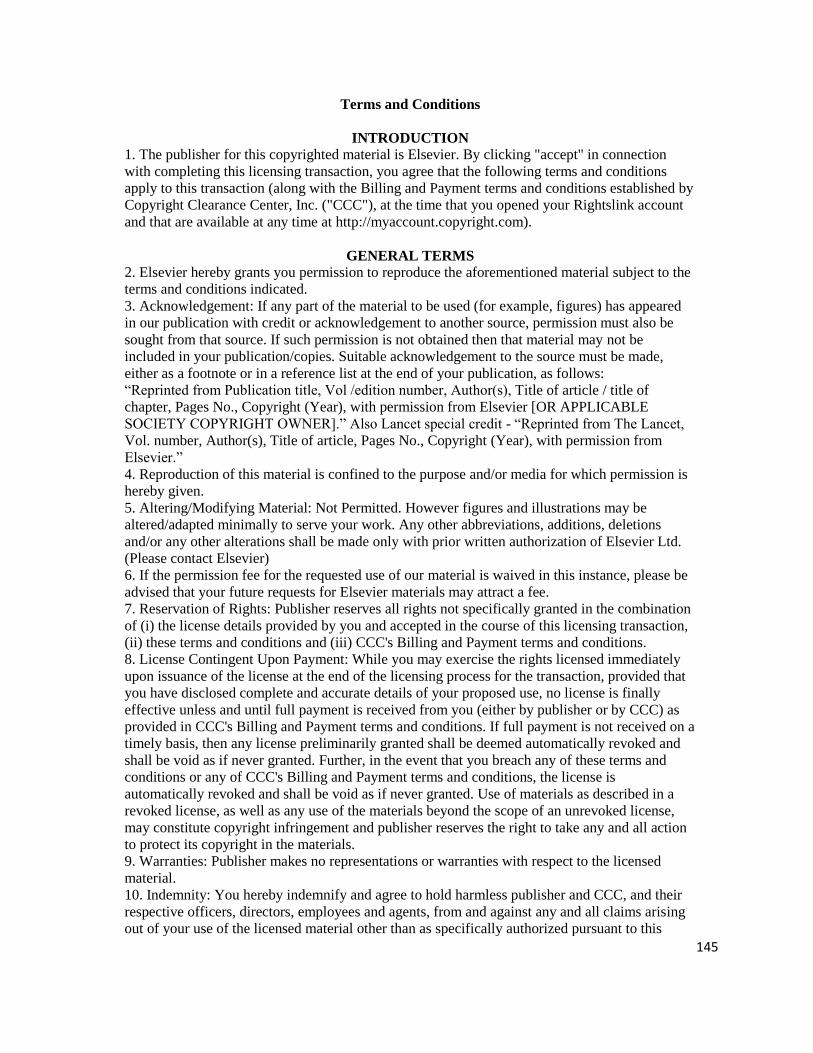
145
Terms and Conditions
INTRODUCTION 1. The publisher for this copyrighted material is Elsevier. By clicking "accept" in connection
with completing this licensing transaction, you agree that the following terms and conditions
apply to this transaction (along with the Billing and Payment terms and conditions established by
Copyright Clearance Center, Inc. ("CCC"), at the time that you opened your Rightslink account
and that are available at any time at http://myaccount.copyright.com).
GENERAL TERMS 2. Elsevier hereby grants you permission to reproduce the aforementioned material subject to the
terms and conditions indicated.
3. Acknowledgement: If any part of the material to be used (for example, figures) has appeared
in our publication with credit or acknowledgement to another source, permission must also be
sought from that source. If such permission is not obtained then that material may not be
included in your publication/copies. Suitable acknowledgement to the source must be made,
either as a footnote or in a reference list at the end of your publication, as follows:
“Reprinted from Publication title, Vol /edition number, Author(s), Title of article / title of
chapter, Pages No., Copyright (Year), with permission from Elsevier [OR APPLICABLE
SOCIETY COPYRIGHT OWNER].” Also Lancet special credit - “Reprinted from The Lancet,
Vol. number, Author(s), Title of article, Pages No., Copyright (Year), with permission from
Elsevier.”
4. Reproduction of this material is confined to the purpose and/or media for which permission is
hereby given.
5. Altering/Modifying Material: Not Permitted. However figures and illustrations may be
altered/adapted minimally to serve your work. Any other abbreviations, additions, deletions
and/or any other alterations shall be made only with prior written authorization of Elsevier Ltd.
(Please contact Elsevier)
6. If the permission fee for the requested use of our material is waived in this instance, please be
advised that your future requests for Elsevier materials may attract a fee.
7. Reservation of Rights: Publisher reserves all rights not specifically granted in the combination
of (i) the license details provided by you and accepted in the course of this licensing transaction,
(ii) these terms and conditions and (iii) CCC's Billing and Payment terms and conditions.
8. License Contingent Upon Payment: While you may exercise the rights licensed immediately
upon issuance of the license at the end of the licensing process for the transaction, provided that
you have disclosed complete and accurate details of your proposed use, no license is finally
effective unless and until full payment is received from you (either by publisher or by CCC) as
provided in CCC's Billing and Payment terms and conditions. If full payment is not received on a
timely basis, then any license preliminarily granted shall be deemed automatically revoked and
shall be void as if never granted. Further, in the event that you breach any of these terms and
conditions or any of CCC's Billing and Payment terms and conditions, the license is
automatically revoked and shall be void as if never granted. Use of materials as described in a
revoked license, as well as any use of the materials beyond the scope of an unrevoked license,
may constitute copyright infringement and publisher reserves the right to take any and all action
to protect its copyright in the materials.
9. Warranties: Publisher makes no representations or warranties with respect to the licensed
material.
10. Indemnity: You hereby indemnify and agree to hold harmless publisher and CCC, and their
respective officers, directors, employees and agents, from and against any and all claims arising
out of your use of the licensed material other than as specifically authorized pursuant to this
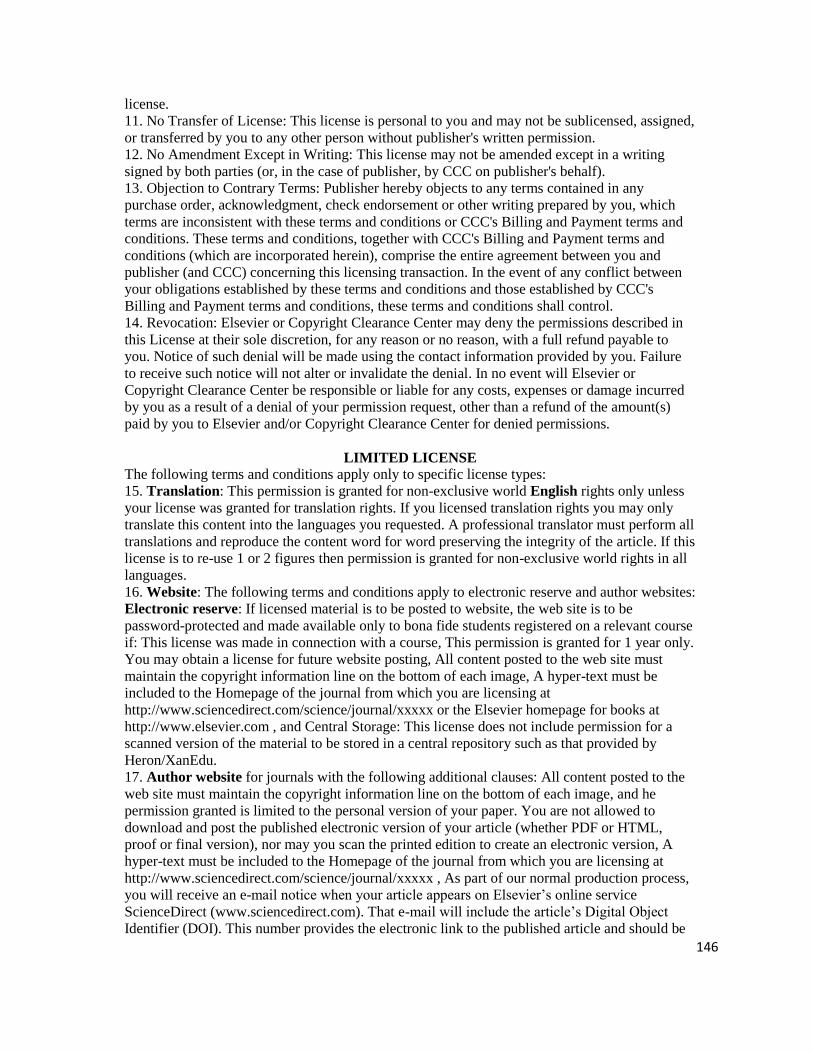
146
license.
11. No Transfer of License: This license is personal to you and may not be sublicensed, assigned,
or transferred by you to any other person without publisher's written permission.
12. No Amendment Except in Writing: This license may not be amended except in a writing
signed by both parties (or, in the case of publisher, by CCC on publisher's behalf).
13. Objection to Contrary Terms: Publisher hereby objects to any terms contained in any
purchase order, acknowledgment, check endorsement or other writing prepared by you, which
terms are inconsistent with these terms and conditions or CCC's Billing and Payment terms and
conditions. These terms and conditions, together with CCC's Billing and Payment terms and
conditions (which are incorporated herein), comprise the entire agreement between you and
publisher (and CCC) concerning this licensing transaction. In the event of any conflict between
your obligations established by these terms and conditions and those established by CCC's
Billing and Payment terms and conditions, these terms and conditions shall control.
14. Revocation: Elsevier or Copyright Clearance Center may deny the permissions described in
this License at their sole discretion, for any reason or no reason, with a full refund payable to
you. Notice of such denial will be made using the contact information provided by you. Failure
to receive such notice will not alter or invalidate the denial. In no event will Elsevier or
Copyright Clearance Center be responsible or liable for any costs, expenses or damage incurred
by you as a result of a denial of your permission request, other than a refund of the amount(s)
paid by you to Elsevier and/or Copyright Clearance Center for denied permissions.
LIMITED LICENSE The following terms and conditions apply only to specific license types:
15. Translation: This permission is granted for non-exclusive world English rights only unless
your license was granted for translation rights. If you licensed translation rights you may only
translate this content into the languages you requested. A professional translator must perform all
translations and reproduce the content word for word preserving the integrity of the article. If this
license is to re-use 1 or 2 figures then permission is granted for non-exclusive world rights in all
languages.
16. Website: The following terms and conditions apply to electronic reserve and author websites:
Electronic reserve: If licensed material is to be posted to website, the web site is to be
password-protected and made available only to bona fide students registered on a relevant course
if: This license was made in connection with a course, This permission is granted for 1 year only.
You may obtain a license for future website posting, All content posted to the web site must
maintain the copyright information line on the bottom of each image, A hyper-text must be
included to the Homepage of the journal from which you are licensing at
http://www.sciencedirect.com/science/journal/xxxxx or the Elsevier homepage for books at
http://www.elsevier.com , and Central Storage: This license does not include permission for a
scanned version of the material to be stored in a central repository such as that provided by
Heron/XanEdu.
17. Author website for journals with the following additional clauses: All content posted to the
web site must maintain the copyright information line on the bottom of each image, and he
permission granted is limited to the personal version of your paper. You are not allowed to
download and post the published electronic version of your article (whether PDF or HTML,
proof or final version), nor may you scan the printed edition to create an electronic version, A
hyper-text must be included to the Homepage of the journal from which you are licensing at
http://www.sciencedirect.com/science/journal/xxxxx , As part of our normal production process,
you will receive an e-mail notice when your article appears on Elsevier‟s online service
ScienceDirect (www.sciencedirect.com). That e-mail will include the article‟s Digital Object
Identifier (DOI). This number provides the electronic link to the published article and should be
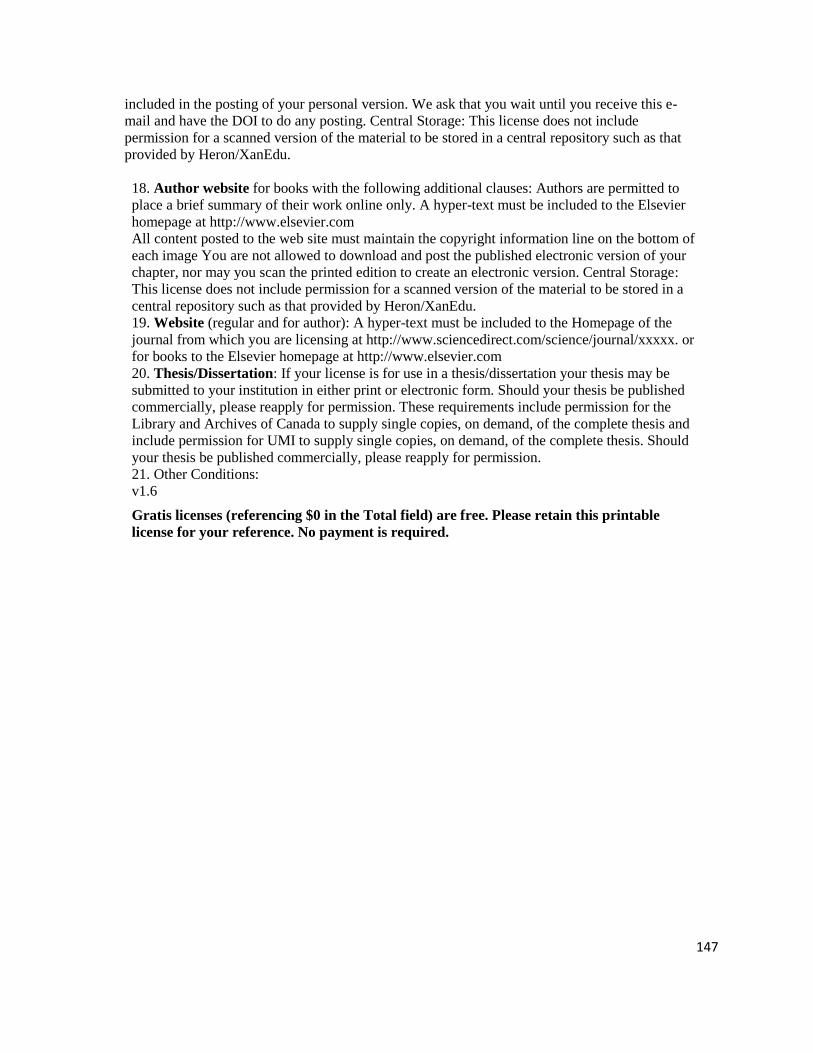
147
included in the posting of your personal version. We ask that you wait until you receive this e-
mail and have the DOI to do any posting. Central Storage: This license does not include
permission for a scanned version of the material to be stored in a central repository such as that
provided by Heron/XanEdu.
18. Author website for books with the following additional clauses: Authors are permitted to
place a brief summary of their work online only. A hyper-text must be included to the Elsevier
homepage at http://www.elsevier.com
All content posted to the web site must maintain the copyright information line on the bottom of
each image You are not allowed to download and post the published electronic version of your
chapter, nor may you scan the printed edition to create an electronic version. Central Storage:
This license does not include permission for a scanned version of the material to be stored in a
central repository such as that provided by Heron/XanEdu.
19. Website (regular and for author): A hyper-text must be included to the Homepage of the
journal from which you are licensing at http://www.sciencedirect.com/science/journal/xxxxx. or
for books to the Elsevier homepage at http://www.elsevier.com
20. Thesis/Dissertation: If your license is for use in a thesis/dissertation your thesis may be
submitted to your institution in either print or electronic form. Should your thesis be published
commercially, please reapply for permission. These requirements include permission for the
Library and Archives of Canada to supply single copies, on demand, of the complete thesis and
include permission for UMI to supply single copies, on demand, of the complete thesis. Should
your thesis be published commercially, please reapply for permission.
21. Other Conditions:
v1.6
Gratis licenses (referencing $0 in the Total field) are free. Please retain this printable
license for your reference. No payment is required.
148
WOLTERS KLUWER HEALTH LICENSE TERMS AND CONDITIONS Feb 15, 2011
This is a License Agreement between Lara Kouri ("You") and Wolters Kluwer Health ("Wolters
Kluwer Health") provided by Copyright Clearance Center ("CCC"). The license consists of your
order details, the terms and conditions provided by Wolters Kluwer Health, and the payment terms
and conditions.
All payments must be made in full to CCC. For payment instructions, please see information
listed at the bottom of this form.
License Number 2610290535691
License date Feb 15, 2011
Licensed content publisher Wolters Kluwer Health
Licensed content publication Circulation Research
Licensed content title Toward MicroRNA-Based Therapeutics for
Heart Disease: The Sense in Antisense
Licensed content author Eva van Rooij
Licensed content date Oct 24, 2008
Volume Number 103
Issue Number 9
Type of Use Dissertation/Thesis
Requestor type Individual
Title of your thesis / dissertation Identifying Genetic Factors and Processes
Involved in the Perinatal Heart Transitional
Program
Expected completion date Mar 2011
Estimated size(pages) 100
Billing Type Invoice
Billing Address
Customer reference info
Total 0.00 USD
Terms and Conditions
Terms and Conditions
1. A credit line will be prominently placed and include: for books - the author(s), title of book,
editor, copyright holder, year of publication; For journals - the author(s), title of article, title of
journal, volume number, issue number and inclusive pages.
2. The requestor warrants that the material shall not be used in any manner which may be
considered derogatory to the title, content, or authors of the material, or to Wolters
Kluwer/Lippincott, Williams & Wilkins.
3. Permission is granted for one time use only as specified in your correspondence. Rights herein
do not apply to future reproductions, editions, revisions, or other derivative works. Once term has
expired, permission to renew must be made in writing.
4. Permission granted is non-exclusive, and is valid throughout the world in the English language

149
and the languages specified in your original request.
5. Wolters Kluwer Health/ Lippincott, Williams & Wilkins, cannot supply the requestor with the
original artwork or a "clean copy."
6. The requestor agrees to secure written permission from the author (for book material only).
7. Permission is valid if the borrowed material is original to a LWW imprint (Lippincott-Raven
Publishers, Williams & Wilkins, Lea & Febiger, Harwal, Igaku-Shoin, Rapid Science, Little
Brown & Company, Harper & Row Medical, American Journal of Nursing Co, and Urban &
Schwarzenberg - English Language).
8. If you opt not to use the material requested above, please notify Rightslink within 90 days of
the original invoice date.
9. Other Terms and Conditions:
v1.0
Gratis licenses (referencing $0 in the Total field) are free. Please retain this printable license
for your reference. No payment is required.
150
THE AMERICAN ASSOCIATION FOR THE ADVANCEMENT OF SCIENCE LICENSE
TERMS AND CONDITIONS
Mar 07, 2011
This is a License Agreement between Lara Kouri ("You") and The American Association for the
Advancement of Science ("The American Association for the Advancement of Science") provided
by Copyright Clearance Center ("CCC"). The license consists of your order details, the terms and
conditions provided by The American Association for the Advancement of Science, and the
payment terms and conditions.
All payments must be made in full to CCC. For payment instructions, please see information
listed at the bottom of this form.
License Number 2623800488993
License date Mar 07, 2011
Licensed content publisher The American Association for the Advancement of Science
Licensed content publication Science
Licensed content title The Molecular Requirements for Cytokinesis
Licensed content author Michael Glotzer
Licensed content date Mar 1, 2005
Type of Use Thesis / Dissertation
Requestor type Other Individual
Format Print and electronic
Portion Figure
Number of figures/tables 1
Order reference number
Title of your thesis / dissertation Identifying Genetic Factors and Processes Involved in the
Perinatal Heart Transitional Program
Expected completion date Mar 2011
Estimated size(pages) 100
Total 0.00 USD
151
Terms and Conditions
American Association for the Advancement of Science TERMS AND CONDITIONS
Regarding your request, we are pleased to grant you non-exclusive, non-transferable permission, to
republish the AAAS material identified above in your work identified above, subject to the terms
and conditions herein. We must be contacted for permission for any uses other than those
specifically identified in your request above.
The following credit line must be printed along with the AAAS material: "From [Full Reference
Citation]. Reprinted with permission from AAAS."
All required credit lines and notices must be visible any time a user accesses any part of the AAAS
material and must appear on any printed copies and authorized user might make.
This permission does not apply to figures / photos / artwork or any other content or materials
included in your work that are credited to non-AAAS sources. If the requested material is sourced to
or references non-AAAS sources, you must obtain authorization from that source as well before
using that material. You agree to hold harmless and indemnify AAAS against any claims arising
from your use of any content in your work that is credited to non-AAAS sources.
If the AAAS material covered by this permission was published in Science during the years 1974 -
1994, you must also obtain permission from the author, who may grant or withhold permission, and
who may or may not charge a fee if permission is granted. See original article for author's address.
This condition does not apply to news articles.
The AAAS material may not be modified or altered except that figures and tables may be modified
with permission from the author. Author permission for any such changes must be secured prior to
your use.
Whenever possible, we ask that electronic uses of the AAAS material permitted herein include a
hyperlink to the original work on AAAS's website (hyperlink may be embedded in the reference
citation).
AAAS material reproduced in your work identified herein must not account for more than 30% of
the total contents of that work.
AAAS must publish the full paper prior to use of any text.
AAAS material must not imply any endorsement by the American Association for the Advancement
of Science.
This permission is not valid for the use of the AAAS and/or Science logos.
AAAS makes no representations or warranties as to the accuracy of any information contained in
the AAAS material covered by this permission, including any warranties of merchantability or
fitness for a particular purpose.
152
If permission fees for this use are waived, please note that AAAS reserves the right to charge for
reproduction of this material in the future.
Permission is not valid unless payment is received within sixty (60) days of the issuance of this
permission. If payment is not received within this time period then all rights granted herein shall be
revoked and this permission will be considered null and void.
In the event of breach of any of the terms and conditions herein or any of CCC's Billing and
Payment terms and conditions, all rights granted herein shall be revoked and this permission will be
considered null and void.
AAAS reserves the right to terminate this permission and all rights granted herein at its discretion,
for any purpose, at any time. In the event that AAAS elects to terminate this permission, you will
have no further right to publish, publicly perform, publicly display, distribute or otherwise use any
matter in which the AAAS content had been included, and all fees paid hereunder shall be fully
refunded to you. Notification of termination will be sent to the contact information as supplied by
you during the request process and termination shall be immediate upon sending the notice. Neither
AAAS nor CCC shall be liable for any costs, expenses, or damages you may incur as a result of the
termination of this permission, beyond the refund noted above.
This Permission may not be amended except by written document signed by both parties.
The terms above are applicable to all permissions granted for the use of AAAS material. Below you
will find additional conditions that apply to your particular type of use.
FOR A THESIS OR DISSERTATION If you are using figure(s)/table(s), permission is granted for use in print and electronic versions of
your dissertation or thesis. A full text article may be used in print versions only of a dissertation or
thesis.
Permission covers the distribution of your dissertation or thesis on demand by ProQuest / UMI,
provided the AAAS material covered by this permission remains in situ.
If you are an Original Author on the AAAS article being reproduced, please refer to your License to
Publish for rules on reproducing your paper in a dissertation or thesis.
FOR JOURNALS: Permission covers both print and electronic versions of your journal article, however the AAAS
material may not be used in any manner other than within the context of your article.
FOR BOOKS/TEXTBOOKS: If this license is to reuse figures/tables, then permission is granted for non-exclusive world rights in
all languages in both print and electronic formats (electronic formats are defined below).
If this license is to reuse a text excerpt or a full text article, then permission is granted for non-
exclusive world rights in English only. You have the option of securing either print or electronic
rights or both, but electronic rights are not automatically granted and do garner additional fees.
Permission for translations of text excerpts or full text articles into other languages must be obtained
153
separately.
Licenses granted for use of AAAS material in electronic format books/textbooks are valid only in
cases where the electronic version is equivalent to or substitutes for the print version of the
book/textbook. The AAAS material reproduced as permitted herein must remain in situ and must
not be exploited separately (for example, if permission covers the use of a full text article, the article
may not be offered for access or for purchase as a stand-alone unit), except in the case of permitted
textbook companions as noted below.
You must include the following notice in any electronic versions, either adjacent to the reprinted
AAAS material or in the terms and conditions for use of your electronic products: "Readers may
view, browse, and/or download material for temporary copying purposes only, provided these uses
are for noncommercial personal purposes. Except as provided by law, this material may not be
further reproduced, distributed, transmitted, modified, adapted, performed, displayed, published, or
sold in whole or in part, without prior written permission from the publisher."
If your book is an academic textbook, permission covers the following companions to your
textbook, provided such companions are distributed only in conjunction with your textbook at no
additional cost to the user:
- Password-protected website
- Instructor's image CD/DVD and/or PowerPoint resource
- Student CD/DVD
All companions must contain instructions to users that the AAAS material may be used for non-
commercial, classroom purposes only. Any other uses require the prior written permission from
AAAS.
Rights also extend to copies/files of your Work (as described above) that you are required to provide
for use by the visually and/or print disabled in compliance with state and federal laws.
This permission only covers a single edition of your work as identified in your request.
FOR NEWSLETTERS: Permission covers print and/or electronic versions, provided the AAAS material reproduced as
permitted herein remains in situ and is not exploited separately (for example, if permission covers
the use of a full text article, the article may not be offered for access or for purchase as a stand-alone
unit)
FOR ANNUAL REPORTS: Permission covers print and electronic versions provided the AAAS material reproduced as
permitted herein remains in situ and is not exploited separately (for example, if permission covers
the use of a full text article, the article may not be offered for access or for purchase as a stand-alone
unit)
FOR PROMOTIONAL/MARKETING USES: Permission covers the use of AAAS material in promotional or marketing pieces such as
information packets, media kits, product slide kits, brochures, or flyers limited to a single print run.
154
The AAAS Material may not be used in any manner which implies endorsement or promotion by
the American Association for the Advancement of Science (AAAS) or Science of any product or
service. AAAS does not permit the reproduction of its name, logo or text on promotional literature.
If permission to use a full text article is permitted, The Science article covered by this permission
must not be altered in any way. No additional printing may be set onto an article copy other than the
copyright credit line required above. Any alterations must be approved in advance and in writing by
AAAS. This includes, but is not limited to, the placement of sponsorship identifiers, trademarks,
logos, rubber stamping or self-adhesive stickers onto the article copies.
Additionally, article copies must be a freestanding part of any information package (i.e. media kit)
into which they are inserted. They may not be physically attached to anything, such as an
advertising insert, or have anything attached to them, such as a sample product. Article copies must
be easily removable from any kits or informational packages in which they are used. The only
exception is that article copies may be inserted into three-ring binders.
FOR CORPORATE INTERNAL USE: The AAAS material covered by this permission may not be altered in any way. No additional
printing may be set onto an article copy other than the required credit line. Any alterations must be
approved in advance and in writing by AAAS. This includes, but is not limited to the placement of
sponsorship identifiers, trademarks, logos, rubber stamping or self-adhesive stickers onto article
copies.
If you are making article copies, copies are restricted to the number indicated in your request and
must be distributed only to internal employees for internal use.
If you are using AAAS Material in Presentation Slides, the required credit line must be visible on
the slide where the AAAS material will be reprinted
If you are using AAAS Material on a CD, DVD, Flash Drive, or the World Wide Web, you must
include the following notice in any electronic versions, either adjacent to the reprinted AAAS
material or in the terms and conditions for use of your electronic products: "Readers may view,
browse, and/or download material for temporary copying purposes only, provided these uses are for
noncommercial personal purposes. Except as provided by law, this material may not be further
reproduced, distributed, transmitted, modified, adapted, performed, displayed, published, or sold in
whole or in part, without prior written permission from the publisher." Access to any such CD,
DVD, Flash Drive or Web page must be restricted to your organization's employees only.
FOR CME COURSE and SCIENTIFIC SOCIETY MEETINGS: Permission is restricted to the particular Course, Seminar, Conference, or Meeting indicated in your
request. If this license covers a text excerpt or a Full Text Article, access to the reprinted AAAS
material must be restricted to attendees of your event only (if you have been granted electronic
rights for use of a full text article on your website, your website must be password protected, or
access restricted so that only attendees can access the content on your site).
If you are using AAAS Material on a CD, DVD, Flash Drive, or the World Wide Web, you must
include the following notice in any electronic versions, either adjacent to the reprinted AAAS
material or in the terms and conditions for use of your electronic products: "Readers may view,
155
browse, and/or download material for temporary copying purposes only, provided these uses are for
noncommercial personal purposes. Except as provided by law, this material may not be further
reproduced, distributed, transmitted, modified, adapted, performed, displayed, published, or sold in
whole or in part, without prior written permission from the publisher."
FOR POLICY REPORTS: These rights are granted only to non-profit organizations and/or government agencies. Permission
covers print and electronic versions of a report, provided the required credit line appears in both
versions and provided the AAAS material reproduced as permitted herein remains in situ and is not
exploited separately.
FOR CLASSROOM PHOTOCOPIES: Permission covers distribution in print copy format only. Article copies must be freestanding and
not part of a course pack. They may not be physically attached to anything or have anything
attached to them.
FOR COURSEPACKS OR COURSE WEBSITES: These rights cover use of the AAAS material in one class at one institution. Permission is valid only
for a single semester after which the AAAS material must be removed from the Electronic Course
website, unless new permission is obtained for an additional semester. If the material is to be
distributed online, access must be restricted to students and instructors enrolled in that particular
course by some means of password or access control.
FOR WEBSITES: You must include the following notice in any electronic versions, either adjacent to the reprinted
AAAS material or in the terms and conditions for use of your electronic products: "Readers may
view, browse, and/or download material for temporary copying purposes only, provided these uses
are for noncommercial personal purposes. Except as provided by law, this material may not be
further reproduced, distributed, transmitted, modified, adapted, performed, displayed, published, or
sold in whole or in part, without prior written permission from the publisher."
Permissions for the use of Full Text articles on third party websites are granted on a case by case
basis and only in cases where access to the AAAS Material is restricted by some means of password
or access control. Alternately, an E-Print may be purchased through our reprints department.
REGARDING FULL TEXT ARTICLE USE ON THE WORLD WIDE WEB IF YOU ARE AN
„ORIGINAL AUTHOR‟ OF A SCIENCE PAPER
If you chose "Original Author" as the Requestor Type, you are warranting that you are one of
authors listed on the License Agreement as a "Licensed content author" or that you are acting on
that author's behalf to use the Licensed content in a new work that one of the authors listed on the
License Agreement as a "Licensed content author" has written.
Original Authors may post the „Accepted Version‟ of their full text article on their personal or on
their University website and not on any other website. The „Accepted Version‟ is the version of the
paper accepted for publication by AAAS including changes resulting from peer review but prior to
AAAS‟s copy editing and production (in other words not the AAAS published version).
156
FOR MOVIES / FILM / TELEVISION: Permission is granted to use, record, film, photograph, and/or tape the AAAS material in connection
with your program/film and in any medium your program/film may be shown or heard, including
but not limited to broadcast and cable television, radio, print, world wide web, and videocassette.
The required credit line should run in the program/film's end credits.
FOR MUSEUM EXHIBITIONS: Permission is granted to use the AAAS material as part of a single exhibition for the duration of that
exhibit. Permission for use of the material in promotional materials for the exhibit must be cleared
separately with AAAS.
FOR TRANSLATIONS: Translation rights apply only to the language identified in your request summary above.
The following disclaimer must appear with your translation, on the first page of the article, after the
credit line: "This translation is not an official translation by AAAS staff, nor is it endorsed by
AAAS as accurate. In crucial matters, please refer to the official English-language version originally
published by AAAS."
FOR USE ON A COVER: Permission is granted to use the AAAS material on the cover of a journal issue, newsletter issue,
book, textbook, or annual report in print and electronic formats provided the AAAS material
reproduced as permitted herein remains in situ and is not exploited separately
By using the AAAS Material identified in your request, you agree to abide by all the terms and
conditions herein.
Questions about these terms can be directed to the AAAS Permissions department.
v 2 Gratis licenses (referencing $0 in the Total field) are free. Please retain this printable
license for your reference. No payment is required.
157
Dear Lara,
Permission is granted with no charge.
The acknowledgement should state "reproduced / adapted with permission" and give the source
journal name - the acknowledgement should either provide full citation details or refer to the relevant
citation in the article reference list - the full citation details should include authors, journal, year,
volume, issue and page citation.
Where appearing online or in other electronic media, a link should be provided to the original article
(e.g. via DOI):-
Journal of Cell Science: jcs.biologists.org
Best wishes,
Sue Chamberlain
On 16/2/11 00:44, "Lara Kouri" wrote:
Hi Mr. Birch,
I am a graduate student writing my thesis at the University of Ottawa and I would really like to
have permission to reprint a figure from the following paper: Chen, J., Callis, T., & Wang, D.
(2009). microRNAs and Muscle Disorders. The Journal of Cell Science, 122, 13-20.
Looking forward to hear from you,
Lara Kouri

158
CURRICULUM VITAE

159
Lara Kouri
Summary of Qualifications Master’s of Science in Biochemistry Canadian Citizen Fluent in both official languages
Great research and analytical skills Motivated, efficient, diligent and committed Effective and professional communicator
Education M.Sc. Biochemistry June 2011
Cardiogenomic Perinatal Programming, Supervisor: Dr. Patrick Burgon University of Ottawa Heart Institute, Ontario
B.Sc. Honours Biochemistry / Minor in Business Administration 2008
University of Ottawa, Ontario
WHMIS, Health and Safety, Animal Care, and Radiation Safety Training 2008-2010
University of Ottawa, Ontario Ontario Secondary School Diploma - Concentration in Science 2003
Collège catholique Samuel-Genest, Ontario
Academic Awards and Achievements University of Ottawa Admission Scholarship Fellowships for Studying in French scholarship Two Msgr. Habib Kwaiter Scholarship Foundation scholarship Honour scholarship Merit Scholarship from the University of Ottawa
Association of Part-Time Professors of the University of Ottawa Award 2nd place: 2007 Business Plan Competition hosted by the National Bank of Canada Dean's Honour List University of Ottawa graduate school Admission Scholarship
Cash With Admission (CWA) Textbook and Technology Grant
Ontario Graduate Scholarship (OGS) University of Ottawa National Excellence Scholarship CIHR Frederick Banting and Charles Best Canada Graduate Scholarship Master's Award Dean’s Scholarship – Master’s with Thesis
Employment Experience University of Ottawa Heart Institute Summer Student Summer 2007, 2008
University of Ottawa Heart Institute Research Corporation, Ontario Research laboratory assistant in lipoprotein and atherosclerosis (2007, Dr. Sparks) and
cardiovascular endocrinology (2008, Dr. Burgon). Set up and conduct biochemical experiments; operate and maintain laboratory equipment;
prepare solutions, reagents, and sample formulations; compile and interpret experimental results; assist in developing and conducting sampling and analysis; optimize protocols.
Perfected techniques: tissue culture, immunoblotting, electrophoresis (denaturing, native, lipid profiling), ELISA, radiolabelling, protein and lipid quantification, PCR, real-time PCR, sequencing, cloning, RNA extraction.
University of Ottawa Forensic Medicine Laboratory Technician May 5-6 2007
University of Ottawa, Ontario Research laboratory assistant: conduct a molecular biology and forensic medicine experiment
to High School students in order to encourage them to study in Sciences (Dr. John Basso).

160
NSERC Summer Student Summer 2006
NSERC, Ontario Administrative tasks: enter and process applications in the database. Special projects: summarize information from internship files; test and comment the on-line
application system; assemble company eligibility; create feedback letters; edit referee reports according to the Privacy Act.
Program assistant for the Visiting Fellowship program: processing applications; handling daily email and telephone inquiries from international applicants; liaison between postdoctoral fellows and program coordinators working in other partner government departments.
Customer Service Specialist 2000 - 2008
Pronto-Ultramar, Ontario Supervisor: recognize strengths and limitations of others; plan, organize and monitor
activities according to priorities; organize work autonomously or as part of a team. Control and adapt to interruptions, plan changes, issues and repetition without losing
efficiency or composure. Train new employees according to the company's standards.
Mathematics Tutor 2003 - 2007
Collège catholique Samuel-Genest students, Ontario Work comfortably with figures. Identify and correct mathematical errors. Provide test and final exam preparation. Develop students' abilities to achieve higher quotas.
Skills Excellent knowledge of laboratory tools, data analysis, experimental design, equipment &
procedures in biochemistry, genomics & molecular biology:
o Nucleic acid (including microRNA) & protein extraction from tissue & cells
o Primer design
o RT-PCR, Real-Time PCR o Immunological methods
(Western Blot, ELISA, immunohistochemistry,
immunofluorescence)
o Radioactivity assays o Exon & microRNA microarray
experiments o Sequencing & cloning
o Mammalian cell culture Experience working in a level 2 risk facility including hands-on experience in handling &
working with mice.
Providing training & technical guidance to students & colleagues. Excellent organizational, prioritization & time management skills. Interact, co-operate & communicate effectively & professionally with customers, the public &
co-workers. Thorough editing & providing feedback of manuscripts for publication in peer-reviewed
scientific journals & grants.
Committed to maintaining quality & efficiency. Experience in contributing to multidisciplinary teams. Strong ability to learn & apply new information. Pursue goals with diligence & take pride in accomplishments. Experience in conducting scientific literature searches & in working with scientific data (critical
evaluation, analysis, interpretation, optimization, troubleshooting). Preparation of clear & concise documents summarizing & analyzing key scientific information.
Analysis & development of scientific material in the form of presentations, technical reports, protocols & theses.
Good knowledge of statistical analysis & interpretation of microarray (gene, exon & microRNA) & common laboratory data.
Experience in application of computer software. Software skills: Microsoft Office, Flexarray, Partek® Genomics Suite, Affymetrix® Expression ConsoleTM, NAMIS, Adobe, SigmaPlot.
At ease with Windows & Apple operating systems.
Comfortable with bioinformatic sites: PubMed, DAVID Bioinformatics Resources 6.7 Microarray Analysis, TargetScan, miRBase, BLAST, UCSC BLAT, Primer3, Protein Data Bank etc.

161
Conferences/Seminars Attended the "Small RNAs: Biology and Technology" symposium at the Université de
Montréal, Institute for Research in Immunology and Cancer (IRIC), Montréal, Québec, June 2008.
Poster presentation at the "Making Muscle in the Embryo and Adult" meeting at the Columbia University in New York, New York, June 2009.
Poster presentation at "The Ottawa Conference on New Directions in Biology and Disease of Skeletal Muscle", Ottawa, Ontario, May 2010.
Oral presentation at the "UOHI Research Day" at the University of Ottawa Heart Institute in Ottawa, Ontario, May 2010.
Accepted abstract for poster presentation to "OzBio 2010: The Molecules of Life - from Discovery to Biotechnology", Melbourne, Australia, September 2010.
Publications Pandey NR, Renwick J, Rabaa S, Misquith A, Kouri L, Twomey E, Sparks DL. "An Induction in
Hepatic HDL Secretion Associated with Reduced ATPase Expression" published by The
American Journal of Pathology; October 2009, 1777-87. Ahmady E, Deeke SA, Rabaa S, Kouri L, Kenney L, Stewart AFR, Burgon P. "Identification of
a novel muscle enriched a-type lamin interacting protein (MLIP)" published by The Journal of
Biological Chemistry, April 2011.
Volunteer Experience Ultimate Canadian Marathon - Carleton Cup Volunteer 2009, 2010, 2011
Canadian Cystic Fibrosis Foundation, Ontario Register and inform racers, collect pledges and merchandise sales, collect waivers for the CCF
"Skate, Run, Drink" Triathlon. Lanopolis 4.0 Event Logistics Assistant October 2007
University of Ottawa, Ontario Assist in administrative and logistical planning.
Attend meetings to organize the event.
Canadian Cancer Society Volunteer Summer 2005 Canadian Cancer Center, Ontario
Aid in administrative tasks at the Radiation Therapy desk and at the Blood Laboratory. Greet patients and connect them with the services they require.
Quickly grasp new concepts, approaches and systems. Networking Cocktail Representative April 27, 2005
University of Ottawa, Ontario Helpful resource for the recruiters and the students.
Science Career Fair Representative January 27, 2005
University of Ottawa, Ontario Be a resource for the recruiters and the students.
Camp Counsellor Summer 2002
Patro d'Ottawa, Ontario Children's monitor; assist other counsellors; provide play-time fun. Maintain composure, effectiveness, and flexibility under pressure.