Embed Size (px)
Citation preview
IDENTIFYING HEALTH DISPARITIES TO ACHIEVE HEALTH EQUITY IN SAN DIEGO
COUNTY: EXECUTIVE SUMMARY
March 2016
Iden fying Health Dispari es to Achieve Health Equity in San Diego County
Iden fying Health Dispari es to Achieve Health Equity
in San Diego County: Execu ve Summary
County of San Diego
Health and Human Services Agency Public Health Services
March 2016
For addi onal informa on, contact:
Community Health Sta s cs Unit 6255 Mission Gorge Road San Diego, CA 92120
(619) 285‐6479 www.SDHealthSta s cs.com
Iden fying Health Dispari es to Achieve Health Equity in San Diego County
Iden fying Health Dispari es to Achieve Health Equity in San Diego
County: Execu ve Summary
Suggested Cita on: County of San Diego, Health and Human Services Agency, Public Health Services, Community Health Sta s cs Unit. (2016). Iden fying Health Dispari es to Achieve Health Equity in San Diego County: Execu ve Summary. Retrieved MM/DD/YY from www.SDHealthSta s cs.com.
QR CODES: QR codes are similar to barcodes. Use your smart phone to scan the QR Code and navigate directly to the report online for download. Download a free QR code reader from your app provider.
RON ROBERTS CHAIRMAN, FOURTH DISTRICT
SAN DIEGO COUNTY BOARD OF SUPERVISORS
COUNTY ADMINISTRATION CENTER • 1600 PACIFIC HIGHWAY, ROOM 335 • SAN DIEGO, CALIFORNIA 92101 (619) 531-5544 • FAX (619) 685-2252 • E-MAIL [email protected] • www.ronroberts.com
Dear Fellow San Diego County Residents:
The health and wellbeing of most Americans has improved
significantly over the past century; however, some groups
continue to experience a higher rate of death and illness.
The Identifying Health Disparities to Achieve Health Equity
in San Diego County report was developed to identify those
San Diegans who, because of their age, gender, geography,
race/ethnicity or socioeconomic status are experiencing a
disproportionate burden of disease. It describes some of the lifestyle behaviors and other relevant
factors that may contribute to these disparities, as well as prevention strategies to help all San
Diegans live well.
Health equity is a key component of the Live Well San Diego vision in San Diego County.
Addressing health disparities is essential to increasing and ultimately achieving health equity for
our nearly 3.2 million residents. This document is designed for local agencies, organizations,
groups, services and individuals who have an interest in improving the health of county
residents. Using the information gathered in this report, we can work together to support healthy
choices and improve the lives of San Diego residents.
Sincerely,
RON ROBERTS
Chairman
San Diego County Board of Supervisors
Iden fying Health Dispari es to Achieve Health Equity in San Diego County
This report represents a collabora ve effort between many dedicated individuals within the Health and Human Services Agency. We gratefully acknowledge the contribu ons of the following people: Sanaa Abedin, MPH‐ Emergency Medical Services Isabel Corcos, PhD, MPH‐ Emergency Medical Services Kim De Vera, MPH‐ Community Health Sta s cs Lorri Freitas, MPH‐ Epidemiology and Immuniza on Services Lacey Hicks, MPH‐ Epidemiology and Immuniza on Services Su da (Nid) Jariangprasert, MPH‐ Maternal, Child and Family Health Services Jeff Johnson, MPH‐ Epidemiology and Immuniza on Services Amelia Kenner‐Brininger, MPH, CPH‐ Emergency Medical Services Marisa Moore, MD, MPH‐ Tuberculosis Control Maria Peña, MPH‐ Community Health Sta s cs Leslie Ray, MPH, MPPA, MA‐ Community Health Sta s cs, Emergency Medical Services Marjorie Richardson, MPH‐ HIV, STD and Hepa s Branch Alicia Sampson, MPH, CPH‐ Community Health Sta s cs Joshua Smith, PhD, MPH‐ Emergency Medical Services Ryan Smith, MPH‐ Community Health Sta s cs Barbara Stepanski, MPH‐ Emergency Medical Services Samantha Tweeten, PhD, MPH‐ Epidemiology and Immuniza on Services Wendy Wang, MPH‐ Epidemiology and Immuniza on Services Jessica Yen, MPH‐ Epidemiology and Immuniza on Services
Thank you to the following individuals for their leadership and support in making this project possible: Nick Macchione, MS, MPH, FACHE‐ Director, Health and Human Services Agency Wilma J. Wooten, MD, MPH‐ Public Health Officer and Director, Public Health Services Sayone Thihalolipavan, MD, MPH‐ Deputy Public Health Officer Eric McDonald, MD, MPH‐ Medical Director Marcy Metz, RN, CEN‐ Chief of Emergency Medical Services
Acknowledgements
Acknowledgements
i
Execu
ve Summary
Iden fying Health Dispari es to Achieve Health Equity in San Diego County
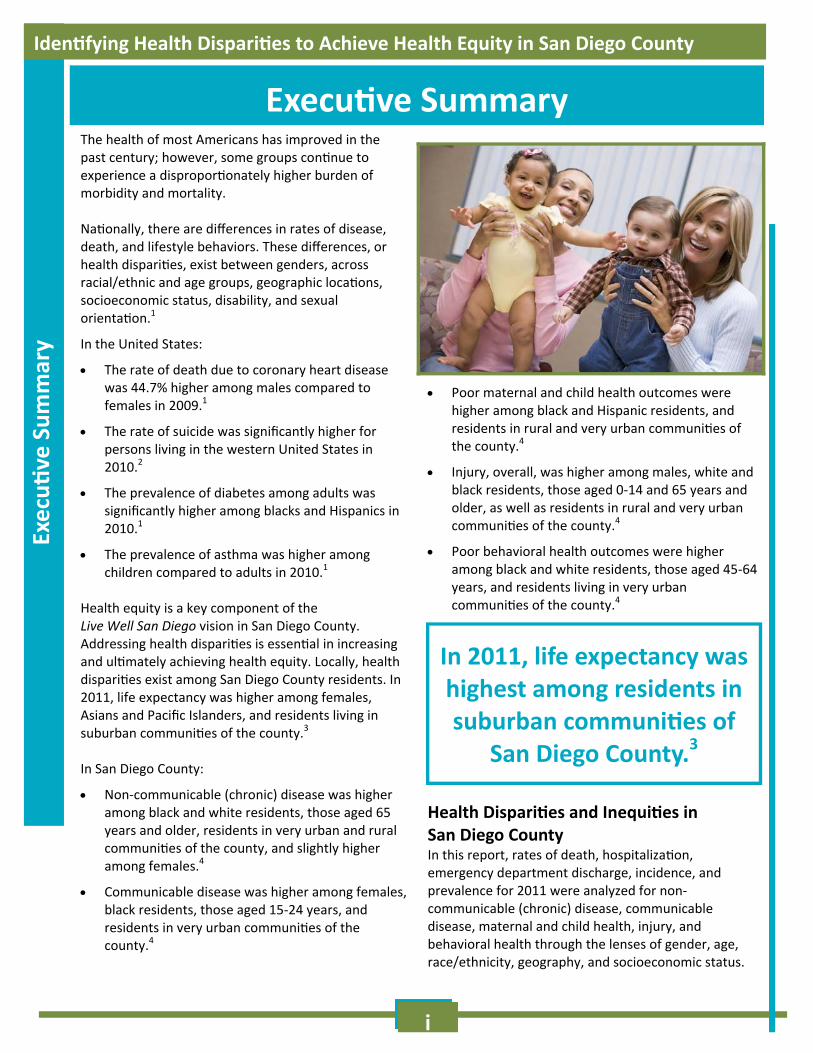
Poor maternal and child health outcomes were higher among black and Hispanic residents, and residents in rural and very urban communi es of the county.4
Injury, overall, was higher among males, white and black residents, those aged 0‐14 and 65 years and older, as well as residents in rural and very urban communi es of the county.4
Poor behavioral health outcomes were higher among black and white residents, those aged 45‐64 years, and residents living in very urban communi es of the county.4
Health Dispari es and Inequi es in San Diego County In this report, rates of death, hospitaliza on, emergency department discharge, incidence, and prevalence for 2011 were analyzed for non‐communicable (chronic) disease, communicable disease, maternal and child health, injury, and behavioral health through the lenses of gender, age, race/ethnicity, geography, and socioeconomic status.
The health of most Americans has improved in the past century; however, some groups con nue to experience a dispropor onately higher burden of morbidity and mortality. Na onally, there are differences in rates of disease, death, and lifestyle behaviors. These differences, or health dispari es, exist between genders, across racial/ethnic and age groups, geographic loca ons, socioeconomic status, disability, and sexual orienta on.1
In the United States:
The rate of death due to coronary heart disease was 44.7% higher among males compared to females in 2009.1
The rate of suicide was significantly higher for persons living in the western United States in 2010.2
The prevalence of diabetes among adults was significantly higher among blacks and Hispanics in 2010.1
The prevalence of asthma was higher among children compared to adults in 2010.1
Health equity is a key component of the Live Well San Diego vision in San Diego County. Addressing health dispari es is essen al in increasing and ul mately achieving health equity. Locally, health dispari es exist among San Diego County residents. In 2011, life expectancy was higher among females, Asians and Pacific Islanders, and residents living in suburban communi es of the county.3 In San Diego County:
Non‐communicable (chronic) disease was higher among black and white residents, those aged 65 years and older, residents in very urban and rural communi es of the county, and slightly higher among females.4
Communicable disease was higher among females, black residents, those aged 15‐24 years, and residents in very urban communi es of the county.4
In 2011, life expectancy was highest among residents in suburban communi es of
San Diego County.3
Execu ve Summary
ii
Execu
ve Summary
Iden fying Health Dispari es to Achieve Health Equity in San Diego County
Age Non‐communicable (chronic) disease rates were
222% higher among residents aged 65 years and older compared to the county overall. Rates of coronary heart disease (CHD), stroke,
diabetes, asthma, cancer, chronic obstruc ve pulmonary disease (COPD), arthri s, dorsopathy, and Parkinson’s disease were all higher among residents aged 65 years and older.
Communicable disease rates were 100% higher among residents aged 15‐24 years compared to the county overall.
Rates of reported chlamydia, gonorrhea, and emergency department discharge due to influenza (flu) were notably higher among residents aged 15‐24 years.
Injury rates were 13% higher among children aged 0‐14 years and 49% higher among residents aged 65 years and older compared to the county overall.
Rates of overall uninten onal injury and fall‐related injury were notably higher among children aged 0‐14 years.
Rates of uninten onal fall‐related injury, uninten onal overdose/poisoning, uninten onal motor vehicle‐related injury, uninten onal pedestrian injury, and firearm‐related injury were notably higher among residents aged 65 years and over.
Poor behavioral health outcome rates were 26% higher among residents aged 45‐64 years compared to the county overall.
Rates of suicide, schizophrenia and other psycho c disorders were notably higher among residents aged 45‐64 years.
Acute and chronic alcohol‐related disorders
were notably higher among residents aged 45‐64 years.
Gender Non‐communicable (chronic) disease rates were
9% higher among females compared to males.
Rates of stroke, asthma, chronic obstruc ve pulmonary disease (COPD), arthri s, and dorsopathy were notably higher among females compared to males.
Communicable disease rates were 19% higher among females compared to males.
Rates of reported chlamydia, as well as influenza (flu), were notably higher among females compared to males.
Injury rates were 12% higher among males compared to females.
Rates of uninten onal overdose/poisoning, uninten onal motor vehicle‐related injury, uninten onal pedestrian injury, homicide and assault, and firearm‐related injury were notably higher among males compared to females.
Poor behavioral health outcome rates were 4% higher among males compared to females.
Rates of suicide, a en on deficit and impulse control disorders, schizophrenia and other psycho c disorders were notably higher among males compared to females.
Rates of acute and chronic alcohol‐related as well as substance‐related disorders were notably higher among males compared to females.
Overall, injury rates were 49% higher among residents aged 65 years and older compared to the county
overall in 2011.
iii
Execu
ve Summary
Iden fying Health Dispari es to Achieve Health Equity in San Diego County
Poor maternal and child health outcomes were 11% and 23% higher among very urban and rural community residents, respec vely, compared to the county overall.
The percentages of teen births as well as fetal and infant mortality rates were notably higher among very urban community residents.
The percentages for lack of early prenatal care, preterm births, very low birth weight births, and rates for fetal and infant mortality were notably higher among rural community residents.
Poor behavioral health outcomes were 37% higher among very urban residents compared to the county overall.
Rates of self‐inflicted injury, suicide, uninten onal overdose/poisoning, anxiety disorders, mood disorders, schizophrenia and psycho c disorders, as well as acute and chronic alcohol and substance‐related disorders were all notably higher among very urban community residents.
Race/Ethnicity Non‐communicable (chronic) disease rates were
109% and 16% higher among black and white residents, respec vely, compared to the county overall.
Rates of coronary heart disease (CHD), stroke, diabetes, chronic obstruc ve pulmonary disease (COPD), asthma, arthri s, and dorsopathy were notably higher among black residents.
Rates of CHD, stroke, COPD, cancer, arthri s, dorsopathy, and Parkinson’s Disease were notably higher among white residents.
Communicable disease rates were 68% higher among black residents compared to the county overall.
Rates of reported chlamydia, gonorrhea, and syphilis were notably higher among black residents.
Rates of influenza (flu) and pneumonia were notably higher among black residents.
Injury rates were 57% and 11% higher among black and white residents, respec vely, compared to the county overall.
Geography Non‐communicable (chronic) disease rates were
35% higher among residents in very urban communi es compared to the county overall.
Rates of coronary heart disease (CHD), diabetes, asthma, chronic obstruc ve pulmonary disease (COPD), arthri s, and dorsopathy were notably higher among very urban community residents.
Communicable disease rates were 36% higher among very urban community residents compared to the county overall.
Rates of reported tuberculosis, chlamydia, gonorrhea, and syphilis, as well as influenza (flu) and pneumonia, were notably higher among very urban community residents.
Injury rates were 25% and 10% higher among very urban and rural community residents, respec vely, compared to the county overall.
Rates of uninten onal fall‐related injury, uninten onal overdose/poisoning, uninten onal motor vehicle‐related injury, uninten onal pedestrian injury, homicide and assault injury, and firearm‐related injury were notably higher among very urban community residents.
Rates of uninten onal fall‐related injury, uninten onal overdose/poisoning, uninten onal motor vehicle‐related injury, homicide, and firearm‐related injury were notably higher among rural community residents.
Non‐communicable (chronic) disease rates were 24% higher among very urban community residents
compared to the county overall.
iv
Execu
ve Summary
Iden fying Health Dispari es to Achieve Health Equity in San Diego County
Rates of uninten onal overdose/poisoning, uninten onal motor vehicle‐related injury, uninten onal pedestrian injury, homicide and assault, and firearm‐related injury were considerably higher among black residents.
Rates of uninten onal fall related injury, uninten onal overdose/poisoning, uninten onal motor vehicle‐related injury, and firearm‐related injury were slightly higher among white residents.
Poor maternal and child health outcomes were 33% and 15% higher among black and Hispanic residents, respec vely, compared to the county overall.
The percentages of preterm births, low birth weight births, very low birth weight births, and fetal and infant mortality rates were significantly higher among black residents.
The percentage of teen births was notably higher among Hispanic residents.
Poor behavioral health rates were 76% and 30% higher among black and white residents, respec vely, compared to the county overall.
Rates of self‐inflicted injury, a en on deficit disorders (including conduct and disrup ve disorders), impulse control disorders, anxiety disorders, mood disorders, schizophrenia and other psycho c disorders, as well as acute substance‐related disorders were significantly higher among black residents.
Rates of suicide and self‐inflicted injury, Alzheimer’s Disease, a en on deficit disorders (including conduct and disrup ve disorders), impulse disorders, mood disorders, personality disorders, schizophrenia and psycho c disorders, as well as acute and chronic alcohol and substance‐related disorders were notably higher among white residents.
Socioeconomic Status Non‐communicable (chronic) disease rates were
41% and 20% higher among residents in lowest and low income groups, respec vely, compared to the county overall.
Rates of coronary heart disease (CHD), stroke, diabetes, asthma, chronic obstruc ve pulmonary disease (COPD), cancer deaths, arthri s, dorsopathy, and Parkinson’s Disease were notably higher among the lowest income residents.
Rates of CHD, diabetes, asthma, COPD, arthri s, dorsopathy, and Parkinson’s Disease were slightly higher among the low income group residents.
Communicable disease rates were 39% and 21% higher among residents in lowest and low income groups, respec vely, compared to the county overall.
Rates of reported tuberculosis, chlamydia, gonorrhea, and syphilis, as well as influenza (flu) and pneumonia were notably higher among the lowest income group residents .
Rates of reported tuberculosis, hepa s C, chlamydia, gonorrhea, and syphilis, as well as influenza (flu) and pneumonia were slightly higher among low income group residents.
Injury rates were 32% and 11% higher among lowest and low income group residents, respec vely, compared to the county overall.
Rates of uninten onal fall‐related injury, overdose/poisoning, motor vehicle‐related injury, pedestrian injury, other uninten onal injuries, and inten onal injuries of homicide, assault, and firearm‐related injuries were notably higher among lowest income group residents.
v
Execu
ve Summary
Iden fying Health Dispari es to Achieve Health Equity in San Diego County
Rates of uninten onal overdose/poisoning, uninten onal pedestrian injuries, and inten onal injuries of homicide, assault, and firearm‐related injuries were slightly higher among low income group residents.
Poor maternal and child health outcomes were 8% and 10% higher among the lowest and low income residents, respec vely, compared to the county overall.
The percentages of teen births as well as fetal and infant mortality rates were notably higher among lowest income group residents.
The percentages of teen births and fetal and infant mortality rates were also notably higher among low income group residents.
Poor behavioral health rates were 20% and 29% higher among lowest and low income group residents, respec vely, compared to the county overall.
Rates of uninten onal overdose/poisoning, anxiety disorders, a en on deficit disorders (ADD), developmental/childhood disorders, mood disorders, as well as schizophrenia and other psychoses were notably higher among lowest income group residents.
Rates of suicide/self inflicted injuries, uninten onal overdose/poisoning, anxiety disorders, developmental/childhood disorders, personality disorders, mood disorders, schizophrenia and other psychoses, acute and chronic alcohol‐related disorders, as well as acute and chronic substance‐related disorders were notably higher among low income group residents.
Goal of the Report Health dispari es are important indicators of community health. This report aims to iden fy health dispari es and inequi es that exist in San Diego County through the lenses of age, gender, geography, race/ethnicity, and socioeconomic status. Addi onally, this report describes some of the lifestyle behaviors and other relevant factors that may contribute to these dispari es, as well as preven on strategies to help San Diegans live well.
References 1. Centers for Disease Control and Preven on. CDC
Health Dispari es and Inequali es Report—United States, 2011. MMWR 2011;60(Suppl), h p://www.cdc.gov/mmwr/pdf/other/su6001.pdf (Accessed September 30, 2013).
2. Centers for Disease Control and Preven on, Na onal Center for Health Sta s cs. Compressed Mortality File 1999‐2013 on CDC WONDER Online Database, released October 2014. Data are from the Compressed Mortality File 1999‐2013 Series 20 No. 2S, 2014, as compiled from data provided by the 57 vital sta s cs jurisdic ons through the Vital Sta s cs Coopera ve Program. Accessed at h p://wonder.cdc.gov/cmf‐icd10.html.
3. County of San Diego, Health and Human Services Agency, Public Health Services, Epidemiology & Immuniza on Services Branch (EISB). San Diego County Life Expectancy at Birth by SRA—2011 (Preliminary), 2013.
4. County of San Diego, Health and Human Services Agency, Public Health Services, Community Health Sta s cs Unit (CHSU). San Diego County Community Profiles, 2013.

vi
Acons to L
ive
Wel
l Sa
n D
ieg
o
Iden fying Health Dispari es to Achieve Health Equity in San Diego County
Crea ng an environment that encourage residents to live healthy, safe, and thriving lives is a priority in San Diego County. Live Well San Diego plans to advance the health and overall well‐being of all San Diegans through a collec ve effort that involves residents, community and faith‐based organiza ons, businesses, schools, law enforcement, local city and tribal jurisdic‐ons, and the County of San Diego.
Live Well San Diego is a framework to help achieve health equity among all residents. To learn more, visit www.LiveWellSD.org.
Non‐Communicable (Chronic) Disease Elimina ng tobacco use, adop ng ac ve lifestyles, ea ng healthier diets, and decreasing excessive use of alcohol are key transforma ons that can reduce the burden of non‐communicable (chronic) disease among San Diego County residents.1 For more local data and sta s cs on non‐communicable (chronic) disease, visit the San Diego County Community Profiles—Non‐Communicable Disease Profile. For informa on on non‐communicable (chronic) disease, visit the County of San Diego’s Community Health Sta s cs website at www.SDHealthSta s cs.com, and view the Disease Informa on sec on.
Communicable Disease Taking protec ve measures including vaccina on and avoiding close contact with sick individuals, seeking tes ng and early treatment, and visi ng a doctor regu‐larly are key strategies that can reduce the burden of communicable disease among San Diegans.2
For more local data and sta s cs on communicable disease, please go to the San Diego County Community Profiles—Communicable Disease Profile. For more informa on on communicable disease, visit the County of San Diego’s Epidemiology and Immuniza on Services Branch.
Maternal and Child Health The health of mothers, infants, and children are key indicators of the health of the community overall. Health outcomes o en reflect the health of future genera ons as well as emerging public health con‐cerns.3 Preven on measures such as increased nutri‐on, early prenatal care, and cessa on of smoking,
drinking, and illicit drug use are all key ways to im‐prove maternal and child health.2 For more local data and sta s cs on maternal and child health outcomes, visit the San Diego County Community Profiles—Maternal and Child Health Pro‐file. For more informa on on maternal and child health outcomes, visit the County of San Diego’s Maternal, Child and Family Health Services Branch.
Injury Of the major causes of disability and death, injuries are among the most preventable. Increased safety educa‐on, awareness of fall preven on strategies, and in‐
ves ng in safer communi es are key ways to reduce the burden of injury among county residents.4 For more local data and sta s cs on injury, visit the San Diego County Community Profiles—Injury Profile. For more informa on on injury, visit the County of San Diego’s Emergency Medical Services Branch.
Behavioral Health Seeking help for an emo onal, behavioral health, or alcohol/drug problem, engaging in ac vi es to reduce stress, avoiding social isola on, and fostering environ‐ments that reduce the s gma of behavioral health is‐sues are major preven on strategies that can help re‐duce poor behavioral health outcomes among San Die‐gans.5
For more local data and sta s cs on behavioral health, visit the San Diego County Community Profiles—Behavioral Health Profile. For more informa on on behavioral health outcomes, visit the County of San Diego’s Behavioral Health Services Division.
Ac ons to Live Well San Diego
vii
References
Iden fying Health Dispari es to Achieve Health Equity in San Diego County
1. Centers for Disease Control and Prevention. Chronic Disease Prevention and Health Promotion. “Chronic Diseases and Health Promotion,” http://www.cdc.gov/chronicdisease/overview/index.htm (Accessed September 4, 2013).
2. U.S. Department of Health and Human Services. Healthy People 2020: Topics and Objectives. http://www.healthypeople.gov/2020/default.aspx (Accessed September 4, 2013).
3. Centers for Disease Control and Prevention. Morbidity and Mortality Weekly Report, “Vital Signs: Health Insurance Coverage and Health Care Utilization – United States, 2006-2009 and January – March 2010,” http://www.cdc.gov/mmwr/pdf/wk/mm59e1109.pdf (Accessed September 30, 2013).
4. Centers for Disease Control and Prevention. Injury Prevention & Control, “Injury and Violence Prevention: A Pressing Public Health Concern,” http://www.cdc.gov/injury/overview/index.html (Accessed September 4, 2013).
5. U.S. Department of Health and Human Services. Office of the Surgeon General. National Prevention Council, National Prevention Strategy. Washington, D.C, 2011. http://www.surgeongeneral.gov/initiatives/prevention/strategy/report.pdf (Accessed September 30, 2013).
References

Greg Cox District 1
Dianne Jacob District 2
Vice Chairwoman
County of San Diego Board of Supervisors
Dave Roberts District 3
Ron Roberts District 4
Chair
Bill Horn District 5


![Rom~nii din Bugeac pe cale de dispari]ie](https://img.pdfslide.net/doc/110x75/588dbe911a28ab26218bdfc7/romnii-din-bugeac-pe-cale-de-dispariie.jpg)