Embed Size (px)
Citation preview

Journal of Public Transportation, Vol. 20, No. 1, 2017 63
Identifying Key Factors of Rail Transit Service Quality:
An Empirical Analysis for Istanbul
Erkan IsikliIstanbul Technical University
Nezir AydinYildiz Technical University
Erkan CelikMunzur University
Alev Taskin GumusYildiz Technical University
Abstract
Providing a high quality of service in public transportation is essential to reduce dissatisfactions stemming from traffic congestion and noise. Public transport providers need to find ways to dilute the effects of immoderate use of private cars in big cities while maintaining a sufficient level of customer satisfaction. This study aimed to identify the key service quality (SQ) factors that drive passenger satisfaction in Istanbul’s rail transit (RT) system using data obtained from an extensive survey conducted by the Istanbul Public Transportation Co. A total of 11,116 passengers who used rail transport from May 15–June 3, 2012, and June 17–July 3, 2013, were interviewed in person. The relative importance of the SQ factors was assessed so that service provision could be prioritized and the enhancement of passenger satisfaction can be achieved employing several social choice techniques. The results indicate that, from an overall perspective, waiting time, crowdedness in cars, and fare are the SQ factors that best reflect the public good.
Keywords: Service quality; public transportation; rail transit systems; stated preferences; fallback voting; Istanbul

Identifying Key Factors of Rail Transit Service Quality: An Empirical Analysis for Istanbul
Journal of Public Transportation, Vol. 20, No. 1, 2017 64
Introduction
Public transportation (PT) is a cost-effective solution for traffic congestion, especially in crowded areas, and its improvement is of critical importance to city governance and decisionmakers. As with many other PT services, rail transit (RT) systems should also hear the voice of the customer since decisionmakers need to create an efficient system to promote public transport use (Gronau and Kagermeier 2007; Le-Klähn et al. 2014).
With its 14.3 million inhabitants and a high level of socio-economic development, Istanbul is the heart of Turkey. The daytime population of this metropolis increases as many people commute from neighboring cities to Istanbul, which increases traffic congestion. The city’s population is expected to increase to nearly 15 million by 2019 and 16 million by 2023, according to the Turkish Statistical Institute (2015). Economic recovery and improvement in the standard of living makes passengers expect better PT services (bus rapid transit, rail transit, etc.). People prefer PT to avoid traffic congestion, noise, and long waiting times, especially during rush hours.
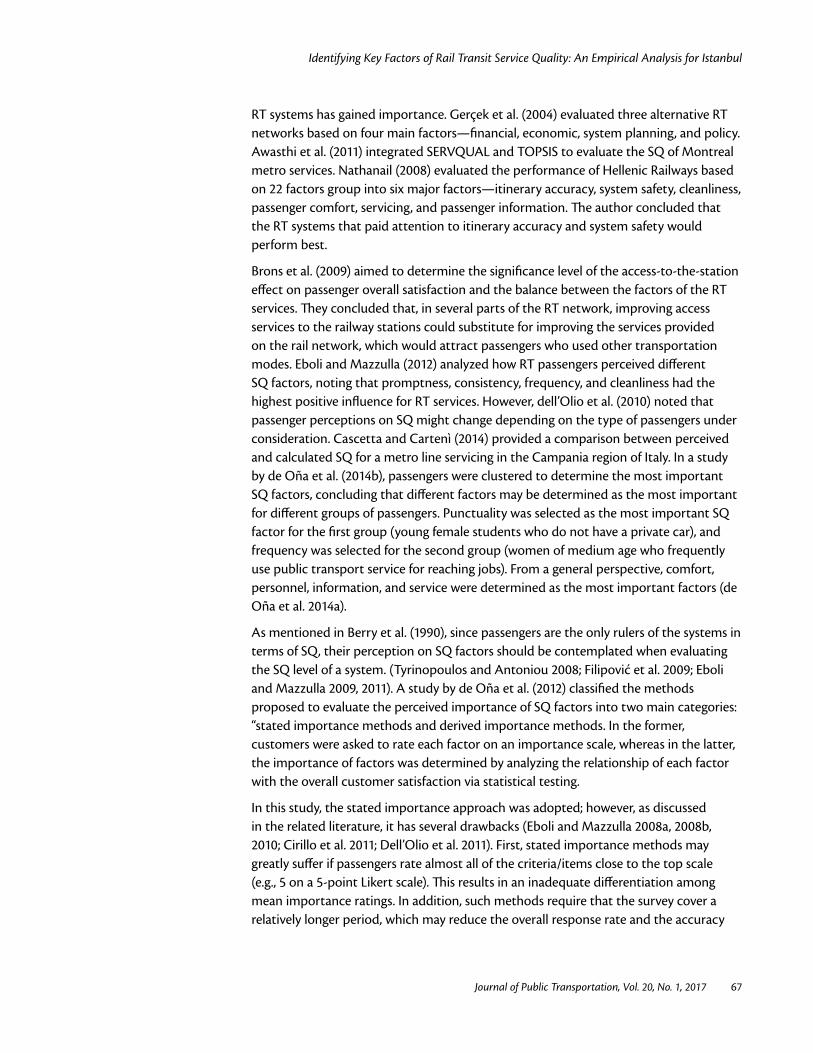
When all drawbacks of traveling by a private car are considered, RT has been one of the most appropriate modes of travel for public transport users in Istanbul. The city’s six RT lines (M1, M2, M4, T1, T4, F1), which are operated by Istanbul Public Transportation Co., total 145.5 kilometers in length and carry more than 1.3 million passengers daily (www.metro.istanbul/en). Figure 1 shows the network maps and characteristics of RT lines in Istanbul.

Jo
urna
l of P
ublic
Tra
nspo
rtat
ion,
Vol
. 20,
No.
1, 2
017
65
Iden
tifyi
ng K
ey F
acto
rs o
f Rai
l Tra
nsit
Serv
ice
Qua
lity:
An
Empi
rical
Ana
lysis
for I
stan
bul
FIG
UR
E 1.
Ista
nbul
rai
l tra
nsit
line
netw
ork
map

Identifying Key Factors of Rail Transit Service Quality: An Empirical Analysis for Istanbul
Journal of Public Transportation, Vol. 20, No. 1, 2017 66
To increase the number of people using the city’s RT system, it is critical to gather information from the recent users of the system regarding how much their expectations are met so decisionmakers can make changes to meet the passenger needs better (Andaleeb 2007; Le-Klähn et al. 2014). Customer surveys are especially important nowadays considering the depth and amount of information they can provide so public transport providers can understand which service aspects play a more critical role in passenger satisfaction (Le-Klähn et al. 2014).
The Istanbul Public Transportation Co. conducts a customer satisfaction survey annually to determine the needs and problems of its RT passengers to improve the system based on their demand. In this study, we analyzed the results of the 2012 and 2013 surveys using several voting rules to evaluate the priority of each service quality (SQ) factor for RT passengers in Istanbul by line and year. A total of 11,116 passengers completed the surveys, which were distributed among 6 RT lines.
The remainder of this paper is structured as follows. Section 2 reviews the literature highlighting stated importance methods, Section 3 reports the details on survey data, and Section 4 provides a summary of the voting methods employed with exemplification. In Section 5, results from different categories of methods are clustered and interpreted. Finally, Section 6 concludes with an overall discussion emphasizing possible avenues for future research.
Related Literature
Proposing higher SQ levels in PT to reduce dissatisfaction (traffic congestion, noise, etc.) resulting from immoderate use of private cars in big cities is one of the most important issues for public transport providers. Thus, PT service planners pursue lessening the use of private cars by developing quality improvement plans that will initiate higher customer satisfaction. Increasing customer satisfaction or SQ levels results in a higher use of the service, involvement of new customers, and a better public image (de Oña et al. 2012; Çelik et al. 2013).
To reach an appropriate SQ level, service providers should consider several SQ factors associated with PT. Mouwen and Rietveld (2013) considered several factors to determine if competitive tendering increases SQ for PT in the Netherlands and determined that frequency of service, time accuracy, travel speed, and vehicle tidiness were the most effective. Waiting time, cleanliness, and comfort were observed to be the most valued PT factors in a study by dell’Olio et al. (2011). Redman et al. (2013) presented a comprehensive review on SQ factorss in PT and determined that reliability, frequency, price, speed, access, comfort, and convenience were the factors that attract car users to use PT. Hassan et al. (2013) asserted that the most desirable SQ factors of PT services were reliability, frequency, capacity, price, cleanliness, comfort, security, staff, information, and ticketing system, with loading/ridership, travel time, travel distance, and service duration indicated as “efficiency” indicators.
Currently, in big and crowded cities, RT systems are preferred as one of the easiest ways of avoiding traffic congestion and noise. Therefore, analyzing service quality in
Identifying Key Factors of Rail Transit Service Quality: An Empirical Analysis for Istanbul
Journal of Public Transportation, Vol. 20, No. 1, 2017 67
RT systems has gained importance. Gerçek et al. (2004) evaluated three alternative RT networks based on four main factors—financial, economic, system planning, and policy. Awasthi et al. (2011) integrated SERVQUAL and TOPSIS to evaluate the SQ of Montreal metro services. Nathanail (2008) evaluated the performance of Hellenic Railways based on 22 factors group into six major factors—itinerary accuracy, system safety, cleanliness, passenger comfort, servicing, and passenger information. The author concluded that the RT systems that paid attention to itinerary accuracy and system safety would perform best.
Brons et al. (2009) aimed to determine the significance level of the access-to-the-station effect on passenger overall satisfaction and the balance between the factors of the RT services. They concluded that, in several parts of the RT network, improving access services to the railway stations could substitute for improving the services provided on the rail network, which would attract passengers who used other transportation modes. Eboli and Mazzulla (2012) analyzed how RT passengers perceived different SQ factors, noting that promptness, consistency, frequency, and cleanliness had the highest positive influence for RT services. However, dell’Olio et al. (2010) noted that passenger perceptions on SQ might change depending on the type of passengers under consideration. Cascetta and Cartenì (2014) provided a comparison between perceived and calculated SQ for a metro line servicing in the Campania region of Italy. In a study by de Oña et al. (2014b), passengers were clustered to determine the most important SQ factors, concluding that different factors may be determined as the most important for different groups of passengers. Punctuality was selected as the most important SQ factor for the first group (young female students who do not have a private car), and frequency was selected for the second group (women of medium age who frequently use public transport service for reaching jobs). From a general perspective, comfort, personnel, information, and service were determined as the most important factors (de Oña et al. 2014a).
As mentioned in Berry et al. (1990), since passengers are the only rulers of the systems in terms of SQ, their perception on SQ factors should be contemplated when evaluating the SQ level of a system. (Tyrinopoulos and Antoniou 2008; Filipović et al. 2009; Eboli and Mazzulla 2009, 2011). A study by de Oña et al. (2012) classified the methods proposed to evaluate the perceived importance of SQ factors into two main categories: “stated importance methods and derived importance methods. In the former, customers were asked to rate each factor on an importance scale, whereas in the latter, the importance of factors was determined by analyzing the relationship of each factor with the overall customer satisfaction via statistical testing.
In this study, the stated importance approach was adopted; however, as discussed in the related literature, it has several drawbacks (Eboli and Mazzulla 2008a, 2008b, 2010; Cirillo et al. 2011; Dell’Olio et al. 2011). First, stated importance methods may greatly suffer if passengers rate almost all of the criteria/items close to the top scale (e.g., 5 on a 5-point Likert scale). This results in an inadequate differentiation among mean importance ratings. In addition, such methods require that the survey cover a relatively longer period, which may reduce the overall response rate and the accuracy

Identifying Key Factors of Rail Transit Service Quality: An Empirical Analysis for Istanbul
Journal of Public Transportation, Vol. 20, No. 1, 2017 68
of the survey. Some criteria found important may, in fact, have little effect on overall satisfaction (de Oña et al. 2012).
Despite the notable increase in the number of studies employing derived importance methods (Eboli and Mazzulla 2007; Dell’Olio et al. 2010; Jen et al. 2011) due to the issues summarized above, the stated importance approach has advantages over the derived importance approach. First, it is understood by decisionmakers and public policymakers more easily. It also requires fewer analytical skills and less expertise to employ (Van Ryzin and Immerwahr 2007). Nevertheless, interested readers are referred to Van Ryzin and Immerwahr (2007), Eboli and Mazzulla (2007), Dell’Olio et al. (2010), and Jen et al. (2011) to gain more insight on different applications of the derived importance methods.
Although many studies have focused on the evaluation of criterion-wise satisfaction levels or overall satisfaction level, few have paid attention to the relative importance of service quality. When determining the key SQ factors, research to date has neglected to consider customer preference rankings that are information-rich and can be easily processed and interpreted. If customers rate their satisfaction with only a specific SQ factor, the path followed by research done so far is inevitable; however, when customers order SQ factors based on their preferences, they provide more information regarding on what decisionmakers should focus. Therefore, this study contributes to the existing literature by providing a different aspect to analyze passenger satisfaction using a considerably large sample and comparing results between years and RT lines with the help of different voting procedures that are easy to implement. Highly-prioritized SQ factors were determined using a representative sample consisting of 11,116 individuals. The joint investigation of traditional and non-traditional voting methods for ranking the most important SQ factors also added value. In addition, determining high-priority SQ factors for each line separately provides more insight on potential differentiation between the lines considered. Finally, the procedures provide valuable information regarding SQ factors that should be primarily focused on to provide a better service in RT lines for future investments.
Survey Data
The survey was composed of four parts: Station and Ticketing, Rail Transit Usage, Overall and Criterion-Based Satisfaction, and Demographics. The survey questions measured each SQ factor on a 6-point Likert scales with “extremely satisfied” reflecting the highest favorable response and “extremely dissatisfied” indicating the least favorable response to each statement.
To determine the importance of SQ factors for RT lines in Istanbul, we analyzed passenger satisfaction surveys that were conducted among 4,966 passengers in 2012 (from May 15 to June 3), and 6,150 passengers in 2013 (from June 17 to July 3). The distribution of the 11,116 survey participants across years and lines are shown in Table 1. Since the M4 line was not open during the time the survey was conducted in 2012, there were no data available regarding that year.

Identifying Key Factors of Rail Transit Service Quality: An Empirical Analysis for Istanbul
Journal of Public Transportation, Vol. 20, No. 1, 2017 69
YearRail Transit Line
T1 T4 M1 M2 M4 F1
2013 1,560 1,129 1,044 1,145 1,084 188
2012 1,575 1,047 1,076 1,069 N/A 199
All passengers were interviewed in person. A multistage stratified sampling procedure was employed in which tiers were formed considering the differences at rush hours and off-peak traffic hours among the transit lines. The quotas for the tiers were set according to the following criteria:
1. Day of use: weekdays, Saturday, Sunday
2. Time slot: morning rush, morning, noon, evening rush, evening
3. Station-wise crowdedness
4. Ticket type: token, full fare, discount fare, free
The participants in the survey were selected as follows to achieve randomness: A pollster waiting at an exit asked the 6th (5th in 2013) passenger who passed the turnstiles to participate in the survey; if that passenger was not willing, then the next passenger was asked to participate, and so on. At that point, the sequence of passengers was no longer important. Note that the pollster was not asked to follow a systematic sampling procedure in the first place, as it would be impractical to select every nth passenger for the survey, especially during rush hours.
Table 2 shows details on the survey data regarding demographics and travel characteristics. Note that median monthly household income of the survey participants was 1,782 Turkish lira (TL) (approx. $970 based on the Central Bank of Turkey’s exchange rate in May 28, 2012) in 2012, and the full transit fare was 1.65 TL during that time. This increased to 2,431 TL (approx. $1,250 based on the Central Bank of Turkey’s exchange rate in June 24, 2013) in the next survey year, and the full transit fare increased to 1.95 TL. Some notable differences between survey years regarding demographics appear in education level and household income level. The percentage of participants who had a primary school degree significantly decreased in contrast to the percentage of participants with an undergraduate degree. The frequency distribution of household income also changed; it was right-skewed in 2012, but was fairly symmetric in 2013 (with a higher median value compared to the previous survey year). This might be attributed to the introduction of a new line (M4) into the RT system by the time survey was conducted in 2013 since this line provides service in the Anatolian part of Istanbul, unlike the other five.
TABLE 1.Subsample Sizes by Line
and Year

Identifying Key Factors of Rail Transit Service Quality: An Empirical Analysis for Istanbul
Journal of Public Transportation, Vol. 20, No. 1, 2017 70
TABLE 2. Respondent Profile
Demographic Characteristics 2012 2013 Travel Profile Characteristics 2012 2013
GenderMale 77.4% 74.6% Car
OwnershipYes 40.2% 43.0%
Female 22.6% 25.4% No 59.8% 57.0%
Age
15-25 46.7% 48.4%
Time to Station
Less than 5 min 31.3% 26.7%
26-35 26.4% 28.6% 6-10 min 25.8% 25.2%
36-45 13.6% 13.9% 11-15 min 13.6% 13.1%
46-55 8.0% 5.9% 16-20 min 9.1% 12.5%
Older than 55 5.3% 3.3% 21-25 min 2.8% 2.8%
26-30 min 6.3% 5.5%
More than 30 min 11.0% 14.2%
Educational Level
Primary school not completed 0.6% 0.5%
Total Time of Travel
Less than 10 min 8.0% 14.6%
Primary school degree 11.4% 8.1% 11-20 min 26.6% 37.9%
Secondary school degree 9.9% 9.8% 21-30 min 23.1% 18.7%
High school student 12.4% 9.2% 31-40 min 13.3% 10.6%
High school degree 22.1% 23.5% 41-50 min 10.2% 7.3%
Vocational school student/degree
2.5% 3.0% 51-60 min 7.1% 4.6%
Undergraduate student 19.1% 17.3% 61-70 min 2.8% 1.7%
Undergraduate degree 18.7% 23.6% 71-80 min 2.0% 1.9%
Post graduate student/degree 3.3% 4.8% 81-90 min 2.6% 0.9%
More than 90 min 4.3% 1.7%
Monthly Household
Income
Less than 500 TL 1.2% 0.6%
FrequencyOf Use
At least once a week 25.7% 24.3%
501-1000 TL 13.9% 5.3% Once a day 16.1% 9.7%
1001-1500 TL 22.0% 11.0% Twice a day 48.0% 53.8%
1501-2000 TL 20.7% 15.2% Three tımes a day 2.9% 4.5%
2001-2500 TL 12.5% 12.9% More than three tımes a day 7.2% 7.7%
2501-3000 TL 10.2% 12.1%
3001-3500 TL 4.0% 7.2%
Ticket Type
Full 52.5% 58.3%
3501-4000 TL 3.3% 5.5%Discount (student, teacher, or social)
34.6% 34.0%
4001-4500 TL 1.9% 3.4% Token or Free 13.0% 7.7%
4501-5000 TL 3.1% 3.6% Full 52.5% 58.3%
More than 5001 TL 4.6% 9.5%
Median 1782 TL 2431 TL
MaritalStatus
Single 62.5% 66.6%
MainPurposeof Travel
Commute 44.8% 53.1%
Married 37.5% 33.4% Go to or return from school 20.9% 12.2%
Work-related activities 13.3% 8.1%
EmploymentStatus
Unemployed or student 35.7% 30.2% Entertainment or social activities 12.1% 20.2%
Employed 64.3% 69.8% Other 8.9% 6.4%

Identifying Key Factors of Rail Transit Service Quality: An Empirical Analysis for Istanbul
Journal of Public Transportation, Vol. 20, No. 1, 2017 71
Methodology
As mentioned earlier, we employed various voting procedures from the social choice literature to find the criterion that had the highest importance for Istanbul Public Transportation Co. passengers by RT line and year. One question in the surveys asks passengers to rank, in order of importance, five of the SQ factors given. These SQ factors were treated as candidates aiming to be the winner of an election and the passengers as voters. Given a set of SQ factors, each passenger prioritized the five based on their preferences.
The most appropriate method in the social choice literature to analyze such data is Fallback Voting, mainly because customers are almost always allowed to provide partial preference; however, one can argue that Approval Voting, in which a voter may cast one vote for as many candidates as desired without ranking them, or even Condorcet-consistent methods, which work mostly with complete preferences, also could work. In this section, we briefly cover the relevant voting procedures without going into too much detail. Interested readers should refer to Tideman (1987) and Plassmann and Tideman (2014) for more information on the fundamentals of voting systems and social choice functions.
Assume that individual j is endowed with a preference relation ≿j that is defined over C, a finite set of candidates competing in the election. A voting system is a function that takes an election as input and produces a set of winners, a subset of C. The preference relation ≿j is desired to have some characteristics such as completeness, reflexivity, and transitivity. Completeness requires that given two different candidates, say A and B, from C, either A ≿j B (A beats B according to j’s preference or they are tied) or B ≿j A. In other words, a voter’s ranking contains all available candidates. Incompleteness (partial preferences) corresponds to the case where the voters rank only a subset of candidates contained in C. Reflexivity states that any candidate A ∈ C is as preferable as itself; that is, A ≿j A. Finally, given three candidates A, B, and C ∈ C such that A ≿j B and B ≿j C, transitivity implies that A ≿j C. Note that the preference relation ≿j is called weak since it allows for ties (indifference). A strict preference relation, which can be denoted by ≿j, is irreflexive and individual j is assumed to rank one of the two arbitrary candidates in C over the other; that is, individual j is never indifferent between any two candidates.
Bulk literature exists on consumer choice modeling that is based on the utility concept and is directly related to these preference relations with the aforementioned properties. They primarily assume that an individual gains an economic utility when he/she selects an alternative. However, these models are mostly probabilistic and make certain assumptions regarding individual characteristics and/or candidate characteristics. This stream of research is not covered here; however, interested readers should refer to Anderson et al. (1992) for a comprehensive review and detailed discussion on the origin and the evolution of statistics-oriented choice models and utility maximizing voters.
The preference relation explained above should carry extra properties to have a fair voting system; however, note that there is no ideal scheme to decide a winner in an election, as Arrow’s Impossibility Theorem proves (Kelly 1978).

Identifying Key Factors of Rail Transit Service Quality: An Empirical Analysis for Istanbul
Journal of Public Transportation, Vol. 20, No. 1, 2017 72
1. Pareto optimality (unanimity): For all pairs of candidates A and B, if A is preferred to B by all the voters, then B should not be declared as the winner.
2. Monotonicity: Increasing (decreasing) the number of votes for a winning (losing) alternative cannot make it a loser (winner).
3. Anonymity: Voters are treated the same.
4. Independence of Irrelevant Alternatives (IIA): Suppose that a group of individuals decided that A should be ranked before B. If a new candidate, say N, which is outside C, was introduced, then the group decision would not change, provided that the relative ordering of A and B was preserved.
5. Non-dictatorship: “No voter should decide the outcome of an election” (Menton 2013).
Traditional voting rules can be grouped mainly into two categories according to their starting point: Condorcet-consistent methods and Condorcet-inconsistent methods. In the former, the main objective is to find a Condorcet winner if one exists; in the latter, the winner may be determined by “the points allocated to candidates according to their ranking on individual voters’ ballots” (Cox 1989). Such methods are called scoring-based methods. The rest of this section provides an overview on traditional methods along with recently-proposed voting methods, followed by main assumptions.
Condorcet (1789) asserted that the candidate that is preferred pairwise to every other candidate by a majority of voters wins the election. Such a candidate is called a Condorcet winner. If no such winner exists, all candidates tie for the win (Mattei 2012).
As an illustrative example, adapted from Schulze (2003), suppose that there are four cities (A, B, C, D) vying to host a special event and the 30 members of the international organizing committee are asked to rank each of these cities from the most favorable to the least favorable in terms of suitability to stage the event. The aggregated ranked ballots are as follows:
A≻C≻D≻B 3 B≻C≻D≻A 5 C≻D≻A≻B 5 D≻A≻B≻C 2A≻D≻B≻C 5 B≻A≻C≻D 4 C≻A≻D≻B 2 D≻B≻A≻C 4
Most of the methods discussed here use a pairwise preference matrix that shows how many times candidates were preferred over one another. The original matrix is shown below (Table 3), and the first line reads: City A was preferred to cities B, C, and D in 17, 18, and14 instances, respectively.
TABLE 3.Pairwise Comparison Matrix
for Illustrative Example
AGAINSTFOR A B C D
A 17 18 14
B 13 20 9
C 12 10 19
D 16 21 11

Identifying Key Factors of Rail Transit Service Quality: An Empirical Analysis for Istanbul
Journal of Public Transportation, Vol. 20, No. 1, 2017 73
City A wins over cities B and C, but loses to city D. City D wins over cities A and B, but loses to city C. Thus, there is no Condorcet winner since none of the candidates won every comparison with all the other candidates. Note that if two of the voters who preferred the ranking D≻B≻A≻C changed to A≻C≻D≻B, city A would be the Condorcet winner since it would win all of its pairwise comparisons.
On the other hand, de Borda (1781) argues that a majority winner may not always exist and proposes a paired-comparisons procedure that assigns points to candidates in head-to-head elections. Each candidate’s total score is calculated based on points associated with each rank. The winner that has the highest score is then declared the winner.
For the illustrative example above, city A has a Borda score of 49 ( = 8x3 + 8x2 + 9x1), city B has a Borda score of 42 ( = 9x3 + 4x2 + 7x1), city C has a Borda score of 41 ( = 7x3 + 8x2 + 4x1), and city D has a Borda score of 48 ( = 6x3 + 10x2 + 10x1). Thus, city A wins the election.
The Borda method may elect a candidate that was not ranked first by any of the voters (Mattei 2012) and it does not satisfy the IIA property. Eğecioğlu and Giritgil (2011) addressed the difficulty encountered when one aims to implement this method in case of partial preferences.
Condorcet-Consistent Methods
The rules summarized below assume complete linear orderings and select the Condorcet winner if one exists.
1. Baldwin’s iterative procedure employs the Borda count and eliminates the candidate(s) with the lowest Borda score(s) at each step and recalculates Borda scores for the remaining candidates; the procedure proceeds until a group of candidates with the same Borda score can be formed (Hwang and Lin 1987).
For the illustrative example mentioned earlier, at the first step, city C is eliminated since it has the lowest Borda score. Following the elimination, the Borda scores of cities A, B, and D become 31, 22, and 37, respectively. Thus, city B is eliminated. City D wins eventually as its reduced Borda score (16) is greater than that of city A’s (14).
2. Black (1958) elects a Condorcet winner if one exists; otherwise, the Borda count winner is elected.
3. Copeland’s rule (Copeland 1951) works with pairwise comparisons; it counts the number of wins and losses for each candidate competing in the election. For each win (loss), a candidate gains (loses) one point. The candidate with the highest total score wins the election. It allows for ties (no points assigned to the candidates that are tied), but it may be indecisive.
In the pairwise comparison matrix for the illustrative example above, we see that cities B and C are eliminated immediately since the former wins only over city C, whereas the latter wins only over city D. Cities A and D are tied since they

Identifying Key Factors of Rail Transit Service Quality: An Empirical Analysis for Istanbul
Journal of Public Transportation, Vol. 20, No. 1, 2017 74
both have a Copeland score of 2. A tie-breaking rule is necessary at this point to determine the winner.
4. Dodgson’s method determines the fewest number of pairwise interchanges needed to make a candidate the Condorcet winner. The candidate with the fewest interchanges is declared the winner (Black 1958). Determining a Dodgson winner is a rather complicated procedure that is NP-hard and in which the time required to determine the winner is polynomial (Caragiannis et al. 2012). Like Bucklin’s, this method also works with full preference information.
City A needs only 2 swaps to win the election, whereas cities B and C both need 16 swaps, and city D needs 8. City A is the Dodgson winner as it needs the least number of swaps to win the election.
5. Similar to Baldwin’s, Nanson’s rule eliminates at each step the candidates with a Borda score smaller than the average Borda score (calculated considering all the candidates at a step). The Borda scores are then revised, taking only the remaining candidates into account. The procedure repeats until a Borda winner can be determined (Nanson 1883).
Condorcet-Inconsistent Methods
The rules summarized below are not guaranteed to select the Condorcet winner if one exists.
1. Bucklin’s method elects the candidate that was ranked first by the majority of voters as the winner. If there exists no such candidate, the candidate that was ranked either first or second by the majority of voters is declared the winner. The procedure continues, expanding the number of levels to consider every time a majority winner cannot be determined, until one of the candidates has more than half the number of votes. Bucklin requires complete preference information as well (Hoag and Hallett 1926).
Consider the illustrative example above. According to Bucklin’s rule, one of the cities would need to be ranked first by at least 16 of the committee members to win the election. However, the number of times cities A, B, C, and D preferred as the organizer is 8, 9, 7, and 6, respectively. Thus, at the second stage, we count the total number of times a city was ranked either first or second. In the end, cities A and D are tied as they take the first or second places 16 times, whereas city B (city C) appeared in the top two only 13 (15) times.
2. Coombs (1964) proposed a recursive elimination method that discards at each step the candidate who was ranked last the most number of times. This rank scoring procedure repeats until someone can be declared winner.
Approval Voting is also a rank scoring rule that allows individuals to vote for a predetermined number of candidates available. For instance, under k-Approval Voting, each ballot contains at most k candidates, but the voter is not asked to rank them. The candidate that appears the most in the ballots wins the election.

Identifying Key Factors of Rail Transit Service Quality: An Empirical Analysis for Istanbul
Journal of Public Transportation, Vol. 20, No. 1, 2017 75
Note that Felsenthal and Tideman (2014) report that Nanson, Dodgson, and Coombs are all vulnerable to monotonicity failure.
Non-traditional Methods
1. As an attempt to avoid cloning in elections, Schulze (2011) introduced a new Condorcet-consistent method based on a weighted majority graph using a best-path finding algorithm, which is solved in polynomial time. On a majority graph, vertices represent the candidates and edges correspond to the relative performance of pairs of candidates (Menton 2013). The method describes “the strong paths from each winning candidate to every other candidate” (Menton 2013). One needs to first determine the number of voters who strictly prefer one candidate over another. Then, all possible paths to reach from one candidate to another must be identified. The weakest link in a path determines the strength of that path. If there are more than one possible path from one candidate to another, then the path with the largest strength is chosen and it is called the strongest path. If the path from one candidate (X) to another (Y) is stronger than (no ties) the path backwards (Y to X), then X disqualifies Y. If X disqualifies every other candidate, then X wins the election outright (Schulze 2003).
Consider the example introduced earlier. The directed graph given in Figure 2 is constructed using the pairwise comparison matrix. There are two possible ways to reach B in this case: a direct path from A to B (with a strength of 17) and an indirect path from A to C to D to B (with a strength of 18). The strength of the latter is determined by the weakest link, which is A to C. The strongest path is the one with the largest relative pairwise performance; that is, A~C~D~B. Here, “~” denotes a direct link from one candidate to another. There is only one path from B to A with a strength of 16: B to C to D to A. Since the strength of the path from A to B is larger than that of B to A, A disqualifies B.
FIGURE 2.Weighted majority graph
for illustrated example A B
D C
17
20
19
16
21
18
Table 4 compares the strongest beatpaths. City A wins the election since it loses none of the beatpath comparisons.

Identifying Key Factors of Rail Transit Service Quality: An Empirical Analysis for Istanbul
Journal of Public Transportation, Vol. 20, No. 1, 2017 76
FromTo
A B C D
AA~B: 17
A~C~D~B: 18= min(18,19,21)
A~C: 18A~B~C: 17
= min(17,20)
A~C~D: 18= min(18,19)A~B~C~D: 17
= min(17,20,19)
BB~C~D~A: 16
= min(20,19,16) B~C: 20 B~C~D: 19= min(20,19)
CC~D~A: 16
= min(19,16)
C~D~B: 19= min(19,21)C~D~A~B: 16
= min(19,16,17)
C~D: 19
D D~A: 16D~B: 21
D~A~B: 16= min(16,17)
D~A~C: 16 =min(16,18)
D~B~C: 20 =min(21,20)
D~A~B~C: 16 =min(16,17,20)
2. Tideman’s ranked pairs method is very similar to that of Schulze’s and tells one “what edges are considered in what order, and whether and how the edges are set in the election graph.” (Menton 2013). The method “requires the collective ranking of the candidates to be consistent with the paired comparisons decided by the largest and second largest margins, and then, if possible, with the paired comparison decided by the third largest margin, and so on.” (Tideman 1987). The candidates are first ordered from top to bottom based on margin of victory in head-to-head elections. The ranking with the largest margin is determined and locked. Then, all rankings that contradict it is eliminated. The procedure continues with the next largest margin of victory until one ranking remains (Levin and Nalebuff 1995). For the example above, we start with B and D since they have the largest margin of victory (21 – 9 = 12). The ranking DB is locked. The second largest margin is between B and C (20 – 10=10) which lets us lock BC. Since DB and BC, the ranking DC is also locked. Finally, we lock AC, AB, and DA. Therefore, D wins the election based on the final ranking: DABC.
3. Fallback Voting (FV) is an extension of Bucklin’s procedure that does not need complete orderings, yet it does not allow for ties. FV combines Bucklin’s method with approval voting (Erdélyi et al. 2015), and, as Brams and Sanver (2009) summarized, it proceeds as follows.
First, voters rank a set of candidates they approve in order of preference. The set of approved candidates is allowed to be empty or to consist of all the candidates competing in the election. If a candidate was ranked first by a majority of voters, this candidate is called a level 1 FV winner. If no candidate can be declared a level 1 winner, the candidate that is ranked either first or second by a majority of voters is considered, and this candidate is declared the winner. If there are more than one such candidates, then the candidate with the largest majority is called a level 2 FV winner. If there is no level 2 winner, the voters descend—one level at a time—to
TABLE 4. Strong Paths between
Each Candidate
Identifying Key Factors of Rail Transit Service Quality: An Empirical Analysis for Istanbul
Journal of Public Transportation, Vol. 20, No. 1, 2017 77
lower and lower ranks of approved candidates, stopping when, for the first time, one or more candidates are approved of by a majority of voters, or no more candidates are ranked. If exactly one candidate receives majority approval, this candidate is the FV winner. If more than one candidate receives majority approval, then the candidate with the largest majority is the FV winner. If the descent reaches the lowest rank of all voters and no candidate is approved of by a majority of voters, the candidate with the most approval is the FV winner.
In the illustrative example, since none of the candidates take the majority of the votes, a level 1 FV winner is not found. Next, we add the second-rank counts and see that cities A and D are tied. Descending to the third level leads city D to victory since it appears in the top three 26 times, once more than city A. Hence, city D is a level 3 FV winner.
Black, Copeland, Dodgson, Schulze, Tideman, Nanson, and Baldwin choose the Condorcet winner if one exists. One disadvantage of Condorcet arises when the group decision is not transitive, even though the individual preferences are (Mattei 2012). Most of the traditional methods enjoy completeness; however, it is often highly impractical to ask individuals compare alternatives in pairwise fashion (a preference or a tie). Thus, in customer satisfaction surveys, where there are too many alternatives, respondents are usually asked to rank a subset of them. This avoids cognitive complexity and waste of time, yet results in incomplete preferential votes. FV is designed to work with incomplete information and asks voters to select a set of candidates they approve and then rank them (Brams and Sanver 2009). The social choice literature on voting rules is expanding continually and alternative methods are being introduced. Recently, Camps et al. (2013) provided a continuous rating method for the social acceptance of different alternatives in case the individuals do not express a comparison between every pair of alternatives available or they provide an ordered list restricted to a subset of the most preferred options.
Finally, we list below our main assumptions that will provide us flexibility when interpreting the results in Section 5:
1. The respondents did not choose strategically; he/she is not be interested in what other respondents think or how they decide. In short, the voters are assumed to be sincere.
2. When employing the traditional methods, we assumed that the ballots are completely filled.
3. Since multiple winners would not be an issue, we did not work through a tiebreaking procedure.
Results and Discussion
The survey question we considered asked passengers to rank, based on their preferences, the five most important SQ factors listed in Table 5. They were allowed to report incomplete rankings; however, fewer than 2% of participants provided a ranking

Identifying Key Factors of Rail Transit Service Quality: An Empirical Analysis for Istanbul
Journal of Public Transportation, Vol. 20, No. 1, 2017 78
with less than five SQ factors. In total, 26 SQ factors were assessed to determine those of higher priority—based on individual rankings—for each line and year.
TABLE 5.SQ Factors
Waiting time Lighting
Access to stations Fares
Security at stations Ventilation systems in cars
Security in cars Moving stairways/walkways and escalators
Attitude of security personnel Token machines
Travel (in-vehicle) time Working conditions of turnstiles
Crowdedness in cars Comfort level at stations
Cleanliness of stations Transport information systems
Timeliness of cars Notifications at stations in case of delay
Information systems at stations Notifications in cars in case of delay
Token sale Transfer fares
Cleanliness of cars Notifications on website
Noise and vibration in cars Notifications from phone line
We used several traditional voting procedures and three recently-proposed voting procedures (Schulze, Tideman, and Fallback Voting) to determine the highly-prioritized criteria by line and year. We reported the first, second, and third priorities identified using the methods explained in Section 4. As mentioned earlier, traditional procedures can be mainly grouped into two categories with respect to Condorcet-consistency. It would not be surprising to see that two traditional methods from different categories chose different candidates as winners. Yet, they agreed with each other at almost every instance, as seen in Tables 6 and 7, when only the primary (first, second, or third) priorities were considered. In contrast with other traditional methods, Dodgson and Simpson chose security at stations as the third priority for the M2 line in 2012. Hence, we combined the results of the traditional methods other than Borda in one table.
Note that the ballots in our study are truncated. The passengers ranked, at most, five of the SQ factors available in order of importance. When employing the traditional methods, we assumed that the voters strictly ranked the first five candidates and they were indifferent with the rest, which let us work with completely-filled ballots in return. Investigating the second and third priorities reveals that the Borda method is significantly affected by this assumption; there are nine such instances on which Borda and the other traditional methods do not agree. Regarding the first priorities, the Borda method and the traditional methods disagree only for M1 in 2013. The former favors fares, whereas the latter favors waiting time in that case. That is, when the first priorities are considered, these two clusters of methods differ from each other less significantly compared to the case when the second-ranked or third-ranked priorities are taken into account.
Waiting time appears to be a consistent problem for M2 line. In both years, this criterion is observed as a first priority for M2 passengers. Another interesting finding belongs to F1 and T4 lines. The priorities of F1 and T4 passengers changed through survey years.

Identifying Key Factors of Rail Transit Service Quality: An Empirical Analysis for Istanbul
Journal of Public Transportation, Vol. 20, No. 1, 2017 79
Waiting time and crowdedness in cars appear to be the most important SQ factors on which decisionmakers should focus given the survey results of 2013. As for the second and third priorities, Borda and the other traditional methods point out different criteria at almost every instance for T1, M4, and F1 lines.
TABLE 6.Passenger
Priorities by Line and Year – Borda
Priority YearRail Transit Line
T1 T4 M1 M2 M4 F1
First
2013Crowdedness
in carsCrowdedness
in carsFares Waiting time Waiting time
Crowdedness in cars
2012Crowdedness
in carsWaiting time Fares Waiting time Fares
Second
2013 Fares Fares Waiting timeCrowdedness
in carsSecurity at
stationsFares
2012 FaresSecurity at
stationsCrowdedness
in carsTravel time
Crowdedness in cars
Third
2013Ventilation
systems in carsWaiting time Travel time Fares
Crowdedness in cars
Access to stations
2012 Waiting timeCrowdedness
in carsWaiting time
Cleanliness of cars
Waiting time
TABLE 7.Passenger
Priorities by Line and Year –
Other Traditional Methods
Priority YearRail Transit Line
T1 T4 M1 M2 M4 F1
First
2013Crowdedness
in carsCrowdedness
in carsWaiting time Waiting time Waiting time
Crowdedness in cars
2012Crowdedness
in carsWaiting time Fares Waiting time Fares
Second
2013 Fares Fares FaresCrowdedness
in carsAccess to stations
Fares
2012 Waiting timeSecurity at
stationsCrowdedness
in carsTravel time Waiting time
Third
2013 Waiting time Waiting time Travel time FaresSecurity at
stationsWaiting time
2012 FaresCrowdedness
in carsWaiting time
Cleanliness of cars*
Crowdedness in cars
* Excluding Dodgson and Simpson procedures.

Identifying Key Factors of Rail Transit Service Quality: An Empirical Analysis for Istanbul
Journal of Public Transportation, Vol. 20, No. 1, 2017 80
As seen in Tables 8 and 9, in 13 instances, Tideman, Schulze, and FV disagree with each other when determining a high-priority SQ factor. In 2013, in contrast with FV, Tideman and Schulze favored waiting time and crowdedness in cars over fares as the first priority, for the M1 and F1 lines, respectively. On the other hand, FV and the Borda procedure addressed different SQ factor as a priority at a total of five instances (T1, M2, and F1 lines); however, only the orderings differ for M2 and F1 lines. Thus, these two methods refer to the same set of SQ factors for both of these lines in a given year when ordering is overlooked. This is not the case when the results of FV are compared with those from the Tideman and Schulze methods. Distinctions occur mostly for the second and third priorities in 2013 (M1, M4, and F1 lines). The major difference in the set of highly-prioritized criteria in 2012 is observed for M2 line; FV elects cleanliness of cars (travel time) as the second (third) priority, whereas both Tideman and Schulze elect travel time (security at stations) as the second (third) priority.
In 2013, the methods are quite consistent regarding first priorities. For M1 line, FV and Borda elect fares, whereas Tideman and Schulze favor waiting time along with the other traditional methods. Similarly, for F1 line, all the methods excluding FV elects crowdedness in cars. On the other hand, the methods lead exactly to the same set of primary priorities with subtle differences in the ordering for F1 in 2012.
As mentioned in Section 4, it is not always possible to find an FV winner. For example, distinctions were detected between the traditional methods and the recent methods in 2012 for M1 and F1 lines. The passengers of these lines prioritized fares above others. However, we were not able to determine an FV winner for M1 line even after the first five ranks were considered in 2012. Thus, fares is the SQ factor that has the most approvals among the others in that case and is also the 5-approval winner.
TABLE 8. Passenger
Priorities by Line and Year
– Fallback
Priority YearRail Transit Line
T1 T4 M1 M2 M4 F1
First
2013Crowdedness
in carsCrowdedness
in carsFares Waiting time Waiting time Fares
2012Crowdedness
in carsWaiting time Fares Waiting time Fares
Second
2013 Fares Fares Waiting timeCrowdedness
in carsSecurity at
stationsCrowdedness
in cars
2012 FaresSecurity at
stationsCrowdedness
in carsCleanliness of
carsCrowdedness
in cars
Third
2013 Waiting time Waiting time Travel time FaresCrowdedness
in carsAccess to stations
2012 Waiting timeCrowdedness
in carsWaiting time Travel time Waiting time

Identifying Key Factors of Rail Transit Service Quality: An Empirical Analysis for Istanbul
Journal of Public Transportation, Vol. 20, No. 1, 2017 81
TABLE 9. Passenger
Priorities by Line and Year
– Tideman and Schulze
Priority YearRail Transit Line
T1 T4 M1 M2 M4 F1
First
2013Crowdedness
in carsCrowdedness
in carsWaiting time Waiting time Waiting time
Crowdedness in cars
2012Crowdedness
in carsWaiting time Fares Waiting time Fares
Second
2013 Fares Fares FaresCrowdedness
in carsAccess to stations
Fares
2012 Waiting timeSecurity at
stationsCrowdedness
in carsTravel time Waiting time
Third
2013 Waiting time Waiting time Travel time FaresSecurity at
stationsWaiting time
2012 FaresCrowdedness
in carsWaiting time
Security at stations
Crowdedness in cars
The average level of satisfaction for each SQ factor can be seen in Table 10. The number in parenthesis shows the rank of an SQ factor among all the others based on its satisfaction level for a given line and year. Crowdedness in cars, with which customers from all lines are dissatisfied, was found to be a high-priority SQ factor in all lines with two exceptions: M1 in 2013 and M2 in 2012. Thus, service providers should focus resources on improving this SQ factor to significantly increase ridership. On the other hand, even though the satisfaction level for waiting time was relatively high for F1 line in 2012, it was addressed as a third priority for this line that year. This SQ factor has a lower satisfaction level whenever it is highly prioritized. Thus, spending time and/or money on its improvement can also enhance the overall passenger satisfaction. Even though waiting time was perceived as a highly important SQ factor by passengers, travel time (in-vehicle time) was prioritized in 2012 and 2013 by only M2 and M1 passengers, respectively. Yet, the passengers in these cases seem to be satisfied with this SQ factor as seen in Table 10.
The frequency distributions for overall customer satisfaction levels, which should definitely be taken into account to make a better conclusion, are given in Figure 3. The percentage of extremely satisfied passengers shows a significant increase in both M2 and T4 lines from 2012 to 2013. Therefore, one should compare not only the rankings, but also the average satisfaction levels of an SQ factor from different years since the change in the overall satisfaction may be attributed to sample-based differences in these years rather than a significant increase in customer satisfaction. For instance, waiting time should be improved in M2 line as it is a high-priority SQ factor with an increasing satisfaction level (from 4.82 to 5.04) but a decreasing relative satisfaction (from 7th to 14th). As for T4 line, crowdedness in cars definitely needs attention since it appeared as a high-priority SQ factor with a decreasing satisfaction level despite the increase in its overall satisfaction level.

Jo
urna
l of P
ublic
Tra
nspo
rtat
ion,
Vol
. 20,
No.
1, 2
017
82
Iden
tifyi
ng K
ey F
acto
rs o
f Rai
l Tra
nsit
Serv
ice
Qua
lity:
An
Empi
rical
Ana
lysis
for I
stan
bul
TABL
E 10
. Sat
isfa
ctio
n Le
vels
for
Hig
hly-
Prio
ritiz
ed S
Q F
acto
rs
Rail
Tran
sit L
ine
T1T4
M1
M2
M4
F1
2012
2013
2012
2013
2012
2013
2012
2013
2012
2013
2012
2013
Wai
ting
time
4.31
(19)
4.41
(14)
4.58
(19)
4.9
(18)
4.63
(19)
4.67
(16)
4.82
(7)
5.04
(14)
N/A
5.53
(8)
5.12
(5)
4.92
(1)
Acc
ess t
o st
atio
ns4.
61 (8
)4.
53 (9
)4.
81 (7
)5.
13 (1
1)4.
82 (1
2)4.
75 (9
)4.
79 (1
3)5.
06 (1
1)N
/A5.
34 (2
0)5.
12 (6
)4.
73 (9
)
Secu
rity
at st
atio
ns4.
58 (1
0)4.
33 (1
6)4.
74 (1
4)5.
16 (8
)4.
75 (1
6)4.
63 (1
7)4.
69 (1
9)5.
01 (1
6)N
/A5.
49 (1
4)4.
91 (1
4)4.
71 (1
2)
Trav
el (i
n-ve
hicl
e) ti
me
4.37
(17)
4.26
(18)
4.67
(18)
4.82
(19)
4.95
(6)
4.87
(2)
4.96
(1)
5.06
(10)
N/A
5.52
(10)
5.14
(3)
4.57
(18)
Cro
wde
dnes
s in
cars
2.40
(24)
2.94
(22)
4.00
(25)
3.69
(26)
3.47
(26)
3.92
(23)
3.93
(25)
4.09
(25)
N/A
5.11
(24)
3.58
(25)
3.79
(25)
Cle
anlin
ess o
f car
s4.
57 (1
1)4.
58 (3
)4.
79 (1
1)5.
10 (1
3)4.
76 (1
5)4.
73 (1
1)4.
81 (8
)5.
00 (1
8)N
/A5.
48 (1
5)4.
92 (1
3)4.
62 (1
7)
Fare
s3.
54 (2
3)3.
65 (2
1)4.
19 (2
4)3.
97 (2
5)3.
68 (2
5)3.
83 (2
4)4.
11 (2
3)4.
16 (2
4)N
/A5.
38 (1
8)3.
64 (2
4)3.
76 (2
6)
Vent
ilatio
n sy
s. in
car
s3.
71 (2
2)4.
21 (2
0)4.
51 (2
0)4.
73 (2
0)4.
37 (2
1)4.
49 (2
0)4.
45 (2
1)4.
68 (2
1)N
/A5.
25 (2
2)4.
42 (2
2)4.
51 (2
0)

Jo
urna
l of P
ublic
Tra
nspo
rtat
ion,
Vol
. 20,
No.
1, 2
017
83
Iden
tifyi
ng K
ey F
acto
rs o
f Rai
l Tra
nsit
Serv
ice
Qua
lity:
An
Empi
rical
Ana
lysis
for I
stan
bul
FIG
UR
E 3.
Dis
trib
utio
n of
ove
rall
satis
fact
ion
leve
ls b
y ye
ar a
nd li
ne

Identifying Key Factors of Rail Transit Service Quality: An Empirical Analysis for Istanbul
Journal of Public Transportation, Vol. 20, No. 1, 2017 84
As stated previously, the purpose of this study was to provide a relatively simple way to decide which SQ factors perceived more important by RT passengers considering preference rankings. In line with dell’Olio et al. (2011) and Celik et al. (2014), we found that waiting time is a highly-prioritized SQ factor on which the service provider should focus resources. Similarly, crowdedness in cars was also addressed as a highly important SQ factor in de Oña et al. (2014) and Aydin et al. (2015). Givoni and Rietveld (2007) and Brons et al. (2009) emphasized the importance of access to stations, whereas Bhat and Sardesai (2006) highlighted travel (in-vehicle) time as an important SQ factor. However, in our case, these two factors were favored by the respondents at considerably few instances. However, the service provider should never overlook their importance.
Assuming that the respondents had no knowledge of the ranking patterns, there was no concern about the effects of manipulation or bribery on the overall conclusion (Mattei 2012). On the other hand, even though the results of the traditional methods coincide with those obtained from the FV, the reader should note that the complete preferential votes could change the outcome.
Incorporating preference rankings into the analysis avoids missing valuable information. Such information should not easily be disposed, as this may distort the overall conclusion. Employing k-approval voting could also have been considered; however, the relative ranking of the five most favored SQ factors would have been ignored in that case. For instance, one could employ 5-approval voting in this case, which would ignore the ordering of SQ factors unlike FV and different SQ factors might be declared winners.
Note also that we do not report the priorities by year using the overall data, as some of the voting rules employed might suffer from the multiple districts paradox, which describes the case in which a candidate that won an election in distinct electoral districts is not declared the winner when the districts are joined together (Young 1974; Plassmann and Tideman 2014).
Conclusions
Offering high-quality service in PT allows passengers to avoid traffic congestion and noise, especially in big and crowded cities such as Istanbul. Hence, determining the key SQ factors that passengers value most is an essential task for PT service providers and policymakers. This paper reports on the results obtained by analyzing data from a passenger satisfaction survey conducted annually by Istanbul Public Transportation Co. Several voting rules available in the literature were employed and compared to decide which SQ factors would be perceived as more important by RT passengers. The findings indicate that improving waiting time, crowdedness in cars, and fares can increase passenger satisfaction with RT services. Since a considerably high percentage of passengers prefer RT to commute or for work-related activities, they ranked waiting time and crowdedness in cars higher than most of the other SQ factors; they would rather get to work on time, comfortably. Hence, policymakers should focus on improving the comfort in cars and increasing the frequency of cars to decrease waiting time.

Identifying Key Factors of Rail Transit Service Quality: An Empirical Analysis for Istanbul
Journal of Public Transportation, Vol. 20, No. 1, 2017 85
In addition, customers reported that they were dissatisfied with fares and they favored it as one of the most important SQ factors. However, the median household income level appears to increase through survey years. Even though this does not clearly reflect purchasing power, the service provider should either find a way to decrease fares or increase the level of service customers are provided to a level such that price paid is not seen as a problem. This would be a rational decision considering more than half of the respondents pay full fare.
Arrow’s Impossibility Theorem states that there is no ideal scheme to decide a winner in an election (Kelly 1978); however, following the footsteps of Camps et al. (2013) and re-analyzing the data in hand may lead decisionmakers to more reliable results even though the overall conclusion presented here repeats. This is highly recommended, especially when the decisionmaker would like to learn about how much social acceptance a certain criterion is provided rather than whether it is a primary priority for RT passengers. Note that passengers are one of the stakeholders in transportation planning. Other stakeholders such as motorists and transit agencies should also be brought into the discussion to make better decisions.
A possible avenue for future research is to investigating the vulnerability of the methods employed to sampling procedures. We assumed that the samples in each year are the best representations of the population. However, one might be interested in checking this, especially whether monotonicity property is violated, since Coombs, Nanson, and Dodgson are all vulnerable to monotonicity failure (Felsenthal and Tideman 2014). Another possibility for future research lies within a machine-learning setting that finds rank orderings, as mentioned in Dobrska et al. (2011). Investigating the effect of demographics on the priorities did not provide an enhancement of the results mentioned in Section 5, mainly due to the similitude of RT lines from this perspective. Further investigation using multivariate techniques such as multiple discriminant analysis might be considered to assess the importance of demographics.
Acknowledgments
The authors express their utmost gratitude to Istanbul Public Transportation Co. (İstanbul Ulaşım A.Ş.) for their understanding, support, and the data provided.
References
Andaleeb, S. S., M. Haq, and R. I. Ahmed. 2007. “Reforming Innercity Bus Transportation in a Developing Country: A Passenger-Driven Model.” Journal of Public Transportation, 10(1).
Anderson, R. D., R. D. Mackoy, V. B. Thompson, and G. Harrell. 2004. “A Bayesian Network Estimation of the Service-Profit Chain for Transport Service Satisfaction.” Decision Sciences, 35(4), 665-689.
Anderson, S.P., A. de Palma, and J. F. Thisse. 1992. Discrete Choice Theory of Product Differentiation. The MIT Press, London, England.

Identifying Key Factors of Rail Transit Service Quality: An Empirical Analysis for Istanbul
Journal of Public Transportation, Vol. 20, No. 1, 2017 86
Awasthi, A., S. S. Chauhan, H. Omrani, and A. Panahi. 2011. “A Hybrid Approach Based on SERVQUAL and Fuzzy TOPSIS for Evaluating Transportation Service Quality.” Computers & Industrial Engineering, 61: 637–646.
Aydin, N., E. Celik, E., and A. T. Gumus. 2015. “A Hierarchical Customer Satisfaction Framework for Evaluating Rail Transit Systems of Istanbul.” Transportation Research Part A: Policy and Practice, 77: 61-81.
Berry, L. L., V. A. Zeithaml, and A. Parasuraman. 1990. “Five İmperatives for İmproving Service Quality.” Sloan Management Review, Summer: 9-38.
Bhat, C. R., and R. Sardesai. 2006. “The İmpact of Stop-Making and Travel Time Reliability on Commute Mode Choice.” Transportation Research Part B: Methodological, 40(9): 709-730.
Black, D. 1958. The Theory of Committees and Elections. Cambridge University Press, Cambridge.
Brams, S., and R. Sanver. 2009. “Voting Systems that Combine Approval and Preference.” In The Mathematics of Preference, Choice, and Order: Essays in Honor of Peter C. Fishburn. Springer: 215–237.
Brons, M., M. Givoni, and P. Rietveld. 2009. “Access to Railway Stations and İts Potential in İncreasing Rail Use.” Transportation Research Part A: Policy and Practice, 43(2): 136-149.
Camps, R., X. Mora, and L. Saumell. 2013. “A Continuous Rating Method for Preferential Voting. The İncomplete Case.” Social Choice and Welfare,40: 1111–42.
Caragiannis, I., J. A. Covey, M. Feldman, C. M. Homan, C. Kaklamanis, N. Karanikolas, A. D. Procaccia, and J. S. Rosenschein. 2012. “On the Approximability of Dodgson and Young Elections.” Artificial Intelligence,187: 31–51.
Cascetta, E., and A. Cartenì. 2014. “A Quality-Based Approach to Public Transportation Planning: Theory and a Case Study.” International Journal of Sustainable Transportation, 8(1): 84-106.
Celik, E., N. Aydin, and A. T. Gumus. 2014. “A Multi Attribute Customer Satisfaction Evaluation Approach for Rail Transit Network: A Real Case Study for Istanbul, Turkey.” Transport Policy, 36: 283-293.
Celik, E., O. N. Bilisik, M. Erdogan, A. T. Gumus, and H. Baracli. 2013. “An İntegrated Novel İnterval Type-2 Fuzzy MCDM Method to İmprove Customer Satisfaction in Public Transportation for Istanbul.” Transportation Research Part E: Logistics and Transportation Review, 58: 28-51.
Cirillo, C., L. Eboli, and G. Mazzulla. 2011. “On the Asymmetric User Perception of Transit Service Quality.” International Journal of Sustainable Transportation, 5(4): 216-232.
Condorcet, M. J. A. N. de Caritat. 1847. “Sur la forme des Zlections 1789.” Oeuvres 9: 285–330. English translation in McLean, I., and F. Hewitt (eds.) “Condorcet—Foundations of Social Choice and Political Theory”: 169–189.

Identifying Key Factors of Rail Transit Service Quality: An Empirical Analysis for Istanbul
Journal of Public Transportation, Vol. 20, No. 1, 2017 87
Coombs, C. H. 1964. A Theory of Data. Wiley, New York
Copeland, A. H. 1951. A Reasonable Social Welfare Function. University of Michigan, Department of Mathematics, Seminar on Applications of Mathematics to the Social Sciences.
Cox, G. W. 1989. “Undominated Candidate Strategies under Alternative Voting Rules.” Mathematical and Computer Modelling, 12(4/5): 451–459.
de Borda, J. ., 1781. “Mémoire sur les élections au scrutin.” Histoire de l’Académie Royale des Sciences, Paris.
de Oña, J., R. de Oña, and F. J. Calvo. 2012. “A Classification Tree Approach to İdentify Key Factors of Transit Service Quality.” Expert Systems with Applications, 39(12): 11164–71.
de Oña, R., L. Eboli, and G. Mazzulla. 2014. “Key Factors Affecting Rail Service Quality in Northern Italy: A Decision Tree Approach.” Transport, 29(1): 75-83.
de Oña, R., G. López, F. J. D. de los Rios, and J. de Oña, J. 2014. “Cluster Analysis for Diminishing Heterogeneous Opinions of Service Quality Public Transport Passengers.” Procedia–Social and Behavioral Sciences, 162: 459-466.
dell'Olio, L., A. Ibeas, and P. Cecín. 2010. :Modelling User Perception of Bus Transit Quality." Transport Policy, 17 (6): 388-397.
dell'Olio, L., A. Ibeas, and P. Cecín. 2011. “The Quality of Service Desired by Public Transport Users.” Transport Policy, 18(1): 217-227.
Dobrska, M., H. Wang, and W. Blackburn. 2011. “Data-driven Rank Ordering – A Preference-based Comparison Study.” International Journal of Computational Intelligence Systems, 4(2): 142–152.
Eboli, L., and G. Mazzulla. 2007. “Service Quality Attributes Affecting Customer Satisfaction for Bus Transit.” Journal of Public Transportation, 10(3): 21-34.
Eboli, L., and G. Mazzulla, G. 2008a. “A Stated Preference Experiment for Measuring Service Quality in Public Transport.” Transportation Planning and Technology, 31(5): 509-523.
Eboli, L., and G. Mazzulla. 2008b. “Willingness-to-Pay of Public Transport Users for Improvement in Service Quality.” European Transport, 38: 107–118.
Eboli, L., and G. Mazzulla. 2009. “A New Customer Satisfaction İndex for Evaluating Transit Service Quality.” Journal of Public Transportation, 12(3): 21–37.
Eboli, L., and G. Mazzulla. 2010. How to Capture the Passengers’ Point of View on a Transit Service through Rating and Choice Options.” Transport Review, 30: 4.
Eboli, L., and G. Mazzulla. 2011. “A Methodology for Evaluating Transit Service Quality Based on Subjective and Objective Measures from the Passenger’s Point of View.” Transport Policy 18: 172–181.

Identifying Key Factors of Rail Transit Service Quality: An Empirical Analysis for Istanbul
Journal of Public Transportation, Vol. 20, No. 1, 2017 88
Eboli, L., and G. Mazzulla. 2012. “Structural Equation Modelling for Analysing Passengers’ Perceptions about Railway Services.” Procedia–Social and Behavioral Sciences, 54: 96-106.
Eğecioğlu, Ö., and A. E. Giritligil. 2011. “The Likelihood of Choosing the Borda-Winner with Partial Preference Rankings of the Electorate.” Journal of Modern Applied Statistical Methods, 10(1): 349-61.
Erdélyi, G., M. R. Fellows, J. Rothe, and L. Schend. 2015. “Control Complexity in Bucklin and Fallback Voting: A Theoretical Analysis.” Journal of Computer and System Sciences, 81: 632-660.
Felsenthal, D.S., and N. Tideman. 2014. “Interacting Double Monotonicity Failure with Direction of İmpact under Five Voting Methods.” Mathematical Social Sciences, 67: 57-66.
Filipović, S., S. Tica, P. Živanović, and B. Milovanović. 2009. “Comparative Analysis of the Basic Features of the Expected and Perceived Quality of Mass Passenger Public Transport Service in Belgrade.” Transport, 24(4): 265-273.
Gerçek, H., B. Karpak, and T. Kılınçaslan. 2004. “A Multiple Criteria Approach for the Evaluation of the Rail Transit Networks in Istanbul.” Transportation, 31(2): 203-228.
Givoni, M., and P. Rietveld. 2007. “The Access Journey to the Railway Station and its Role in Passengers’ Satisfaction with Rail Travel.” Transport Policy, 14(5): 357-365.
Gronau, W., and A. Kagermeier. 2007. “Key Factors for Successful Leisure and Tourism Public Transport Provision.” Journal of Transport Geography 15(2): 127-135.
Hassan, M. N., Y. E. Hawas, and K. Ahmed. 2013. “A Multi-Dimensional Framework for Evaluating Transit Service Performance.” Transportation Research Part A: Policy and Practice, 50: 47-61.
Hoag, C. G., and G. H. Hallett. 1926. Proportional Representation. Macmillan, New York.
Hwang C. L., and M. Lin. 1987. Group Decision-Making: Mathematical Models. Springer-Verlag, Berlin.
Jen, W., R. Tu, and T. Lu. 2011. “Managing Passenger Behavioral İntention: An İntegrated Framework for Service Quality, Satisfaction, Perceived Value, and Switching Barriers.” Transportation, 38(2): 321-342.
Kelly, J. S. 1978. Arrow Impossibility Theorems. Academic Press, New York.
Le-Klähn, D. L., C. M. Hall, and R. Gerike. 2014. “Analysis of Visitor Satisfaction with Public Transport in Munich.” Journal of Public Transportation, 17(3).
Levin, J., and B. Nalebuff. 1995. “An Introduction to Vote-Counting Schemes.” Journal of Economic Perspectives, 9(1): 3-26.
Mattei, N., 2012. “Decisionmaking under Uncertainty: Theoretical and Empirical Results on Social Choice, Manipulation, and Bribery.” Doctoral dissertation, ProQuest (AAI3579270).

Identifying Key Factors of Rail Transit Service Quality: An Empirical Analysis for Istanbul
Journal of Public Transportation, Vol. 20, No. 1, 2017 89
Menton, C. 2013. “Attacking and Defending Popular Election Systems.” Doctoral dissertation, ProQuest (AAI3561011).
Mouwen, A., and P. Rietveld. 2013. “Does Competitive Tendering Improve Customer Satisfaction with Public Transport? A Case Study for the Netherlands.” Transportation Research Part A: Policy and Practice, 51: 29-45.
Nanson, E. 1883. “Methods of Elections.” Transactions and Proceedings of the Royal Society of Victoria, 19: 197-240.
Nathanail, E. 2008. “Measuring the Quality of Service for Passengers on the Hellenic Railways.” Transportation Research Part A: Policy and Practice, 42: 48-66.
Nwachukwu, A. A. 2014. “Assessment of Passenger Satisfaction with Intra-City Public Bus Transport Services in Abuja, Nigeria.” Journal of Public Transportation, 17(1): 5.
Plassmann, F., and T. N. Tideman. 2014. “How Frequently Do Different Voting Rules Encounter Voting Paradoxes in Three-Candidate Elections?” Social Choice and Welfare, 42: 31-75.
Redman, L., M. Friman, T. Gärling, and T. Hartig. 2013. “Quality Attributes of Public Transport that Attract Car Users: A Research Review.” Transport Policy, 25: 119-127.
Schulze, M. 2003. “A New Monotonic and Clone-İndependent Single-Winner Election Method.” Voting Matters, 17: 9-19.
Schulze, M., 2011. “A New Monotonic, Clone-İndependent, Reversal Symmetric, and Condorcet-consistent Single-Winner Election Method.” Social Choice and Welfare, 36(2): 267-303.
Tideman, T. N. 1987. “Independence of Clones as a Criterion for Voting Rules.” Social Choice and Welfare, 4(3): 185-206.
Turkish Statistical Institute. 2015. www.tuik.gov.tr, accessed July 9, 2015.
Tyrinopoulos, Y., and C. Antoniou. 2008. “Public Transit User Satisfaction: Variability and Policy İmplications.” Transport Policy, 15: 260–272.
Van Ryzin, G. G., and S. Immerwahr. 2007. “Importance-Performance Analysis of Citizen Satisfaction Surveys.” Public Administration, 85(1): 215-226.
Young, P. 1974. An Axiomatization of Borda’s Rule.” Journal of Economic Theory, 9: 43-52.
About the Authors
Erkan Isikli ([email protected]) is currently an instructor in the Department of Industrial Engineering at the Istanbul Technical University in Turkey. He received BSc. and MSc. degrees in Mathematical Engineering and Business and Administration from Istanbul Technical University in 2005 and 2007, respectively, and a Ph.D. degree in Industrial and Systems Engineering from Wayne State University in Detroit. He taught several graduate and undergraduate level courses during his Ph.D. studies and currently

Identifying Key Factors of Rail Transit Service Quality: An Empirical Analysis for Istanbul
Journal of Public Transportation, Vol. 20, No. 1, 2017 90
is conducting projects related to decisionmaking, statistics, data mining, mathematics, and public transportation.
Nezir Aydin ([email protected]) is currently an Assistant Professor in the Department of Industrial Engineering at the Yildiz Technical University in Istanbul, which he joined in 2014. He received BSc. and MSc. Degrees in Industrial Engineering from Yildiz Technical University in 2005 and 2007, respectively, a Ph.D. degree in Industrial and Systems Engineering from Wayne State University. He worked as a researcher andtaught several graduate and undergraduate level courses during his Ph.D. studies and currently is conducting projects related to optimization, mathematical modeling, humanitarian logistics, decisionmaking, supply chain management, and public transportation.
Erkan Celik ([email protected]) is an Assistant Professor in the Department of Industrial Engineering at Munzur University in Turkey. He received BSc. and MSc. degrees in Industrial Engineering from Selcuk University in 2008 and 2011, respectively, and a Ph.D. degree from the Department of Industrial Engineering at Yildiz Technical University in 2015. His research interests are in decision analysis, public transportation, humanitarian logistic, and fuzzy sets.
Alev Taskin Gumus ([email protected]) is an Associate Professor in the Department of Industrial Engineering at Yildiz Technical University. She received BSc. and MSc. degrees in Industrial Engineering from Yildiz Technical University, an MBA from Istanbul Technical University, and a Ph.D. in Industrial Engineering from Yildiz Technical University. She completed postdoctoral research at Zaragoza Logistics Center in Spain, and her research interests are in supply chain management, public transportation, production and inventory systems, decision analysis, artificial intelligence, and fuzzy logic applications in industrial engineering and management sciences.