Embed Size (px)
Citation preview

Identifying locations and timing of water extractions in the Barwon-Darling using remote sensing data
Australian Geoscience Data Cube pilot project
April 2017

Identifying locations and timing of water extractions in the Barwon-Darling using remote sensing data
i
Published by the Murray–Darling Basin Authority
MDBA publication no: 17/17
ISBN (online): 978-1-925599-23-7
© Murray–Darling Basin Authority 2017
With the exception of the Commonwealth Coat of Arms,
the MDBA logo, trademarks and any exempt
photographs and graphics (these are identified), this
publication is provided under a Creative Commons
Attribution 4.0 licence.
https://creativecommons.org/licenses/by/4.0
The Murray‒Darling Basin Authority’s preference is that you attribute this publication (and any Murray‒
Darling Basin Authority material sourced from it) using the following wording within your work:
Title: Identifying locations and timing of water extractions in the Barwon-Darling using remote
sensing data
Source: Licensed from the Murray‒Darling Basin Authority under a Creative Commons Attribution
4.0 Licence
Accessibility
The Murray‒Darling Basin Authority makes its documents and information available in accessible formats.
On some occasions the highly technical nature of the document means that we cannot make some
sections fully accessible. If you encounter accessibility problems or the document is in a format that you
cannot access, please contact us.
Acknowledgement of the Traditional Owners of the Murray–Darling Basin
The Murray–Darling Basin Authority acknowledges and pays respect to the Traditional Owners, and their
Nations, of the Murray–Darling Basin, who have a deep cultural, social, environmental, spiritual and
economic connection to their lands and waters. The MDBA understands the need for recognition of
Traditional Owner knowledge and cultural values in natural resource management associated with the Basin.
The approach of Traditional Owners to caring for the natural landscape, including water, can be expressed
in the words of the Northern Basin Aboriginal Nations Board:
…As the First Nations peoples (Traditional Owners) we are the knowledge holders, connected to
Country and with the cultural authority to share our knowledge. We offer perspectives to balance
and challenge other voices and viewpoints. We aspire to owning and managing water to protect
our totemic obligations, to carry out our way of life, and to teach our younger generations to
maintain our connections and heritage through our law and customs. When Country is happy, our
spirits are happy.
Cover image: Data Cube false colour imagery data observation, Barwon River, New South Wales
GPO Box 1801, Canberra ACT 2601
02 6279 0100
mdba.gov.au
Identifying locations and timing of water extractions in the Barwon-Darling using remote sensing data
ii
Contents Summary ...................................................................................................................................... iv
1 Introduction ........................................................................................................................... 1
2 Study Objective and Scope ................................................................................................... 2
3 Method .................................................................................................................................. 2
3.1 Stage 1: Property selection ............................................................................................ 2
3.2 Stage 2: Data collating ................................................................................................... 3
3.2.1 Pump thresholds ..................................................................................................... 4
3.3 Stage 3: Data quality control .......................................................................................... 4
3.4 Stage 4: Data analysis ................................................................................................... 5
3.4.1 Interpreting the False Colour Imagery data ............................................................. 5
4 Results and Discussion ......................................................................................................... 7
4.1 Data Analysis ................................................................................................................. 7
4.1.1 Event 1 - April 2014................................................................................................. 7
4.1.2 Event 2 - November 2014 ..................................................................................... 11
4.1.3 Event 3 - February 2015 ....................................................................................... 15
4.2 Key Findings ................................................................................................................ 21
4.2.1 Location and timing of extractions ......................................................................... 21
4.2.2 Location and observation of farm storages ............................................................ 22
4.2.3 Measurement and observation of crop areas ........................................................ 23
4.2.4 Observation of on-farm activities ........................................................................... 23
4.2.5 AGDC Limitations ................................................................................................. 24
5 Conclusion .......................................................................................................................... 25
6 References .......................................................................................................................... 26
Identifying locations and timing of water extractions in the Barwon-Darling using remote sensing data
iii
Figures
Figure 1: AGDC automated processing concept ....................................................................... 1
Figure 2: Key property features observed during study period .................................................. 2
Figure 3: Hydrograph for three events (March 2014 – March 2015) ......................................... 3
Figure 4: Example of diagonal striping ..................................................................................... 5
Figure 5: Data observations for 3 April 2014 ............................................................................ 7
Figure 6: Data observations for 11 April 2014 .......................................................................... 8
Figure 7: Data observations for 19 April 2014 .......................................................................... 8
Figure 8: Data observations for 6 June 2014 ............................................................................ 9
Figure 9: Data observations for 18 September 2014 ................................................................ 9
Figure 10: Hydrographic for Event 1, April 2014 ..................................................................... 10
Figure 11: Data observations for 4 October 2014 ................................................................... 11
Figure 12: Data observations for 29 November 2014 ............................................................. 12
Figure 13: Data observations for 15 December 2014 ............................................................. 13
Figure 14: Hydrographic for Event 2, November 2014 ............................................................ 14
Figure 15: Data observations for 31 December 2014 ............................................................. 15
Figure 16: Data observations for 8 January 2015 ................................................................... 16
Figure 17: Data observations for 1 February 2015 ................................................................. 17
Figure 18: Data observations for 9 February 2015 ................................................................. 17
Figure 19: Data observations for 17 February 2015 ............................................................... 18
Figure 20: Data observations for 5 March 2015 ...................................................................... 18
Figure 21: Data observations for 13 March 2015 .................................................................... 19
Figure 22: Hydrographic for Event 3, February 2015 .............................................................. 20
Figure 23: Example of WOfS (L) and FCI (R) data for July 16 2014 ....................................... 24
Figure 24: Example of WOfS (L) and FCI (R) data for September 18 2014 ............................ 24
Tables
Table 1: Interpreting shortwave infrared, near infrared and green FCI data .............................. 6

Identifying locations and timing of water extractions in the Barwon-Darling using remote sensing data
iv
Summary
The utility of the Australian Geoscience Data Cube (AGDC) was tested to determine if the
product could be used to support the Murray–Darling Basin Authority’s (MDBA) policy and
management decisions.
The AGDC is a data processing product developed to store and analyse large volumes of remote
sensing data such as Landsat satellite imagery. The AGDC is supported by a comprehensive
database from which data can be processed and extracted.
The study primarily used False Colour Imagery (FCI) data sourced from the AGDC to test if the
AGDC could be used to:
identify the location and timing of water extractions
locate and map farm storages and observe changes to storages over time
map and measure crop areas and observe changes to crop areas over time
observe other on-farm activities such as irrigation applications.
A single irrigated property (the study property) located on the Barwon River was used to test the
AGDC. AGDC data for the study property from March 2014 to March 2015 (the study period) was
analysed. The study period included three flow events at the study property.
Location and timing of water extractions
The AGDC was effective at identifying the location and time at which extractions commenced.
The accuracy of identifying when extractions commence is tied to the frequency of remote
sensed imagery and whether the imagery is impacted by cloud cover. AGDC data was available
at intervals of approximately 8-10 days. This has wider applications in addressing issues relating
to the improved management of environmental flows. By analysing FCI data, observations can
be made regarding the extent to which a flow event is extracted or remains in the river.
Location and observation of farm storages
Data sourced from the AGDC was used to effectively locate and map farm storages and observe
changes to storages over time. The AGDC was most effective for assessing if a storage is
completely empty (dry) or contained water. The user could determine the timing of a storage
transforming from dry to wet and from wet to dry. The AGDC was found to be less effective at
enabling the user to determine the volume of storage. The AGDC does not provide information
on the depth of water in storage, only the wet surface area.
During the study period the farm storages observed did not undergo any significant construction
works. However, the mapping technique would be a valuable tool that could be used to observe
how storages change over time including the construction of new storages, or the enlargement of
existing storages.

Identifying locations and timing of water extractions in the Barwon-Darling using remote sensing data
v
Measurement and observation of crop areas
The cropping cycle can be monitored, including the total area cropped, by analysing the AGDC
data. The use of the AGDC to map and measure crop areas has broader applications that could
support a range of policy and management decisions. By applying crop mapping techniques to
an entire river reach across several decades, conclusions could be drawn on how land use in the
reach has changed over time. This can be extended by using the mapped crop areas to derive
the water use required to produce those crops. Applying the AGDC in such a way would allow
the user to determine how water use in a river reach has changed over time.
Observation of on-farm activities
During the study period, on-farm activities such as ploughing and irrigation applications were
observed by analysing the AGDC data. It was possible to observe irrigation events when the
timing of satellite passes and irrigation applications aligned, however, the occasions at which this
occurred were rare. Therefore, in terms of observing on-farm activities the AGDC has some
limited applications. One application could be to analyse AGDC data for a broad timeframe to
observe existing irrigation patterns and determine how irrigation trends and behaviours have
changed over time.
Conclusion
The AGDC is being enhanced to provide greater pixel resolution and increased frequency of
satellite observations. These enhancements will be available in 2017. There is an opportunity to
further improve the AGDC by reducing the image access time from the current period of 2-3
months to just two days. A fully enhanced AGDC would be useful in supporting policy and
management decisions. Some specific areas of use may include applications associated with:
• identifying extraction locations and timings such as observing flow events and
addressing issues linked to the improved management of environmental flows
• mapping and observing farm storages over time such as how existing storages
change and when new storages are constructed or enlarged
• identifying crop areas such as how crop areas change over time and the implications
these changes have on water demand
• observing on-farm activities such as existing irrigation trends and how irrigation
behaviours have changed over time.
As the AGDC continues to develop, it will become an increasingly useful resource to support
MDBA policy and management decisions.

Identifying locations and timing of water extractions in the Barwon-Darling using remote sensing data
Page 1
1 Introduction
The Murray–Darling Basin Authority (MDBA) is testing the utility of the Australian Geoscience
Data Cube (AGDC) to support policy and management decisions.
The AGDC is a processing framework and infrastructure developed to store and analyse large
volumes of earth observation, or remote sensing, data, such as Landsat satellite imagery. It
includes a large database that can be queried to extract and process data into derivative
products, particularly for use by non-experts in remote sensing.
This is achieved by using the ‘dice and stack’ method (depicted in Figure 1) to clip pre-processed
imagery scenes into one degree tiles to form a nested grid of imagery tiles over time. Through
this framework, each pixel in an imagery tile can be traced back to its original observation. By
making the data consistent, accessible, relatively timely, and ready-to-use, the AGDC
encourages the use of the growing catalogue of earth observations. The flexibility of the AGDC’s
framework also allows other earth observation data collections to be easily added. (Australian
Geoscience Data Cube, 2016)
Figure 1: AGDC automated processing concept (Australian Geoscience Data Cube, 2016)
The AGDC’s dice and stack method arranges data so that the user can select and observe a
particular area, referred to as a tile. The user can extract data products associated with this tile
over time. Data products considered in this project include the Water Observations from Space
(WOfS) and False Colour Imagery (FCI). WOfS data contains historical surface water
observations derived from satellite imagery (Geoscience Australia, 2017). FCI data expresses
satellite data in a range of falsified colours that the user can more readily interpret or understand
(NASA Earth Observing System, 2017). Both FCI and WOfS data provides information regarding
the presence of surface water in the landscape over time.
This study investigates the potential to identify the location and timing of water extractions using
FCI and WOFs data contained in the AGDC.

Identifying locations and timing of water extractions in the Barwon-Darling using remote sensing data
Page 2
2 Study Objective and Scope
This study tested if the AGDC can be used to:
identify the location and timing of water extractions
locate and map farm storages and observe changes to storages over time
map and measure crop areas and observe changes to crop areas over time
observe other on-farm activities such as irrigation applications.
The scope of the study was a single irrigated property (the study property) located on the Barwon
River. The study was restricted to AGDC data captured from March 2014 to March 2015 inclusive
(the study period). The study period included three flow events at the study property.
3 Method
The project was carried out in four stages:
• Stage 1: Property selection
• Stage 2: Data collating
• Stage 3: Data quality control
• Stage 4: Data analysis
3.1 Stage 1: Property selection
A study property was identified on the Barwon River that had irrigation, farm storages and an
offtake channel. Subareas representing these key features on the study property were
investigated (Figure 2). Two paddocks were selected for observation over the study period
(Figure 2(A) – scale 1:25,000). The paddocks are referred to as Northern Paddock and Southern
Paddock. Inset B and C in Figure 2 show two farm storages that are used to hold water during
the study period. Both storages are represented at a 1:25,000 scale. Inset D is scaled at
1:12,000 and shows the point at which extractions are made from the Barwon River. Extractions
are diverted through the offtake channel illustrated at Figure 2 (D).
Figure 2: Key property features observed during study period
Identifying locations and timing of water extractions in the Barwon-Darling using remote sensing data
Page 3
3.2 Stage 2: Data collating
Stage 2 involved the extraction of relevant tiles from the AGDC. The relevant tiles were selected
by:
• using the one degree tile map to identify the tiles that cover the study property
• specifying the time period before, during and after flow events by analysing
hydrographs for the Barwon River from 2014 and 2015.
Initially, a MDBA project officer worked onsite at Geoscience Australia (GA) to receive training on
how to extract the required imagery tiles from the AGDC. This method of information gathering
proved challenging due to the degree of knowledge required to operate the AGDC.
Consequently, GA officers provided the requested data to the MDBA.
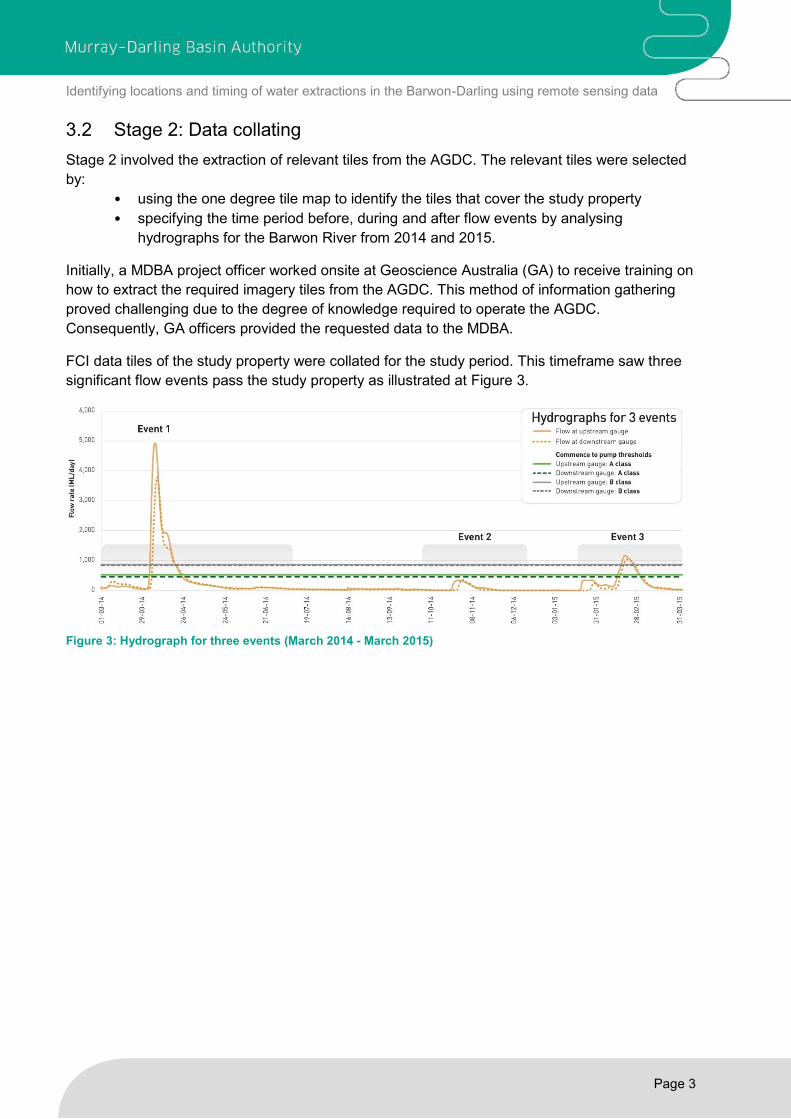
FCI data tiles of the study property were collated for the study period. This timeframe saw three
significant flow events pass the study property as illustrated at Figure 3.
Figure 3: Hydrograph for three events (March 2014 - March 2015)

Identifying locations and timing of water extractions in the Barwon-Darling using remote sensing data
Page 4
3.2.1 Pump thresholds
The hydrograph at Figure 3 shows four lines indicating commence-to-pump thresholds.
Commence-to-pump lines indicate the flow rate thresholds required to be met before pumping is
permitted to commence. The commence-to-pump thresholds are set out in the Water Sharing
Plan (WSP) for the Barwon-Darling Unregulated and Alluvial Water Sources 2012 (NSW
Government, 2016) and are as follows:
For unregulated A Class licences to be activated the following conditions must be met:
• more than 530 ML/day at the gauge upstream of the study property and more than
460 ML/day at the gauge downstream of the study property, and
• less than or equal to 870 ML/day at the gauge upstream of the property or less than or
equal to 840 ML/day at the gauge downstream of the study property.
For unregulated B Class licences to be activated the following conditions must be met:
• more than 870 ML/day at the gauge upstream of the study property and more than
840 ML/day at the gauge downstream of the study property, and
• less than or equal to 6,800 ML/day at the gauge downstream of the study property.
During the study period C class licence commence-to-pump thresholds were not triggered and therefore do not appear on the hydrograph at Figure 3.
3.3 Stage 3: Data quality control
Quality control criteria were applied to the FCI data tiles. The data quality control stage
eliminated data tiles where the tiles:
• did not contain adequate data to make the study property visible
• displayed > 50% cloud cover
• displayed > 50% cloud shadow
• displayed > 50% terrain shadow
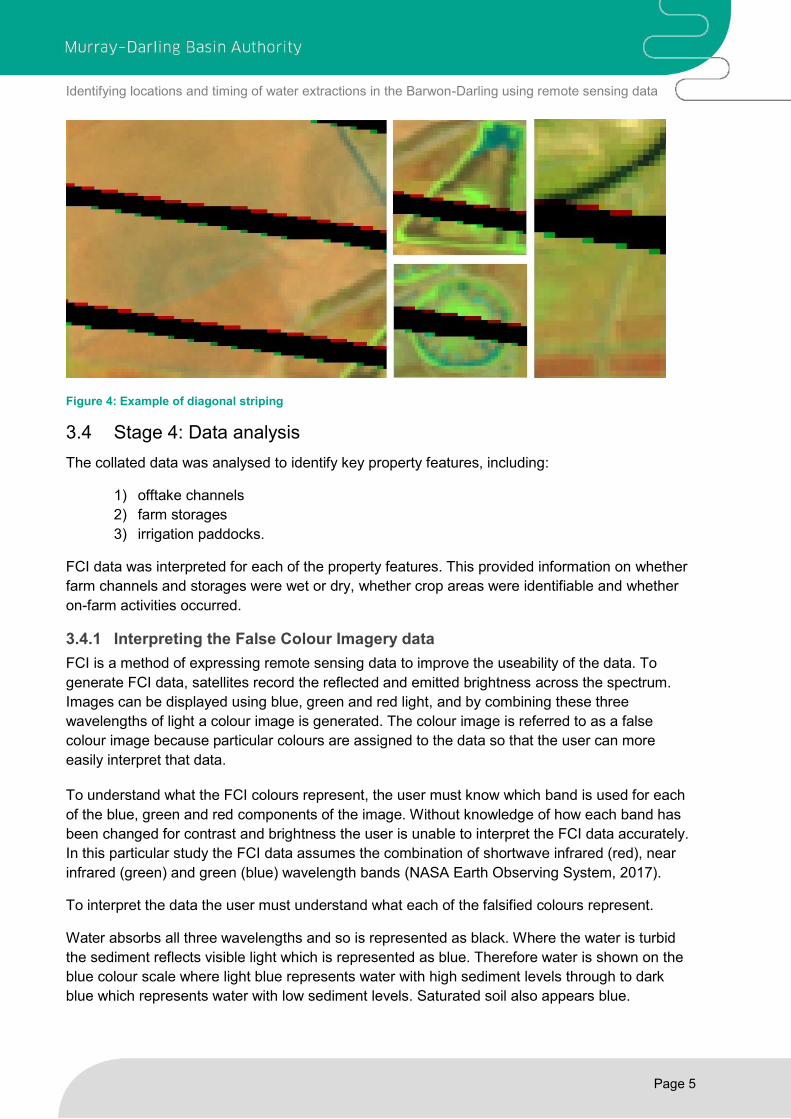
Diagonal striping, as shown at Figure 4, was present in much of the FCI data extracted from the
AGDC. Diagonal striping is common to data captured from Landsat 7. The diagonal striping is
due to a malfunction in the satellite's scanning equipment. The striping does not affect
interpretation of the imagery and so data that showed diagonal striping was not eliminated during
the data quality control stage.
The data for the study period that was deemed to be of suitable quality was collated into an
ArcGIS file.
Identifying locations and timing of water extractions in the Barwon-Darling using remote sensing data
Page 5
Figure 4: Example of diagonal striping
3.4 Stage 4: Data analysis
The collated data was analysed to identify key property features, including:
1) offtake channels
2) farm storages
3) irrigation paddocks.
FCI data was interpreted for each of the property features. This provided information on whether
farm channels and storages were wet or dry, whether crop areas were identifiable and whether
on-farm activities occurred.
3.4.1 Interpreting the False Colour Imagery data
FCI is a method of expressing remote sensing data to improve the useability of the data. To
generate FCI data, satellites record the reflected and emitted brightness across the spectrum.
Images can be displayed using blue, green and red light, and by combining these three
wavelengths of light a colour image is generated. The colour image is referred to as a false
colour image because particular colours are assigned to the data so that the user can more
easily interpret that data.
To understand what the FCI colours represent, the user must know which band is used for each
of the blue, green and red components of the image. Without knowledge of how each band has
been changed for contrast and brightness the user is unable to interpret the FCI data accurately.
In this particular study the FCI data assumes the combination of shortwave infrared (red), near
infrared (green) and green (blue) wavelength bands (NASA Earth Observing System, 2017).
To interpret the data the user must understand what each of the falsified colours represent.
Water absorbs all three wavelengths and so is represented as black. Where the water is turbid
the sediment reflects visible light which is represented as blue. Therefore water is shown on the
blue colour scale where light blue represents water with high sediment levels through to dark
blue which represents water with low sediment levels. Saturated soil also appears blue.
Identifying locations and timing of water extractions in the Barwon-Darling using remote sensing data
Page 6
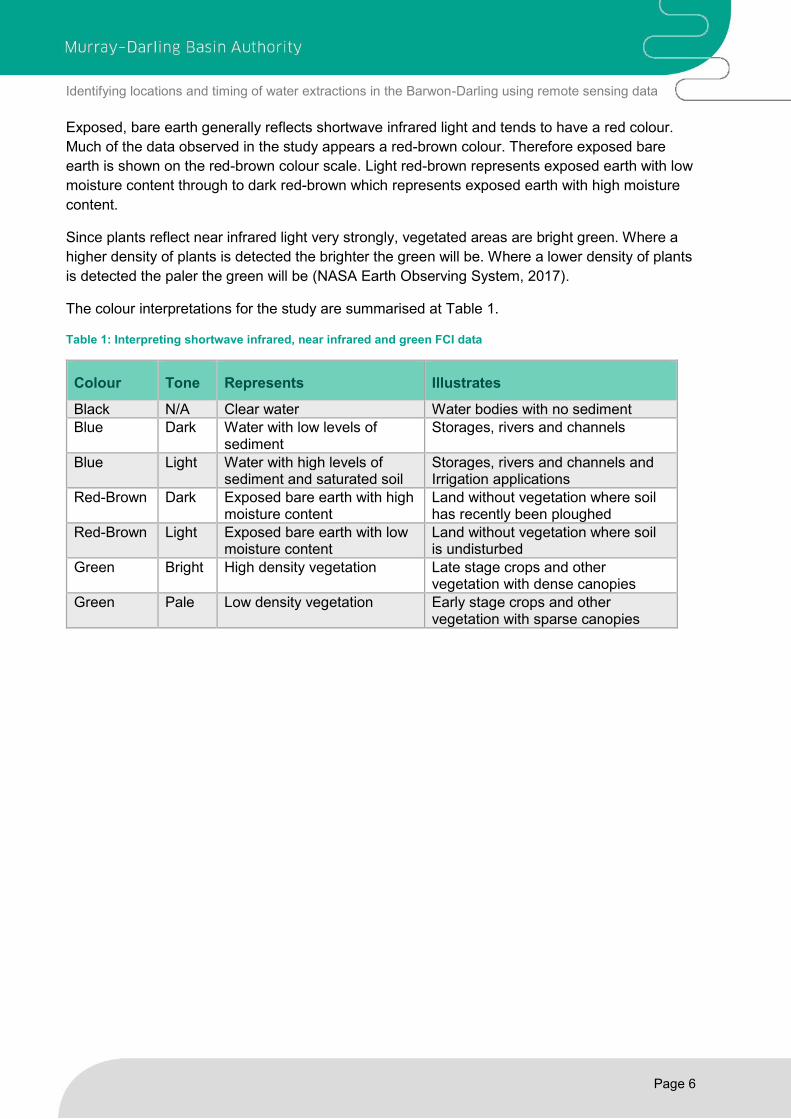
Exposed, bare earth generally reflects shortwave infrared light and tends to have a red colour.
Much of the data observed in the study appears a red-brown colour. Therefore exposed bare
earth is shown on the red-brown colour scale. Light red-brown represents exposed earth with low
moisture content through to dark red-brown which represents exposed earth with high moisture
content.
Since plants reflect near infrared light very strongly, vegetated areas are bright green. Where a
higher density of plants is detected the brighter the green will be. Where a lower density of plants
is detected the paler the green will be (NASA Earth Observing System, 2017).
The colour interpretations for the study are summarised at Table 1.
Table 1: Interpreting shortwave infrared, near infrared and green FCI data
Colour Tone Represents Illustrates
Black N/A Clear water Water bodies with no sediment
Blue Dark Water with low levels of sediment
Storages, rivers and channels
Blue Light Water with high levels of sediment and saturated soil
Storages, rivers and channels and Irrigation applications
Red-Brown Dark Exposed bare earth with high moisture content
Land without vegetation where soil has recently been ploughed
Red-Brown Light Exposed bare earth with low moisture content
Land without vegetation where soil is undisturbed
Green Bright High density vegetation Late stage crops and other vegetation with dense canopies
Green Pale Low density vegetation Early stage crops and other vegetation with sparse canopies
Identifying locations and timing of water extractions in the Barwon-Darling using remote sensing data
Page 7
4 Results and Discussion
4.1 Data Analysis
4.1.1 Event 1 - April 2014
Event Observations
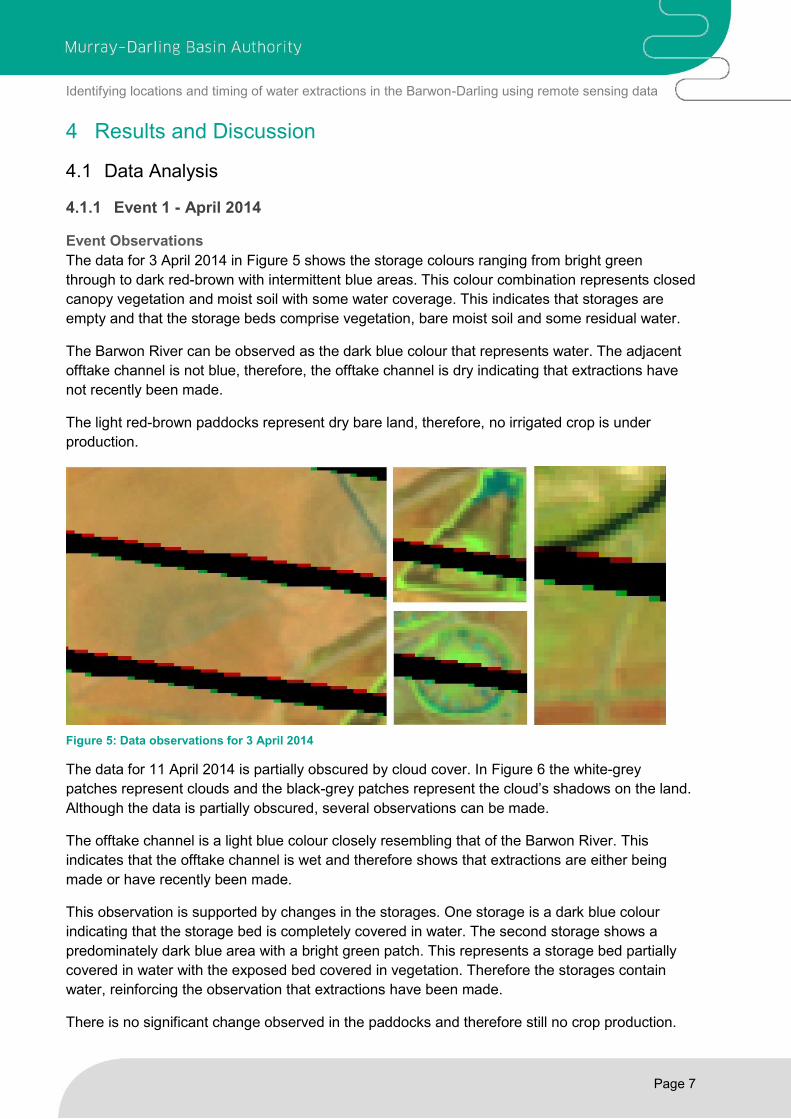
The data for 3 April 2014 in Figure 5 shows the storage colours ranging from bright green
through to dark red-brown with intermittent blue areas. This colour combination represents closed
canopy vegetation and moist soil with some water coverage. This indicates that storages are
empty and that the storage beds comprise vegetation, bare moist soil and some residual water.
The Barwon River can be observed as the dark blue colour that represents water. The adjacent
offtake channel is not blue, therefore, the offtake channel is dry indicating that extractions have
not recently been made.
The light red-brown paddocks represent dry bare land, therefore, no irrigated crop is under
production.
Figure 5: Data observations for 3 April 2014
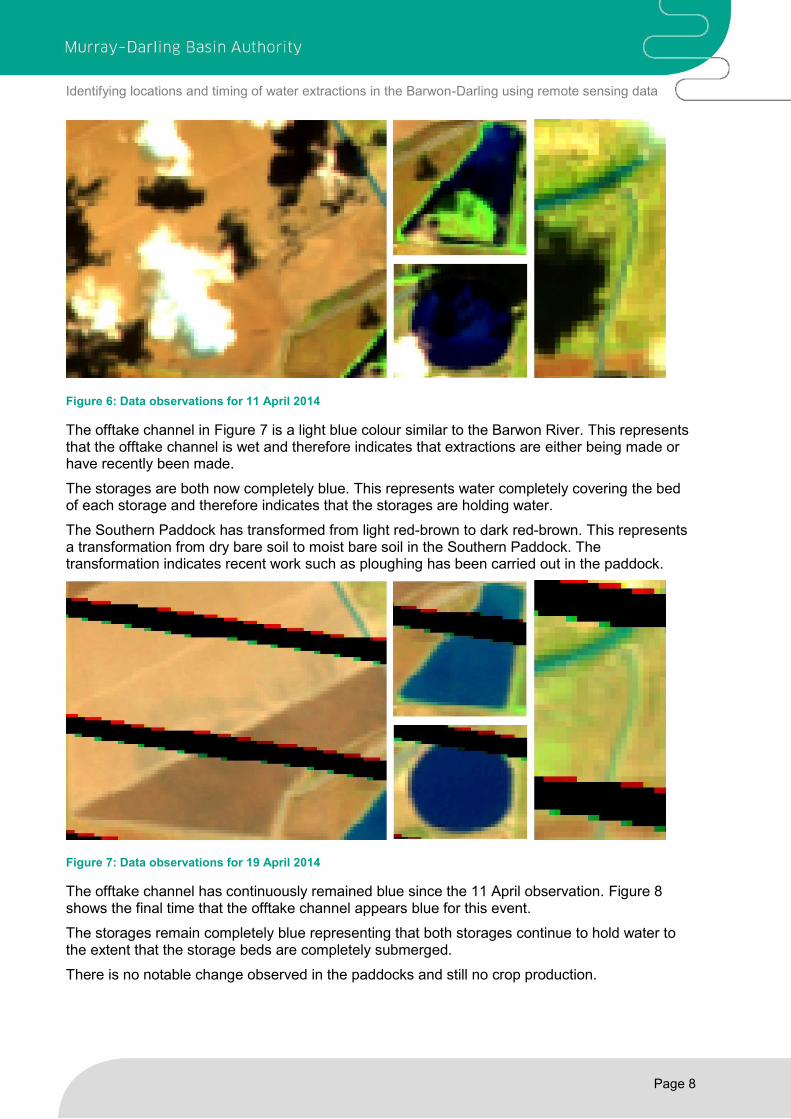
The data for 11 April 2014 is partially obscured by cloud cover. In Figure 6 the white-grey
patches represent clouds and the black-grey patches represent the cloud’s shadows on the land.
Although the data is partially obscured, several observations can be made.
The offtake channel is a light blue colour closely resembling that of the Barwon River. This
indicates that the offtake channel is wet and therefore shows that extractions are either being
made or have recently been made.
This observation is supported by changes in the storages. One storage is a dark blue colour
indicating that the storage bed is completely covered in water. The second storage shows a
predominately dark blue area with a bright green patch. This represents a storage bed partially
covered in water with the exposed bed covered in vegetation. Therefore the storages contain
water, reinforcing the observation that extractions have been made.
There is no significant change observed in the paddocks and therefore still no crop production.
Identifying locations and timing of water extractions in the Barwon-Darling using remote sensing data
Page 8
Figure 6: Data observations for 11 April 2014
The offtake channel in Figure 7 is a light blue colour similar to the Barwon River. This represents that the offtake channel is wet and therefore indicates that extractions are either being made or have recently been made.
The storages are both now completely blue. This represents water completely covering the bed of each storage and therefore indicates that the storages are holding water.
The Southern Paddock has transformed from light red-brown to dark red-brown. This represents a transformation from dry bare soil to moist bare soil in the Southern Paddock. The transformation indicates recent work such as ploughing has been carried out in the paddock.
Figure 7: Data observations for 19 April 2014
The offtake channel has continuously remained blue since the 11 April observation. Figure 8 shows the final time that the offtake channel appears blue for this event.
The storages remain completely blue representing that both storages continue to hold water to the extent that the storage beds are completely submerged.
There is no notable change observed in the paddocks and still no crop production.
Identifying locations and timing of water extractions in the Barwon-Darling using remote sensing data
Page 9
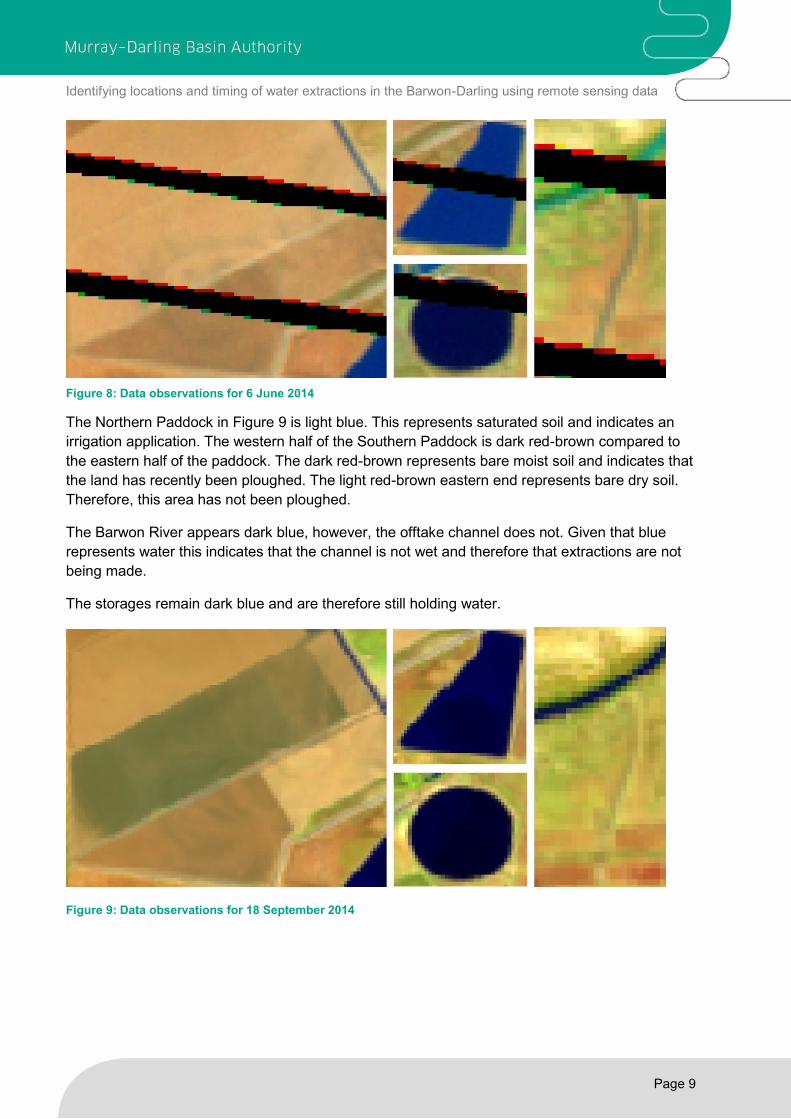
Figure 8: Data observations for 6 June 2014
The Northern Paddock in Figure 9 is light blue. This represents saturated soil and indicates an
irrigation application. The western half of the Southern Paddock is dark red-brown compared to
the eastern half of the paddock. The dark red-brown represents bare moist soil and indicates that
the land has recently been ploughed. The light red-brown eastern end represents bare dry soil.
Therefore, this area has not been ploughed.
The Barwon River appears dark blue, however, the offtake channel does not. Given that blue
represents water this indicates that the channel is not wet and therefore that extractions are not
being made.
The storages remain dark blue and are therefore still holding water.
Figure 9: Data observations for 18 September 2014
Identifying locations and timing of water extractions in the Barwon-Darling using remote sensing data
Page 10
Event Summary
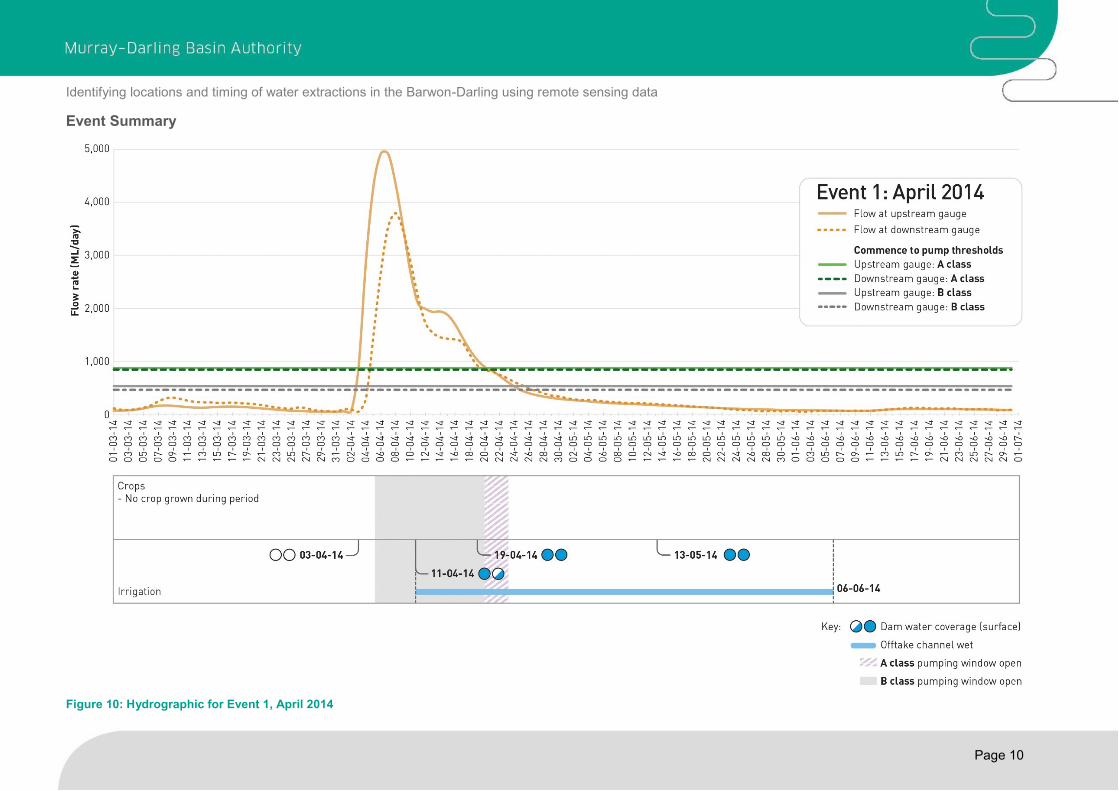
Figure 10: Hydrographic for Event 1, April 2014
Identifying locations and timing of water extractions in the Barwon-Darling using remote sensing data
Page 11
Figure 10 summarises the key observations made against the hydrograph for Event 1.
At the beginning of the event, on 3 April, no significant water coverage was detected in either of
the property’s storages. However, data for the 11 April observation indicates that water is present
in the storages. In addition, the offtake channel is also wet. This shows that extractions began to
occur at the property during the week 4-11 April. Data observations showed that the offtake
channel remained wet through until 6 June. This does not mean that water was extracted for this
whole period as the channel would remain wet for a period after extractions ceased.
These observations can be verified using the hydrograph at Figure 10. The hydrograph shows
that at the time that extractions were made, the flow had exceeded commence-to-pump
thresholds for B-class licences. This means that appropriate conditions for B-class licence
holders to make extractions were met.
Although there was some on-farm activity such as ploughing and irrigation application, no crops
were produced on either of the paddocks during this event.
4.1.2 Event 2 - November 2014
Event Observations
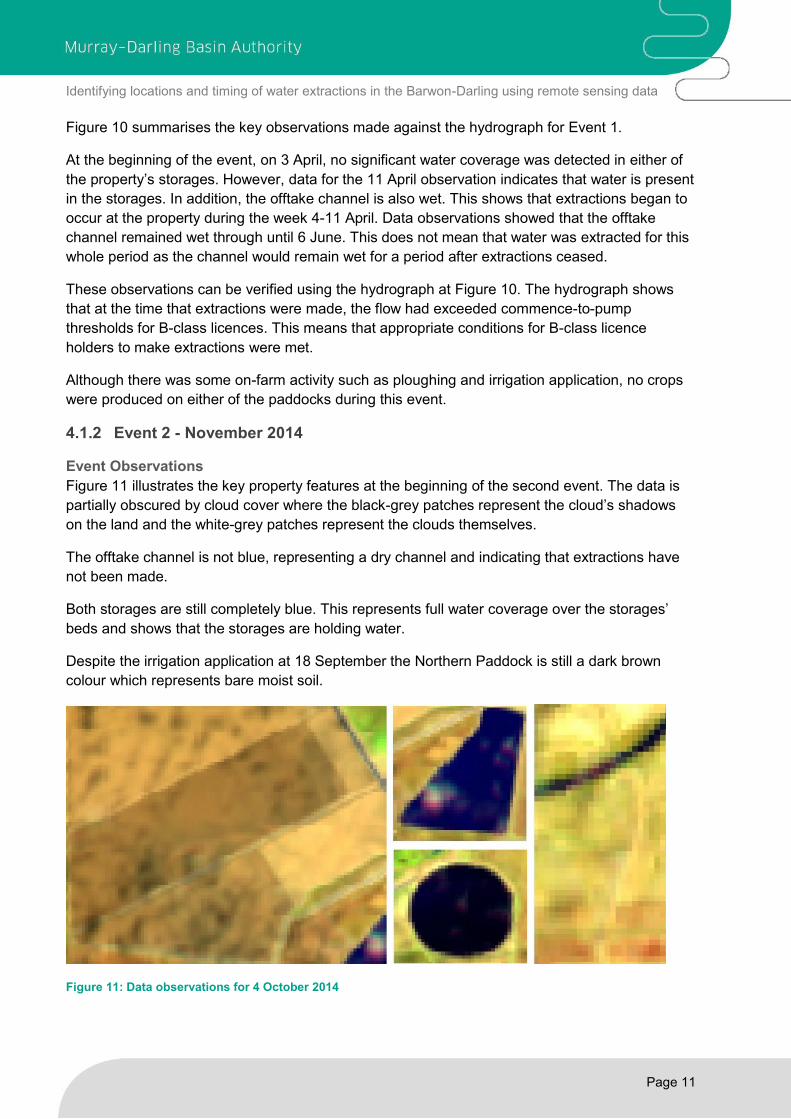
Figure 11 illustrates the key property features at the beginning of the second event. The data is
partially obscured by cloud cover where the black-grey patches represent the cloud’s shadows
on the land and the white-grey patches represent the clouds themselves.
The offtake channel is not blue, representing a dry channel and indicating that extractions have
not been made.
Both storages are still completely blue. This represents full water coverage over the storages’
beds and shows that the storages are holding water.
Despite the irrigation application at 18 September the Northern Paddock is still a dark brown
colour which represents bare moist soil.
Figure 11: Data observations for 4 October 2014

Identifying locations and timing of water extractions in the Barwon-Darling using remote sensing data
Page 12
The data at Figure 12 shows the Northern Paddock as pale green. Pale green represents low
density vegetation. This shows the sparse canopy of an early stage crop. This observation
supports the irrigation application observation made at 18 September (Figure 9).
Storages remain blue, representing water. This shows that the storages are still holding water.
Although the Barwon River is shown as a dark blue line the offtake channel is not. This
represents water present in the river but not in the offtake channel. Therefore, no extractions
have been made.
Figure 12: Data observations for 29 November 2014
Identifying locations and timing of water extractions in the Barwon-Darling using remote sensing data
Page 13
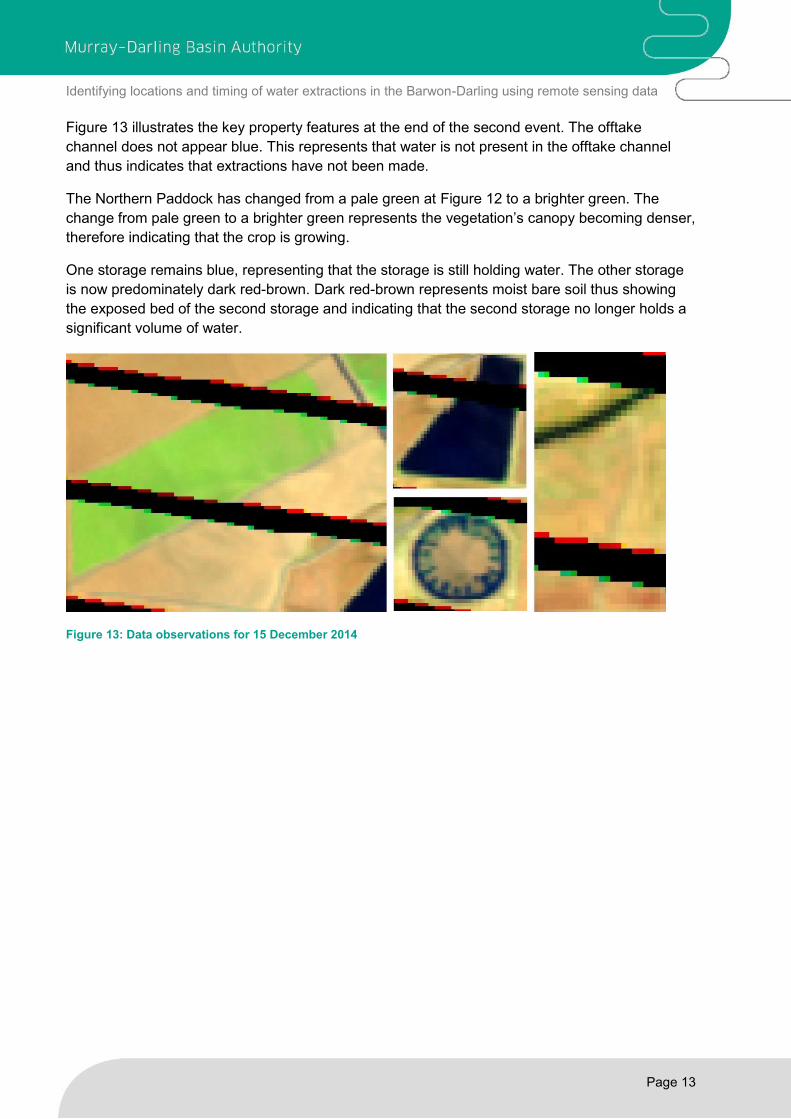
Figure 13 illustrates the key property features at the end of the second event. The offtake
channel does not appear blue. This represents that water is not present in the offtake channel
and thus indicates that extractions have not been made.
The Northern Paddock has changed from a pale green at Figure 12 to a brighter green. The
change from pale green to a brighter green represents the vegetation’s canopy becoming denser,
therefore indicating that the crop is growing.
One storage remains blue, representing that the storage is still holding water. The other storage
is now predominately dark red-brown. Dark red-brown represents moist bare soil thus showing
the exposed bed of the second storage and indicating that the second storage no longer holds a
significant volume of water.
Figure 13: Data observations for 15 December 2014

Identifying locations and timing of water extractions in the Barwon-Darling using remote sensing data
Page 14
Event Summary
Figure 14: Hydrographic for Event 2, November 2014

Identifying locations and timing of water extractions in the Barwon-Darling using remote sensing data
Page 15
Figure 14 summarises the key observations made against the hydrograph for Event 2. No
extractions were made at the property during this event. This is supported by the observation that
the offtake channel remains dry throughout this period. Further, at the beginning of this event
both storages held water, however, by the end of the event the resources in one of the storages
had been exhausted. The crop produced during this event relied on resources held in storage for
irrigation alone since no extractions were made. This is reinforced by the depletion of one of the
storages throughout the event.
These observations can be verified using the hydrograph at Figure 14 The hydrograph shows
that flow did not exceed commence-to-pump thresholds for either A-class or B-class licences.
This means that appropriate conditions were not met for licence holders to make extractions.
Although this study only conveys data for two paddocks, it is important to note that crop is
produced at other sections of the property in sequence with the crop produced at the Northern
Paddock. The overall crop area produced at the property during this event is approximately 236
hectares, as is noted in Figure 14.
4.1.3 Event 3 - February 2015
Event Observations
Figure 15 shows the key features at the beginning of the third event. The offtake channel is not
blue, representing a dry channel and indicating that extractions have not been made.
One storage appears completely blue representing full water coverage over the storage bed. The
other storage is a combination of light and dark red-browns representing bare soil with varying
levels of moisture and blue around the storage periphery, indicating residual water. This indicates
that only one of the two storages is holding water.
The Northern Paddock that was observed as green during Event 2, continues to brighten. This
represents the crop’s canopy becoming denser as the crop grows. The Southern Paddock is the
light red-brown which represents bare, dry soil.
Figure 15: Data observations for 31 December 2014
Identifying locations and timing of water extractions in the Barwon-Darling using remote sensing data
Page 16
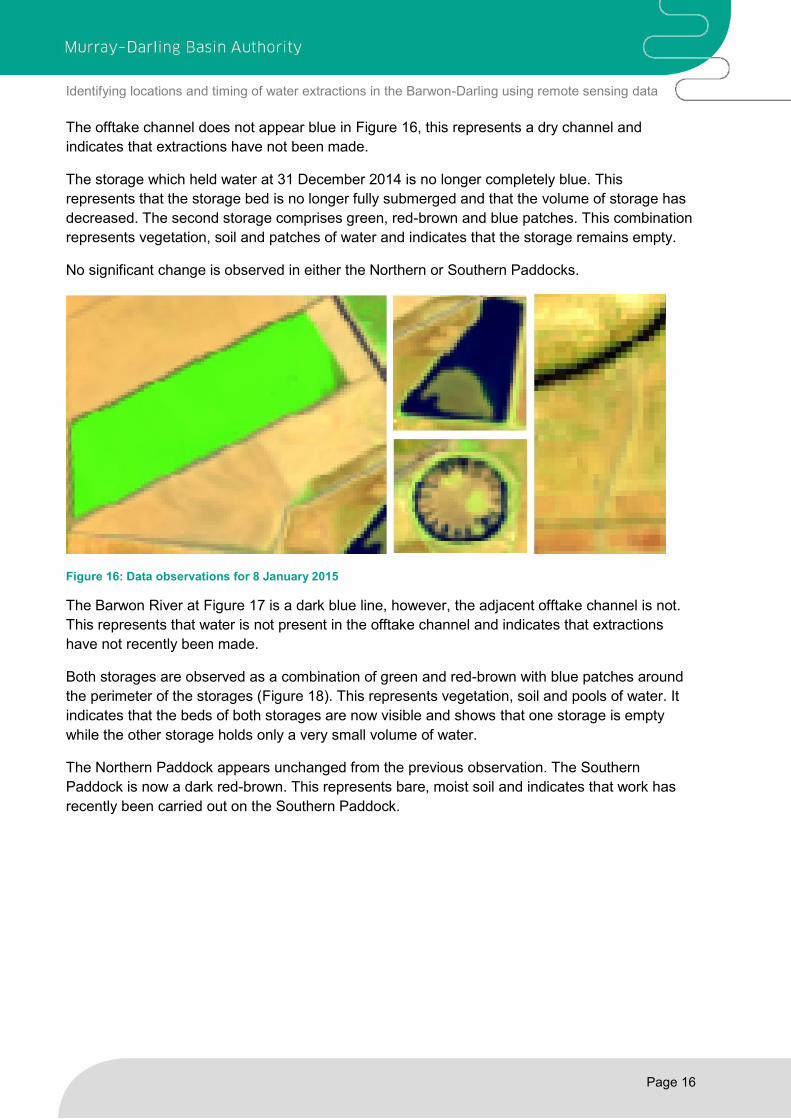
The offtake channel does not appear blue in Figure 16, this represents a dry channel and
indicates that extractions have not been made.
The storage which held water at 31 December 2014 is no longer completely blue. This
represents that the storage bed is no longer fully submerged and that the volume of storage has
decreased. The second storage comprises green, red-brown and blue patches. This combination
represents vegetation, soil and patches of water and indicates that the storage remains empty.
No significant change is observed in either the Northern or Southern Paddocks.
Figure 16: Data observations for 8 January 2015
The Barwon River at Figure 17 is a dark blue line, however, the adjacent offtake channel is not.
This represents that water is not present in the offtake channel and indicates that extractions
have not recently been made.
Both storages are observed as a combination of green and red-brown with blue patches around
the perimeter of the storages (Figure 18). This represents vegetation, soil and pools of water. It
indicates that the beds of both storages are now visible and shows that one storage is empty
while the other storage holds only a very small volume of water.
The Northern Paddock appears unchanged from the previous observation. The Southern
Paddock is now a dark red-brown. This represents bare, moist soil and indicates that work has
recently been carried out on the Southern Paddock.

Identifying locations and timing of water extractions in the Barwon-Darling using remote sensing data
Page 17
Figure 17: Data observations for 1 February 2015
The offtake channel appears as a dark blue line in Figure 18. Blue represents water and
indicates the offtake channel is wet and extractions have been made.
Both storages are observed as a combination of green, red-brown and blue patches. This
represents the storage beds which are composed of vegetation, soil and residual water. Neither
storage is observed as holding any significant volume of water.
No significant changes are observed in either of the paddocks.
Figure 18: Data observations for 9 February 2015
Identifying locations and timing of water extractions in the Barwon-Darling using remote sensing data
Page 18
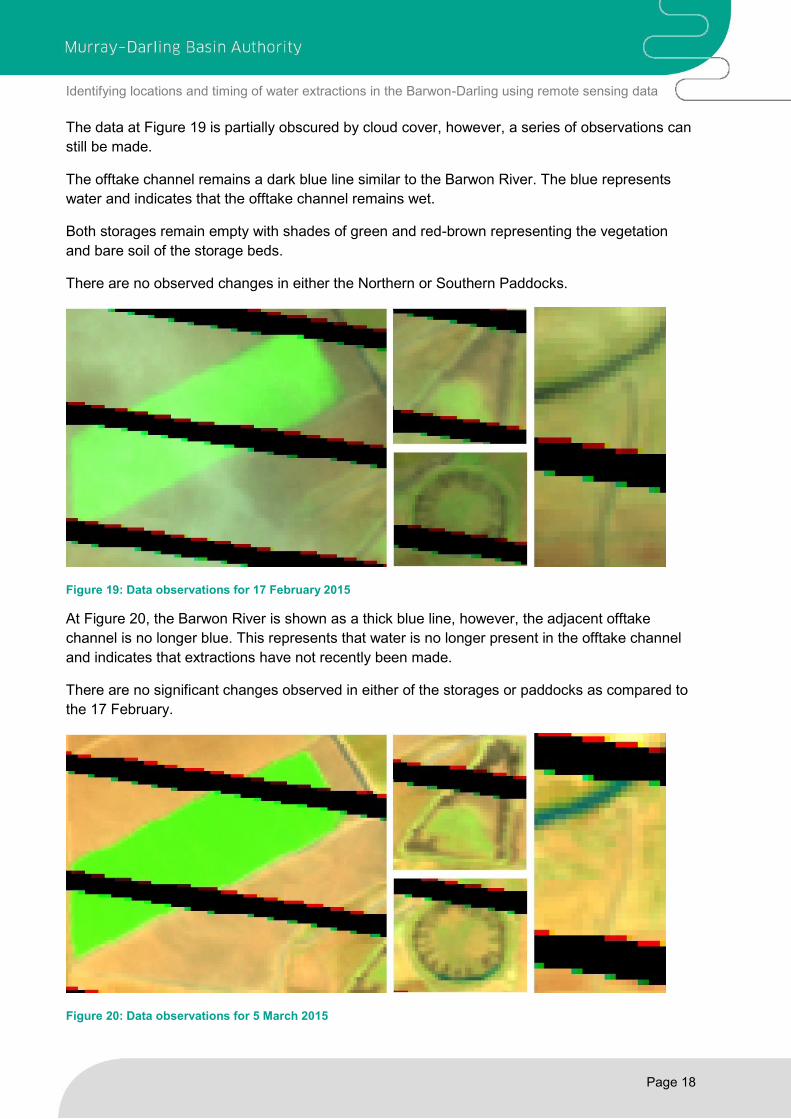
The data at Figure 19 is partially obscured by cloud cover, however, a series of observations can
still be made.
The offtake channel remains a dark blue line similar to the Barwon River. The blue represents
water and indicates that the offtake channel remains wet.
Both storages remain empty with shades of green and red-brown representing the vegetation
and bare soil of the storage beds.
There are no observed changes in either the Northern or Southern Paddocks.
Figure 19: Data observations for 17 February 2015
At Figure 20, the Barwon River is shown as a thick blue line, however, the adjacent offtake
channel is no longer blue. This represents that water is no longer present in the offtake channel
and indicates that extractions have not recently been made.
There are no significant changes observed in either of the storages or paddocks as compared to
the 17 February.
Figure 20: Data observations for 5 March 2015
Identifying locations and timing of water extractions in the Barwon-Darling using remote sensing data
Page 19
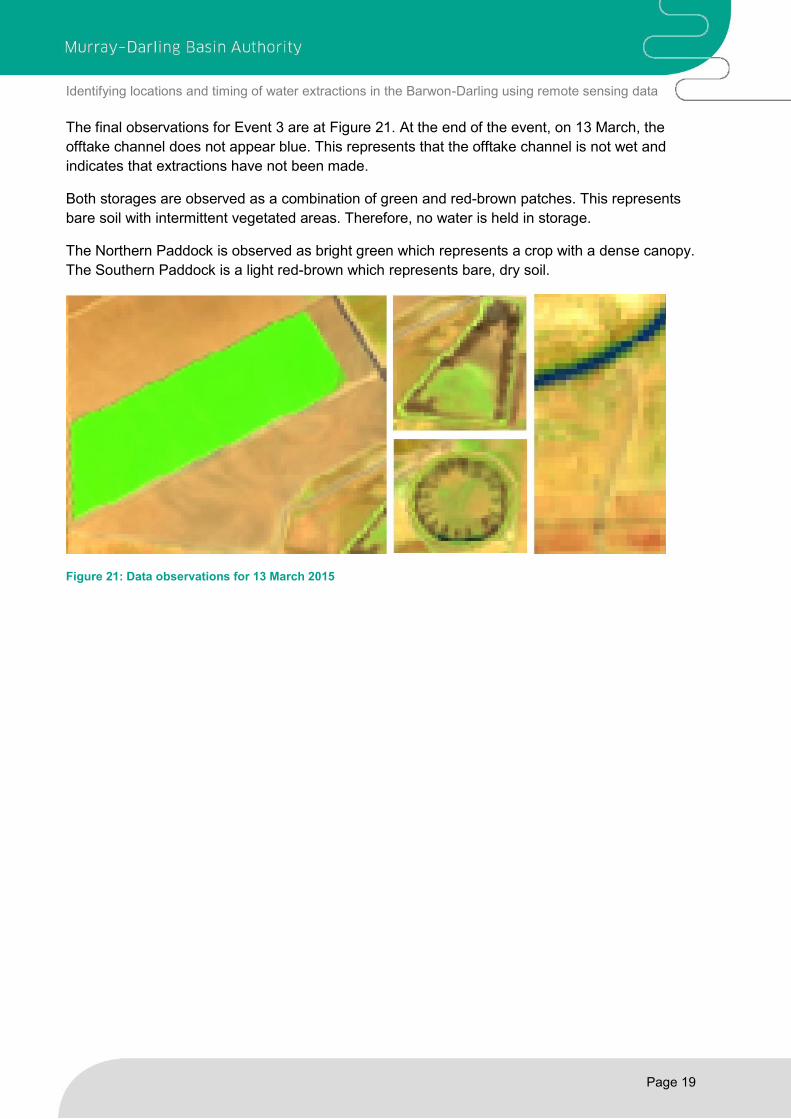
The final observations for Event 3 are at Figure 21. At the end of the event, on 13 March, the
offtake channel does not appear blue. This represents that the offtake channel is not wet and
indicates that extractions have not been made.
Both storages are observed as a combination of green and red-brown patches. This represents
bare soil with intermittent vegetated areas. Therefore, no water is held in storage.
The Northern Paddock is observed as bright green which represents a crop with a dense canopy.
The Southern Paddock is a light red-brown which represents bare, dry soil.
Figure 21: Data observations for 13 March 2015
Identifying locations and timing of water extractions in the Barwon-Darling using remote sensing data
Page 20
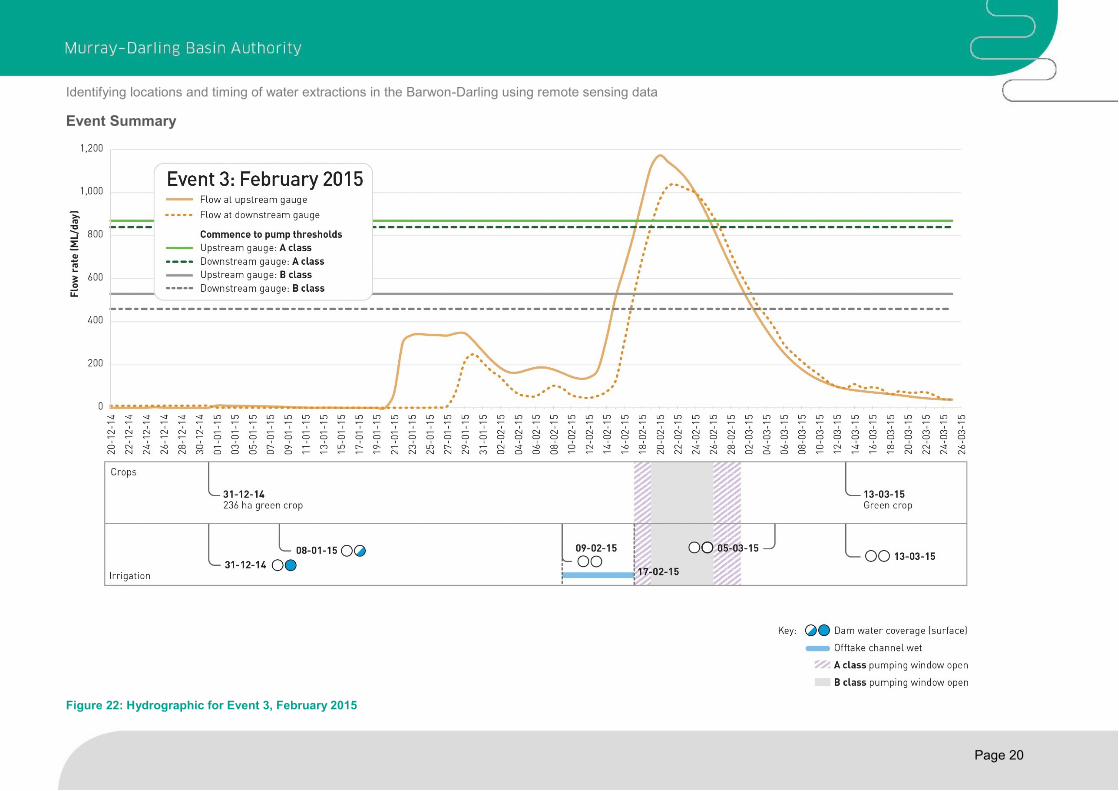
Event Summary
Figure 22: Hydrographic for Event 3, February 2015
Identifying locations and timing of water extractions in the Barwon-Darling using remote sensing data
Page 21
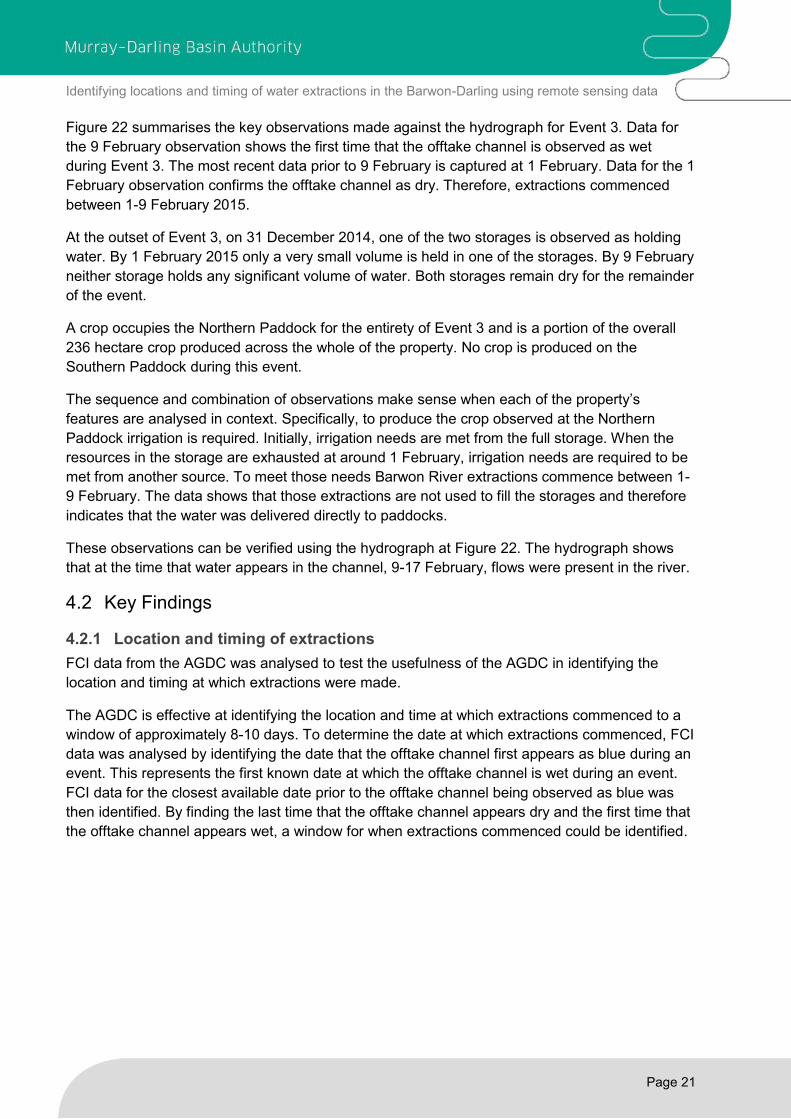
Figure 22 summarises the key observations made against the hydrograph for Event 3. Data for
the 9 February observation shows the first time that the offtake channel is observed as wet
during Event 3. The most recent data prior to 9 February is captured at 1 February. Data for the 1
February observation confirms the offtake channel as dry. Therefore, extractions commenced
between 1-9 February 2015.
At the outset of Event 3, on 31 December 2014, one of the two storages is observed as holding
water. By 1 February 2015 only a very small volume is held in one of the storages. By 9 February
neither storage holds any significant volume of water. Both storages remain dry for the remainder
of the event.
A crop occupies the Northern Paddock for the entirety of Event 3 and is a portion of the overall
236 hectare crop produced across the whole of the property. No crop is produced on the
Southern Paddock during this event.
The sequence and combination of observations make sense when each of the property’s
features are analysed in context. Specifically, to produce the crop observed at the Northern
Paddock irrigation is required. Initially, irrigation needs are met from the full storage. When the
resources in the storage are exhausted at around 1 February, irrigation needs are required to be
met from another source. To meet those needs Barwon River extractions commence between 1-
9 February. The data shows that those extractions are not used to fill the storages and therefore
indicates that the water was delivered directly to paddocks.
These observations can be verified using the hydrograph at Figure 22. The hydrograph shows
that at the time that water appears in the channel, 9-17 February, flows were present in the river.
4.2 Key Findings
4.2.1 Location and timing of extractions
FCI data from the AGDC was analysed to test the usefulness of the AGDC in identifying the
location and timing at which extractions were made.
The AGDC is effective at identifying the location and time at which extractions commenced to a
window of approximately 8-10 days. To determine the date at which extractions commenced, FCI
data was analysed by identifying the date that the offtake channel first appears as blue during an
event. This represents the first known date at which the offtake channel is wet during an event.
FCI data for the closest available date prior to the offtake channel being observed as blue was
then identified. By finding the last time that the offtake channel appears dry and the first time that
the offtake channel appears wet, a window for when extractions commenced could be identified.
Identifying locations and timing of water extractions in the Barwon-Darling using remote sensing data
Page 22
Factors including intervals between satellite passes and data quality issues were found to be the
most significant limitations on narrowing the observation window. Data is available from two
satellites, Landsat 7 and Landsat 8, passing over every 16 days and approximately eight days
apart from each other. Between 4-6 images are captured per month, due to the satellites'
overlapping pathways. Cloud cover and inadequate data can render the images useless,
resulting in extended periods between suitable images being captured. The frequency of satellite
images is expected to improve over the next 12 months as data from a new satellite, the Sentinel
2, become available. Sentinel 2 data will be captured every five days and have an improved pixel
resolution of 10 m², compared to the current 25 m² pixel resolution of Landsat 7 and Landsat 8.
Sentinel 2 is operating in addition to the Landsat satellites, meaning that future data will be
captured at more regular intervals and be a combination of both 10 m² and 25 m² pixel resolution.
Using the AGDC to identify the location and timing of extractions could prove useful in supporting
policy and management decisions. Identifying extraction details can be applied to address issues
relating to the improved management of environmental flows. By analysing FCI data for an
environmental flow event in a particular river reach, observations can be made regarding the
extent to which a flow is extracted or remains in the river.
4.2.2 Location and observation of farm storages
FCI data from the AGDC was analysed to establish the usefulness of the AGDC in locating and
mapping farm storages. The AGDC was also tested to determine the extent to which it can be
used to observe when farm storages are wet or dry.
During Stage 1 of the study, FCI data from the AGDC was used to shortlist study properties. This
process involved inspecting FCI data to locate farm storages and identify those properties that
store water for irrigation purposes. This proved to be an effective method and by locating farm
storages an initial shortlist of four potential study properties was compiled.
Throughout Stage 4 of the study, FCI data from the AGDC was analysed and a series of
observations of the key property features were made. As part of this process two of the
property’s storages were mapped for the period between March 2014 and March 2015. During
the study period neither of the mapped storages were subject to any significant construction
works. However, the mapping technique would be a valuable tool that could be used to observe
how storages change over time including the construction of new storages.
One change that was observed throughout the study was the two storages transforming from dry
to wet and wet to dry. The FCI data was very effective at illustrating when the storages were
holding water and this application proved to be a strength of the AGDC.
The AGDC is less effective at enabling the user to determine the volume of water held in storage.
The AGDC data allows the user to view the wet surface area of a storage, but not the depth of
water in the storage. If the storage walls were a gradual slope the user could expect rising and
falling water levels to translate to a change in the storage surface area. However, in reality, most
storages are constructed with relatively steep walls and therefore it is generally not possible to
observe a change in a storage's surface area using FCI data. This means that it is difficult to use
the AGDC to determine the degree to which a storage is filled. Rather, the FCI is most effective
when used to establish whether or not a storage is completely empty (dry) or even partially filled
(wet).
Identifying locations and timing of water extractions in the Barwon-Darling using remote sensing data
Page 23
4.2.3 Measurement and observation of crop areas
FCI data from the AGDC was analysed to establish the usefulness of the AGDC in mapping and
measuring crop areas and observing changes to crops over time.
Analysing FCI data is a useful way to observe vegetation. Different shades of green represent
the vegetation’s canopy density. This enables the user to monitor the crop cycle and measure the
total area cropped. During Event 2, FCI data shows a crop emerge from bare soil and begin to
develop a crop canopy. The crop observations pass into Event 3 where the same crop continues
to develop as represented by the increasingly brighter green in the FCI data.
Using ArcGIS, the crop area was measured to find that approximately 236 hectares of crop was
produced across the study property during the study period. Of the total 236 hectare crop,
approximately 147 hectares of the crop was grown in the Northern Paddock.
The use of the AGDC to map and measure crop areas has broader applications that could
support policy and management decisions. The scope of this study is restricted to analysing a
single property over a 13 month period. However, the techniques used in this study can be
applied at a wider scale. By compiling FCI data for an entire river reach across several decades,
conclusions can be drawn on how land use in the reach has changed over time. This can be
extended by using the mapped crop areas to derive the water use required to produce those
crops. Therefore by compiling information regarding changes to crop areas over time, information
regarding how water use in a river reach has changed over time can be determined.
4.2.4 Observation of on-farm activities
FCI data from the AGDC was analysed to establish the usefulness of the AGDC in observing on-
farm activities such as irrigation applications.
During the study period on-farm activities were observed by analysing the FCI data. On-farm
work, such as ploughing, can be observed when a paddock transforms from bare, dry soil to
bare, moist soil. This occurs due to the moist subsurface material being exposed to the surface
through the action of ploughing.
It was also possible to identify the date at which irrigation applications were made. The FCI data
shows an application was made at 18 September 2014 (Figure 9). Although additional irrigation
applications would have been required to produce the crops observed during the study period,
the AGDC was unable to identify each of the dates at which irrigation occurs. This is due to the
data interval limitation of the AGDC whereby satellite passes and data quality issues mean that
there is often several days between data capture. Due to irrigation applications taking place over
a relatively small window the chance of a satellite pass aligning with an irrigation application is
relatively small. However, where these events do align, the FCI data can effectively be used for
observing irrigation applications.
In terms of observing on-farm activities the AGDC has some limited applications that could be
useful to support policy and management decisions. By analysing the AGDC data to observe on-
farm activities the AGDC has some capacity to identify dates at which irrigation applications
occur. This may allow broader application of the AGDC to observe existing irrigation patterns and
determine how irrigation trends and behaviours have changed over time.

Identifying locations and timing of water extractions in the Barwon-Darling using remote sensing data
Page 24
4.2.5 AGDC Limitations
There is currently a 2–3 month delay (latency) between the satellite observations and the data
being made available through the AGDC. GA has advised that the latency could be reduced to 2-
3 days (predictive) and seven days (authoritative) if the AGDC receives further development to
enhance its data correction processing capabilities (e.g. atmospheric correction).
The study initially used AGDC’s WOfS and FCI data. Both data types are able to detect surface
water, however, the AGDC applies a classification algorithm to the WOfS data, which expresses
a pixel as either wet or dry, rather than expressing grades of "wetness". GA has advised that this
is a conservative classification, where the entire pixel must be detected as wet otherwise the data
expresses the pixel as dry. As such, the WOfS data underestimates water detections as
illustrated in Figure 23. In the WOfS data at Figure 23 water is represented as the blue hatching.
The WOfS data shows a series of intermittent blue patches that represent a sequence of
disconnected pools of water in the river bed. However, FCI data for the same day at Figure 23
shows a continuous blue line representing a wet and well connected river bed. In the case of the
WOfS data at Figure 23 the conservative WOfS classification system means that pixels are
represented as dry given that they are detected as being not completely wet. In this case, factors
such as a narrow river channel and overhanging vegetation are likely to have combined to mean
that the WOfS data shows the river bed as dry. The FCI data that indicates greater volumes of
water present in the river channel is supported by gauge data showing an approximate flow rate
of 45 ML/d is present in the river reach on 16 July 2014 (NSW Office of Water, 2016).
Figure 23: Example of WOfS (L) and FCI (R) data for July 16 2014
A similar outcome was reached when using WOfS data to detect water in irrigation channels.
This issue is illustrated in the comparison of WOfS and FCI data shown at Figure 24. The
limitation in the WOfS data meant that FCI data became the preferred AGDC data used in the
study.
Figure 24: Example of WOfS (L) and FCI (R) data for September 18 2014
A further limitation of the AGDC is that it cannot be used to estimate farm storage volumes.
AGDC data could be improved by including storage dimensions to assist the user in estimating
storage volumes. Storage dimensions could be captured using LiDAR to observe storage
profiles. Providing farm storage volumes in the AGDC data would improve capabilities for
estimating extraction volumes.
Identifying locations and timing of water extractions in the Barwon-Darling using remote sensing data
Page 25
5 Conclusion
The study analysed AGDC data for a single irrigated property located on the Barwon River from
March 2014 to March 2015 inclusive. The study period included three flow events at the study
property.
By analysing the AGDC data a series of observations were made in relation to the study
objectives:
• the locations and timings at which extractions were made were identifiable using the
AGDC to observe whether farm channels and storages were wet or dry
• the AGDC alone cannot determine the volumes of farm storages, however, it does
allow the user to locate, map and observe storages at regular intervals over time. This
feature of the AGDC was useful when applied to observe storages transforming from
dry to wet throughout the study period
• crop areas were identifiable using AGDC data
• on-farm activities such as irrigation applications and ploughing could be identified
using AGDC data
The study tested the utility of the AGDC to support policy and management decisions. The
AGDC is being enhanced by greater pixel resolution and increased frequency of satellite
observations, available in 2017. There is an opportunity to further improve the AGDC by reducing
the image access time from the current period of 2-3 months to just two days. The inclusion of
LiDAR captured storage dimensions would be a further improvement to the AGDC and provide
storage volume estimation capabilities.
A fully enhanced AGDC would be useful in supporting policy and management decisions. Some
specific areas of use may include applications associated with:
• identifying extraction locations and timings such as observing flow events and
addressing issues linked to the improved management of environmental flows
• mapping and observing farm storages over time such as how existing storages
change and when new storages are constructed
• identifying crop areas such as how crop areas change over time and the implications
these changes have on water demand
• observing on-farm activities such as existing irrigation trends and how irrigation
behaviours have changed over time.
As the AGDC continues to develop it will become an increasingly useful resource to support
policy and management decisions.

Identifying locations and timing of water extractions in the Barwon-Darling using remote sensing data
Page 26
6 References
Australian Geoscience Data Cube. (2016, March 3). Home. Retrieved from Australian
Geoscience Data Cube: www.datacube.org.au
Geoscience Australia. (2017, March 16). Water Observations from Space. Retrieved from
Australian Government: Geoscience Australia: http://www.ga.gov.au/scientific-
topics/hazards/flood/wofs
NASA Earth Observing System. (2017, March 16). Remote Sensing. Retrieved from Earth
Observatory: https://earthobservatory.nasa.gov/Features/RemoteSensing/remote_07.php
NASA Earth Observing System. (2017, March 16). Why is that Forest Red and that Cloud Blue?
How to Interpret a False-Color Satellite Image. Retrieved from Earth Observatory:
https://earthobservatory.nasa.gov/Features/FalseColor/
NSW Government. (2016, July 12). Water Sharing Plan for the Barwon-Darling Unregulated and
Alluvial Water Sources 2012. Retrieved from NSW legislation:
http://www.legislation.nsw.gov.au/#/view/regulation/2012/488
NSW Office of Water. (2016, July 13). Real Time Data - Rivers and Streams. Retrieved from
NSW DPI Office of Water:
http://realtimedata.water.nsw.gov.au/water.stm?ppbm=SURFACE_WATER&rs&3&rskm_
org