Embed Size (px)
Citation preview

Air Force Institute of TechnologyAFIT Scholar
Theses and Dissertations Student Graduate Works
3-23-2017
Identifying Partnership Opportunities at Air ForceInstallations: A Geographic Information SystemsApproachCorey R. DeGroot
Follow this and additional works at: https://scholar.afit.edu/etd
Part of the Systems Engineering Commons
This Thesis is brought to you for free and open access by the Student Graduate Works at AFIT Scholar. It has been accepted for inclusion in Theses andDissertations by an authorized administrator of AFIT Scholar. For more information, please contact [email protected].
Recommended CitationDeGroot, Corey R., "Identifying Partnership Opportunities at Air Force Installations: A Geographic Information Systems Approach"(2017). Theses and Dissertations. 810.https://scholar.afit.edu/etd/810

IDENTIFYING PARTNERSHIP OPPORTUNITIES AT AIR FORCE INSTALLATIONS: A GEOGRAPHIC INFORMATION SYSTEMS APPROACH
THESIS
Corey R. DeGroot, Lieutenant, USAF
AFIT-ENV-MS-17-M-184
DEPARTMENT OF THE AIR FORCE
AIR UNIVERSITY AIR FORCE INSTITUTE OF TECHNOLOGY
Wright-Patterson Air Force Base, Ohio
DISTRIBUTION STATEMENT A.
APPROVED FOR PUBLIC RELEASE; DISTRIBUTION UNLIMITED.

The views expressed in this thesis are those of the author and do not reflect the official policy or position of the United States Air Force, Department of Defense, or the United States Government. This material is declared a work of the United States Government and is not subject to copyright protection in the United States.

AFIT-ENV-MS-17-M-184
IDENTIFYING PARTNERSHIP OPPORTUNITIES AT AIR FORCE INSTALLATIONS: A GEOGRAPHIC INFORMATION SYSTEMS APPROACH
THESIS
Presented to the Faculty
Department of Systems Engineering and Management
Graduate School of Engineering and Management
Air Force Institute of Technology
Air University
Air Education and Training Command
In Partial Fulfillment of the Requirements for the
Degree of Master of Science in Engineering Management
Corey R. DeGroot, BS
Lieutenant, USAF
March 2017
DISTRIBUTION STATEMENT A. APPROVED FOR PUBLIC RELEASE; DISTRIBUTION UNLIMITED.

AFIT-ENV-MS-17-M-184
IDENTIFYING PARTNERSHIP OPPORTUNITIES AT AIR FORCE INSTALLATIONS: A GEOGRAPHIC INFORMATION SYSTEMS APPROACH
Corey R. DeGroot, BS
Lieutenant, USAF
Committee Membership:
Maj Jason K. Freels, PhD Chair
Lt Col Vhance V. Valencia, PhD Member
Dr. Alfred E. Thal, Jr. PhD Member
iv
Abstract
The excess capacity found in the Department of Defense (DOD) real property
portfolio creates challenges for leaders to provide resilient installations. Combining this
fact with current funding trends makes decisions on how to properly maintain
infrastructure even more challenging. The Air Force Partnership Initiative (AFPI)
provides tools for installations to leverage community capabilities and resources to
achieve savings and improve quality on Air Force installations and can reduce the real
property footprint. This research proposes a method for assessing the viability of a
partnership between Air Force installations and their nearby communities.
This research effort created a tool capable of investigating off-base communities
and discovering partnership opportunities worthy of exploration by nearby Air Force
installations. The scope of this research will be limited to exploring library partnership
opportunities at Air Force installations located in the Continental United States
(CONUS). This research investigates the facilitators, or environmental factors, to identify
where greater opportunities for creating partnerships may exist. The result of this
research is a tool which produces a relative measure for each off-base community, where
higher values indicate a greater potential for partnerships. This relative measure utilizes
inverse distance weighting (IDW) between an installation and each service location in the
surrounding community.

v
Acknowledgments
I would like to thank Major Jason Freels for guiding me through the research
process. His encouragement as a leader and teacher was truly appreciated and helped me
develop as an officer. I would also like to thank Lt Col Valencia and Dr. Thal for their
support in my research effort. Finally, I would like to thank my amazing wife for all her
love and support, as well as the sacrifices she made during this process.
Corey R. DeGroot

vi
Table of Contents
Page
Abstract .............................................................................................................................. iv
Acknowledgments................................................................................................................v
Table of Contents ............................................................................................................... vi
List of Figures .................................................................................................................. viii
List of Tables ..................................................................................................................... ix
I. Introduction .....................................................................................................................1
1.1 Background ...............................................................................................................1 1.2 Problem Statement ....................................................................................................4 1.3 Research Statement ...................................................................................................5 1.4 Research Questions ...................................................................................................6 1.5 Summary ...................................................................................................................7
II. Literature Review ...........................................................................................................8
2.1 Chapter Overview .....................................................................................................8 2.2 Geographic Information Systems ..............................................................................8 2.3 Review of Partnerships ...........................................................................................10
2.3.1 Public-Private Partnerships ............................................................................ 11 2.3.2 Public-Public Partnerships ............................................................................. 15 2.3.3 Risk Allocation in Partnerships ...................................................................... 16
2.4 Partnering Strategies ...............................................................................................19 2.4.1 The Partnering Process Model ....................................................................... 20 2.4.2 Strategic Outsourcing ..................................................................................... 24
2.5 Summary .................................................................................................................27
III. Methodology ...............................................................................................................28
3.1 Chapter Overview ...................................................................................................28 3.2 Data Collection........................................................................................................28 3.3 Library Size Estimation ..........................................................................................33 3.4 Inverse Distance Weighting ....................................................................................35 3.5 Summary .................................................................................................................37
IV. Analysis and Results ...................................................................................................38
4.1 Chapter Overview ...................................................................................................38

vii
4.2 Preparing Data .........................................................................................................38 4.3 Analysis ...................................................................................................................40
4.3.1 Model Results ................................................................................................. 40 4.3.2 Tool discussion ............................................................................................... 47
4.4 Limitations ..............................................................................................................49 4.5 Summary .................................................................................................................51
V. Conclusions and Recommendations ............................................................................52
5.1 Chapter Overview ...................................................................................................52 5.2 Review of Research Questions................................................................................52 5.3 Recommendations for Future Research ..................................................................55 5.4 Conclusion ..............................................................................................................57
Bibliography ......................................................................................................................59

viii
List of Figures
Page Figure 1: Hong Kong Efficiency Unit - Types of private Sector involvement ................. 12
Figure 2: The Partnering Process model ........................................................................... 20
Figure 3: Screenshot of www.publiclibraries.com ........................................................... 30
Figure 4: HTML code example from www.publiclibraries.com ...................................... 31
Figure 5: Inverse Distance Weighting Example ............................................................... 36
Figure 6: Driving distance versus straight line distance correlation scatter plot ............. 46
Figure 7: Screenshot of Shiny Application ....................................................................... 48

ix
List of Tables
Page Table 1: The Partnering Process model - partnership drivers ........................................... 21
Table 2: The Partnering Process model - partnership facilitators ..................................... 23
Table 3: Reader Seating Schedule .................................................................................... 35
Table 4: Inverse distance weighting results - straight line distance .................................. 42
Table 5: Inverse distance weighting results - driving distance ......................................... 44

1
IDENTIFYING PARTNERSHIP OPPORTUNITIES AT AIR FORCE
INSTALLATIONS: A GEOGRAPHIC INFORMATION SYSTEMS APPROACH
I. Introduction
1.1 Background
Public agencies around the world have recognized that they may not have the
resources to provide the desired infrastructure and maintain it properly once constructed.
Public-Private Partnerships (PPP) between public and private sectors emerged in
response to this issue. Public agencies have recognized that specialized public or private
entities possess the capability to properly maintain current infrastructure and cope with
changing needs. These partnerships are tools developed to meet a variety of needs
depending on the needs of the public. As such, they have the capability of dealing with
excess infrastructure, inadequately maintained infrastructure, and the ability to meet the
changing demands of an organization.
PPPs provide highway construction and other forms of infrastructure to public
agencies by private entities. One example of a PPP that is currently in use is the
demolition and construction of a new city hall, library, park, and port headquarters in the
city of Long Beach (Merewitz, 2016). Using private entities to provide infrastructure
shifts the required investment capital to the private entity through risk allocation
principles. This is the case in the city of Long Beach, where the financial risk is allocated
2
from the public agency to the private entities for the design, construction, financing,
operation, and maintenance of the facilities (Merewitz, 2016).
The United States Air Force (USAF) recognized the value of this tool with the
creation of the Air Force Partnership Initiative (AFPI). AFPI leverages the capabilities
and resources of military installations, local governments, or commercial entities to
reduce operating costs and the costs of the services while retaining or enhancing quality.
A review of the initiative shows that although partnerships exist at many Air Force
installations, many are not to the scale of providing or managing existing infrastructure.
As this is still a new initiative, the contract mechanism for partnerships lack guidance on
their application for large-scale projects at Department of Defense (DOD) installations.
Installations compose the backbone of the United States military, allowing it to
project power all over the globe. The DOD manages real property across 5,000 different
locations worldwide (GAO, 2015). With many sites, and the associated infrastructure for
supporting various missions, properly maintaining these assets is critical. DOD leaders
often face the challenge of maintaining mission readiness with less funding than required
to adequately maintain the necessary infrastructure.
Partnerships provide a tool to create more effective installations that meet the
goals outlined in the Air Force Strategic Master Plan (AFSMP). The AFSMP is a 20-year
plan which translates the USAF strategy into specific guidance, goals, and objectives
(Department of the Air Force, 2015). As it relates to infrastructure, one objective of the
AFSMP states “provide resilient installations, infrastructure, and combat support
capabilities that enable the Air Force to project power rapidly, effectively, and

3
efficiently” (Department of the Air Force, 2015). Infrastructure, by its very nature, is
complex and static, thereby creating a challenge to meet this objective.
Executive Order 13327 provides further guidance pertaining to DOD
infrastructure directing “the efficient and economical use of Federal real property
resources in accordance with their value as national assets and in the best interest of the
nation.” The 2007 Defense Installations Strategic Plan (DISP) provides guidance on the
implementation of Executive Order 13327. The DISP provides six goals: Right Size and
Place, Right Quality, Right Risk, Right Resources, Right Management Practices, and
Right Workflow (Department of Defense, 2007). The first two goals within the DISP are
relevant to the discussion of resiliency: Right Size and Place and Right Quality. Right
Size and Place ensure that an installation has the infrastructure needed and that
installations are strategically located. The second goal, Right Quality, deals with
building and maintaining infrastructure with the capability to adjust based on strategy and
need.
In 2012, the DOD estimated that it had a 20 percent excess in infrastructure
despite the use of Base Realignment and Closure (BRAC) (GAO, 2013). The problem is
worsened by the fact that the DOD has been unable to fund the current facility
sustainment, restoration, and maintenance (FSRM) requirements (Johnson, 2015).
Ultimately, lack of funding can place a higher risk on the infrastructure, if not properly
maintained, which can lead to accelerated failures and less resilient installations. With
the DOD’s limited resources, excess capacity taxes the DOD’s ability to achieve proper
quality and conflicts with EO 13327. These issues indicate a failure to meet the strategic
4
requirements discussed above. Further exploring partnerships can help meet the need for
resiliency and comply with Executive Order 13327.
1.2 Problem Statement
Given the current trend in FSRM funding, leaders face the difficult decision of
how to properly maintain all the facilities on an installation. Responding to these
challenges, Johnson (2015) developed a model for strategic basing by proposing seven
different installation types: traditional, mission, hybrid, city-base, joint, total force
association, and warm. Mission requirements and the capability of the local community
would determine the installation type.
The model further suggests categorizing functions within an installation as core,
important, and peripheral. Core and important activities provide direct mission
accomplishment and support needed for the mission and personnel, while peripheral
activities provided community support and Morale, Welfare, and Recreation (Johnson,
2015). Johnson (2015) suggests that depending on the size of the community
surrounding a military installation, the community rather than the installation could
provide some peripheral activities through partnerships.
The Johnson (2015) model gives recommendations of bases to convert to the
different installation types. However, there is no analysis of the communities to support
these recommendations. Both Johnson (2015) and the AFPI recognize the importance of
using partnerships but fail to provide adequate guidance on the implementation of
partnerships. Specifically, there is no guidance directing installations on what
partnerships to investigate.

5
Installations are near local communities which vary in size and capabilities,
limiting the amount of support provided. Li & Akintoye (2003) showed that partnerships
may occur when a public agency requires a service, and a private entity can provide that
service. However, if the private entities do not have the resources or capabilities needed
to provide or support the service, it is inappropriate for the private entity to manage the
risks of a partnership (Ng & Loosemore, 2007). Evaluating a community’s profile may
lead to the discovery of areas that have a greater capacity to handle the risks associated
with partnerships. A review of partnership literature reveals that it does not address
where to explore partnerships opportunities.
1.3 Research Statement
This research effort investigates characteristics of off-base communities
surrounding CONUS Air Force installations to identify the installations that could benefit
from exploring partnership opportunities. While Air Force installations provide many
services, this research specifically examines library partnership opportunities at Air Force
installations located in the Continental United States (CONUS).
To assess the benefit that an installation could realize for exploring partnerships,
the Lambert’s Partnering Process model (Lambert, Emmelhainz, & Gardner, 1996) was
explored. Lambert (1996) created a model to aid corporate leaders when deciding if a
partnership would be effective. The Partnering Process model describes two factors that
impact the decision to partner: drivers and facilitators. Drivers are the motivations
behind why companies would want to partner, whereas facilitators are the environmental
factors that could affect the growth of the partnership (Lambert et al., 1996).

6
This research investigates the facilitators, or environmental factors, for CONUS
USAF installations to identify where greater opportunities for creating partnerships may
exist. The result of this research is a tool which produces a relative measure for each off-
base community, where higher values indicate a greater potential for partnerships. This
relative measure utilizes inverse distance weighting (IDW) between an installation and
each service location in the surrounding community. The tool allows decision makers to
compare the computed measures and communities for each installation, and identify
where the greatest opportunity for creating a partnership may exist.
1.4 Research Questions
Looking at USAF installations, the local community could provide many
peripheral services. Unfortunately, the Air Force currently does not provide guidance for
identifying partnership opportunities. Therefore, this research contributes to the
following research question.
Research Question: How can the Air Force identify installations where a greater opportunity for creating partnerships may exist? In this research, a specific peripheral service – base libraries, is a service that local
communities provide for their citizens. Therefore, the goal of this research is to develop
a model to categorize which installations have a local community possessing the current
capability to provide library service for the installation’s population, thus eliminating the
need for the base library. To support the overarching research question, the following
generalized investigative questions were developed, and will be answered by focusing on
library services:

7
Investigative Question #1: What characteristics of off-base communities can be used to identify installations where partnerships can be utilized by the Air Force? Investigative Question #2: Does varying the radius used to define the community significantly alter the results of the analysis? Investigative Question #3: Does the use of straight-line distance versus driving distance substantially change the rank order list of installation?
1.5 Summary
The excess capacity found on DOD installations creates challenges for leaders to
provide resilient installations. Combining this fact with current FSRM funding trends
makes decisions on how to properly maintain infrastructure even more challenging. The
Air Force Partnership Initiative provides tools for installations to leverage community
capabilities and resources to achieve savings and improve quality on Air Force
installations. This research proposes a method for assessing the viability of a partnership
between USAF installations and their nearby communities. The method is verified with
the base library service at CONUS Air Force installation.
This research follows the standard five-chapter format. Chapter I provides a basic
overview of the research. Next, Chapter II reviews the literature pertaining to
partnerships. Chapter III then discusses the methodology used to create the Inverse
Distance Weighting (IDW) model used to analyze libraries. Chapter IV presents the
results of the IDW model for base libraries. Finally, Chapter V provides a conclusion,
and opportunities for future research.

8
II. Literature Review
2.1 Chapter Overview
This chapter outlines several concepts germane to public-private partnerships. The
chapter begins with a review and discussion of Geographic Information Systems (GIS)
and their use in solving geographic related problems. Then, the chapter provides a
review of the two types of partnerships: Public-Private Partnerships (PPP) and Public-
Public Partnerships (PUP). The review will focus on the different types of partnerships
and the varying definitions associated with them. Finally, the chapter concludes with a
discussion on outsourcing with a specific emphasis addressing the factors and drivers for
successful arrangements.
2.2 Geographic Information Systems
A GIS is a system designed to capture, manipulate, and display spatially-related
information on a map for visualization and analysis (ESRI, 2010). Six components make
up the modern GIS: network, people, software, data, procedures, and hardware. The
hardware runs the software or graphics program and provides interaction between the
GIS and users. The network enables the sharing of information and data across the six
components of a GIS (Longley & Goodchild, 2011).
A GIS stores information in the form of features (objects on the earth) and
attributes that describe the features (ESRI, 2010). Discrete objects and continuous fields
are two methods utilized by a GIS to represent geography. The discrete object method
views the geography as objects with well-defined boundaries. This view works well
when the geography has clear boundaries such as a city. However, other geographic
9
objects, like mountains or lakes, do not have clear boundaries defined which is where
continuous fields are more applicable (Longley & Goodchild, 2011).
The continuous field view provides a way to describe objects that do not have
well-defined boundaries. Terrain is much easier to conceptualize as a continuous field,
where every point requires definition. The continuous field view represents the world as
a finite number of variables, where each variable is defined at every position (Longley &
Goodchild, 2011). The discrete object and continuous field view are two conceptual
views of how to represent the world in a GIS but do not provide the method to represent
objects digitally.
The discrete object and continuous field conceptualizations described only
provide ways to think about geography, but there are information storage limitations in a
computer. A continuous field potentially contains an infinite amount of information by
defining a value at an infinite number of points in a defined area. A discrete object can
also require an infinite amount of information to achieve full description (Longley &
Goodchild, 2011).
Raster and vector representations of geography provide a way to transform the
discrete object and continuous filed concepts to digital representations in a computer.
Raster representation divides space into an array of cells, where all geographic variation
is represented by assigning attributes to each cell (Longley & Goodchild, 2011).
Generally, the raster method represents continuous information that does not have distinct
boundaries or well-defined shapes. In vector representation, points connected by lines

10
define objects. Discrete objects using this method are represented as points, lines, or
polygons (ESRI, 2010).
Geospatial analysis provides a unique perspective of the world with a lens to
examine events, patterns, and processes that take place on the surface of the Earth (De
Smith, Goodchild, & Longley, 2015). Spatial analysis recognizes the concept that
everything happens somewhere and knowing where can be important. With many types
of analysis, interpolation is used in spatial analysis based on the First Law of Geography
(Waldo Tobler) which states that, “Everything is related to everything else, but near
things are more related to distant things” (Longley & Goodchild, 2011). Geospatial
analysis is the crux of any GIS – with its ability to add value to geographic data and
turning that data into useful information. Furthermore, geospatial analysis helps answer
location dependent questions (De Smith et al., 2015), such as the questions about
partnerships posed in this research.
2.3 Review of Partnerships
The public use of partnerships has gained momentum since the late 1980s across a
wide variety of organizations (Linder, 1999). The two types of partnerships, Public-
Private and Public-Public, differ by the entities which are involved in the agreement. As
the names imply, a PPP agreement involves at least one public and at least one private
agent, whereas a PUP is an agreement between two or more public agents (Lobina &
Hall, 2006). Partnerships often develop as a way for public agencies to leverage,
through cooperation, resources and expertise possessed by other public or private
agencies. Furthermore, for this research outsourcing is included in the broad definition

11
of partnerships because they are closely related. As a result, they are included in this
review.
2.3.1 Public-Private Partnerships
A PPP is an arrangement to work together between private and public entities.
This broad definition captures the various definitions used by researchers to define a PPP.
Some researchers view a PPP as a tool to be used by governments to replace or
complement existing methods of contracting public services (Hodge & Greve, 2007).
Others see it as a new expression in language, which incorporates already existing
procedures for involvement of private organizations in public services (Linder, 1999).
Another view of PPPs is that it extends beyond private procurement of public services
and offers a new way to handle large infrastructure projects (Savas, 2000). These varying
academic definitions are a result of the differing implementation strategies of PPPs
around the world.
Countries across the globe have defined PPPs differently and utilized different
implementation strategies. The United Kingdom Nations Development Programme
(2007) stated that “PPPs should be broad such that even the informal dialogues between
government officials and local community-based organizations should be included”
(Tang, Shen, & Cheng, 2010). In the U.S., the National Council for Public-Private
Partnerships defines a PPP as a contractual arrangement between a public agent and a for-
profit private actor, where resources and risks are shared to deliver a public service or
public infrastructure (Li & Akintoye, 2003).

12
Hong Kong provides yet another definition and further explanation. The
Efficiency Unit created a new focus on Private Sector Involvement (PSI) and defined
PPP as “arrangements where public and private sectors bring complementary skills to a
project with varying levels of responsibility to provide public service projects.” The PSI
was established with the understanding that the government needed assistance in meeting
its priorities and that public funds were limited (Tang et al., 2010). The PSI utilized the
two related tools to accomplish its objectives: PPPs and Outsourcing (Figure 1).
Figure 1: Hong Kong Efficiency Unit - Types of private Sector involvement (Tang et al., 2010)
As summarized by Tang et al. (2010), Hong Kong’s Efficiency Unit further
describes the following six forms of PPPs:
• Create Wider Markets – Utilizes current assets in terms of skills and finance from both public and private sectors.
• Private Finance Initiatives (PFIs) – The public sector purchasing of services with the private maintaining and constructing the necessary infrastructure.
• Joint Ventures – Public and private sectors pool their assets, finances, and expertise under joint management.

13
• Partnership Companies – Private sector ownership introduced through government legislation or regulation.
• Partnership Investments – Investments where the public-sector shares in the generated returns with the private sector.
• Franchises – The private sector pays a fee during the concession period for the revenue that the service will generate in the future.
Infrastructure provided through a PPP potentially generates an arrangement that is
more complicated when compared to standard infrastructure contracts. The cause for this
increased complexity can be attributed to long-term agreements and the increased number
of public and private sector entities that are involved (Grimsey & Lewis, 2002).
Arrangements utilizing PPPs for infrastructure will take on some or all of the following
elements (Grimsey & Lewis, 2002; Peirson & Mcbride, 1996):
• The public-sector entity transfers a facility controlled by it to the private sector entity (with or without payment in return) usually for the term of the arrangement
• The private sector entity builds, extends, or renovates a facility
• The public-sector entity specifies the operating features of the facility
• Services provided by the private sector entity using the facility for a defined period (usually with restrictions on operations and pricing)
• The Private sector entity agrees to transfer the facility to the public sector (with or without payment) at the end of the arrangement
Examining the different implementations of PPPs around the world illustrates
that, although the definitions differ, a common theme is present in all of them. The
varying views of partnerships communicate that the establishment of PPPs generate
benefits for both the private and public sectors involved. The partnership brings together
strong qualities from each sector, where they can be combined to increase results (Hodge
& Greve, 2007). The main advantage found in PPP is that it can save resources by
bringing together these strengths and allowing public agencies to focus on their core
14
competencies (Tang et al., 2010). Although PPPs have the advantage of utilizing the
private sector strengths, disadvantages do exist.
PPPs leverage the private sector to provide public infrastructure and services at a
lower cost; however, not all PPPs achieve an increase in savings or efficiency. There are
many cases where a PPP has run into issues and has failed to achieve cost savings or
improved service. Oftentimes, these projects ran into problems due to cost overruns,
unrealistic finance projections, and legal disputes, which can be attributed to the
complexity and poor understanding of PPP arrangements (Kumaraswamy & Zhang,
2001). Furthermore, it has been indicated that political obstacles can make the use of
PPP difficult (Ayed Muhammad Algarni, Arditi, & Polat, 2007). This is not surprising
considering many PPP projects require the passing of special legislation. Government
agencies, who are responsible for making new legislation, may be resistant to change,
including new project delivery mechanisms that are not always easy to understand, such
as PPP (Tang et al., 2010).
The definitions used to define PPPs and their implementation differs greatly
around the globe. Despite this variance, they offer public agencies another avenue to
pursue the procurement of public services or infrastructure by combining the strengths of
both the private and public sectors. PPPs do not come without their drawbacks; they
create a higher level of complexity in projects that may not have existed otherwise.

15
2.3.2 Public-Public Partnerships
Public-Private Partnerships first became popular to create water service reform in
developing countries in the 1990s. It was expected that private sector involvement would
deliver quicker results that what would have been possible from the public sector alone.
The reality of the use of PPPs in water service reform has fallen short of its expectations,
with many operating contracts that are struggling or failing (Lobina & Hall, 2006). High
transaction costs, contract failure, dynamic interest seeking, and resistance to PPPs have
led to the failure of some PPPs to achieve the expected benefits. These failures have
caused organizations to acknowledge the shortfalls of PPPs and look to PUPs to create
water service reform.
Public-Public Partnerships are a new type of partnership that resulted from the use
of PPPs. The simple definition of a PUP is any collaboration between two or more
public authorities in the same country. This definition includes collaboration between
different types or levels of government and any part of the general public (Lobina & Hall,
2006). The use of these types of partnerships is relatively new, with limited usage. One
sector where PUPs have gained traction is water service reform in developing countries.
The reason for the emergence of PUPs in this sector is due to the failure of Public-Private
Partnerships.
The transition from PPPs to PUPs for water service reform in developing
countries highlights that the two types of partnerships are fundamentally different. The
main difference in these partnerships is that a PUP can be described as “a peer
relationship forged around common values and objectives, which exclude profit-seeking”
16
(Hall et al., 2009). An advantage of using a PUP over a PPP is that neither party expects
to achieve a commercial profit. In 2009, Hall (2009) summarized the advantages of a
PUP as follows:
• Mutual understanding of public sector objectives
• Non-commercial relationship resulting in low risk
• Transparency and accountability
• Many potential partners available
• Lower risk and complexity result in lower transaction costs
• Possibility of 100% reinvestment of financial resources
• Long-term gain in capacity-building
• Local control over objectives and methods
• Involvement of local civil agencies is possible
• Partners benefiting from a PUP can become supporting partners to others
Public-Public Partnerships offer yet another tool which can achieve cost savings,
improve efficiency, and increase customer satisfaction. The use of PUPs achieved
success in water service reform where PPPs failed (Lobina & Hall, 2006). A PUP is
fundamentally different from a PPP, because the private agencies’ goal to achieve profit
is no longer present. The USAF looks at both the PUP and PPP as tools to complete the
varying required missions.
2.3.3 Risk Allocation in Partnerships
In a successful public-private partnership (PPP), the private entity provides a
product or service to the public at a greater value. To achieve this, proper risk allocation
must occur, where all parties involved are incurring risk in pursuit of a successful project.

17
If both parties share a risk outcome, then it is considered a shared risk (Bing, Akintoye,
Edwards, & Hardcastle, 2005). Delivery of services is shared between both the public
and private sectors, thereby bringing complementary skills to the project and resulting in
an increased efficiency (Shen, Platten, & Deng, 2006). Risk allocation is important for a
successful partnership because it binds all parties to work together for mutual benefit. If
the risks are simply transferred to the private sector, rather than shared between both
sectors, decreased savings can result. Therefore, the public entity must be aware of the
amount of risk that it is shifting and how it affects whether they are achieving value for
the money (Grimsey & Lewis, 2005).
Allocating risk comes with a cost; therefore, there must be a balance for a
partnership to exist. The goal of any such partnership should be to improve value for
money or improve service for the same cost (Grimsey & Lewis, 2005). Most research on
partnerships relates to the procurement of infrastructure, and as such are usually more
complicated than a simple construction project. Some have argued that this complexity
actually increases the risk to the public sector, rather than reduce it, by increasing service
costs for the public and creating an entry barrier for private entities (Moore & Muller,
1991; Ng & Loosemore, 2007).
Another aspect of risk associated with private procurement relates not to the
complexity, but the required length of time that exists in these arrangements. With many
arrangements lasting for long periods, this creates risk due to the amount of uncertainty.
The uncertainty, and the inherent difficulty to predict the extent of risk, leads private
sector to demand premiums for the increased risk (Ng & Loosemore, 2007). If the public

18
entity is unwilling to accept some of this risk, via allocation, then the project may not
achieve a desired value-for-money partnership for the public.
With any partnership, the public and private entities agree to the allocation of all
foreseeable risks. Grimsey and Lewis (2002) identified the following nine risks that exist
in any infrastructure project:
• Technical risk – risk due to engineering and design failures
• Construction risk – risk due to faulty construction techniques
• Operating risk – risk due to higher operating and maintenance costs
• Revenue risk – risk due to traffic shortfall or failure to extract resources, leading to revenue deficiency
• Financial risk – risk due arising from inadequate hedging of revenue streams
• Force majeure risk – risk due to war and other calamities and acts of God
• Regulatory/political risks – risk due to legal changes and unsupportive government policies
• Environmental risk – risk due to adverse environmental impacts and hazards
• Project default – risk due to failure of the project from a combination of any of the above
These nine risks provide a means to allocate specific risks in a partnership.
However, it is difficult to define rules for allocating risk because every partnership is
different. As a result, Ng and Loosemore (2007) classified risks into two groups: general
risks and project risks. General risks, not specifically associated with the project,
influence the outcome of the agreement. Project risks are those that deal specifically with
project management. Risk allocation by groupings eliminates some of the complexity
and allows for the creation of guidelines rather than hard rules.

19
When allocating risk in a partnership, there are some well-established general
rules that should be followed (Ng & Loosemore, 2007). They are, that risk should only
be allocated to a party who:
• Has been made fully aware of the risks they are taking
• Has the greatest capacity to manage the risk effectively
• Has the capability and resources to cope with the risk
• Has the necessary risk appetite to want to take the risk
• Has been given the chance to charge an appropriate premium for taking it
Since every partnership is different, varying in complexity and the entities that are
involved, a general risk allocation strategy exists. It is important to remember that this
risk allocation is very important for maximizing the public’s value-for-money. Like any
contractual arrangement, it is paramount that the appropriate party assume the proper
risks. These general rules outline the general risk allocation strategy in a partnership.
2.4 Partnering Strategies
This section provides a review of partnerships and outsourcing as used by the
private sector. Specifically, this section provides the factors or considerations used when
determining whether to pursue partnering or outsourcing. The section then discusses the
factors for partnerships and outsourcing within the context of PPPs and PUPs.
Partnerships between businesses are not a new concept and share concepts in
outsourcing. Partnerships vary greatly in complexity, range of services provided, and
their establishment. However, a partnership can be defined as a business relationship
20
where all parties involved cooperate with mutual trust, shared risk, and outcomes that
result in competitive advantage (Lambert et al., 1996). When using this definition,
outsourcing is a similar type of arrangement to PPPs and PUPs, but differs in that the
government no longer has a role in the ongoing operations (Minow, 2003).
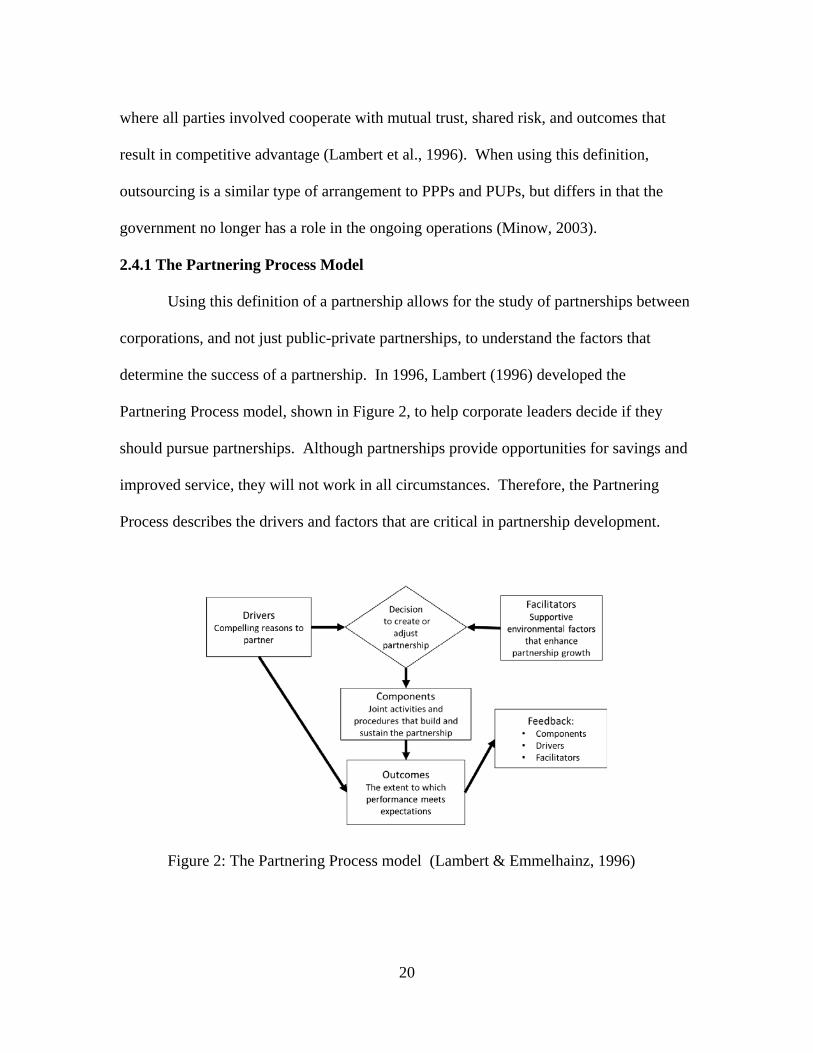
2.4.1 The Partnering Process Model
Using this definition of a partnership allows for the study of partnerships between
corporations, and not just public-private partnerships, to understand the factors that
determine the success of a partnership. In 1996, Lambert (1996) developed the
Partnering Process model, shown in Figure 2, to help corporate leaders decide if they
should pursue partnerships. Although partnerships provide opportunities for savings and
improved service, they will not work in all circumstances. Therefore, the Partnering
Process describes the drivers and factors that are critical in partnership development.
Figure 2: The Partnering Process model (Lambert & Emmelhainz, 1996)

21
As seen in the model, two elements lead to the decision to create partnerships:
drivers and facilitators. Drivers are the motivations or reasons that drive corporations to
partner. All parties involved in a partnership must believe that they will receive benefits
in one of the four drivers presented in Table 1, which would not be possible without the
formation of a partnership. The presence of drivers is important for the formation and
success of a partnership, but drivers alone do not guarantee its success (Lambert et al.,
1996).
Table 1: The Partnering Process model - partnership drivers (Lambert & Emmelhainz, 1996)
Driver Description
Asset/Cost Efficiency
Integration of activities can lead to lower costs in transportation, handling, packaging, information, and increased managerial efficiency.
Customer Service
Integration of activities can also lead to service improvements for customers in the form of reduced inventory, shorter cycle times, and more timely and accurate information.
Marketing Advantage Strong integration between two organizations can enhance their marketing mix, ease entry to new markets and provide access to better technology.
Profit Stability/Growth
Partnering often leads to long-term volume commitments, reduced variability, shared assets and other improvements.

22
The drivers presented in the model must provide a significant benefit for each
organization to motivate pursuing a partnership. These drivers were established with a
mindset of private organizations partnering with one another, but that does not exclude
them from being useful when considering a PPP or PUP. The model does not require that
each potential partner has the same drivers or that a significant benefit be present for all
four drivers. However, it is important that both partners recognize the drivers or
motivation of the other partner involved. The drivers motivate partnerships, but the
environments that exist will also play a large role in predicting success.
Facilitators are the environmental factors that exist in each of the corporations,
which will affect the growth of a partnership. The Partnering Process model suggests
that each partner must exist in an environment that is supportive of developing a close
relationship with the other. There are four essential facilitators to developing a
partnership: corporate compatibility; similar managerial philosophy; and techniques,
mutuality, and symmetry. These four facilitators are universal and should exist in any
partnership, as their presence increases the probability of success. Additionally, Lambert
et al. (1996) provides five situation-specific factors, whose presence are likely to increase
the probability of success. Table 2 provides a brief description of each of the universal
and situation-specific factors presented in the Partnering Process model.
Drivers and facilitators can be likened to marriage where a couple can have a
strong desire to marry (driver) but may become affected by in-laws, personal finances,
individual morals, and other factors (facilitators).

23
Table 2: The Partnering Process model - partnership facilitators (Lambert & Emmelhainz, 1996)
Type Facilitator Description
Universal Corporate Compatibility
Partners must have compatible values. The culture and objectives of each partner should be similar and cannot clash. The closer the culture and objectives align, the more likely a partnership is to succeed.
Universal Managerial Philosophy and Techniques
Organizational structure, attitude toward employee empowerment, and the importance of teamwork are examples of managerial philosophy. Partners will have a difficult time working together if these philosophies and techniques are not similar.
Universal Mutuality
The ability of managers to place themselves in their partner's shoes is critical. This is expressed as being willing to develop joint goals and share sensitive information. A partnership must benefit both parties.
Universal Symmetry
Success is more probable when the partners are demographically similar. Symmetry refers to partners being equally important to the other's success, relative in size, and possesses similar market shares, financial strength, productivity, brand image and reputation.
Situation Specific Exclusivity
When managers of both firms are willing to entertain exclusivity, there is an increase in advantages of the partnership.
Situation Specific Shared Competitors
Partners facing a common competitor produce a strong foundation and willingness to work with one another.
Situation Specific
Geographic Proximity
Key players located near each other are likely to produce a stronger partnership. Proximity to each other allows for relationships to be built over time.
Situation Specific Prior History
Firms with a prior history of positive interaction will have an advantage when building partnerships.
Situation Specific Shared End User
In the case where both parties share the same end user, and the end user is of particularly high value, the partnership is likely strengthened.

24
If these facilitators are strong and supportive, then the marriage is more likely to succeed;
however, if they are weak and unsupportive, the strong driver of marriage has the
potential to be overcome. Likewise, strong environments are unlikely to overcome the
lack of drivers in a partnership.
Therefore, as highlighted by the Partnering Process model, a partnership is only
likely to succeed if both strong drivers and facilitators exist. Each partner must
individually identify its drivers or motivation and determine if significant benefit exists
through partnering. If both partners can identify strong drivers for partnering, then the
potential partners evaluate the facilitators together, as it is the joint environment between
both partners that will exist in a partnership.
2.4.2 Strategic Outsourcing
The theory of strategic outsourcing can be contributed to the convergence of
Transaction Cost Theory (TCT) and Resource Based View (RBV) (Holcomb & Hitt,
2007). Both TCT and RBV are theories used to explain why a firm should outsource an
activity. TCT argues that if outsourcing results in a lower cost than internal production,
then the activity should be contracted out or outsourced (Williamson, 1979). The RBV
looks beyond just the cost of an activity and places emphasis on the importance of
resources to achieve competitive advantage (Barney, 1991; Holcomb & Hitt, 2007). The
convergence of these two theories, that capability or resources affect the boundary
conditions created by TCT, drive the model of strategic outsourcing.
Holcomb (2012) defined strategic outsourcing as an arrangement wherein firms
rely on the market to provide a specialized service that supplements the firm’s existing

25
capabilities. Firms must make difficult decisions about whether to internalize or
outsource an activity or service – defining their firm scope. Internalization of an activity
requires commitment of resources and limits strategic flexibility because it can be
difficult to reverse (Leiblein, Reuer, & Dalsace, 2002). However, this internalization
may be required to effectively carry out production. Understanding firm scope or
boundaries attempts to explain which activities should or should not be outsourced.
Firm scope is the definition of activities that should or should not be provided
internally (Holcomb & Hitt, 2007). One framework to dictate outsourcing decisions is to
define activities as either core or non-core. This is not to say that every non-core activity
should be outsourced, but rather that it can be, and that core activities should not be
outsourced. However, using this method to define firm scope can lead to firms that
outsource too many activities or too large of a list of core activities. Another issue with
this decision process is that not every business-unit will consider the same activities as
core or non-core, which leads to confusion in management (Heikkilä & Cordon, 2002).
Core and non-core activity definition attempts to determine which activities to outsource;
however, these definitions may change from unit to unit and may not fully clarify the
outsourcing decision.

26
Recognizing the deficiency in defining firm scope, Heikkila (2002) developed an
outsourcing decision-making framework. The framework consists of six drivers for
outsourcing and four potential drawbacks. The drivers highlighted by the framework are:
• Scarcity of capital. This driver highlights the fact that companies may not have the sufficient capital to fund all the activities which they may wish to pursue. Outsourcing would reduce the required capital needed.
• Lack of know-how. Other companies considered experts in a specialized area and know how to perform the activities more efficiently.
• Flexibility and the need for quick response or small production. Certain companies have the capability of adjusting to market fluctuations.
• Speed or time to market. Outsourcing can enable products brought to the market at a much quicker rate or enter a new geographical area than what could be accomplished internally.
• Asset utilization or spare capacity. Certain activities may require a minimum level of asset utilization or infrastructure to justify investment. The ability for companies to meet these minimums in production must exist.
• Economies of scale. Specialized companies can produce products sold to many companies, which reduces cost of assembly and manufacturing.
The framework also highlights potential drawbacks of outsourcing:
• Transfer of know-how that encourages new competitors.
• Changes in the balance of power in the industry.
• Dependency, confidentiality, and security issues.
• Fear of opportunism.
The driving factors and potential drawbacks for outsourcing provide firms with
reasons why they may want to outsource an activity. These same factors can be applied
to a public agency in deciding when a partnership may be beneficial. With this context,

27
the factors still have meaning. A public agency, such as the DOD, does not have the
same requirements as a private agency to achieve profit, but must be fiscally responsible.
The USAF is constrained by budgets, may lack know how and requires flexibility
(resiliency). It is important to consider the drivers and potential drawbacks when
deciding to partner, because they may not always dictate or deter partnering when applied
to a public sector.
2.5 Summary
This chapter reviewed relevant literature pertaining to this research and the
questions that were posed in Chapter I. Geographic information systems were reviewed
because they offer insight in how questions can be answered when location is important.
The review on Public-Private Partnerships and Public-Public Partnerships reveals how
partnerships have been used, and provides insight on to developing a successful
partnership. Furthermore, reviewing literature on partnerships revealed that it fails to
address how to identify partnership opportunities. Finally, literature on outsourcing was
reviewed because this research believes that the concept of partnering and outsourcing
are closely related.
28
III. Methodology
3.1 Chapter Overview
This chapter details the methodology used to obtain, process, and analyze data on
over 9,000 public libraries and library systems used in this research. It is important to
note that no central data repository exists for information on public libraries. For this
research, data were pulled from various public and government websites. Therefore, web
scraping techniques were utilized to create the final data set used in this research. The
functions used to gather and format the data were consolidated into a software package
for the R programming language called ‘publicLibs’, which will be submitted for
publication to the Comprehensive R Archive Network (CRAN). The data was then used
to produce an overall quality measure for each library. For this research, library quality
is represented by estimating the size of each library. Finally, Inverse Distance
Weighting (IDW) was used to create an index for each installation that can be used to
identify partnership opportunities. The results of the research are presented in Chapter
IV.
3.2 Data Collection
The IDW methodology imposes two requirements for data: distance and quality.
Therefore, data used for this analysis, at a minimum, must contain the location and
information pertaining to the quality of each library. The geographic location of for each
library allows for the distance from each library to each CONUS Air Force installation to
be determined. Initially, four sources of library data were identified:
www.publiclibraries.org, www.publiclibraries.com, Library Research Services, and the

29
Institute of Museums and Library Services (IMLS). The two website sources of data
were identified containing public library locations, as well as individual metrics for all
libraries, rather than only central libraries as the latter two sources. As a result, the two
websites were chosen as the data sources, but neither source provided a means to export
the large amount of data that it contained. This section describes the data from each
source, how the data were retrieved, and how the data were combined to form the final
library data set.
The first data source identified (www.publiclibraries.com) provided library
information for libraries within the United States by state (Public Libraries, n.d.-a). The
data are arranged such that there is a webpage for each state with a table of libraries
located in that state. The website and tables were constructed using HTML and
contained the name of the library, its address, city, zip code, and phone number. An
example table from the website is shown in Figure 3.
The data obtained from every library in a state were used to identify and join
additional data using the library name as an identifier. Furthermore, the addresses
allowed for each library to be accurately geocoded. The R software environment was
utilized to automate the process of extracting the HTML tables and constructing matrices
that could be manipulated (R Core Team, 2016). Figure 4 shows an example of the
HTML code.

30
Figure 3: Screenshot of www.publiclibraries.com - public libraries located in Alabama
The XML package contains functions to retrieve HTML tables from a URL and
read those tables into a variable (Lang & the CRAN Team, 2016). The resulting list in R
was restructured into a data frame. A data frame is made up of a collection of coupled
variables sharing many of the same properties as matrices and lists (R Core Team, 2016).
The data frame contained the same information as the HTML tables, but it enabled easier
manipulation of the data.

31
Figure 4: HTML code example from www.publiclibraries.com
As previously discussed, the data source provided the address for each library.
The location of each library was required to determine the distance from the library to the
military installation. Thus, each library was required to be geocoded, which is the
process of assigning latitudinal and longitudinal coordinates. The R package ggmap
(version 2.6) was utilized to geocode each library through Google Maps (Kahle &
Wickham, 2013). The Google geocode Application-Programming Interface (API) limits
unregistered users to 2,500 searches per day.

32
The Google geocode API allows users to query more than 2,500 times per day by
creating an account for an API key. Google offers free and paid APIs depending on the
service and map loads required. For this research, a free web service account was created
allowing for up to 25,000 map requests per day. Unfortunately, the ggmap package
version 2.6 does not allow a user to pass the API key from are R ggmap package to the
Google API. Fortunately, R is open source, which allows for users to alter the code of
published packages. The ggmap package was modified allowing for an API key to be
passed through the package to the Google geocode API. An update was sent to the
author of the ggmap package, notifying them of the shortfall and the associated fix.
Obtaining the API key and altering the ggmap package allowed for the entire library data
set to be geocoded.
The data from the first source provided the names and addresses of 15,834
libraries. Using R, the data were transformed into a data frame, and the geographic
coordinates of each library were obtained via the Google geocode API. The list of library
locations allowed for distance calculations using the Haversine formula shown as
Equation 1 (Douglas Nychka, Reinhard Furrer, John Paige, & Stephan Sain, 2015;
Sinnott, 1984). This formula calculates the great-circle distance (𝑑𝑑) between two points
on a sphere from their longitudes (λ) and latitudes (φ), where 𝑟𝑟 is the radius of the sphere.
𝑑𝑑 = 2𝑟𝑟 ∗ arcsin (�(sin𝜑𝜑2 − 𝜑𝜑1
2)2 + cos𝜑𝜑1 ∗ cos𝜑𝜑2 ∗ (sin
𝜆𝜆2 − 𝜆𝜆12
)2) (1)

33
3.3 Library Size Estimation
For this research, the size of the library is a proxy variable for quality. The reason
for this proxy variable choice is the assumption that a larger library serves a larger
population with a wider range of services. The second source of data (www.public-
libraries.org) provided the metrics needed for this proxy variable. Similar to the first
source, the second source of data listed the libraries by state and then by city (Public
Libraries, n.d.-b). However, the information provided for each library is not in easy
tabular form, nor did every library contain the same type of information.
Extracting the data from the second source required many of the same R functions
previously discussed. Every library in the data set contained either a basic set of data (i.e.
location address and library information) or more comprehensive information (i.e.
location address, basic library information, media information, staff information,
children’s library services, financial information, and library technology information)
(Public Libraries, n.d.-b). Reviewing the basic and comprehensive sets of data revealed
that the size of the library was given in the basic set but not in the comprehensive set.
Although the comprehensive data set did not contain the size of the library, it
possessed other factors utilized to estimate the size of the library. The Public Library
Space Needs: A Planning Outline 2009 recommended planning factors for the
construction of a new library. Based on these planning factors, an estimation of the
library size was created from the comprehensive data set. The planning guide allocated
space into six categories: collection space, reader seating space, staff workspace, meeting
room space, special use space, and non-assignable space. The planning outline broke
down each of these categories and provided factors on how to estimate the space needed
34
for each category (Dahlgren, 2009). The guide provided minimal, moderate, and optimal
level factors for designer flexibility. The moderate factors were used in this research in
all but one category.
Libraries contain books and periodicals, audio, and visual materials (non-print),
and computer workstations. The total space required to house these materials is the
collection space defined in Equation 2. Depending on the type of media, different
planning factors were used to estimate the amount of square footage needed. The data set
provided the total number of books (𝑁𝑁𝑏𝑏) and serial volumes (𝑁𝑁𝑣𝑣), number of audio and
visual materials (𝑁𝑁𝑎𝑎𝑣𝑣), and the number of internet terminals (𝑁𝑁𝑖𝑖𝑖𝑖) available to the public.
The moderate planning factors used for each of these variables was 13 square feet per
volume, 13 square feet per volume, and 45 square feet per terminal, respectively
(Dahlgren, 2009).
𝐶𝐶𝐶𝐶𝐶𝐶𝐶𝐶𝐶𝐶𝐶𝐶𝐶𝐶𝐶𝐶𝐶𝐶𝐶𝐶 𝑆𝑆𝑆𝑆𝑆𝑆𝐶𝐶𝐶𝐶 = 13 ∗ (𝑁𝑁𝑏𝑏 + 𝑁𝑁𝑣𝑣 + 𝑁𝑁𝑎𝑎𝑣𝑣) + (45 ∗ 𝑁𝑁𝑖𝑖𝑖𝑖) (2)
The next spaces considered were staff work space and reader sitting space. The
data provided the number of terminals for staff only; therefore, the number of terminals
was estimated to be the number of staff workstations in the library (𝑁𝑁𝑠𝑠𝑠𝑠). The moderate
planning factor of 150 square feet per workstation was used to determine the staff
workspace needed. For the reading space, the planning guide (2009) recommended 30
square feet per seat, with the number of seats (Ns) determined by the service population
(Table 3) (Dahlgren, 2009). Equation 3 estimates the workspace using the number of

35
staff workstations (𝑁𝑁𝑠𝑠𝑠𝑠) and the number of seats (𝑁𝑁𝑠𝑠) determined from Table 3. The
total size of the library can then be estimated with Equation 4.
𝑊𝑊𝐶𝐶𝑟𝑟𝑊𝑊 𝑆𝑆𝑆𝑆𝑆𝑆𝐶𝐶𝐶𝐶 = 150 ∗ 𝑁𝑁𝑠𝑠𝑠𝑠 + �30 ∗ 𝑁𝑁𝑠𝑠 ∗𝑆𝑆𝐶𝐶𝑟𝑟𝑆𝑆𝐶𝐶𝐶𝐶𝐶𝐶 𝑃𝑃𝐶𝐶𝑆𝑆𝑃𝑃𝐶𝐶𝑆𝑆𝐶𝐶𝐶𝐶𝐶𝐶𝐶𝐶
1000 � (3)
Table 3: Reader Seating Schedule (Adapted from Dahlgren, 2009)
Population Seats per 1,000 population (𝑵𝑵𝒔𝒔)
1,000 22.50 2,500 14.25 5,000 10.00 10,000 7.00 25,000 4.50 50,000 3.00 100,000 2.25
𝐿𝐿𝐶𝐶𝐿𝐿𝑟𝑟𝑆𝑆𝑟𝑟𝐿𝐿 𝑆𝑆𝐶𝐶𝑆𝑆𝐶𝐶 = (𝐶𝐶𝐶𝐶𝐶𝐶𝐶𝐶𝐶𝐶𝐶𝐶𝐶𝐶𝐶𝐶𝐶𝐶𝐶𝐶 𝑆𝑆𝑆𝑆𝑆𝑆𝐶𝐶𝐶𝐶 + 𝑊𝑊𝐶𝐶𝑟𝑟𝑊𝑊 𝑆𝑆𝑆𝑆𝑆𝑆𝐶𝐶𝐶𝐶) (4)
3.4 Inverse Distance Weighting
The metric created to identify partnership opportunities relies on the use of
Inverse-Distance Weighting (IDW). IDW is used in GIS analysis and recognizes
Tobler’s First Law of Geography which states: “All things are related, but nearby things
are more related than distant things” (De Smith et al., 2015). IDW estimates a value as a
weighted average at an unknown location based on the known measurements at nearby
points (Figure 5) (Longley & Goodchild, 2011).

36
Figure 5: Inverse Distance Weighting Example
IDW uses Equation 5 to account for the distance between a library and an
installation. Many applications use IDW where 𝑆𝑆𝑖𝑖 is the quality or value of an object and
𝑑𝑑𝑖𝑖 is the distance from the existing value to the unknown value. In this research, size
approximates the quality of a library. IDW then provides a comparable metric for each
installation. A higher index indicates that the surrounding community has a greater
capacity for providing the library service and, therefore, greater potential to offer library
services to the base population.
𝑍𝑍 = ∑ 𝑆𝑆𝑖𝑖 ∗ 𝑑𝑑𝑖𝑖−2𝑖𝑖
∑ 𝑑𝑑𝑖𝑖−2𝑖𝑖 (5)

37
3.5 Summary
This chapter outlined the methodology that was used to complete the analysis for
this research. Inverse distance weighting (IDW) was identified as a GIS technique that
will be used to answer the research question posed in Chapter I. IDW requires that the
data used in the analysis contain distance and quality measures. As such, four sources of
data were identified, and web-scraping techniques for collecting the data set were
discussed. The data set will be analyzed using inverse distance weighting to create an
index for each CONUS USAF installation with the results of this analysis presented in
Chapter IV.

38
IV. Analysis and Results
4.1 Chapter Overview
This chapter reviews how the data that was obtained and processed using the
methods outlined in Chapter III were analyzed. It presents the results of the two models
that were created and discusses the application that was created, thus allowing users to
change inputs and quickly review the results. Finally, the chapter presents the limitations
associated with this research. Conclusions from the results will be discussed in
Chapter V.
4.2 Preparing Data
This research planned to create the data set using web scraping techniques on two
different websites, www.publiclibraries.com and www.public-libraries.org. However,
data scraping from the latter website caused it to crash and become no longer available.
Since this site provided much of the information for the analysis, a new data source was
required. The final analysis carried out by this research utilized data from the Institute of
Museum and Library Services (IMLS).
The IMLS conducted the public library survey in 2014, which reported
operational information for libraries in the United States. This survey was updated in
2016 with new information and imputed values for some that had not been reported. This
data set only provides information on library systems. In cases where a library system
consists of more than one library, a singular data point represents the entire system. For a
standalone library, the figures are for that individual library. The size of a library is a
proxy variable for quality, and was estimated using the methods in Chapter III.

39
The survey by the IMLS provides the name, address, and coordinates for each
library. Furthermore, the following variables estimate the size of the library: service area
population, total staff, print materials, audio materials, video materials, print serials,
computers. Reviewing the data set revealed that there were instances where libraries did
not complete parts of the survey. In these cases, points were removed systematically by
checking if the variables listed above were less than zero.
As discussed in Chapter III, the coordinates of each location enabled the distance
from the library to installation calculation. All the data points provided the address of the
library, and most also gave the latitude and longitude coordinates. For those that did not,
the ggmap package and the address were used to obtain their coordinates (Kahle &
Wickham, 2013). The next step in preparing the data was to determine the distance from
a library to an Air Force installation. The final analysis produced two results, one for a
straight-line distance from an installation to a library and a second for driving distance.
The straight line distance was calculated using the fields package in R (Douglas
Nychka et al., 2015). The package calculates the geographic distance between two points
using the Haversine method to account for the curvature of the earth. This research
assumed libraries further than 100 miles from an installation are not a part of the
installation’s community and were excluded from the data set. A subset of the library
data set was created for each Air Force CONUS installation which included all the
libraries that were within 100 miles of the installation.
Calculating the driving distance between libraries and installations was more
challenging because it required the use of Google Maps and gmapsdistance package

40
(Zarruk, 2016). The Driving Distance API from Google calculates the distance, but it
only allowed for 2,500 searches per day. Due to this limitation, only the libraries with a
straight-line distance of 100 miles or less of an installation had driving distances
calculated. In a few cases, the driving distance was undeterminable, and therefore,
removed from the data set. The final data subsets for each installation contained libraries
within 100 miles, all the library information provided, as well as the straight-line and
driving distance to the installation.
The subsets of data created a single measure for the library service around an
installation. A requirement for this measure is a single radius around each installation.
The radius defines what the user considers the size of the community around an
installation and determines the libraries analyzed, further sub setting the data. The
measure calculated is only useful when compared against other CONUS installations.
4.3 Analysis
4.3.1 Model Results
Inverse distance weighting (IDW) is used to calculate the relative measure for
each installation. Comparing each of these measures is only possible if the size of the
area around each is installation is the same. In preparing the data, it was reduced to only
include libraries within 100 miles of an installation, thus making the data set smaller and
more manageable. A single radius of 50 miles defines the community around an
installation and determines libraries included in the analysis.
The analysis in this research produced two models; one for straight line distances
and one for driving distances. The results are shown in Table 4 and Table 5, respectively.

41
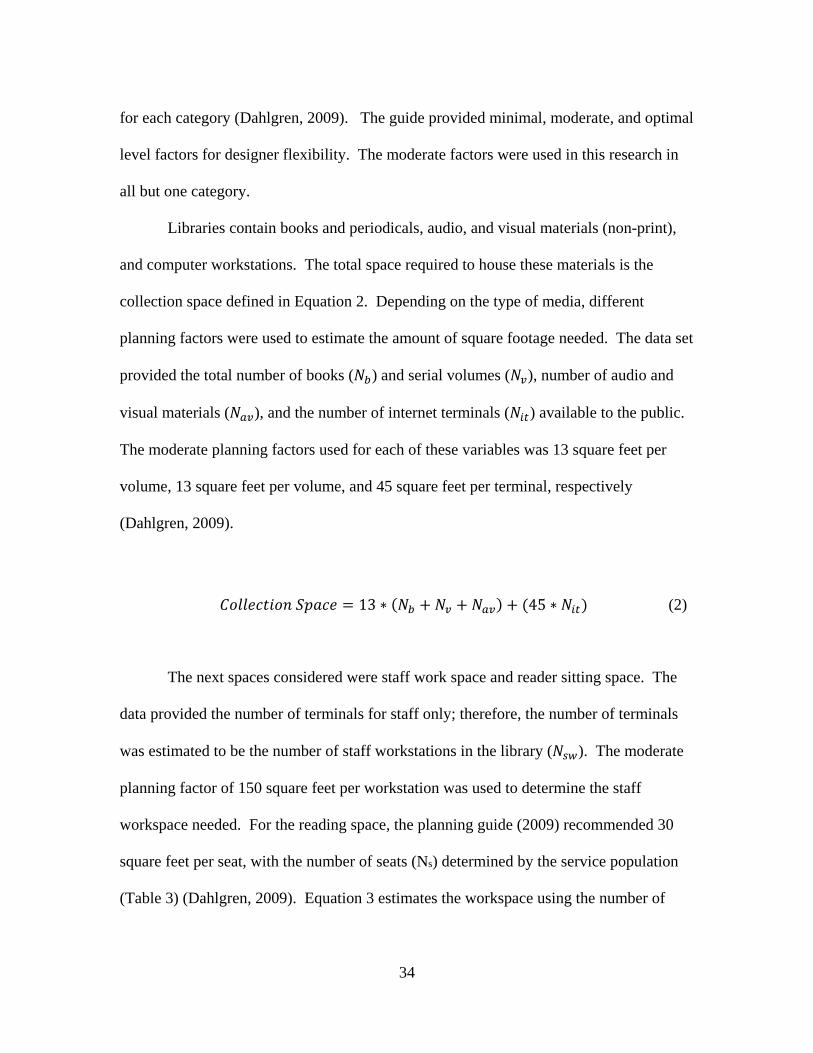
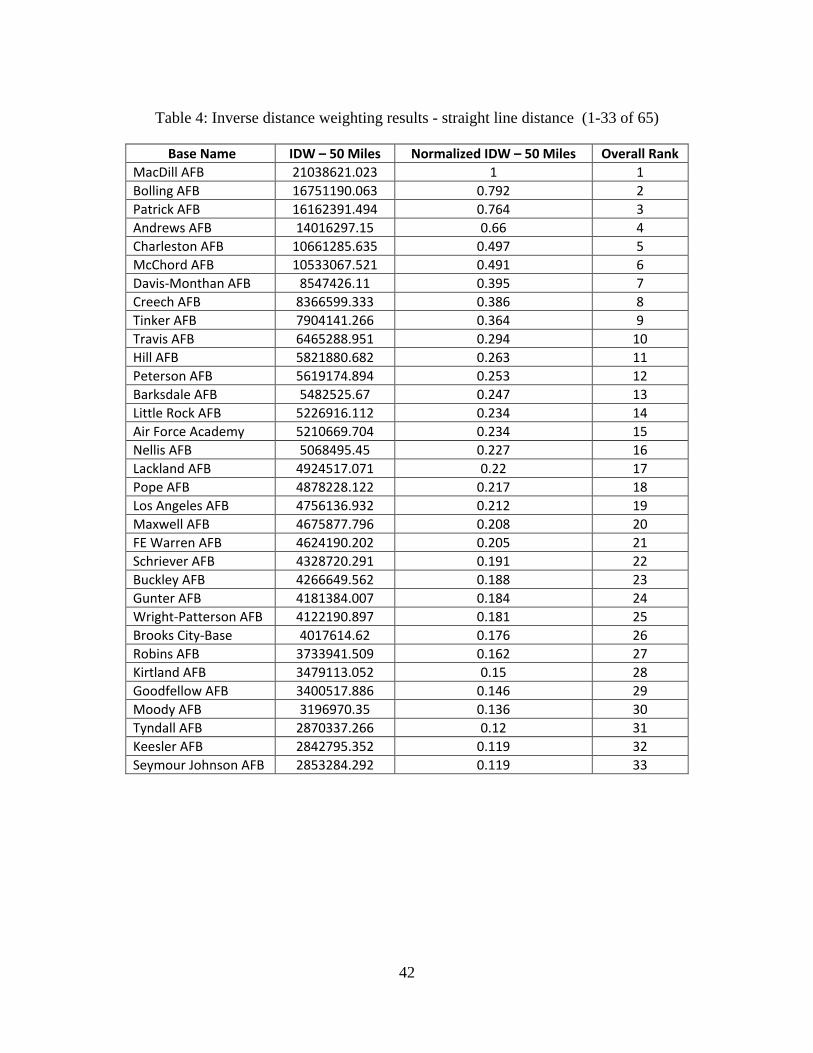
The analysis produces an IDW measure for each installation at the specified radius. The
measure can be compared to other installations, where the greater measure indicates
greater partnership opportunity. The measures were normalized using equation 6 within
their respective categories (straight line and driving distance). This provides reference
points (0 and 1) for the IDW measure. The final step in the analysis was to provide an
overall ranking for each installation based on the IDW measure. Installations with higher
rankings are estimated to have greater library service in the local community, and thus,
are best to consider for eliminating the base library.
𝑍𝑍𝑖𝑖 = 𝑥𝑥𝑖𝑖 − min (𝑥𝑥)
max(𝑥𝑥) − min (𝑥𝑥) (6)
The analysis for both straight-line distance and driving distance produces similar
results since many installations maintain similar overall rankings. However, there were
some installations that moved a significant amount up or down in their overall rank. The
analysis that utilizes driving distance is more detailed and accurate and, therefore,
believed to be the better model. However, the Google API limits the number of driving
distance searches making it more difficult to acquire the required data. Therefore, the
difference between the two models requires further investigation.
42
Table 4: Inverse distance weighting results - straight line distance (1-33 of 65)
Base Name IDW – 50 Miles Normalized IDW – 50 Miles Overall Rank MacDill AFB 21038621.023 1 1 Bolling AFB 16751190.063 0.792 2 Patrick AFB 16162391.494 0.764 3 Andrews AFB 14016297.15 0.66 4 Charleston AFB 10661285.635 0.497 5 McChord AFB 10533067.521 0.491 6 Davis-Monthan AFB 8547426.11 0.395 7 Creech AFB 8366599.333 0.386 8 Tinker AFB 7904141.266 0.364 9 Travis AFB 6465288.951 0.294 10 Hill AFB 5821880.682 0.263 11 Peterson AFB 5619174.894 0.253 12 Barksdale AFB 5482525.67 0.247 13 Little Rock AFB 5226916.112 0.234 14 Air Force Academy 5210669.704 0.234 15 Nellis AFB 5068495.45 0.227 16 Lackland AFB 4924517.071 0.22 17 Pope AFB 4878228.122 0.217 18 Los Angeles AFB 4756136.932 0.212 19 Maxwell AFB 4675877.796 0.208 20 FE Warren AFB 4624190.202 0.205 21 Schriever AFB 4328720.291 0.191 22 Buckley AFB 4266649.562 0.188 23 Gunter AFB 4181384.007 0.184 24 Wright-Patterson AFB 4122190.897 0.181 25 Brooks City-Base 4017614.62 0.176 26 Robins AFB 3733941.509 0.162 27 Kirtland AFB 3479113.052 0.15 28 Goodfellow AFB 3400517.886 0.146 29 Moody AFB 3196970.35 0.136 30 Tyndall AFB 2870337.266 0.12 31 Keesler AFB 2842795.352 0.119 32 Seymour Johnson AFB 2853284.292 0.119 33

43
Table 4: Inverse distance weighting results - straight line distance (34-65 of 65)
Base Name IDW – 50 Miles Normalized IDW – 50 Miles Overall Rank Shaw AFB 2826745.566 0.118 34 Beale AFB 2731675.329 0.114 35 Dyess AFB 2552367.77 0.105 36 Fairchild AFB 2454591.249 0.1 37 Luke AFB 2433166.284 0.099 38 Langley AFB 2332003.192 0.094 39 Hanscom AFB 2110976.622 0.083 40 McConnell AFB 1941850.04 0.075 41 McGuire AFB 1854246.644 0.071 42 Vandenberg AFB 1736589.257 0.065 43 Malmstrom AFB 1578815.604 0.058 44 Offutt AFB 1585193.764 0.058 45 Otis AFB 1497939.658 0.054 46 Sheppard AFB 1475760.195 0.053 47 Cannon AFB 1464019.596 0.052 48 Whiteman AFB 1349258.819 0.047 49 Dover AFB 1316710.17 0.045 50 Edwards AFB 1046211.329 0.032 51 Minot AFB 995508.322 0.029 52 Scott AFB 980231.553 0.029 53 Columbus AFB 941248.165 0.027 54 Ellsworth AFB 951781.871 0.027 55 Altus AFB 905869.626 0.025 56 Holloman AFB 906794.178 0.025 57 Hurlburt Field 913310.126 0.025 58 Grand Forks AFB 823820.049 0.021 59 Vance AFB 757102.385 0.018 60 Laughlin AFB 706374.596 0.015 61 Arnold AFB 672087.51 0.014 62 Randolph AFB 598275.313 0.01 63 Mountain Home AFB 492984.411 0.005 64 Eglin AFB 387595.007 0 65

44
Table 5: Inverse distance weighting results - driving distance (1-33 of 65)
Base Name IDW – 50 Miles Normalized IDW – 50 Miles Overall Rank MacDill AFB 22819541.611 1 1 Patrick AFB 17499508.823 0.764 2 Bolling AFB 17137085.719 0.748 3 Andrews AFB 13645267.511 0.592 4 McChord AFB 10481073.562 0.452 5 Charleston AFB 10295271.547 0.444 6 Air Force Academy 8380488.604 0.359 7 Peterson AFB 7882720.585 0.336 8 Tinker AFB 7878969.339 0.336 9 Davis-Monthan AFB 7287296.209 0.31 10 Travis AFB 6590709.294 0.279 11 Hill AFB 6340372.375 0.268 12 Barksdale AFB 6011373.586 0.253 13 Pope AFB 5704680.13 0.24 14 Wright-Patterson AFB 5392141.833 0.226 15 Maxwell AFB 5252925.11 0.22 16 Little Rock AFB 5196280.106 0.217 17 Schriever AFB 4764077.052 0.198 18 FE Warren AFB 4639398.129 0.192 19 Nellis AFB 4446867.101 0.184 20 Los Angeles AFB 4371546.336 0.18 21 Gunter AFB 4211683.275 0.173 22 Buckley AFB 3786656.68 0.154 23 Lackland AFB 3682735.095 0.15 24 Robins AFB 3646816.904 0.148 25 Kirtland AFB 3576686.296 0.145 26 Brooks City-Base 3526126.117 0.143 27 Goodfellow AFB 3290303.195 0.132 28 Moody AFB 3238618.137 0.13 29 Shaw AFB 2920069.219 0.116 30 Seymour Johnson AFB 2796558 0.111 31 Beale AFB 2788181.453 0.11 32 Luke AFB 2708560.119 0.107 33
45
Table 5: Inverse distance weighting results - driving distance (34-65 of 65)
Base Name IDW – 50 Miles Normalized IDW – 50 Miles Overall Rank Tyndall AFB 2707917.319 0.107 34 Creech AFB 2651030.433 0.104 35 Keesler AFB 2609884.975 0.102 36 Dyess AFB 2475817.635 0.096 37 Fairchild AFB 2447163.173 0.095 38 Langley AFB 2151358.922 0.082 39 Hanscom AFB 2032187.856 0.077 40 McGuire AFB 1983257.814 0.074 41 McConnell AFB 1751036.175 0.064 42 Offutt AFB 1709367.098 0.062 43 Malmstrom AFB 1548131.931 0.055 44 Otis AFB 1547515.017 0.055 45 Sheppard AFB 1546916.802 0.055 46 Vandenberg AFB 1531590.682 0.054 47 Cannon AFB 1483476.744 0.052 48 Whiteman AFB 1473887.285 0.052 49 Dover AFB 1289851.801 0.044 50 Minot AFB 1116275.392 0.036 51 Scott AFB 1128646.383 0.036 52 Edwards AFB 1049067.347 0.033 53 Holloman AFB 1023861.725 0.032 54 Hurlburt Field 1025853.276 0.032 55 Ellsworth AFB 1005587.215 0.031 56 Altus AFB 925335.663 0.027 57 Columbus AFB 902282.84 0.026 58 Grand Forks AFB 886041.479 0.026 59 Vance AFB 754227.62 0.02 60 Laughlin AFB 709213.211 0.018 61 Arnold AFB 686448.204 0.017 62 Randolph AFB 563356.643 0.011 63 Mountain Home AFB 346818.168 0.002 64 Eglin AFB 308818.58 0 65

46
A Spearman’s correlation test was used to determine the relationship between the
two models. The calculation for Spearman’s correlation only requires that the data is
ordinal, interval or ratio, and that the two variables are monotonically related. The test
shows that there is a positive correlation between straight-line IDW and driving distance
IDW (𝑟𝑟𝑠𝑠 = .97, 𝐶𝐶 = 65, 𝑆𝑆 < .001). The scatterplot in Figure 6 summarizes the results.
Overall, the IDW measure for the straight-line distance and driving distance models are
positively correlated.
Figure 6: Driving distance versus straight line distance correlation scatter plot (50-mile
radius)
0 5,000,000 10,000,000 15,000,000 20,000,000
0
5,000,000
10,000,000
15,000,000
20,000,000
IDW - Driving Distance
IDW
- St
raig
ht L
ine
Dis
tanc
e n = 65 p-value < 0.001rs= 0.98
Creech AFB
Air Force Academy
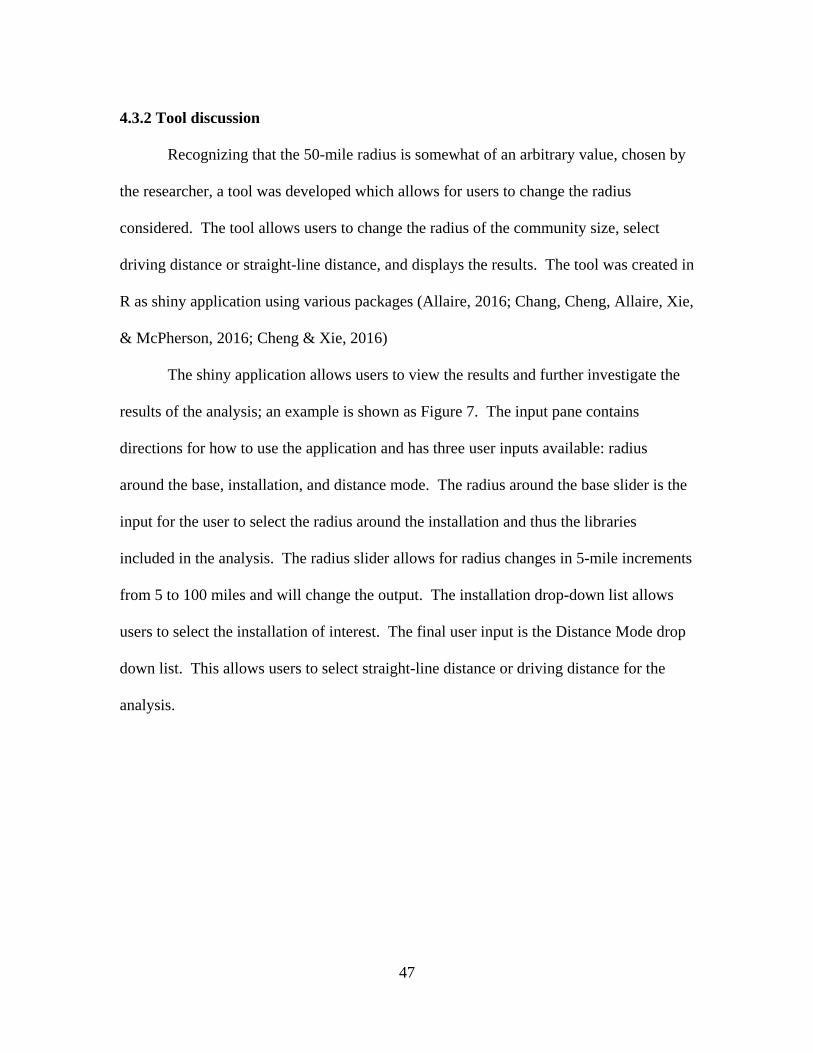
47
4.3.2 Tool discussion
Recognizing that the 50-mile radius is somewhat of an arbitrary value, chosen by
the researcher, a tool was developed which allows for users to change the radius
considered. The tool allows users to change the radius of the community size, select
driving distance or straight-line distance, and displays the results. The tool was created in
R as shiny application using various packages (Allaire, 2016; Chang, Cheng, Allaire, Xie,
& McPherson, 2016; Cheng & Xie, 2016)
The shiny application allows users to view the results and further investigate the
results of the analysis; an example is shown as Figure 7. The input pane contains
directions for how to use the application and has three user inputs available: radius
around the base, installation, and distance mode. The radius around the base slider is the
input for the user to select the radius around the installation and thus the libraries
included in the analysis. The radius slider allows for radius changes in 5-mile increments
from 5 to 100 miles and will change the output. The installation drop-down list allows
users to select the installation of interest. The final user input is the Distance Mode drop
down list. This allows users to select straight-line distance or driving distance for the
analysis.

48
Figure 7: Screenshot of Shiny Application

49
The output pane consists of three panels: Map, IDW measure, and Library List.
The map panel displays a map showing the installation selected by the installation input
and the libraries that are within the radius selected. The Library List displays the libraries
in the specified radius around an installation of interest, sorted by distance from the
installation. For each library, the data used to estimate the library size is displayed.
The application is as a standalone tool. The background and methodology tabs
provide a brief description of the research and the methodology used. The application
allows decision-makers to review and interpret the results. Furthermore, decision-makers
have the capability to change the inputs used in the analysis. From a research standpoint,
the application greatly assisted in reviewing the results, highlighting limitations, and
enables conclusions to be drawn from the analysis. The application simplified the
process of reviewing the results by allowing the researcher to view specific installations
and the subset of data used.
4.4 Limitations
The results from the analysis provided a rank order listing of all CONUS Air
Force installations based on the level of library service provided by the community.
However, several limitations exist in the study. Limitations must be identified and
considered when interpreting the results and drawing conclusions about the research.
The major limitations in this study are quality of data and the quality factor used in the
analysis.
The data used in this research were gathered by the IMLS and provides the all the
central libraries in the United States. However, the first limitation identified in the data
50
set is the collection method. The IMLS does not actually gather the data itself, but rather
combines state-specific annual public library surveys. This issue can be seen in how
states organize and report their libraries. In some cases, states such as Massachusetts,
consider most libraries to be central libraries. On the other hand, states such as Florida,
organize libraries such that there are few central libraries but with many branch libraries.
The difference in organization and reporting is a limitation to this research. In the
case of many central libraries, each library is singularly represented. This is drastically
different than the case where there are very few central libraries and many branch
libraries. In this case, only the central libraries are analyzed but the quality factor (i.e.
size) encompasses the resources for all branch libraries associated with it. The quality
factor or size of a central library with many branch libraries associated with it is much
larger than a standalone central library. Thus, central libraries with many branch libraries
provide a much greater weight in the IDW, which can affect the results if they are located
near an Air Force installation. This limitation does not mean that the analysis is
incorrect, but it requires that the user be aware of it when drawing conclusions. Central
libraries with many branch libraries associated with them may have greater access to
more resources than a standalone library and therefore warrant a greater quality factor.
Another limitation of this study is the quality factor used for the IDW analysis.
The quality factor used, estimated the size of a library based on the size of its collection
and resources. However, the estimated size of a library fails to include other factors that
could affect the quality of a specific library. The collection size and available resources
may not be fully adequate to define the quality of libraries.

51
The analysis performed by this research provides a rank order listing of Air Force
installations based on the level of library service provided by the community. However,
it is difficult to know if the list created with this analysis is correct or useful. As such, the
methodology and results were presented to an independent subject matter expert. The
subject matter expert was a group of professionals from Booz Allen Hamilton, a strategy
and technology consulting firm. The firm is contracted by the Air Force Partnership
Initiative (AFPI) to assist installations in creating partnerships with their local
community.
The consulting firm reviewed the methodology, analysis, tool, and results of this
research independently from the work that it does for the USAF. They were asked to
give their opinions of the research effort and the results, as well as the methodology and
how it could be improved. The consultants found no faults with the results or the
methodology but provided suggestions for how the quality factor could be improved.
The consultants also suggested other services that could be analyzed using this same
approach. The suggestions provided will be discussed in Chapter V.
4.5 Summary
This chapter reviewed how the library data from IMLS was obtained and
processed for the analysis. It discussed the results of the two models that were created
and the application that was created, allowing users to change inputs and quickly review
the results. The chapter concluded with a discussion on the limitations of this research.
The following chapter provides an interpretation of the results and a research conclusion.

52
V. Conclusions and Recommendations
5.1 Chapter Overview
This chapter provides an interpretation and discussion of the results presented in
the previous chapter. The chapter also reviews the research question and investigative
questions from Chapter I. The chapter continues by presenting potential ideas for future
research. Finally, the chapter provides a conclusion for this research effort.
5.2 Review of Research Questions
The investigative questions posed in this research contribute to the overarching
research question of identifying partnership opportunities for Air Force CONUS
installations. The results and answers to these questions can potentially aid Air Force
planners in identifying installations where the local community has greater potential to
offer services through the Air Force Partnership Initiative (AFPI).
Research Question: How can the Air Force identify installations where a greater opportunity for creating partnerships may exist? This research reviewed literature on public-private partnerships and public-public
partnerships to gain a better understanding on what is necessary for their success.
Through this review, the Partnering Process model (Lambert et al., 1996) identifies a way
to decide when to pursue a partnership. The model describes two factors for that impact
the decision to form a partnership: drivers and facilitators. Drivers are the motivations
behind why companies would want to partner, whereas facilitators are the environmental
factors that could affect the growth of the partnership (Lambert et al., 1996).

53
This research identified inverse distance weighting (IDW) as a methodology that
could be used to describe or measure the facilitators that exist between an installation and
the local community for a specific service. IDW estimates the unknow quality of a
service at a location using the quality and location of known services nearby. This
measure can then be compared to other installations to determine which installations
possess a greater opportunity for forming a successful partnership for that service. The
following investigative questions focus on CONUS installations and the base library
service but contribute to this research question.
Investigative Question #1: What characteristics of off-base communities can be used to identify installations where partnerships can be utilized by the Air Force? The researcher identified distance to an installation and library size as two
characteristics used to identify Air Force installations where library partnerships may be
more effective. The analysis performed in this research produced a rank order list of
CONUS installations which have the greatest library service in a 50-mile radius. The
analysis estimated the size of a library based on the collection size and resources as a
proxy variable for quality. Installations with a higher IDW measure identify installations
that have off-base communities capable of providing base library services through the
AFPI. Due to the limitations discussed in Chapter IV, the researcher believes that the
results should not be viewed as a list where the top installation is the absolute best choice.
Rather, the list provides a starting point to identify installations that have greater library
services available in the local community.
54
Investigative Question #2: Does varying the radius used to define the community significantly alter the results of the analysis? Defining the local community around an installation is needed so that the libraries
included in the analysis could be identified. Although, IDW does not require this, every
library could be considered for every installation, it is useful to identify only those that
are near each installation. However, defining a single radius that encompasses the local
community for all CONUS installations is challenging. Thus, this research selected a 50-
mile radius to report, but created a tool that allows users to select the radius and present
the associated results.
The tool created for this research allows for results to be investigated, allowing
users to interact with the model and see the resulting changes. Installations can be
viewed with the subsequent data used in the model and allow for greater insight to be
gained. Ultimately, the significance of the tool is that it provides a greater mechanism for
displaying the results and allowing users to change the inputs of the model. Furthermore,
the tool was created as a standalone product of this research, allowing for the results to be
dispersed more efficiently.
Investigative Question #3: Does the use of straight-line distance versus driving distance substantially change the rank order list of installation? IDW requires the distance from each service to the installation. This research
produced two models for library services, one using straight-line distance and the other
using driving distance to provide rank order lists of installations. The models created
were unique and had differences in their rankings. However, a correlation test reveals
that the models were highly correlated and therefore very similar in the results that they

55
produced. This high correlation implies that using either model should produce similar
results. Therefore, future research could use either straight-line distance or driving
distance for the analysis. This decision can be made based on the needs of the research
and the data available.
5.3 Recommendations for Future Research
Several opportunities exist for future research in this area. As discussed in
Chapter IV, an interview conducted with professionals from Booz Allen Hamilton, a
strategy and technology consulting firm, to assist in verifying the results produced in this
research. The interview helped identify two main areas for future research in this area:
improving the quality factor and other services for analysis.
The first area for future work is associated with improving the quality factor used
in the IDW analysis. The research used the size of the library as a proxy variable for
quality. Although the size of each library was estimated using variables associated with
collection size and resources, it is recognized that there are other factors that can impact
the quality of library service. The factors that could be used to improve the quality
metric can be broken into two categories: internal and external. Internal factors can
include many things that are specific to what the library has or can provide. Including the
number of reading programs or access to external resources are examples of internal
factors that could be used to improve the quality metric.
The internal factors considered are measures of what currently exists. However,
if a base library were to close, surrounding libraries in the local community would see an
increase in usage. Realizing this, future work could also include discounting the quality
56
based on the measurement of usage versus expected increase in usage. Discounting the
quality could be accomplished by comparing the base population to the service area
population of each library. Libraries with large service area populations are not likely to
be as affected by the increase in usage from a smaller base population.
The quality factor used in the IDW analysis could also be improved by including
external factors for each library. External factors are not directly associated with the
library but could affect the quality as viewed by a user. These factors would include data
about the area in which the library is located. Crime rates is an example that could be
included as an external factor. Including factors about the area a library is in might
impact the way users view the quality of a library and affect their decision to use it.
The second area for future work is associated with expanding the analysis to other
services. The IDW analysis used in this research is very flexible because it only relies on
distance and quality. Chapter IV shows that either straight-line distance or driving
distance can be used for the analysis; however, it is believed that driving distance
provides greater detail. In either case, calculating the distance for other services can
easily be achieved. On the other hand, the method to define the quality of each library
would not apply to other services.
Many CONUS Air Force installations provide services to the base population that
are duplicated by local communities. In Chapter I, a model was presented that
categorized functions within an installation as core, important, and peripheral. Core and
important activities provide direct mission accomplishment and support needed for the
mission and personnel, while peripheral activities provide community support and
Morale, Welfare, and Recreation (Johnson, 2015). This research focused on a peripheral

57
service, because they are services that can be easily duplicated by the surrounding
community.
Reviewing services offered at many installations provides opportunities for future
work. The base commissary, child development centers, and fitness centers are services
that could be analyzed in future research. For each of these services, the quality factor
could be refined based on the data available. Future work could also combine each
individual service analysis to provide a clearer picture of the services provided around
each installation. In doing so, a market analysis could be completed to help decision-
makers decide where city-bases would be more effective.
5.4 Conclusion
Air Force leaders face the challenge of maintaining mission readiness with less
funding than required to maintain the necessary infrastructure. Public-Private
Partnerships and Public-Public Partnerships are recognized as a tool that can be utilized
to help alleviate these challenges. Thus, the Air Force Partnership Initiative helps guide
the formation of partnerships to leverage the capabilities and resources of military
installations, local governments, or commercial entities to reduce operating costs and the
costs of the services while retaining or enhancing quality. It has been suggested that at
some installations, the local community could play a major role in providing base
services, thus changing the current installation model. However, before making these
decisions, the Air Force needs to identify which installations should benefit from
exploring partnership opportunities.

58
The scope of this research was limited to exploring library partnership
opportunities at Air Force installations located in the Continental United States
(CONUS). For library services, two characteristics were used to identify installations
that could benefit from using a partnership to provide library services: distance and
quality. The results of the analysis provide a rank-order list of CONUS installations, thus
identifying installations that have the greatest opportunity for creating a partnership for
library services. Going forward, the Air Force can use the results from this research to
selectively implement library partnerships. Furthermore, insights gained from this
research can be used for other services and allow planners to implement partnerships
more effectively.

59
Bibliography
Allaire, J. J. (2016). flexdashboard: R Markdown Format for Flexible Dashboards. manual. Retrieved from https://cran.r-project.org/package=flexdashboard
Ayed Muhammad Algarni, Arditi, D., & Polat, G. (2007). Build-Operate-Transfer in
Infrastructure Projects in the United States. Journal of Construction Engineering and Management, 133(10), 728–735. http://doi.org/10.1061/(ASCE)0733-9364(2007)133:10(728)
Barney, J. (1991). Firm Resources and Sustained Competitive Advantage. Journal of
Management, 17(1), 99–120. http://doi.org/10.1177/014920639101700108 Bing, L., Akintoye, a., Edwards, P. J., & Hardcastle, C. (2005). The allocation of risk in
PPP/PFI construction projects in the UK. International Journal of Project Management, 23(1), 25–35. http://doi.org/10.1016/j.ijproman.2004.04.006
Chang, W., Cheng, J., Allaire, J. J., Xie, Y., & McPherson, J. (2016). shiny: Web
Application Framework for R. manual. Retrieved from https://cran.r-project.org/package=shiny
Cheng, J., & Xie, Y. (2016). leaflet: Create Interactive Web Maps with the JavaScript
“Leaflet” Library. manual. Retrieved from https://cran.r-project.org/package=leaflet Dahlgren, A. C. (2009). Public Library Space Needs : A Planning Outline. Madison,
Wisconsin. De Smith, M., Goodchild, M. F., & Longley, P. A. (2015). Geospatial Analysis 5th
Edition, 2015. Retrieved from http://www.spatialanalysisonline.com/HTML/index.html
Department of Defense. (2007). Defense Installations Strategic Plan. Washington DC:
Department of Defense. Department of the Air Force. (2015). USAF Strategic Master Plan. Washington DC:
Government Printing Office. Douglas Nychka, Reinhard Furrer, John Paige, & Stephan Sain. (2015). fields: Tools for
spatial data. misc, Boulder, CO, USA. http://doi.org/10.5065/D6W957CT ESRI. (2010). Getting Started with GIS. Retrieved July 22, 2016, from
http://training.esri.com/gateway/index.cfm GAO. (2013). GAO Defense Infrastructure. Washington DC: United States Government
Accountability Office.

60
GAO. (2015). GAO High-Risk Series: An Update. Washington DC: United States Government Accountability Office.
Grimsey, D., & Lewis, M. K. (2002). Evaluating the Risks of Public Private Partnerships
for Infrastructure Projects. International Journal of Project Management, 20(2), 107–118. http://doi.org/10.1016/S0263-7863(00)00040-5
Grimsey, D., & Lewis, M. K. (2005). Are Public Private Partnerships value for money?
Accounting Forum, 29(4), 345–378. http://doi.org/10.1016/j.accfor.2005.01.001 Hall, D., Lobina, E., Psiru, V. C., Hoedeman, O., Terhorst, P., Pigeon, M., & Tni, S. K.
(2009). Public-public partnerships (PUPs) in water. Development. Heikkilä, J., & Cordon, C. (2002). Outsourcing: A Core or Non-Core Strategic
Management Decision? Strategic Change, 11(May), 183–193. http://doi.org/10.1002/jsc.589
Hodge, G. A., & Greve, C. (2007). Public Private Partnerships: An International
Performance Review. Public Administration Review, 67(3), 545–558. http://doi.org/10.1111/j.1540-6210.2007.00736.x
Holcomb, T. R., & Hitt, M. A. (2007). Toward a model of strategic outsourcing. Journal
of Operations Management, 25(2), 464–481. http://doi.org/10.1016/j.jom.2006.05.003
Johnson, B. (2015). Strategic Basing Guidance for the Air Force’s Call to the Future. Kahle, D., & Wickham, H. (2013). ggmap: Spatial Visualization with ggplot2. The R
Journal, 5(1), 144–161. article. Retrieved from http://journal.r-project.org/archive/2013-1/kahle-wickham.pdf
Kumaraswamy, M. M., & Zhang, X. Q. (2001). Governmental role in BOT-led
infrastructure development. International Journal of Project Management, 19(4), 195–205. http://doi.org/10.1016/S0263-7863(99)00069-1
Lambert, D. M., Emmelhainz, M. A., & Gardner, J. (1996). So You Think You Want a
Partner? Marketing Management, 5(2), 25–41. Lang, D. T., & the CRAN Team. (2016). XML: Tools for Parsing and Generating XML
Within R and S-Plus. manual. Retrieved from https://cran.r-project.org/package=XML

61
Leiblein, M. J., Reuer, J. J., & Dalsace, F. (2002). Do make or buy decisions matter? The influence of organizational governance on technological performance. Strategic Management Journal, 23(9), 817–833. http://doi.org/10.1002/smj.259
Li, B., & Akintoye, A. (2003). An Overview of Public-Private Parnership. In A.
Akintoye, M. Beck, & C. Hardcastle (Eds.), Public-Private Partnerships: Managing Risks and Oppurtunities. John Wiley & Sons. Retrieved from https://books.google.com/books?hl=en&lr=&id=Y_hAmDKmJM0C&pgis=1
Linder, S. H. (1999). Coming to Terms with the Public-Private Partnership. American
Behavioral Scientist, 43(1), 35–51. http://doi.org/10.1177/00027649921955146 Lobina, E., & Hall, D. (2006). Public-Public Partnerships as a catalyst for capacity
building and institutional development: Lessons from Stockholm Vatten’s experience in the Baltic region. Retrieved from http://www.psiru.org/reports/2006-09-W-PUPs.doc
Longley, P., & Goodchild, M. (2011). Geographic Information Systems and Science
(Third). John Wiley & Sons. Retrieved from https://books.google.com/books?hl=en&lr=&id=toobg6OwFPEC&pgis=1
Merewitz, S. (2016). Innovative Public-Private Partnership for the New Long Beach
Civic Center. Retrieved February 18, 2016, from http://www.publicceo.com/2016/02/innovative-public-private-partnership-for-the-new-long-beach-civic-center/
Minow, M. (2003). Public and Private Partnerships: Accounting for the New Religion on
JSTOR. Harvard Law Review, 116(5), 1229–1270. Retrieved from http://www.jstor.org/stable/1342726?seq=1#page_scan_tab_contents
Moore, W., & Muller, T. (1991). Impacts of Development and Infrastructure Financing.
Journal of Urban Planning and Development, 3(117), 95–107. Ng, a., & Loosemore, M. (2007). Risk allocation in the private provision of public
infrastructure. International Journal of Project Management, 25(1), 66–76. http://doi.org/10.1016/j.ijproman.2006.06.005
Peirson, G., & Mcbride, P. (1996). Public/Private Sector Infrastructure Arrangements.
CPA Communique, 73, 1–4. Public Libraries. (n.d.-a). Retrieved August 15, 2016, from
http://www.publiclibraries.com/ Public Libraries. (n.d.-b). Retrieved March 7, 2016, from http://www.public-libraries.org/

62
R Core Team. (2016). R: A Language and Environment for Statistical Computing. manual, Vienna, Austria. Retrieved from https://www.r-project.org/
Savas, E. S. (2000). Privatization and Public-Private Partnerships. New York: Chatham
House. Shen, L.-Y., Platten, A., & Deng, X. P. (2006). Role of public private partnerships to
manage risks in public sector projects in Hong Kong. International Journal of Project Management, 24(7), 587–594. http://doi.org/10.1016/j.ijproman.2006.07.006
Sinnott, R. (1984). Virtues of the Haversine. Sky and Telescope, 159. Tang, L., Shen, Q., & Cheng, E. W. L. (2010). A Review of Studies on Public–Private
Partnership Projects in the Construction Industry. International Journal of Project Management, 28(7), 683–694. http://doi.org/10.1016/j.ijproman.2009.11.009
Williamson, O. (1979). Transaction-Cost Economics: The Governance of Contractual
Relations. The Journal of Law and Economics, 22(2), 233–261. Retrieved from http://www.jstor.org/stable/725118?seq=1#page_scan_tab_contents
Zarruk, R. A. M. & D. (2016). gmapsdistance: Distance and Travel Time Between Two
Points from Google Maps. manual. Retrieved from https://cran.r-project.org/package=gmapsdistance

63
REPORT DOCUMENTATION PAGE Form Approved OMB No. 074-0188
The public reporting burden for this collection of information is estimated to average 1 hour per response, including the time for reviewing instructions, searching existing data sources, gathering and maintaining the data needed, and completing and reviewing the collection of information. Send comments regarding this burden estimate or any other aspect of the collection of information, including suggestions for reducing this burden to Department of Defense, Washington Headquarters Services, Directorate for Information Operations and Reports (0704-0188), 1215 Jefferson Davis Highway, Suite 1204, Arlington, VA 22202-4302. Respondents should be aware that notwithstanding any other provision of law, no person shall be subject to any penalty for failing to comply with a collection of information if it does not display a currently valid OMB control number. PLEASE DO NOT RETURN YOUR FORM TO THE ABOVE ADDRESS. 1. REPORT DATE (DD-MM-YYYY)
24-03-20172. REPORT TYPE
Master’s Thesis 3. DATES COVERED (From – To)
August 2015 – March 2017 4. TITLE AND SUBTITLE Identifying Partnership Opportunities at Air Force Installations: A GeographicInformation Systems Approach
5a. CONTRACT NUMBER
5b. GRANT NUMBER
5c. PROGRAM ELEMENT NUMBER
6. AUTHOR(S)
DeGroot, Corey R, 1st Lt., USAF
5d. PROJECT NUMBER
5e. TASK NUMBER
5f. WORK UNIT NUMBER
7. PERFORMING ORGANIZATION NAMES(S) AND ADDRESS(S) Air Force Institute of TechnologyGraduate School of Engineering and Management (AFIT/ENV)2950 Hobson Way, Building 640WPAFB OH 45433-7765
8. PERFORMING ORGANIZATIONREPORT NUMBER
AFIT-ENV-MS-17-M-184
9. SPONSORING/MONITORING AGENCY NAME(S) AND ADDRESS(ES) Booz Allen Hamilton, INCBrad McRee c/o Yvonne Fernandez1550 Crystal Drive Suite 1100, Arlington, VA [email protected]
10. SPONSOR/MONITOR’S ACRONYM(S)
11. SPONSOR/MONITOR’S REPORT NUMBER(S)
12. DISTRIBUTION/AVAILABILITY STATEMENT Distribution Statement A. Approved for Public Release; Distribution Unlimited.
13. SUPPLEMENTARY NOTES This work is declared a work of the U.S. Government and is not subject to copyright protection in the United States.
14. ABSTRACT The excess capacity found in the Department of Defense real property portfolio creates challenges for leaders to provide
resilient installations. Combining this fact with current funding trends makes decisions on how to properly maintain infrastructure even more challenging. The Air Force Partnership Initiative provides tools for installations to leverage community capabilities and resources to achieve savings and improve quality on Air Force installations and can reduce the real property footprint. This research proposes a method for assessing the viability of a partnership between Air Force installations and their nearby communities.
This research effort created a tool capable of investigating off-base communities and discovering partnership opportunities worthy of exploration by nearby Air Force installations. The scope of this research will be limited to exploring library partnership opportunities at Air Force installations located in the Continental United States. This research investigates the facilitators, or environmental factors, to identify where greater opportunities for creating partnerships may exist. The result of this research is a tool which produces a relative measure for each off-base community, where higher values indicate a greater potential for partnerships. This relative measure utilizes inverse distance weighting between an installation and each service location in the surrounding community. 15. SUBJECT TERMS
Public-Private Partnerships, Public-Public Partnerships, Geographic Information Systems, Inverse Distance Weighting16. SECURITY CLASSIFICATION OF: 17. LIMITATION OF
ABSTRACT
UU
18. NUMBER OF PAGES
73
19a. NAME OF RESPONSIBLE PERSON Freels, Jason K., Maj, Ph.D, USAF
a. REPORT
U b. ABSTRACT
U c. THIS PAGE
U 19b. TELEPHONE NUMBER (Include area code) (937) 255-6565, x 4676 ([email protected])
Standard Form 298 (Rev. 8-98) Prescribed by ANSI Std. Z39-18