Embed Size (px)
Citation preview
BARNETT PAPERS IN SOCIAL RESEARCH
Identifying people in poverty: A multidimensional deprivation measure for the EU
Selçuk Bedük
WORKING PAPER 18-03
September 2018
DEPARTMENT OF SOCIAL POLICY AND INTERVENTION
Identifying people in poverty: A multidimensional deprivation measure for the EU
Selçuk Bedük
Institute of Social and Economic Research University of Essex
Abstract
In this article, I propose a multidimensional deprivation measure of poverty for the EU
with the aim of improving the measurement performance of existing deprivation scales.
The paper stands on the claim that a deprivation measure can be adequate, both
conceptually and empirically, to capture poverty in the EU defined in Townsendian
terms. Yet existing deprivation scales have three conceptual problems such as data-
driven specification, neglected dimensionality and missing dimensions, and some data
problems such as limited extent, cross-cultural equivalization, behavioral choices and
reporting error. To address conceptual problems, I offer a concept-led methodology to
construct a multidimensional measure. To address data problems, I apply a post-hoc
adjustment strategy using dual criteria of income poverty and financial strain. The
proposed measure has four dimensions, namely needs for basic goods, health,
education, leisure and social relationships, where each dimension is evaluated
separately with relevant scales. When compared to the formal EU 2020 poverty target
measure, the proposed measure is more likely to capture people with needs and lower
resources as well as those in less affluent countries than those in more affluent
countries. The (adjusted) proposed measure can be used as a stand-alone indicator to
identify a target population for policy; or the unadjusted proposed measure can be
combined with an income poverty measure to identify a worst-off group within that target
population.
Barnett Paper 18-03 Identifying people in poverty
3
Introduction
Deprivation scales are of greater interest in European poverty research. In many EU
countries, deprivation scales are employed as part of formal poverty measures. EU
2020 poverty target measure, UK’s child poverty measure and Ireland’s official poverty
measure all include deprivation scales yet as either complementary or supplementary to
traditional income poverty indicators.1 For example, according to the EU 2020 poverty
target measure, people in poverty are defined as those who experience income poverty
or material deprivation.2 Combining income and deprivation measures, it is argued, help
better identify the scale of the problem to be addressed by anti-poverty policies in EU
member states (Nolan and Whelan, 2011).
Various issues can however be raised about this practice of using deprivation measures
alongside income poverty measures. First, conceptually, income and deprivation
measures are not supplementary or complementary but alternatives to each other (if the
aim is to measure poverty defined in Townsendian terms); hence, in theory, an income
or a deprivation measure alone can be adequate to identify poverty (defined in
Towsendian terms) (see also Hick, 2014).3 Secondly, both income and deprivation
1 Different uses of deprivation measures is arisen due to different interpretations of
Townsendian definition of poverty (Berthoud & Bryan, 2011), the empirical finding of a large
mismatch between low income and material deprivation (see Nolan and Whelan, 2011 for a
review), the disagreements about how to go about this mismatch empirically (Hick, 2014), and
various practical and political considerations related to measuring poverty in a cross-national
context (Copeland and Daly, 2012; Maître et al., 2013).
2 Another indicator used in the EU2020 poverty target is low work intensity, which however is
argued to conflate the overall measure and provide little extra information (Maitre et al. 2013).
3 Relative deprivation theory defines a process in which lack of resources results in exclusion
from ordinary living patterns. Different interpretations are made on which part of this definition
Barnett Paper 18-03 Identifying people in poverty
4
measures suffer from certain validity problems (and mainly similar problems) and
combining two imperfect, conceptually different indicators would not necessarily result in
one accurate measure. Thirdly, Hick (2014) shows that, despite their current limited
form, it is the deprivation and not the income measure that is particularly useful in
identifying the people with a pronounced risk of multiple deprivation in the UK. However,
Hick argues, the considerably non-ideal nature of existing deprivation measures still
limits their ability to distinguish between poverty and non-poverty, and so “advancing the
measurement of material deprivation beyond its present, relatively rudimentary state
represents an important priority for poverty research (Hick, 2014: 1101)”.
Recent proposals by Whelan & Maître (2012) and Guio et al. (2016) improve existing
deprivation scales using an extended set of items collected at the EU-SILC survey’s
material deprivation module. These measures are usually constructed in a summary
format where a unidimensional scale based on a few key deprivation indicators are
considered adequate for identifying poverty and reflecting the variance across countries
(see e.g. Guio et al. 2017). However, recent empirical evidence has shown that these
unidimensional measures might be suffering from significant measurement error i.e.
missing certain risk groups or not adequately reflecting socio-economic differentiation
represents the essence of poverty (Berthoud and Bryan, 2011). While Townsend considers
poverty primarily as a lack of resources and exclusion from ordinary living as the consequences
of it, others consider poverty as exclusion from ordinary living and the cause being the lack of
resources. Regardless of the view taken, income (as a proxy of lack of resources) and
deprivation (as a proxy of exclusion from ordinary living patterns) represent alternative
measures of the same phenomenon, and both can be a direct or an indirect measure of poverty
depending on the view taken. For example, if poverty is defined as exclusion from ordinary living
caused by lack of resources, a deprivation measure including enforced criterion can be used a
direct measure of poverty; or an income measure which adequately considers non-cash
economic resources, saving and debt as well as varying needs due to individual and household
characteristics can also be employed as an indirect measure of poverty.
Barnett Paper 18-03 Identifying people in poverty
5
within EU countries due to certain conceptual problems such as data-driven
specification, neglect of multidimensionality and missing dimensions (Bedük, 2017;
2018a, b). In addition to these conceptual problems, there are also data problems
related to the limited extent, the subjectivity and the use of deprivation data in a cross-
national setting (see Guio et al. 2017). All these conceptual and data problems are
directly consequential for measurement, therefore might result in missing people in
poverty (Type II error) or wrongly identifying people in poverty (Type I error).
Developing on the critiques of Bedük (2017; 2018a, b), and Hick (2014), the main
objective of this paper is to propose a deprivation measure of poverty for the EU that
improves on the problems of existing measures and can empirically perform better in
identifying the people in poverty compared to its existing counterparts. Such a measure
proves to be a comprehensive, multidimensional measure with a concept-led design
reflecting poverty defined in Townsend’s relative deprivation framework.
In this context, next section summarizes existing measures and their problems as well
as the proposal of the paper on how to solve these problems. The following sections i)
elaborate the meaning of poverty (i.e. identify dimensions and conceptual structure) to
guide the design of the measure; ii) operationalize the explored design with available
data; iii) apply a dual adjustment strategy to mitigate the error caused by data problems;
and iv) examine the validity of the proposed measure by comparing the EU 2020
poverty target on its ability to capture those with needs and lower resources to using a
multinomial logistic model. The analysis is held for 25 EU countries using EU-SILC
2009.

Barnett Paper 18-03 Identifying people in poverty
6
Identifying people in poverty – existing measures, their problems and
proposals for mitigating possible measurement error
In European poverty research, poverty is generally defined within the relative
deprivation framework of Townsend (1979). In this framework, individuals are in poverty
when “their resources are so seriously below those commanded by the average
individual or family that they are excluded from ordinary living patterns, customs and
activities”. This definition makes a clear link between command over resources and
conditions of life, and defines a process in which a lack of (economic) resources causes
an inability to participate in society.
One way to assess such poverty is using income measures which aim to assess the
adequacy of economic resources for social participation. In such measures, household
disposable income (usually equivalized for household size and composition) is used as
a proxy for resources, and a poverty line is set to represent the level below which
resources are considered inadequate for participating in society. However, income as
we measure does not include the value of publicly provided services, in-kind benefits,
home production, saving and borrowing, past investments in durables, and house
ownership and assets which are important factors affecting command over resources
(Nolan and Whelan, 2007). Also, adequacy of resources depends not only on resources
but also on geographical price variation, and various individual and household needs
not accounted in the existing forms of these measures (Ravallion, 1996). For example,
varying needs for health care, child care, social care, education and work (e.g.
transportation) are accounted neither in disposable income nor in poverty line
Barnett Paper 18-03 Identifying people in poverty
7
estimates. As a result, it is questionable that commonly used income poverty lines such
as 60% of median income represent a level of exclusion from ordinary living patterns
especially when applied in a cross-national context (Goedemé and Rottiers, 2011;
Lelkes and Gasior, 2018).4 For example, a recent study using reference budgets has
shown that, in some less affluent EU countries, some of those who are not identified as
in poverty by a relative income poverty measure (60% of median) still cannot afford to
meet their needs for food and housing (Goedeme et al., 2017). Another issue is the
reliability of income data collected based on household surveys. For example, validating
against administrative data in the US, Meyer & Mittag (2015) show significant
underreporting of receipt and level of benefits in household surveys, varying between
30%-60% depending on the type of benefit, which has a significant impact on the
numbers of poverty.5 All of these issues weaken the accuracy of income poverty
measures in identifying the people in poverty.
Deprivation scales are raised partly as a response to these problems. These scales
include multiple binary deprivation items, where each item shows deprivation in goods,
services or social activities due to an inability to (economically) afford (enforced
criterion). Therefore, they aim to capture deprivation in living standards due to not
having adequate economic resources.
4 However, see the recent efforts to improve on some of these problems based on reference
budgets in the EU (Penne et al., 2016; Decerf et al., 2017), and supplemental poverty measure
in the US (Short, 2011).
5 The reasons for under-reporting are various including memory bias related to timing, amount
or the recipient of the benefit; confusing program names; stigma and shame; and, sensitivity of
income information (Meyer et al., 2009).
Barnett Paper 18-03 Identifying people in poverty
8
In principle, given that they are outcome measures and reflect deprivation due to
affordability problems, deprivation measures are free from most of the aforementioned
problems of income poverty measures. Deprivation measures represent inadequacy of
economic resources for having the conditions of life necessary for social participation
which, at least in theory, takes into account various sources of income such as assets
and debt, in-kind benefits and public services. Also, since needs are directly evaluated,
the variation in needs across individuals or households does not construe a problem if
each relevant need is included into the measures. For example, variation in needs for
child care can be accounted by including an item that represent cost-related unmet
needs in child care. Those households who do not have the need (e.g. without children),
or who have the need but met (e.g. with children and get free child care) score zero,
while those who have cost-related unmet need score one from the deprivation item.
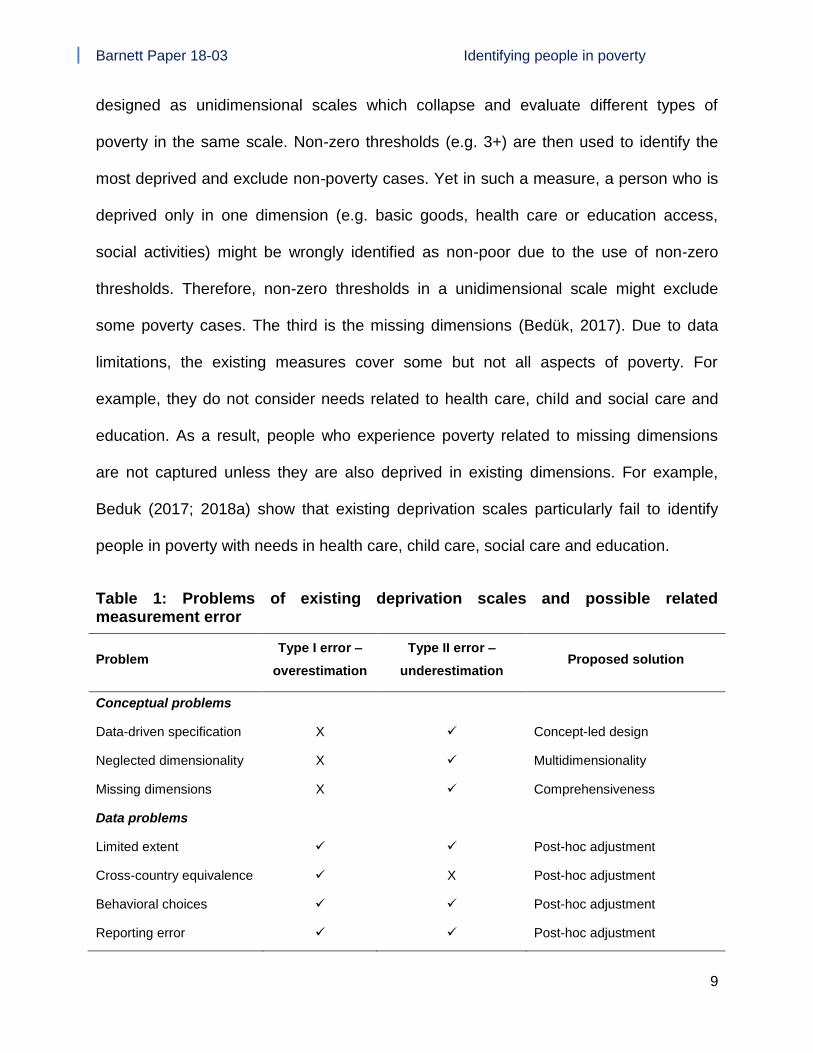
However, in practice, existing deprivation scales suffer from three conceptual and four
data problems, and both types of problems might cause Type I and II error in
measurement (see Table 1).
Regarding conceptual problems, the first is the data-driven design. Although relevant
deprivation items are selected based on theory, deprivation scales are generally
constructed based on data-driven methods (exploratory factorial techniques). Therefore,
specification of resulted scales is ultimately determined by data. As explained in more
detailed below, there are significant limitations in deprivation data, hence one would
expect existing scales to be inadequate for capturing different experiences of poverty.
The second is the neglect of dimensionality, more specifically the use of non-zero
thresholds in a unidimensional scale (Bedük, 2018b). Existing deprivation measures are
Barnett Paper 18-03 Identifying people in poverty
9
designed as unidimensional scales which collapse and evaluate different types of
poverty in the same scale. Non-zero thresholds (e.g. 3+) are then used to identify the
most deprived and exclude non-poverty cases. Yet in such a measure, a person who is
deprived only in one dimension (e.g. basic goods, health care or education access,
social activities) might be wrongly identified as non-poor due to the use of non-zero
thresholds. Therefore, non-zero thresholds in a unidimensional scale might exclude
some poverty cases. The third is the missing dimensions (Bedük, 2017). Due to data
limitations, the existing measures cover some but not all aspects of poverty. For
example, they do not consider needs related to health care, child and social care and
education. As a result, people who experience poverty related to missing dimensions
are not captured unless they are also deprived in existing dimensions. For example,
Beduk (2017; 2018a) show that existing deprivation scales particularly fail to identify
people in poverty with needs in health care, child care, social care and education.
Table 1: Problems of existing deprivation scales and possible related measurement error
Problem Type I error –
overestimation
Type II error –
underestimation Proposed solution
Conceptual problems
Data-driven specification X ✓ Concept-led design
Neglected dimensionality X ✓ Multidimensionality
Missing dimensions X ✓ Comprehensiveness
Data problems
Limited extent ✓ ✓ Post-hoc adjustment
Cross-country equivalence ✓ X Post-hoc adjustment
Behavioral choices ✓ ✓ Post-hoc adjustment
Reporting error ✓ ✓ Post-hoc adjustment

Barnett Paper 18-03 Identifying people in poverty
10
In order to address these conceptual problems, the aim here is to construct a
deprivation measure of poverty which is i) concept-led where the identification of
dimensions, and the specification of overall design are primarily determined from the
theoretical definition of poverty; ii) multidimensional where each dimension is evaluated
separately with a relevant scale before reaching an overall evaluation of poverty; and iii)
more comprehensive including aspects of poverty that are missing in existing
deprivation scales such as needs for education and health.
Yet even if conceptual problems are solved, data problems might still cause some error
in measurement.
Regarding data problems, the first is the limited extent of deprivation data. As
mentioned in relation to missing dimensions problem, available comparable data in
deprivation (e.g. in ECHP or EU-SILC) includes only some dimensions of poverty, which
might cause failing to identify certain poverty experiences related to missing
dimensions. Moreover, even for the existing dimensions, each type of deprivation is
assessed based on only one or a few indicators. For example, in EU-SILC, food poverty
(or insecurity) is indicated by one variable representing affordability of a meal with meat,
chicken, fish (or vegetarian equivalent) every second day, which does not capture
different aspects of food insecurity such as hunger or insecure access to adequate food
(Loopstra et al. 2016). Therefore, evaluating each type of deprivation with only a few
items as in existing deprivation measures might cause some underestimation or
overestimation of the extent of deprivation.

Barnett Paper 18-03 Identifying people in poverty
11
The second is cross-cultural equivalence of deprivation items and measures. As also
argued by Gábos & Goedemé (2016) and Hick (2014), it is not clear whether the
specific selected items or overall measures have the same social meaning in all EU
countries. Kis et al. (2015), for example, argue that while 9-item overall deprivation
measure is not affected by cultural differences, the attitudes towards holiday, car and
saving (ability to pay unexpected expenses) vary across countries. This item-level non-
invariance is particularly a concern as cross-country variance for some items are
unexpectedly high. For example, the deprivation rate for “ability to afford to buy new
clothes” is 2% in Netherlands and 65% in Bulgaria; for “ability to afford a week of annual
holiday away from home is 11% in Denmark and 76% in Romania; for “ability to afford
to replace worn-out furniture” is 3% in Italy, while it is around 80% in Bulgaria. To a
certain extent, such high rates in less affluent countries raise suspicion about the
validity of these items as deprivation indicators; nevertheless, these items have high
discriminatory powers and are the main source of limited variance within affluent
countries. Therefore, the items included given their discriminatory value in affluent
countries might cause an overestimation for the less affluent countries.
The third is measurement error due to behavioral choices. One main feature of direct
outcome measures is that achieved outcomes reflect resource and need constraints as
well as preferences. One of the main appeal of deprivation measures is their ability to
distinguish constraints from preferences through the method originally proposed by
Mack & Lansley (1985). In this method, people are asked to evaluate whether a specific
deprivation is a result of affordability problems or their own choice. Although such
affordability questions seem to capture well the resource constraints (Hick, 2013), the
Barnett Paper 18-03 Identifying people in poverty
12
subjective nature of the question might still bring certain biases in judgement. One main
reason is that preferences are not formed independent of individual characteristics (e.g.
economic conditions, age, health or personality etc.) or preferences might adapt to
existing conditions (Halleröd, 2006; Crettaz & Suter, 2013). As a result, certain groups
such as elderly or those with low incomes are more likely to say “they do not want”
certain items especially when their material situation is worse than before (Halleröd,
2006b; Hick, 2013; McKnight, 2013); or, elderly might be less likely to attribute
deprivation to the shortage of money (Berthoud et al., 2006).6 Both of these issues
might result in underestimation of poverty numbers. On the other hand, McKay (2004)
also argues that some of those who lack many necessities at the same time possess
other non-necessities which reflects the heterogeneity of preferences and sign an
overestimation of poverty numbers.
The fourth is reporting error, for example due to social desirability bias or
misinterpretation of questions. Evidence suggests that answers to sensitive questions
are often distorted by social desirability bias. To avoid embarrassment and distress,
individuals tend to underreport outcomes that are deemed as socially undesirable such
as deprivation. For example, although Siminski & Yerokhin (2012) find no evidence that
reporting bias contributes to the age-gradient in deprivation, Gundersen & Ribar (2011)
argue that food insecurity in the US is underreported due to social desirability bias. This
evidence is also supported by the study of Breunig & McKibbin (2011) which shows that
6 For example, Siminski & Yerokhin (2012) show that one-third of the variation in deprivation
between elderly and non-elderly population is explained by unobserved characteristics, which
they interpret as behavioral choices; on the other hand, Hildebrand et al. (2017) show that
differences in deprivation between native and migrant population in Luxembourg can almost
totally be explained by differences in resources.

Barnett Paper 18-03 Identifying people in poverty
13
individuals report higher financial difficulty in written, self-completion questionnaire than
in the computer-assistant face-to-face interview as the prior is exposed to less social
desirability bias due to being a more impersonal method. The effect of survey mode is a
serious concern for deprivation measures as the data collection method in EU-SILC
significantly varies across countries. Yet another issue is the misinterpretation of
deprivation or affordability questions. As reported widely (e.g. Nolan & Whelan, 2011:
69), deprivation can be found even on the highest income groups which might be
related to misunderstandings about what is being asked in relation to deprivation items
(e.g. going for a holiday) or miscalculations related to affordability (Mack and Lansley,
1985), and both of these issues might cause overestimation of poverty.
To address possible biases related to data problems, a post hoc adjustment strategy is
applied to the proposed deprivation measure using both income poverty and financial
strain as dual criteria. This adjustment strategy is explained in detail in the
operationalization section; before that, next section focuses on elaborating the concept
of poverty and its dimensions to address the conceptual problems.
Elaborating the concept of poverty and its dimensions
In this section, the conceptual meaning of poverty within relative deprivation framework
is elaborated to inform the design of the measure. The main issue is to explain the
meaning of participation in society (or exclusion from ordinary living patterns).
Townsend developed relative deprivation framework based on a critique of the
prevailing understanding of poverty at the time, so-called biological approach, in which
Barnett Paper 18-03 Identifying people in poverty
14
poverty is defined as inability to afford “minimum necessaries for the maintenance of
merely physical efficiency (Rowntree, 1901: 86)”. Amongst many others, Townsend’s
main critique was on the narrow understanding of poverty as mere subsistence which
isolates the phenomenon from its societal context, and ignores the demands or social
obligations imposed upon individuals by the society (Townsend, 1962; 1993).
Individuals, merely by being members of a society, not only have biological but also
social and psychological needs which are created and sustained by the social
institutions and welfare systems (Townsend, 1979: 50-59; Lister, 1990). Accordingly,
Townsend defines relative deprivation and poverty in the context of social relationships,
social participation and citizenship:
“People are relatively deprived if they cannot obtain, at all or sufficiently, the
conditions of life – that is, the diets, amenities, standards and services – which
allow them to play the roles, participate in the relationships and follow the
customary behavior which is expected of them by virtue of membership of
society. If they lack or are denied resources to obtain access to these conditions
of life and so fulfill membership of society they may be said to be in poverty.
People may be deprived in any or all of the major spheres of life […] performing a
variety of roles in fulfilment of social obligations (Townsend, 1993: 36)”
Relative deprivation is the inability to obtain the conditions of life or to meet certain
needs required for social participation, while poverty is the inability to meet these needs
due to not having enough economic resources. In this framework, social participation is
defined in terms of performing expected social roles as citizens, parents, workers,
Barnett Paper 18-03 Identifying people in poverty
15
friends, relatives, neighbors etc (Lister, 1990); dimensions of poverty are considered as
different needs required for being able to perform social roles, while relevant deprivation
items represent the conditions of life required to satisfy these needs. Townsend further
elaborates these areas of need based on some instances of the poverty experience:
“… people do not just go hungry or get cold for lack of fuel or clothing. And their
health is not just measurably worse for want of income. Families may no longer
be able to go even the cheapest holiday, or invite friends to their homes, or send
their children to school when money has to be provided for some special function
or outing, or respond to urgent requests from church of which they are members.
Old age pensioners may fail to join friends in a club or a pub because they lack
resources to share the costs. Young families may become homeless because of
a shortage of, or a deterioration in, public housing, or they may find they cannot
maintain both the costs of a home and the costs of meeting other obligations, like
travelling to find, or keep in, paid work, or caring for close elderly and disabled
relatives. The balancing act becomes a nightmare. Their essential needs are
defined in terms of family dishonor and social ostracism as well as individual
hunger and cold (Townsend, 1993: 37)”
The needs go from basic goods (e.g. food, clothing and shelter) to other essentials such
as education, health and caring as well as to more social ones such as leisure and
social relationships (e.g. meeting friends, go on a holiday). These needs reflect three
distinct features (as derived from Townsend’s description of the poverty experience):
Barnett Paper 18-03 Identifying people in poverty
16
First, roots of these needs are not only physical but also social or psychological. This
follows from Townsend’s critique of the biological approach and underlies his relative
deprivation approach which considers needs as socially constructed, reflecting “a range
of social expectations and responsibilities, and also dictates of laws (Lister, 2004:24)”.
Secondly, these needs are considered as absolute and universal, while the conditions
of life required to meet these needs are relative to the society (see also Gordon et al.,
2000) as well as to individual and household characteristics (e.g. based on age, health
and household demographics). This interpretation has parallels to Sen's (1983)
argument that capabilities are absolute while commodities required to reach capabilities
are relative, and Doyal & Gough's (1984) theory, where basic human needs are
absolute and universal while commodities to satisfy these needs are relative.
Thirdly, each need is considered as a constitutive component of poverty yet without any
hierarchy among them – the value given to each dimension might vary across
individuals depending on their specific conditions as well as preferences and choices.
Yet there is no ex-ante assumption on which aspects are more important for
participation. Therefore, it is important to consider each need separately, as when
money is scarce, individuals might choose different needs to satisfy, and essentially, an
enforced deprivation in even one defines a poverty experience.
Based on this framework, conceptual structure of poverty defined in Townsendian terms
can be described as in Figure 1. It is a multidimensional and multi-level structure, and in
psychometrics terminology a formative measure (against commonly used reflective

Barnett Paper 18-03 Identifying people in poverty
17
measures) where dimensions define poverty, components define dimensions, and
observed indicators reflect components.
Dimensions represent the areas of needs required for social participation, where social
participation is considered more generally as the ability to adequately fulfil
responsibilities and performing social roles related to work, family and wider community.
These needs are universal, absolute and essential conditions for social participation and
avoiding poverty. An example could be needs for basic goods.
Components represent goods, services and activities (conditions of life) required to
meet needs for social participation but might be lack due to a resource constraint
(inability to economically afford). Therefore, these conditions of life are essential
conditions for meeting needs for social participation and avoiding poverty. An example
would be inability to afford food.
Within this framework, if someone is not able to afford one of the conditions of life (i.e.
deprivation in a component), she/he is not able to meet one of the required needs for
social participation (i.e. deprivation in a dimension), and hence considered as living in
poverty. This perspective reflects a union approach at both levels - deprivation in a
component means deprivation in a dimension, and deprivation in a dimension means
poverty. Then measuring poverty comes down to measuring deprivation in components
of dimensions. In other words, there are two key steps in this framework – identifying
relevant dimensions and their components, and devising reliable scales for each
component. The next section deals with the issue of identifying dimensions and their
components.

Figure 1: Conceptual structure of poverty defined in Towsendian terms
Observed indicators – used to
create scales for each component
.
..
I2
Dimensions – needs required for
social participation (or performing
social roles)
I1
Components – conditions of life
required for meeting needs for
social participation
- In . ..
. ..
. .. . ..
. .. . ..
Identifying dimensions of poverty and their components
In this section, the aim is to describe a provisional list of dimensions derived mainly
based on applied theoretical definition of poverty and existing empirical evidence. Such
practice helps to elaborate the meaning of poverty and exemplify a poverty measure
representing the conceptual structure explored above. The main criterion to identify
dimensions is that the dimensions should represent areas of needs that are essential for
social participation (or performing social roles), where social participation is considered
more generally as the ability to adequately fulfil responsibilities related to work, family
and wider community.
The meaning of each dimension is elaborated by exploring their components, where
components represent conditions of life required for meeting needs for social
participation but might be lack due to an economic resource constraint (i.e. inability to
afford). Therefore, I briefly report some empirical evidence on the relationships between
i) needs and social participation to identify dimensions, and ii) needs and low income to
identify components.
Following this framework, four dimensions are identified, namely need for basic goods,
health, education, and leisure and social relationships. It is important to note here that
this practice of deriving dimensions is confined to the dimensions that are possible to
measure given available data. In principal, for example, needs related to caring (child
and social care) or employment should also be considered.

Barnett Paper 18-03 Identifying people in poverty
20
Basic goods. This dimension represents the need for basic goods such as food,
clothing and shelter for social participation. This dimension closely resembles
Rowntree’s (1901) idea of absolute poverty where such goods are necessary for
subsistence and physical maintenance. Recent evidence shows increasing trends in the
levels of food insecurity across Europe, mostly due to financial difficulties (Loopstra et
al., 2015; 2016). Food insecurity is shown to have an impact on managing chronic
diseases and mental health problems (Gundersen and Ziliak, 2015; Pryor et al., 2016),
and school children’s academic performance and social skills (Jyoti et al., 2005).
Similarly, lack of appropriate clothing is essential for keeping physical health, but also
as a social status symbol, has implications for social participation in the context of work,
friendship and social activities, especially for women and children (Francis, 1992;
Turner-Bowker, 2001). Regarding shelter, the most immediate issue is habitancy.7
Recent evidence from an emerging area of research in the US has shown the high
prevalence of eviction among inner-city poor, especially for black women, which
increases the chances of job loss, family dissolution and mental health problems and
brings about prolonged period of homelessness (Desmond, 2012).8 Also, recent
evidence has shown that having housing arrears is linked to worse health (Clair et al.
2016). Another relevant problem related to housing is fuel poverty, which may result in
deteriorations in physical and mental health (Thomson and Thomas, 2015) and affects
7 Clair et al. (2018) recently proposed a measure of housing precariousness where they define
four dimensions: security, affordability, quality and access to services. The conceptualization
here is very similar except that it excludes access to services dimension as it is difficult to
assess whether such deprivation is related to resource constraints given available data.
8 In Europe, especially after 2008 mortgage crisis, eviction and housing has also become a
significant concern especially for the Southern countries.
Barnett Paper 18-03 Identifying people in poverty
21
everyday practices and social relations (Middlemiss and Gillard, 2015). The last aspect
of housing deprivation is the inadequacy of housing facilities such as space, furniture
and physical building. Reviewing evidence based on some housing interventions,
Thomson & Thomas (2015) show that improvements in domestic space and design
appropriate to needs is linked to improved mental health, reduced risk of chronic
illness, improved relationships and social interactions, and increased opportunities for
leisure and study in the household. All these three housing problems are commonly
linked to lack of money, while also affecting people’s ability to take up employment
(Tunstall et al., 2013). Therefore, relevant components for this dimension are inability to
afford i) food, ii) clothing, iii) habitancy, iv) fuel and v) housing facilities.
Health. This dimension represents the needs related to health for social participation.
Health problems are important barriers to social participation in various ways. People
with poor health (e.g. self-rated bad health, having chronic health or disability problems)
generally have lower employment rates, are more likely to exit employment earlier, have
fewer working hours and lower earnings; also, specifically those with a disability
problem are less likely to have completed upper secondary education and more likely to
have dropped out of school prematurely (OECD, 2010; 2016; van Rijn et al., 2014). A
recent scoping review identifies lower participation of people with disabilities in leisure
activities and schools partly due to financial problems (Hästbacka et al., 2016).
Although, it is hard to identify specific cases of health problems directly caused by lack
of money, a recent review has shown that low income is an important determinant of
health through its material, psycho-social and behavioral effects (Benzeval et al., 2014).
The relevant part here is the material effect which regards the ability to afford health-
Barnett Paper 18-03 Identifying people in poverty
22
promoting goods, avoiding harmful environment and engaging in a way of life that
promotes health.9 Therefore, relevant components of this dimension are inability to
afford i) health care services, ii) health-promoting goods, iii) avoiding harmful
environment, and iv) a healthy diet and living style.
Education. This dimension represents the needs related to education for social
participation. Education is an essential element in various aspects of participation into
society. Formal educational achievement as well as cognitive and non-cognitive skills
are important determinants for many important outcomes such as labor market
participation and health (Conti et al., 2010), health behaviors (Cutler and Lleras-Muney,
2006), and social capital (Helliwell and Putnam, 2007). Access to higher education itself
is even sometimes considered as a component of participation into society (Archer et
al., 2005) and incur extra financial costs not only due to tuition fees but also related to
transport, school lunches, uniform and textbooks, school trips and extracurricular
activities (Bradshaw and Finch, 2002). Beyond formal education, access to information
is instrumental for education and learning for young people (Davies et al., 2015), but
also for adults an important medium for social engagement (Bargh and McKenna,
2004), job search (Kuhn and Mansour, 2014) and access to financial services
(Claessens, 2006). In that respect, components of this dimension are ability to afford i)
formal education, other goods and services that support ii) education (e.g. working
space) and iii) learning of children (e.g. toys, books), and iv) provides access to
information (e.g. internet).
9 The psycho-social effect includes stress of economic scarcity; the behavioral effect considers
the impact of low income context on health behavior, specifically on risky health behavior.
Barnett Paper 18-03 Identifying people in poverty
23
Leisure and social relationships. This dimension represents the needs related to
leisure and social relationship for social participation. Social and physical leisure
activities increase the feelings of social support (Coleman and Iso-Ahola, 1993), and
help to create social networks which can lead to enhanced social capital (Putnam, 2001;
Van Ingen and Van Eijck, 2009) and better health (Smith and Christakis, 2008); while a
lack of them is linked to negative health outcomes, high stress levels and social
isolation (Passias et al., 2017). Therefore, leisure and social activities are essential to
sustain social relationships. Moreover, having a lack of adequate economic resources
has shown to have detrimental effects on relations with friends and relatives, and
resource potential of networks (Mood & Jonsson, 2016; Böhnke & Link, 2017) and on
the ability to participate in leisure activities (Bittman, 2002; Passias et al., 2017). Having
sufficient leisure time is another component which is mainly determined hours of
employment, family responsibilities and gender, but also affordability of leisure time.
Therefore, components of this dimension are inability to (economically) afford i) having
leisure time, ii) leisure activities and iii) social activities.
In Table 2, identified dimensions of poverty and their components are presented. As
informed by the theoretical definition, each need is a constitutive component of poverty,
without any hierarchy among them, thus deprivation in even one of them defines a
poverty experience. For example, not being able to afford food or fuel defines a poverty
experience, since having unmet need for basic goods prevents individuals from
performing their social roles and participating in society. In the following sections, the
aim is to operationalize this conceptualization and construct a multidimensional

Barnett Paper 18-03 Identifying people in poverty
24
deprivation measure of poverty that can capture such poverty to the extent possible
given available data. Data is described in the next section.
Table 2: Identified dimensions of poverty and their components
Dimensions Components
Need for basic goods Inability to afford adequate i) food, ii) clothing, iii) habitancy, iv) fuel and v) housing facilities
Need for health Inability to afford i) health care services, ii) other health-promoting goods, iii) avoiding harmful environment, and iv) a healthy diet and living style
Need for education Inability to afford i) formal education, goods and services that ii) supports education, iii) learning for children, and iv) provide access to information
Need for leisure and social relationships
Inability to afford i) sufficient leisure time, and participating in ii) leisure and iii) social activities
Data
As the main data source for the contemporary poverty studies in the EU, EU-SILC 2009
survey is used. EU-SILC is a comparable microdata on living standards collected across
29 European countries. 2009 wave includes a special material deprivation module. The
main survey includes deprivation indicators collected generally at the household level
(e.g. ability to keep home adequately warm), while in the deprivation module, there are
further questions asked at the individual (e.g. about basic needs and leisure) as well as
child level (answered by the household reference person). Therefore, the items are
Barnett Paper 18-03 Identifying people in poverty
25
collected at three different levels: household, adult and child. The details of the
deprivation indicators are described at Table A1 in Appendix.
The poverty rates are calculated at the individual level. To do this, the items collected at
the household level are distributed to each household member; for the items collected
at the adult level, the household is considered as deprived if one adult is deprived;10 and
for the items collected at the child level, a household is considered deprived if a child is
deprived. Also, some items collected both at the adult and child level (e.g. holiday) are
merged given the procedure explained above. Therefore, if any adult or child is deprived
of a specific item, each member of the household is considered as deprived of this
specific item in the proposed measure.
As shown in Table A2 in Appendix, the rate of missing for each deprivation indicator is
very low (below 0.4%) which in total corresponds to 1.7% of total sample. Although the
rate of missing data varies across countries (e.g. no missing in Cyprus; 4.5% in
Denmark), it is below 5% in all countries (see Table A3 in Appendix). The only
exception is Sweden which has 45% missing rate and hence excluded from analysis.
Also, Malta is excluded due to data problems for the variables used in the validity
analysis (described further in the relevant section). Therefore the analysis includes 27
European countries, excluding Sweden and Malta.
10 This procedure, counting the household as deprived if at least one adult is deprived, is
necessary as for some countries (“register countries”), the information is available only for the
household reference person. On the other hand, Guio et al. (2016) counts households deprived
when at least half of the household is deprived.

Barnett Paper 18-03 Identifying people in poverty
26
Operationalization of the proposed measure
Given the proposed conceptual structure and definition of poverty, operationalization is
mainly an exercise of creating reliable scales for the components of each dimension.
Four distinct need areas are identified showing the necessary conditions for
participating in society and performing social roles. These needs are basic goods,
health, education, and leisure and social relationships. The main issue is to assess
whether each need is met or unmet due to a resource constraint.
In the previous section, components of each dimension are explored, which represent
the conditions of life (goods, services and activities) required to satisfy each need, but
might be lack due to a resource constraint. Having an enforced deprivation in one
component by definition shows an unmet need in the relevant dimension, hence an
experience of poverty. For example, if an individual cannot afford health care, she/he
has unmet needs for health, or is deprived in health dimension, and hence experiences
poverty.
Therefore, the key issue here is to create valid scales for each component. As
explained below, the scales are constructed based on three criteria, namely face,
construct and criterion validity. One important shortcoming is that, due to data
limitations, only some of the identified components are possible to represent with
available deprivation items. Still, the proposed measure is an improvement to existing
measures in terms its comprehensiveness.
Barnett Paper 18-03 Identifying people in poverty
27
Creating scales for each component
The scales are created using three criteria. The first is face validity, mainly a subjective
judgement on the extent to which a scale represents the phenomenon that it purports to
measure. According to this criterion, the selected items should represent related
components. Given the proposed definition, one important feature of the selected items
should be representing resource constraints rather than choice. Therefore, the main test
for this criterion is whether selected items show deprivation due to resource constraints.
The second is construct validity, empirically examines the extent to which a scale
captures what it intends to measure. For this exercise, three validity indicators are used
(see Table 3; first three rows show the main indices used, while the latter rows show the
original variables out of which the three indices are derived):
i) ability to make ends meet, which is a widely used validity indicator in poverty
measurement scholarship, represent individuals’ own assessment about the
adequacy of their resources against their needs – originally a six category
measure from “with great difficulty” to “very easily”, this indicator is used in a binary
form, reflecting those who experience at least some difficulties making ends meet;
ii) an income threshold, 120% of median disposable equivalized income, which is
sometimes used as a threshold for high income;
iii) a financial strain index, very similar to the one proposed by Whelan and Maitre
(2013), which includes five indicators of self-assessed financial conditions (with a
Cronbach alpha of 0.71), but used in in a binary form with a threshold of zero
(reporting at least one deprived financial condition).

Barnett Paper 18-03 Identifying people in poverty
28
Table 3: Descriptives for the validity indices for construct validity tests
Variable Mean SD Min Max N
Main validity indices
At least some difficulties making ends meet 0.61 0.49 0 1 515992
HH income below 120% median 0.65 0.48 0 1 515992
Financial strain (1+) 0.55 0.50 0 1 515992
Original variables out of which two validity indices are constructed
Ability to make ends meet 3.20 1.30 1 6 515992
Financial strain index 1.71 1.27 0 5 515992
Having difficulty making ends meet 0.29 0.46 0 1 515992
Inability to pay unexpected expenses 0.37 0.48 0 1 515992
Having structural arrears 0.12 0.33 0 1 515992
Feeling heavy burden of housing cost 0.33 0.47 0 1 515992
Feeling heavy burden of debt 0.10 0.30 0 1 515992
For a scale to pass this test, a significant majority of those identified as deprived by the
scale in the EU is expected to i) report at least some difficulties making ends meet, ii)
have income below 120% of median income, and iii) report at least one financial strain
condition. The level of “significant majority” is chosen as ideally 90% or minimum 80%.
This choice is relatively arbitrary yet gives only limited margin of error, which can be
acceptable given data limitations.
The third is criterion validity, an empirical examination of certain abilities that are
expected to be reflected by a scale. The main test for this criterion is that deprivation in
a component cannot be experienced by the majority of a population. Deprivation
represents an observable disadvantage relative to society an individual belongs

Barnett Paper 18-03 Identifying people in poverty
29
(Townsend, 1987). Then, by definition, the rate of deprivation for a specific component
should not exceed half of the population.
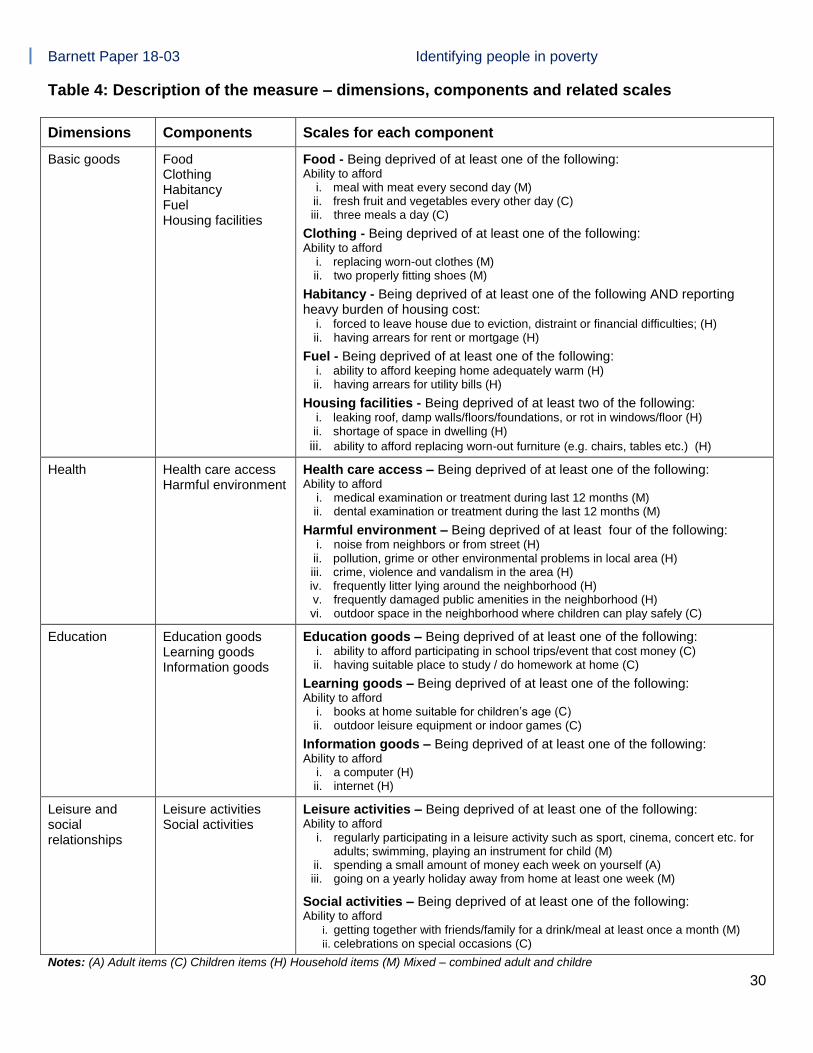
Based on these three criteria, the selected items and constructed scales are presented
in Table 4. Regarding face validity, the first issue is that there are no suitable indicators
for some of the identified components (e.g. healthy diet and living style) which possibly
cause some underestimation. Secondly, for most of the components, number of
relevant indicators is limited possibly causing under or over estimation. Thirdly, some
items do not represent resource constraints, for example in harmful environment,
habitancy and housing facilities scales, hence might represent preferences which also
possibly cause some overestimation.11 Regarding construct validity, for all scales except
harmful environment, at least 80% (and commonly above 85%) of those identified as
deprived report at least some difficulties making ends meet, have income above 120%
of median, and reports at least one financial strain (see Appendix, Table A4). Regarding
criterion validity, two problems are existing which possibly show some overestimation
(see Appendix, Table A5). First, deprivation rates exceed 50% for leisure activities in
Bulgaria, Estonia, Greece, Hungary, Latvia, Poland, Portugal, Romania and Slovakia,
and for social activities in Bulgaria and Romania. Secondly, in Bulgaria, around 70% is
deprived in fuel and clothing components.
The problems related to face and criterion validity possibly reflect some error in
measurement related to aforementioned issues in deprivation data:
11 To partially overcome this problem, either scales are supported by another subjective variable
specifically related to resource constraints (e.g. reporting heavy burden of housing cost), or a
threshold is applied on the number of deprivations to be counted as deprived for a component
(e.g. harmful environment scale).
Barnett Paper 18-03 Identifying people in poverty
30
Table 4: Description of the measure – dimensions, components and related scales
Dimensions Components Scales for each component
Basic goods Food Clothing Habitancy Fuel Housing facilities
Food - Being deprived of at least one of the following: Ability to afford
i. meal with meat every second day (M) ii. fresh fruit and vegetables every other day (C) iii. three meals a day (C)
Clothing - Being deprived of at least one of the following: Ability to afford
i. replacing worn-out clothes (M) ii. two properly fitting shoes (M)
Habitancy - Being deprived of at least one of the following AND reporting heavy burden of housing cost:
i. forced to leave house due to eviction, distraint or financial difficulties; (H) ii. having arrears for rent or mortgage (H)
Fuel - Being deprived of at least one of the following: i. ability to afford keeping home adequately warm (H) ii. having arrears for utility bills (H)
Housing facilities - Being deprived of at least two of the following: i. leaking roof, damp walls/floors/foundations, or rot in windows/floor (H) ii. shortage of space in dwelling (H)
iii. ability to afford replacing worn-out furniture (e.g. chairs, tables etc.) (H)
Health Health care access Harmful environment
Health care access – Being deprived of at least one of the following: Ability to afford
i. medical examination or treatment during last 12 months (M) ii. dental examination or treatment during the last 12 months (M)
Harmful environment – Being deprived of at least four of the following: i. noise from neighbors or from street (H) ii. pollution, grime or other environmental problems in local area (H) iii. crime, violence and vandalism in the area (H) iv. frequently litter lying around the neighborhood (H) v. frequently damaged public amenities in the neighborhood (H) vi. outdoor space in the neighborhood where children can play safely (C)
Education Education goods Learning goods Information goods
Education goods – Being deprived of at least one of the following: i. ability to afford participating in school trips/event that cost money (C) ii. having suitable place to study / do homework at home (C)
Learning goods – Being deprived of at least one of the following: Ability to afford
i. books at home suitable for children’s age (C) ii. outdoor leisure equipment or indoor games (C)
Information goods – Being deprived of at least one of the following: Ability to afford
i. a computer (H) ii. internet (H)
Leisure and social relationships
Leisure activities Social activities
Leisure activities – Being deprived of at least one of the following: Ability to afford
i. regularly participating in a leisure activity such as sport, cinema, concert etc. for adults; swimming, playing an instrument for child (M)
ii. spending a small amount of money each week on yourself (A) iii. going on a yearly holiday away from home at least one week (M)
Social activities – Being deprived of at least one of the following: Ability to afford
i. getting together with friends/family for a drink/meal at least once a month (M) ii. celebrations on special occasions (C)
Notes: (A) Adult items (C) Children items (H) Household items (M) Mixed – combined adult and childre

Barnett Paper 18-03 Identifying people in poverty
31
i) limited number of relevant indicators cause some mismeasurement; ii) relationships
of some indicators to poverty is rather weak in some countries compared to others
(cross-cultural equivalence); iii) some items include error due to misunderstandings in
deprivation or affordability questions (reporting error); and iv) some items reflect
preferences not constraints (behavioral choice).
How to mitigate error in measurement? A dual adjustment strategy
In order to address the data problems described in Table 1 such as limited extent of
data, cross-cultural equivalence, behavioral choice and reporting error, a dual
adjustment strategy is applied here. The idea is to use both an income poverty measure
and a self-assessed financial strain measure as criteria to correct for possible error and
reach more accurate identification of poverty.
In the existing literature, alternative strategies have been applied to correct for possible
error in measurement. The most common is using a non-zero threshold for each scale.
For example, Guio et al. (2016) apply an ad hoc non-zero threshold on their scale
mainly to limit the measurement error (e.g. those who are deprived of one to four items
are not considered as in poverty). This is an ideal strategy when reliable scales with
adequate number of items can be constructed. However, this strategy is not suitable
here mainly due to the limited number of items available to construct each scale. For
example, a non-zero threshold in the leisure activities scale, while removing some Type
I error (especially for less affluent countries), might include some Type II error
(especially for more affluent countries). Moreover, even in scales with adequate number
Barnett Paper 18-03 Identifying people in poverty
32
of items, a non-zero threshold might not be empirically supported as argued by Bedük
(2018b). 12
Another strategy is using a non-zero threshold at the dimensional level as exemplified in
the dual cut-off method of Alkire and Foster (2011) and consistent poverty approach of
Maitre et al. (2013). The idea here is that deprivation in a single dimension may
represent something other than poverty, and to limit measurement error a threshold can
be applied on the number of deprived dimensions. This strategy is also not suitable here
mainly because, based on applied theoretical definition, being deprived in one
dimension amounts to a poverty experience, hence a non-zero threshold at the
dimensional level would exclude some poverty cases. A similar conceptual view has
also been advocated by Bourguignon and Chakravarty (2003): multidimensionality of
poverty means that having a shortfall in even one dimension amounts to a poverty
experience; hence, a truly multidimensional measure can only be constructed following
a union approach, in other words, with a zero threshold at the dimensional level. A non-
zero threshold at the dimensional level, while excluding some Type I error, would
include some Type II error. In other words, a non-zero threshold at the dimensional
level, as a more restrictive criterion, would identify only more severe poverty cases.
Indeed, Alkire and Foster (2011) argue that using a threshold at the dimensional level
helps to target “the most extensively deprived”, and Maitre et al. (2013: 22) consider
their consistent poverty measure primarily for “distinguishing a sub-set within that
12 A non-zero threshold is applied here for some scales (e.g. harmful environment) as items in
these scales do not reflect resource constraints.

Barnett Paper 18-03 Identifying people in poverty
33
[target] population which merits priority in framing anti-poverty policy”.13 Yet, the aim
here is not to distinguish the most deprived or most disadvantaged but to identify
poverty. Moreover, as recently argued by Datt (2018), applying a threshold at the
dimensional level does not provide a consistent strategy to limit measurement error, as
the nature of error might be discontinuous and thresholds are applied usually in an ad
hoc manner.
The last strategy applied in the existing literature to limit measurement error is excluding
those with high incomes (e.g. Mack and Lansley, 1985; 2015). This strategy is
problematic as income measures do not account for non-income resources, savings
and debt, and heterogeneity of needs (e.g. health care, child care, social care,
education, transportation etc.). Thus, it is hard to identify and justify a threshold that
separate those with high incomes whom are considered as non-poor.
An alternative approach can be using both an income and a self-assessed financial
strain measure. Such adjustment strategy would avoid problems of using only objective
income measures since the subjective financial strain measure by definition includes an
evaluation of overall resources and needs by the respondent. Therefore, by using an
additional self-assessed financial strain measure, one can also account for variation in
non-income resources and needs across individuals and households. Using dual
criteria, one objective and one subjective measure of financial situation, the aim here is
to reach a more robust adjustment strategy than its previous alternatives.
13 Still a consistent poverty measure with the proposed index is constructed and compared to
the consistent poverty measure of Maitre et al. (2013) – see conclusion and Supplementary
Material.

Barnett Paper 18-03 Identifying people in poverty
34
The proposed adjustment strategy is a two-step process, first, excludes those who are
wrongly identified as in poverty (Type I error), and secondly, includes those who are
missed by the deprivation measure (Type II error). In the first step, a household is
considered as non-poor if it does not experience income poverty (60% of median) and
does not report significant financial strain (reporting at most two out of five item)
(exclusion adjustment). Similarly, in the second step, a household is considered as poor
if it suffers from income poverty and significant financial strain (exclusion adjustment).
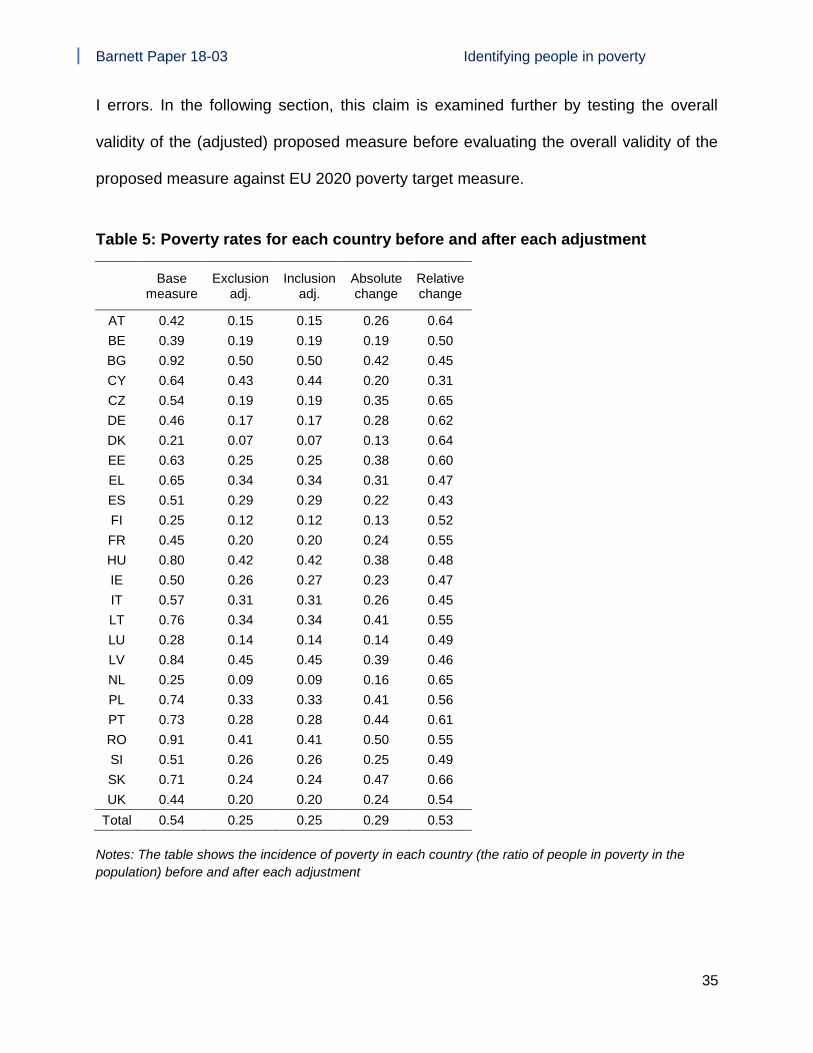
Poverty rates for each country before and after each adjustment are summarized in
Table 5. The first exclusion adjustment removes, in average for the EU, half of those
previously identified by the measure. The amount of removed cases significantly varies
among countries, usually between 30% and 65% in relative terms, yet without any
systematic pattern.14
Despite the significant numbers removed by the first adjustment, the second inclusion
adjustment does not seem to significantly change the numbers. This might show that
the underestimation problems (Type II) such as adaptive preferences and desirability
bias are not significant matters for the proposed measure, while overestimation
problems (Type I) related to cross-cultural equivalence, behavioral choices and
reporting error are important. Nevertheless, most of the Type I error problems related to
criterion validity seem to be resolved after the exclusion adjustment as the deprivation
rate in each component in each country goes below 50% after adjustment (see Table
A6 in Appendix). Therefore, the exclusion adjustment seems to effectively mitigate Type
14 Only in absolute terms, the amount removed by adjustment is higher in countries with higher
initial poverty rate.
Barnett Paper 18-03 Identifying people in poverty
35
I errors. In the following section, this claim is examined further by testing the overall
validity of the (adjusted) proposed measure before evaluating the overall validity of the
proposed measure against EU 2020 poverty target measure.
Table 5: Poverty rates for each country before and after each adjustment
Base
measure Exclusion
adj. Inclusion
adj. Absolute change
Relative change
AT 0.42 0.15 0.15 0.26 0.64
BE 0.39 0.19 0.19 0.19 0.50
BG 0.92 0.50 0.50 0.42 0.45
CY 0.64 0.43 0.44 0.20 0.31
CZ 0.54 0.19 0.19 0.35 0.65
DE 0.46 0.17 0.17 0.28 0.62
DK 0.21 0.07 0.07 0.13 0.64
EE 0.63 0.25 0.25 0.38 0.60
EL 0.65 0.34 0.34 0.31 0.47
ES 0.51 0.29 0.29 0.22 0.43
FI 0.25 0.12 0.12 0.13 0.52
FR 0.45 0.20 0.20 0.24 0.55
HU 0.80 0.42 0.42 0.38 0.48
IE 0.50 0.26 0.27 0.23 0.47
IT 0.57 0.31 0.31 0.26 0.45
LT 0.76 0.34 0.34 0.41 0.55
LU 0.28 0.14 0.14 0.14 0.49
LV 0.84 0.45 0.45 0.39 0.46
NL 0.25 0.09 0.09 0.16 0.65
PL 0.74 0.33 0.33 0.41 0.56
PT 0.73 0.28 0.28 0.44 0.61
RO 0.91 0.41 0.41 0.50 0.55
SI 0.51 0.26 0.26 0.25 0.49
SK 0.71 0.24 0.24 0.47 0.66
UK 0.44 0.20 0.20 0.24 0.54
Total 0.54 0.25 0.25 0.29 0.53
Notes: The table shows the incidence of poverty in each country (the ratio of people in poverty in the
population) before and after each adjustment

Barnett Paper 18-03 Identifying people in poverty
36
Examining the validity of the proposed measure
The validity of the proposed measure is examined relatively against EU 2020 poverty
target measure using a multinomial logistic model. The aim is to see which measure
identifies better the groups that are theoretically and empirically expected to be in
poverty. For example, given the definition of poverty above, we would expect those with
lower resources and higher needs to be more likely to experience poverty. Also, it is
important to consider the country profiles of the groups identified by each measure. As
shown below, despite a significant agreement between the two measures, there is still
substantial amount of people identified only by one measure. The idea is to compare
the group identified only by proposed measure to the group identified only by EU
measure based on their resources and needs.
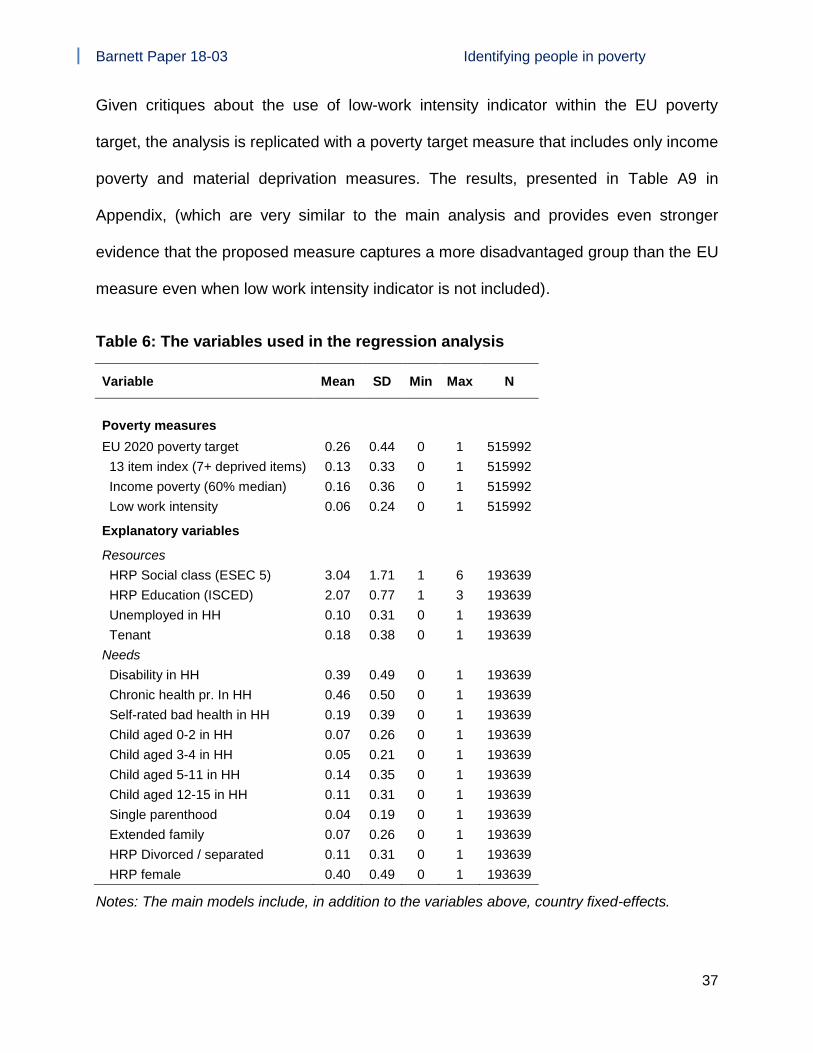
The EU 2020 poverty target measure and explanatory variables used in regression
analyses are presented in Table 6. The EU’s 2020 poverty target measure includes a
material deprivation index, an income poverty and a low work-intensity measure.
Recently a 13-item material deprivation index proposed by Guio et al. (2016) is
endorsed by the EU to replace the old 9-item measure (Atkinson et al., 2017). This new
deprivation index is used here to construct the new EU formal poverty measure. The
income poverty measure is the commonly used relative measure which defines those
with household disposable incomes below 60% of median income as in poverty. The
households with low work intensity are defined as those with working-age members
worked less than 20% of their potential in the previous year. Being identified by either of
these three measures are considered as living in poverty by the EU measure.
Barnett Paper 18-03 Identifying people in poverty
37
Given critiques about the use of low-work intensity indicator within the EU poverty
target, the analysis is replicated with a poverty target measure that includes only income
poverty and material deprivation measures. The results, presented in Table A9 in
Appendix, (which are very similar to the main analysis and provides even stronger
evidence that the proposed measure captures a more disadvantaged group than the EU
measure even when low work intensity indicator is not included).
Table 6: The variables used in the regression analysis
Variable Mean SD Min Max N
Poverty measures
EU 2020 poverty target 0.26 0.44 0 1 515992
13 item index (7+ deprived items) 0.13 0.33 0 1 515992
Income poverty (60% median) 0.16 0.36 0 1 515992
Low work intensity 0.06 0.24 0 1 515992
Explanatory variables
Resources
HRP Social class (ESEC 5) 3.04 1.71 1 6 193639
HRP Education (ISCED) 2.07 0.77 1 3 193639
Unemployed in HH 0.10 0.31 0 1 193639
Tenant 0.18 0.38 0 1 193639
Needs
Disability in HH 0.39 0.49 0 1 193639
Chronic health pr. In HH 0.46 0.50 0 1 193639
Self-rated bad health in HH 0.19 0.39 0 1 193639
Child aged 0-2 in HH 0.07 0.26 0 1 193639
Child aged 3-4 in HH 0.05 0.21 0 1 193639
Child aged 5-11 in HH 0.14 0.35 0 1 193639
Child aged 12-15 in HH 0.11 0.31 0 1 193639
Single parenthood 0.04 0.19 0 1 193639
Extended family 0.07 0.26 0 1 193639
HRP Divorced / separated 0.11 0.31 0 1 193639
HRP female 0.40 0.49 0 1 193639
Notes: The main models include, in addition to the variables above, country fixed-effects.

Barnett Paper 18-03 Identifying people in poverty
38
The explanatory variables, which can be considered as risk factors, represent either
resources or needs. For example, social class and education are long argued to be
good determinants of long-term command over resources (Hauser & Warren, 1997;
Bollen et al., 2007). Others such as unemployment and tenancy are more immediate
indicators of economic conditions.
Given the model includes these resources variables, variables such as chronic health,
disability or self-reported bad health problem in the household show the effect of having
extra needs and costs for health care, while having children aged 3-4, 5-11, 12-15 in the
household reflect the needs and costs related to child bearing such as those related to
education. These variables represent extra care responsibilities in the household which
might result in limited earning potential especially for women (Beduk, 2017). Other
demographic characteristics such as single parenthood, extended family and marital
status proxy experiences of specific life events, where the balance of resources and
needs tend to be difficult to sustain. Country fixed effects are also included to examine
country profiles captured by each measure. Age and gender of the household reference
person are included as controls.
As shown in Table A7 in Appendix, missing data for poverty measures are very low
(below 0.4%) yet with the exception of 13-item Guio index and EU 2020 poverty target
having around 1.7% of the total population, which corresponds to missing data in
deprivation indicators, hence excluded from the analysis. As shown in Table A8 in
Appendix, missing rate for explanatory variables are also very low, where it is highest
for education (2%) and social class (1.3%); still in total, the missing rate for all variables
corresponds to 3.6% of the household sample. The missing in social class is mainly due
Barnett Paper 18-03 Identifying people in poverty
39
to Malta, where the missing rate is %21. Also, in Malta, the social class variable has a
coding problem as the country seems to have only salariat, intermediate employee and
never worked. Therefore, Malta is also excluded from the analysis.
The unit of analysis for the regression analyses is household using information of
household reference person (HRP) (similar to previous analogous analyses, for
example by Whelan & Maître (2012)). This is because most of the deprivation indicators
are collected at the household level, which in an individual level analysis might cause
clustering. Also, using HRP allows to include individual level factors such as social class
and education. The analysis is run for the whole sample with country fixed effects.
Comparing to EU 2020 poverty target
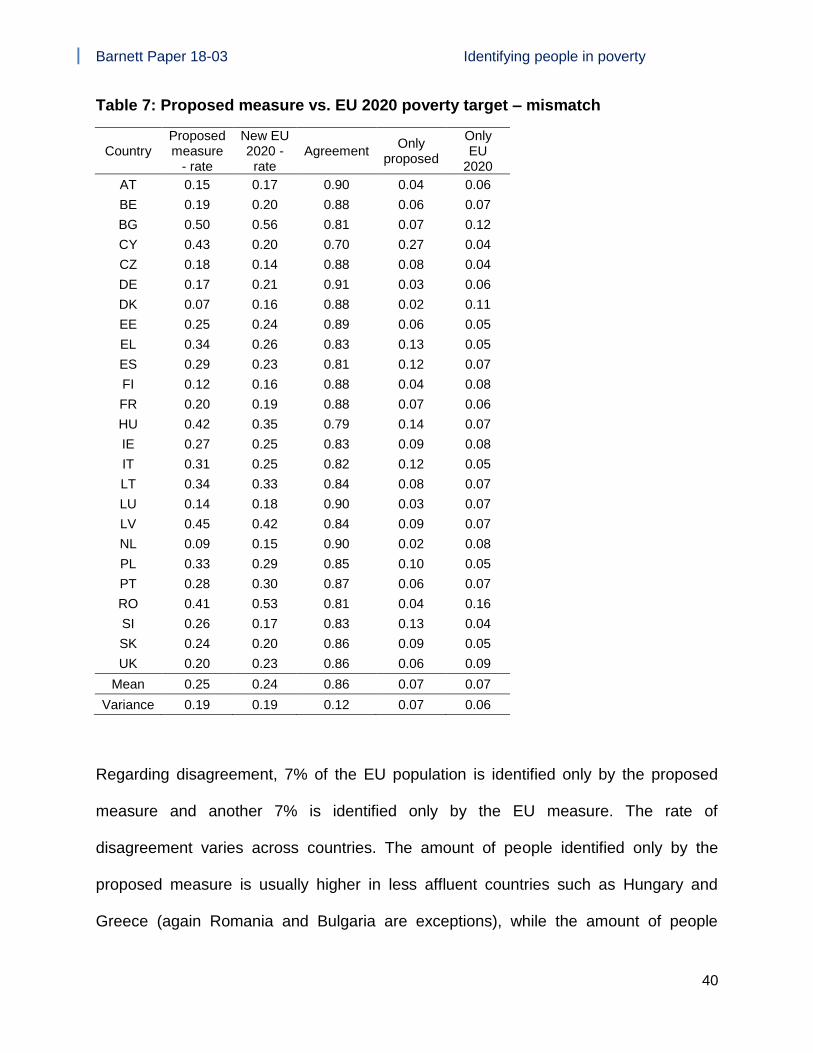
The results for the proposed multidimensional deprivation measure and the EU 2020
poverty target measure are presented at Table 7. The average rate for the proposed
measure is 25% and for the EU 2020 target is 24%. The variances and ranges are
similar in both measures. Compared to the new EU 2020 measure, the proposed
poverty measure has usually lower rates in more affluent countries such as Denmark,
Finland and Netherlands, and similar or higher rates in less affluent countries such as
Hungary and Latvia (except Bulgaria and Romania).
The agreement between the two measures is very high, in average around 86%. The
amount of agreement varies across countries with a relatively low variance – lowest in
Cyprus with 70% and highest in Germany with 91%. The rate of agreement seems to be
lower for less affluent countries, possibly due to the fact that deprivation are much more
widespread in less affluent countries.
Barnett Paper 18-03 Identifying people in poverty
40
Table 7: Proposed measure vs. EU 2020 poverty target – mismatch
Country Proposed measure
- rate
New EU 2020 - rate
Agreement Only
proposed
Only EU
2020
AT 0.15 0.17 0.90 0.04 0.06
BE 0.19 0.20 0.88 0.06 0.07
BG 0.50 0.56 0.81 0.07 0.12
CY 0.43 0.20 0.70 0.27 0.04
CZ 0.18 0.14 0.88 0.08 0.04
DE 0.17 0.21 0.91 0.03 0.06
DK 0.07 0.16 0.88 0.02 0.11
EE 0.25 0.24 0.89 0.06 0.05
EL 0.34 0.26 0.83 0.13 0.05
ES 0.29 0.23 0.81 0.12 0.07
FI 0.12 0.16 0.88 0.04 0.08
FR 0.20 0.19 0.88 0.07 0.06
HU 0.42 0.35 0.79 0.14 0.07
IE 0.27 0.25 0.83 0.09 0.08
IT 0.31 0.25 0.82 0.12 0.05
LT 0.34 0.33 0.84 0.08 0.07
LU 0.14 0.18 0.90 0.03 0.07
LV 0.45 0.42 0.84 0.09 0.07
NL 0.09 0.15 0.90 0.02 0.08
PL 0.33 0.29 0.85 0.10 0.05
PT 0.28 0.30 0.87 0.06 0.07
RO 0.41 0.53 0.81 0.04 0.16
SI 0.26 0.17 0.83 0.13 0.04
SK 0.24 0.20 0.86 0.09 0.05
UK 0.20 0.23 0.86 0.06 0.09
Mean 0.25 0.24 0.86 0.07 0.07
Variance 0.19 0.19 0.12 0.07 0.06
Regarding disagreement, 7% of the EU population is identified only by the proposed
measure and another 7% is identified only by the EU measure. The rate of
disagreement varies across countries. The amount of people identified only by the
proposed measure is usually higher in less affluent countries such as Hungary and
Greece (again Romania and Bulgaria are exceptions), while the amount of people

Barnett Paper 18-03 Identifying people in poverty
41
identified only by the EU measure are significantly higher in more affluent countries
such as Denmark, Finland, Luxembourg.
The question is which measure identifies more accurately the groups that are expected
to be in poverty given their resources and needs. To examine this, a multinomial logit
model is applied. The dependent variable is constructed based on four categories: i) not
identified by both measures (none), ii) identified both by the proposed and the EU
measure (both); iii) identified only by the proposed measure (only deprived), iv)
identified only by the EU measure (only EU). The base outcome category is chosen as
those identified only by the EU measure. The idea is to compare the profiles of those
identified only by the EU measure to those identified only by the deprivation measure
based on the risk factors. The results for main explanatory variables are presented in
Table 8. The coefficients show relative risk ratios.
In the first column, the comparison is between those identified only by the EU measure
and those identified by none. Considering the significance of coefficients, the group
captured only by EU measure is significantly different than those identified by none. As
would be expected, those identified only by the EU measure in general tend to have
lower resources and higher needs compared to those identified by none. For example,
those not identified are significantly less likely to have lower social classes and
education, and to have health problems in the household. Yet there are two interesting
results. First, for those who have at least a child younger than twelve and those who
have at least one member with a chronic health problem in the household are equally
likely to be identified only by the EU measure or identified by none. Secondly, those

Barnett Paper 18-03 Identifying people in poverty
42
living extended family households are more likely to be not identified by both measures
than being identified only by the EU measure.
Table 8: Comparing the proposed measure and the EU 2020 poverty target measure based on identified risk factors – relative risk ratios
Multinomial logit / Base outcome = New EU 2020 only
None Both Proposed only
Resource indicators
HRP Social class (ref=Salariat)
Intermediate 0.888* 1.381*** 1.384***
Small self-emp. 0.387*** 2.002*** 0.624***
Non-manual labor 0.670*** 1.765*** 1.285**
Manual labor 0.567*** 1.909*** 1.185**
Never worked 0.202*** 1.525*** 0.389***
HRP Education (ref=Third level)
Upper secondary 0.768*** 1.217*** 1.117
Low second/Primary/Pre 0.588*** 1.731*** 1.100
Unemployed in HH 0.440*** 2.164*** 1.052
Tenant 0.686*** 1.949*** 1.528***
Need indicators
Disability in HH 0.794*** 1.174*** 1.086
Chronic health pr. in HH 0.946 0.982 1.049
Bad subj. health 0.736*** 1.529*** 1.249***
Child aged 0-2 in HH 0.901 1.287** 1.179
Child aged 3-4 in HH 1.059 1.276** 1.240*
Child aged 5-11 in HH 0.986 1.313*** 1.342***
Child aged 12-15 in HH 1.129* 1.634*** 1.488***
Single parent household 0.452*** 1.096 0.809*
Extended family 1.429*** 1.030 1.429***
HRP divorced/separated 0.750*** 1.376*** 1.197**
HRP Female 0.782*** 1.231*** 1.162***
In the second column, the comparison is between those identified only by the EU
measure and those identified by both the EU and the proposed measure. Again as
expected, those identified by both measures tend to have lower resources and higher
Barnett Paper 18-03 Identifying people in poverty
43
needs. For example, they are more likely to be in lower classes, have at least one
unemployed person or a person with health problems or children in the household.
Again, there are two exceptions. Those who have at least one person with a chronic
problem in the household and those who have an extended family household are
equally likely to be identified by only the EU measure or by both measures.
In the third column, the comparison is between those identified only by the EU measure
and those identified only by the proposed measure. In general, the results show that
those identified by the proposed measure are more likely to have lower resources and
higher needs compared to those identified only by the EU measure.
Considering resource indicators, for example social class, those in the intermediate,
non-manual and manual classes (compared to salariat class) are significantly more
likely to be identified only by the proposed measure. On the other hand, small self-
employed and never worked are significantly more likely to be identified only by the EU
measure. This might be related to i) the specific situation of self-employed in terms of
cash income, and ii) the heterogeneous composition of the never worked group which
includes individuals with different economic statuses such as long-term unemployed,
students, domestic workers and other inactive. Both of these might specifically be
captured by the income poverty and low work intensity components of the EU measure.
Regarding other resource indicators, those who are tenant are also significantly more
likely to be captured only by the proposed measure.
The differences are even greater on the needs side. Households with health problems,
with children aged 3-15, those living with extended family, with a divorced or separated,

Barnett Paper 18-03 Identifying people in poverty
44
or a female household reference person are also more likely to be captured only by the
proposed measure. Only single parenthood is more likely to be captured by the EU
compared to the proposed measure.
In addition to resource and need profiles, one can also examine, controlling for the
individual factors, from which countries each measure is more likely to capture people. It
would be expected that more people in poverty live in less affluent than more affluent
countries. In Table 9, the coefficients of the country fixed effects are presented. The
country fixed-effects show the location of groups picked up by each measure compared
to the other.
Starting from the second column, where those identified by both measures are
compared to those identified only by the EU measure, almost in all countries, it is
significantly more likely to be identified by both measures than being identified only by
the EU measure. The only exceptions are Denmark, Finland and Netherlands.
Individuals living in these countries are more likely to be identified by the EU measure
than being identified by both measures.
Similarly, as shown in the third column, the proposed measure is significantly less likely
to identify people from Denmark, Finland, and Netherlands, and significantly more likely
to identify people from less affluent countries compared to the EU measure. For
example, compared to those identified only by the EU measure, those identified only by
the proposed measure are around 8 times more likely to be in Hungary, 7.5 times more
likely to be in Greece, and 4.5 times more likely to be in Bulgaria or Hungary (relative to
being in Austria).

Barnett Paper 18-03 Identifying people in poverty
45
Table 9: Country profiles captured by each measure
Multinomial logit / Base outcome = New EU 2020 only
None Both Proposed only
Country (ref=AT)
BE 0.796** 1.017 1.476**
BG 0.240*** 3.207*** 1.484**
CY 1.116 4.301*** 17.141***
CZ 1.614*** 1.763*** 4.277***
DE 0.911 1.726*** 0.783
DK 0.550*** 0.276*** 0.233***
EE 0.866 2.721*** 2.012***
EL 1.637*** 3.731*** 10.101***
ES 0.999 1.403*** 4.386***
FI 0.681*** 0.553*** 0.759*
FR 1.195* 1.266* 2.203***
HU 0.614*** 2.542*** 4.665***
IE 0.845 1.213 2.502***
IT 1.281*** 2.110*** 6.164***
LT 0.604*** 2.943*** 2.846***
LU 1.059 0.825 0.833
LV 0.588*** 4.139*** 2.856***
NL 0.813* 0.505*** 0.531***
PL 0.977 3.471*** 5.051***
PT 1.119 1.455** 1.869***
RO 0.249*** 2.042*** 0.855
SI 1.051 2.623*** 5.725***
SK 1.183 2.343*** 4.281***
UK 0.556*** 0.868 1.094
In sum, these findings show that i) the proposed measure is more likely to capture more
disadvantaged risk groups who tend to have lower resources and higher individual and
household needs; and, ii) the proposed measure is more likely to capture individuals
from less affluent countries compared to the EU measure. All these results support the
claim that the proposed measure is more likely to identify the people in poverty than the
EU poverty target measure.

Barnett Paper 18-03 Identifying people in poverty
46
Conclusion
This paper focused on constructing a multidimensional deprivation measure of poverty
that can possibly mitigate given available data the problems of existing deprivation
scales. It is argued that deprivation measure can alone be used to assess poverty, both
conceptually and empirically, yet with certain improvements. The paper identified three
conceptual problems of existing measures such as missing dimensions, data-driven
specification and neglecting multidimensionality; and three practical data issues such as
cross-cultural equivalence, behavioral choice and reporting error. These problems, it is
argued, can directly cause measurement errors, either underestimation (Type II error) or
overestimation (Type I error).
The proposed measure has four distinct design features compared to the existing ones.
First, it is a concept-led measure, where measurement design is primarily determined
by the definition of poverty. To do this, a substantial part of the analysis is devoted to
elaborating the meaning of poverty defined within the relative deprivation framework.
Through this conceptual analysis, the dimensions are conceptually derived prior to
measurement drawing on the elaborated definition of poverty and related empirical
evidence. Dimensions of poverty are defined as the needs that are necessary for
performing social roles and social participation, and components of these dimensions
are defined as the conditions of life required to satisfy these needs which might be lack
due to resource constraints.
Secondly, the measure is more comprehensive compared to its existing counterparts
including dimensions such as needs related to health and education. Despite this

Barnett Paper 18-03 Identifying people in poverty
47
improvement, the measure is still limited due to availability of data, since i) other
possible dimensions such as needs related to caring, and personal and political security
are missing, ii) the scales created for the components are restricted and includes only a
small number of indicators, and iii) some components could be not measured given data
limitations (e.g. those related to health-promoting goods, and health diet and living
style).
Thirdly, as Bourguignon & Chakravarty (2003) put it, it is a “truly multidimensional
measure”, where each dimension is evaluated separately and then aggregated with a
zero threshold to reach the total poverty measure. In other words, being deprived in at
least one dimension qualifies an individual for being counted as in poverty (union
approach). This choice is again derived from the theoretical definition of poverty. Not
being able to meet an identified need due to a resource constraint prevents people from
performing their social roles and participating in society. As shown in supplementary
material, evaluating each dimension separately improves the accuracy of measurement
in multiple ways. A sizable group of people is identified only by one dimension whom
are generally missed by the existing deprivation scales due to their unidimensional
design. Also, the groups captured by each dimension have distinct characteristics
reflecting dimension-specific deprivation conditions. For example, those with long-term
health problems are more likely to be captured by the health dimension which accounts
extra costs and needs related to health care. Similarly, those households with children
are more likely to be captured by education dimension which considers enforced
deprivations of educational goods and services. In other words, accounting for

Barnett Paper 18-03 Identifying people in poverty
48
multidimensionality helps to capture different experiences of poverty which is otherwise
neglected when different types of poverty are collapsed into one scale.
Lastly, the measure is adjusted using dual criteria of income poverty and self-assessed
financial strain. This adjustment strategy is applied mainly to correct for possible
underestimation or overestimation due to suspicions about the quality of data, regarding
its equivalence across countries, its robustness to differences in behavioral choices and
reporting error. The results of the adjustment show that the main issue is related to
overestimation of poverty numbers either due to cross-cultural equivalence (e.g.
meaning of holiday for social participation), reporting error (misunderstandings of the
deprivation or affordability questions) or limited extent of data (inadequate number of
items for each type of deprivation).
The validity of the proposed measure is assessed against the EU’s 2020 poverty target
measure using a multinomial logistic model. The results show that the proposed
measure is more likely to capture those with needs (e.g. health problems, and those
related to child bearing, or specific life-event situations such as divorce) and lower
resources (e.g. social class, house ownership), and also much less likely identify people
from affluent countries such as Denmark, Finland and Netherlands, and more likely to
identify people from less affluent countries such as Greece and Hungary compared to
the EU measure.
This measure is designed primarily for the identification of people in poverty yet can be
developed further using Alkire-Foster method to create a poverty index that can account
both incidence and intensity of poverty. Also, if the aim is to focus on the most
Barnett Paper 18-03 Identifying people in poverty
49
disadvantaged, the unadjusted multidimensional measure can be combined with an
income poverty measure to construct a consistent poverty measure. As shown in
Supplementary Material, such a consistent poverty measure, compared to the one
proposed by Whelan et al. (2013), captures an additional group who is predominantly
working class or never worked, and more likely to report difficulties making ends meet
and financial strain compared to the EU average.
In sum, the analysis shows that summary formats using only few key deprivation
indicators are not a panacea to the problems of poverty measurement. We need
concept-led, comprehensive and multidimensional measures. Beyond its better
empirical performance, there are various other advantages of using a concept-led,
comprehensive and multidimensional measure. Such a measure forces us to be more
elaborate about our definition of poverty (i.e. defining dimensions clarifies what is meant
by poverty) and guides the empirical measure which strengthen the link between
concept and measure, hence the empirical validity of measures. Moreover, given its
multidimensional design combined with a union aggregation strategy, the measure is
decomposable to its components, which makes it easier distinguish the sources of
overall poverty (see e.g. Supplementary Material – section S1). Also, having separate
scales for each dimension allow us to focus on specific types of poverty, which makes it
suitable for policy analysis. For example, one could evaluate the extent of food or fuel
poverty and examine its relationship to other types of poverty or overall poverty.
Despite providing some solutions to the proposed problems, the applied adjustment
strategy is ad hoc, and assessing its effectiveness is rather difficult. Further analysis is
required to question the issues related to the validity of deprivation data, especially
Barnett Paper 18-03 Identifying people in poverty
50
regarding overestimation (Type I error) to reach more robust poverty measures
constructed based on deprivation indicators. Especially, more attention on the issues
related to limited extent of deprivation data and cross-cultural equivalence are of utmost
importance.
Barnett Paper 18-03 Identifying people in poverty
51
Acknowledgments
This research was made possible by Barnett Scholarship granted towards my DPhil by
the Department of Social Policy and Intervention, University of Oxford. I owe thanks to
Erzsébet Bukodi, Brian Nolan and Christopher Whelan for their valuable comments on
the draft of the paper.
References
Archer L, Hutchings M and Ross A (2005) Higher education and social class: Issues of
exclusion and inclusion. Routledge.
Atkinson T, Guio AC and Marlier E (2017) Monitoring social inclusion in Europe.
Eurostat Statistical.
Bargh JA and McKenna KYA (2004) The Internet and social life. Annu. Rev. Psychol.,
Annual Reviews 55: 573–590.
Bedük, S. (2017). Measuring poverty in the EU: Investigating and improving the
empirical validity in deprivation scales of poverty (PhD thesis). University of Oxford.
Bedük, S. (2018a). Missing the Unhealthy? Examining Empirical Validity of Material
Deprivation Indices (MDIs) Using a Partial Criterion Variable. Social indicators
research, 135(1), 91-115.
Bedük, S. (2018b). Understanding Material Deprivation for 25 EU Countries: Risk and
Level Perspectives, and Distinctiveness of Zeros. European Sociological
Review, 34(2), 121-137.
Benzeval M, Bond L, Campbell M, et al. (2014) How does money influence health?
Joseph Rowntree Foundation.

Barnett Paper 18-03 Identifying people in poverty
52
Berthoud R and Bryan M (2011) Income, deprivation and poverty: a longitudinal
analysis. Journal of Social Policy 40(01): 135–156.
Berthoud R, Blekesaune M and Hancock R (2006) Are Poor Pensioners Deprived?.
Department for Work and Pensions Report no. 364.
Bickel G, Nord M, Price C, et al. (2000) Guide to measuring household food security.
Revised.
Bittman M (2002) Social Participation and Family Welfare: The Money and Time Costs
of Leisure in Australia. Social Policy & Administration, Blackwell Publishers Ltd
36(4): 408–425. Available from: http://dx.doi.org/10.1111/1467-9515.t01-1-00262.
Böhnke P and Link S (2017) Poverty and the Dynamics of Social Networks: An Analysis
of German Panel Data. European Sociological Review 33(4): 615–632. Available
from: http://dx.doi.org/10.1093/esr/jcx063.
Bollen KA, Glanville JL and Stecklov G (2007) Socio-economic status, permanent
income, and fertility: A latent-variable approach. Population studies, Taylor &
Francis 61(1): 15–34.
Bourguignon F and Chakravarty SR (2003) The measurement of multidimensional
poverty. Journal of Economic inequality, Springer 1(1): 25–49.
Bradshaw J and Finch N (2002) A comparison of child benefit packages in 22 countries.
Corporate Document Services.
Breunig R and McKibbin R (2011) The effect of survey design on household reporting of
financial difficulty. Journal of the Royal Statistical Society: Series A (Statistics in
Society), Blackwell Publishing Ltd 174(4): 991–1005. Available from:
http://dx.doi.org/10.1111/j.1467-985X.2011.00696.x.

Barnett Paper 18-03 Identifying people in poverty
53
Claessens S (2006) Access to financial services: A review of the issues and public
policy objectives. The World Bank Research Observer, Oxford University Press
21(2): 207–240.
Clair A, Reeves A, Loopstra R, McKee M, Dorling D, & Stuckler D (2016) The impact of
the housing crisis on self-reported health in Europe: multilevel longitudinal
modelling of 27 EU countries. The European Journal of Public Health, 26(5), 788-
793.
Clair, A., Reeves, A., McKee, M., & Stuckler, D. (2018). Constructing a housing
precariousness measure for Europe. Journal of European Social Policy,
https://doi.org/10.1177/0958928718768334
Coleman D and Iso-Ahola SE (1993) Leisure and health: The role of social support and
self-determination. Journal of leisure research, National Recreation and Park
Association 25(2): 111.
Conti G, Heckman J and Urzua S (2010) The education-health gradient. The American
economic review, NIH Public Access 100(2): 234.
Copeland P and Daly M (2012) Varieties of poverty reduction: Inserting the poverty and
social exclusion target into Europe 2020 1. Journal of European Social Policy,
SAGE Publications Sage UK: London, England 22(3): 273–287.
Crettaz E and Suter C (2013) The impact of adaptive preferences on subjective
indicators: An analysis of poverty indicators. Social Indicators Research, Springer
114(1): 139–152.
Cutler DM and Lleras-Muney A (2006) Education and health: evaluating theories and
evidence. National bureau of economic research.

Barnett Paper 18-03 Identifying people in poverty
54
Datt G (2018) Distribution-sensitive multidimensional poverty measures. The World
Bank.
Davies C, Coleman J and Livingstone S (2015) Digital technologies in the lives of young
people. Routledge.
Decerf B, Van den Bosch K and Goedemé T (2017) A new measure of income poverty
for Europe. Université catholique de Louvain, Center for Operations Research and
Econometrics (CORE).
Desmond M (2012) Eviction and the reproduction of urban poverty. American Journal of
Sociology, University of Chicago Press Chicago, IL 118(1): 88–133.
Development O for EC and (2010) Sickness, Disability and Work: Breaking the Barriers:
A Synthesis of Findings across OECD Countries. OECD Publishing.
Doyal L and Gough I (1984) A theory of human needs. Critical Social Policy 4(10): 6–
38. Available from: http://csp.sagepub.com/cgi/doi/10.1177/026101838400401002
(accessed 20 October 2014).
Francis SK (1992) Effect of Perceived Clothing Deprivation on High School Students’
Social Participation. Clothing and Textiles Research Journal, SAGE Publications
Inc 10(2): 29–33. Available from: http://dx.doi.org/10.1177/0887302X9201000205.
Gábos A and Goedemé T (2016) The Europe 2020 social inclusion indicators: main
conclusions of the ImPRovE project on validity, methodological robustness and
interrelationships. Herman Deleeck Centre for Social Policy, University of Antwerp.
Goedeme T, Penne T, Hufkens T, et al. (2017) What Does It Mean To Live on the
Poverty Threshold? Lessons From Reference Budgets.
Goedemé T and Rottiers S (2011) Poverty in the enlarged European Union. A
Barnett Paper 18-03 Identifying people in poverty
55
discussion about definitions and reference groups. Sociology Compass, Wiley
Online Library 5(1): 77–91.
Gordon D, Pantazis C and Townsend P (2000) Absolute and overall poverty: a
European history and proposal for measurement. In: Gordon D and Townsend P
(eds), Breadline Europe: The Measurement of Poverty, pp. 79–105.
Guio A-C, Marlier E, Gordon D, et al. (2016) Improving the measurement of material
deprivation at the European Union level. Journal of European Social Policy 26(3):
219–333.
Gundersen C and Ribar D (2011) Food insecurity and insufficiency at low levels of food
expenditures. Review of Income and Wealth, Wiley Online Library 57(4): 704–726.
Gundersen C and Ziliak JP (2015) Food insecurity and health outcomes. Health affairs,
Health Affairs 34(11): 1830–1839.
Halleröd B (2006a) Sour Grapes: Relative Deprivation, Adaptive Preferences and the
Measurement of Poverty. Journal of Social Policy 35(03): 371. Available from:
http://www.journals.cambridge.org/abstract_S0047279406009834.
Halleröd B (2006b) Sour Grapes: Relative Deprivation, Adaptive Preferences and the
Measurement of Poverty. Journal of Social Policy 35(03): 371. Available from:
http://www.journals.cambridge.org/abstract_S0047279406009834 (accessed 20
October 2014).
Hästbacka E, Nygård M and Nyqvist F (2016) Barriers and facilitators to societal
participation of people with disabilities: A scoping review of studies concerning
European countries. ALTER-European Journal of Disability Research, Elsevier
10(3): 201–220.
Barnett Paper 18-03 Identifying people in poverty
56
Hauser RM and Warren JR (1997) 4. Socioeconomic Indexes for Occupations: A
Review, Update, and Critique. Sociological methodology, SAGE Publications Sage
CA: Los Angeles, CA 27(1): 177–298.
Helliwell JF and Putnam RD (2007) Education and social capital. Eastern Economic
Journal, Springer 33(1): 1–19.
Hick R (2013) Poverty, Preference or Pensioners? Measuring Material Deprivation in
the UK*. Fiscal Studies, Blackwell Publishing Ltd 34(1): 31–54. Available from:
http://dx.doi.org/10.1111/j.1475-5890.2013.00176.x.
Hick R (2014) On ‘consistent’poverty. Social indicators research 118(3): 1087–1102.
Hildebrand VA, Alperin P, Noel M, et al. (2017) Measuring and accounting for the
deprivation gap of Portuguese immigrants in Luxembourg. Review of Income and
Wealth, Wiley Online Library 63(2): 288–309.
Jyoti DF, Frongillo EA and Jones SJ (2005) Food insecurity affects school children’s
academic performance, weight gain, and social skills. The Journal of nutrition, Am
Soc Nutrition 135(12): 2831–2839.
Kautz T, Heckman JJ, Diris R, et al. (2014) Fostering and measuring skills: Improving
cognitive and non-cognitive skills to promote lifetime success. National Bureau of
Economic Research.
Kis AB, Özdemir E and Ward T (2015) Micro and Macro Drivers of Material Deprivation
Rates.
Kuhn P and Mansour H (2014) Is Internet job search still ineffective? The Economic
Journal, Wiley Online Library 124(581): 1213–1233.
Lansley S and Mack J (2015) Breadline Britain : the rise of mass poverty. London:

Barnett Paper 18-03 Identifying people in poverty
57
Oneworld.
Lelkes O, & Gasior K (2018) Income Poverty in the EU: What Do We Actually Measure?
Empirical Evidence on Choices, Underlying Assumptions and Implications (Based
on EU-SILC 2005–2014). In Reducing Inequalities (pp. 75-95). Palgrave Macmillan,
Cham.
Lister R (1990) The exclusive society citizenship and the poor. Child poverty action
Group.
Lister R (2004) Poverty: key concepts. Cambridge: Polity.
Loopstra R and Tarasuk V (2012) The Relationship between Food Banks and
Household Food Insecurity among Low-Income Toronto Families. Canadian Public
Policy / Analyse de Politiques, [University of Toronto Press, Canadian Public
Policy] 38(4): 497–514. Available from: http://www.jstor.org/stable/41756766.
Loopstra R, Reeves A and Stuckler D (2015) Rising food insecurity in Europe. The
Lancet, Elsevier 385(9982): 2041.
Loopstra R, Reeves A, McKee M, et al. (2016) Food insecurity and social protection in
Europe: quasi-natural experiment of Europe’s great recessions 2004–2012.
Preventive medicine, Academic Press 89: 44–50.
Mack J and Lansley S (1985) Poor Britain. G. Allen & Unwin.
Maître B, Nolan B and Whelan C (2013) GINI DP 79: A Critical Evaluation of the EU
2020 Poverty and Social Exclusion Target: An Analysis of EU-SILC 2009. AIAS,
Amsterdam Institute for Advanced Labour Studies.
McKay S (2004) Poverty or preference: what do ‘consensual deprivation indicators’
really mean? Fiscal Studies, The Institute for Fiscal Studies 25(2): 201–223.
Barnett Paper 18-03 Identifying people in poverty
58
Available from: http://dx.doi.org/10.1111/j.1475-5890.2004.tb00102.x.
McKnight A (2013) Measuring material deprivation over the economic crisis: does a re-
evaluation of ‘need’affect measures of material deprivation. GINI policy paper.
Meyer BD and Mittag N (2015) Using Linked Survey and Administrative Data to Better
Measure Income: Implications for Poverty, Program Effectiveness and Holes in the
Safety Net. National Bureau of Economic Research Working Paper Series No.
21676. Available from: http://www.nber.org/papers/w21676.
Meyer BD, Mok WKC and Sullivan JX (2009) The Under-Reporting of Transfers in
Household Surveys: Its Nature and Consequences. National Bureau of Economic
Research Working Paper Series No. 15181. Available from:
http://www.nber.org/papers/w15181.
Middlemiss L and Gillard R (2015) Fuel poverty from the bottom-up: Characterising
household energy vulnerability through the lived experience of the fuel poor.
Energy Research & Social Science 6: 146–154. Available from:
http://www.sciencedirect.com/science/article/pii/S2214629615000213.
Mood C and Jonsson JO (2016) The social consequences of poverty: an empirical test
on longitudinal data. Social indicators research, Springer 127(2): 633–652.
Nolan B and Whelan CT (2007) On the multidimensionality of poverty and social
exclusion. Inequality and poverty re-examined (Part II): 146–165.
Nolan B and Whelan CT (2011) Poverty and deprivation in Europe. OUP Catalogue,
Oxford University Press.
OECD (2016) Health at a glance : Europe 2016 : state of health in the EU cycle. Health
at a glance, 2016, Paris: Paris : OECD Publishing.
Barnett Paper 18-03 Identifying people in poverty
59
Passias EJ, Sayer L and Pepin JR (2017) Who Experiences Leisure Deficits? Mothers’
Marital Status and Leisure Time. Journal of Marriage and Family, Wiley
Subscription Services, Inc. 79(4): 1001–1022. Available from:
http://dx.doi.org/10.1111/jomf.12365.
Penne T, Parcerisas IC, Mäkinen L, et al. (2016) Can reference budgets be used as a
poverty line. ImPRovE WP (16/05).
Pryor L, Lioret S, van der Waerden J, et al. (2016) Food insecurity and mental health
problems among a community sample of young adults. Social Psychiatry and
Psychiatric Epidemiology 51(8): 1073–1081. Available from:
http://dx.doi.org/10.1007/s00127-016-1249-9.
Putnam RD (2001) Bowling alone: The collapse and revival of American community.
Simon and Schuster.
Ravallion M (1996) Issues in measuring and modeling poverty. World Bank Policy
Research Working Paper. Available from: https://ssrn.com/abstract=636124.
Sen A (1983) Poor, relatively speaking. Oxford economic papers, JSTOR 35(2): 153–
169.
Short K (2011) The research supplemental poverty measure: 2010. Current Population
Reports. Available from: http://www.census.gov/prod/2011pubs/p60-241.
Siminski P and Yerokhin O (2012) Is the Age Gradient in Self Reported Material
Hardship Explained By Resources, Needs, Behaviors, or Reporting Bias? Review
of Income and Wealth, Wiley Online Library 58(4): 715–741.
Smith KP and Christakis NA (2008) Social networks and health. Annu. Rev. Sociol,
Annual Reviews 34: 405–429.

Barnett Paper 18-03 Identifying people in poverty
60
Thomson H and Thomas S (2015) Developing empirically supported theories of change
for housing investment and health. Social Science & Medicine 124: 205–214.
Available from:
http://www.sciencedirect.com/science/article/pii/S0277953614007758.
Townsend P (1962) The meaning of poverty. The British Journal of Sociology, JSTOR
13(3): 210–227.
Townsend P (1979) Poverty in the United Kingdom : a survey of household resources
and standards of living. University of California Press.
Townsend P (1987) Deprivation. Journal of Social Policy 16(02): 125.
Townsend P (1993) The international analysis of poverty. Harvester Wheatsheaf.
Tunstall R, Bevan M, Bradshaw J, et al. (2013) The links between housing and poverty:
an evidence review. JRF Report, York: Joseph Rowntree Foundation.
Turner-Bowker DM (2001) How Can You Pull Yourself up by Your Bootstraps, if You
Don’t Have Boots? Work-Appropriate Clothing for Poor Women. Journal of Social
Issues, Blackwell Publishers Inc. 57(2): 311–322. Available from:
http://dx.doi.org/10.1111/0022-4537.00215.
Van Ingen E and Van Eijck K (2009) Leisure and Social Capital: An Analysis of Types of
Company and Activities. Leisure Sciences, Routledge 31(2): 192–206. Available
from: http://dx.doi.org/10.1080/01490400802686078.
van Rijn RM, Robroek SJW, Brouwer S, et al. (2014) Influence of poor health on exit
from paid employment: a systematic review. Occupational and Environmental
Medicine 71(4): 295 LP – 301. Available from:
http://oem.bmj.com/content/71/4/295.abstract.

Barnett Paper 18-03 Identifying people in poverty
61
Whelan CT and Maître B (2012) Understanding material deprivation: A comparative
European analysis. Research in Social Stratification and Mobility 30(4): 489–503.

Barnett Paper 18-03 Identifying people in poverty
62
Appendix
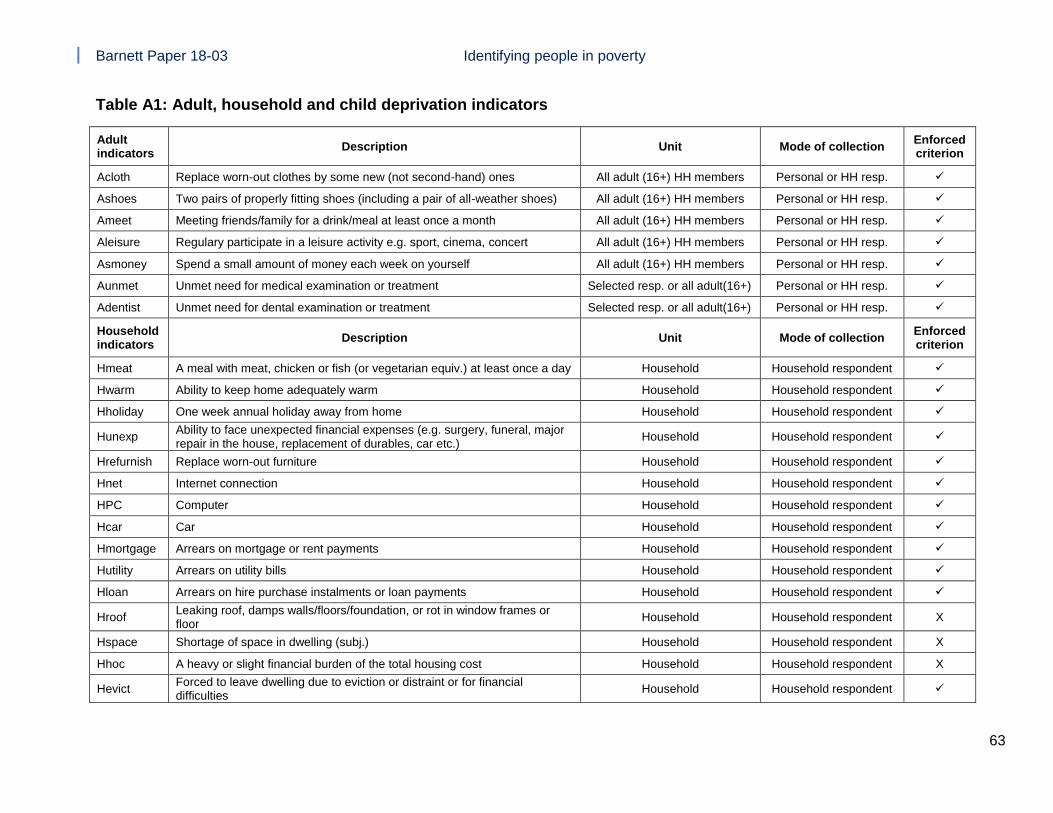
Barnett Paper 18-03 Identifying people in poverty
63
Table A1: Adult, household and child deprivation indicators
Adult indicators
Description Unit Mode of collection Enforced criterion
Acloth Replace worn-out clothes by some new (not second-hand) ones All adult (16+) HH members Personal or HH resp. ✓
Ashoes Two pairs of properly fitting shoes (including a pair of all-weather shoes) All adult (16+) HH members Personal or HH resp. ✓
Ameet Meeting friends/family for a drink/meal at least once a month All adult (16+) HH members Personal or HH resp. ✓
Aleisure Regulary participate in a leisure activity e.g. sport, cinema, concert All adult (16+) HH members Personal or HH resp. ✓
Asmoney Spend a small amount of money each week on yourself All adult (16+) HH members Personal or HH resp. ✓
Aunmet Unmet need for medical examination or treatment Selected resp. or all adult(16+) Personal or HH resp. ✓
Adentist Unmet need for dental examination or treatment Selected resp. or all adult(16+) Personal or HH resp. ✓
Household indicators
Description Unit Mode of collection Enforced criterion
Hmeat A meal with meat, chicken or fish (or vegetarian equiv.) at least once a day Household Household respondent ✓
Hwarm Ability to keep home adequately warm Household Household respondent ✓
Hholiday One week annual holiday away from home Household Household respondent ✓
Hunexp Ability to face unexpected financial expenses (e.g. surgery, funeral, major repair in the house, replacement of durables, car etc.)
Household Household respondent ✓
Hrefurnish Replace worn-out furniture Household Household respondent ✓
Hnet Internet connection Household Household respondent ✓
HPC Computer Household Household respondent ✓
Hcar Car Household Household respondent ✓
Hmortgage Arrears on mortgage or rent payments Household Household respondent ✓
Hutility Arrears on utility bills Household Household respondent ✓
Hloan Arrears on hire purchase instalments or loan payments Household Household respondent ✓
Hroof Leaking roof, damps walls/floors/foundation, or rot in window frames or floor
Household Household respondent X
Hspace Shortage of space in dwelling (subj.) Household Household respondent X
Hhoc A heavy or slight financial burden of the total housing cost Household Household respondent X
Hevict Forced to leave dwelling due to eviction or distraint or for financial difficulties
Household Household respondent ✓

Barnett Paper 18-03 Identifying people in poverty
64
Hnoise Noise from neighbors or from street Household Household respondent X
Hpollution Pollution, grime or other environmental problems in the local neighborhood Household Household respondent X
Hcrime Crime, violence and vandalism in the area Household Household respondent X
Hlitter Litter lying around the neighborhood Household Household respondent X
Hdamaged Damaged public amenities in the neighborhood Household Household respondent X
Child indicators
Description Unit Mode of collection Enforced criterion
CHcloth Some new (not second-hand) ones Child aged 1-16 Household respondent ✓
CHshoes Two pairs of properly fitting shoes (including a pair of all-weather shoes) Child aged 1-16 Household respondent ✓
CHfruit Fresh fruit and vegetables once a day Child aged 1-16 Household respondent ✓
CHthmeals Three meals a day Child aged 1-16 Household respondent ✓
CHmeat One meal with meat, chicken or fish (or vegetarian equivalent) at least once a day
Child aged 1-16 Household respondent ✓
CHbooks Books at home suitable for their age Child aged 1-16 Household respondent ✓
CHtoys Outdoor leisure equipment (bicycle, roller skates, etc.) Child aged 1-16 Household respondent ✓
CHgames Indoor games (eucational baby toys, building blocks, board games, PC games etc.)
Child aged 1-16 Household respondent ✓
CHleisure Regular leisure activity (swimming, playing an instrument, riding a bicycle etc.) Child aged 1-16 Household respondent ✓
CHceleb Celebrations on special occasions (birthdays, name days, religious events, etc.) Child aged 1-16 Household respondent ✓
CHmeet Invite friends round to play and eat from time to time Child aged 1-16 Household respondent ✓
CHtrips Participate in school trips and school events that cost money Child aged 1-16 Household respondent ✓
CHworkspace Suitable place to study or do homework Child aged 1-16 Household respondent X
CHoutplay Outdoor space in the neighborhood where children can play safely Child aged 1-16 Household respondent X
CHholiday One week annual holiday away from home Child aged 1-16 Household respondent ✓
CHunmet Unmet need for medical examination or treatment Child aged 1-16 Household respondent ✓
CHdentist Unmet need for dental examination or treatment Child aged 1-16 Household respondent ✓
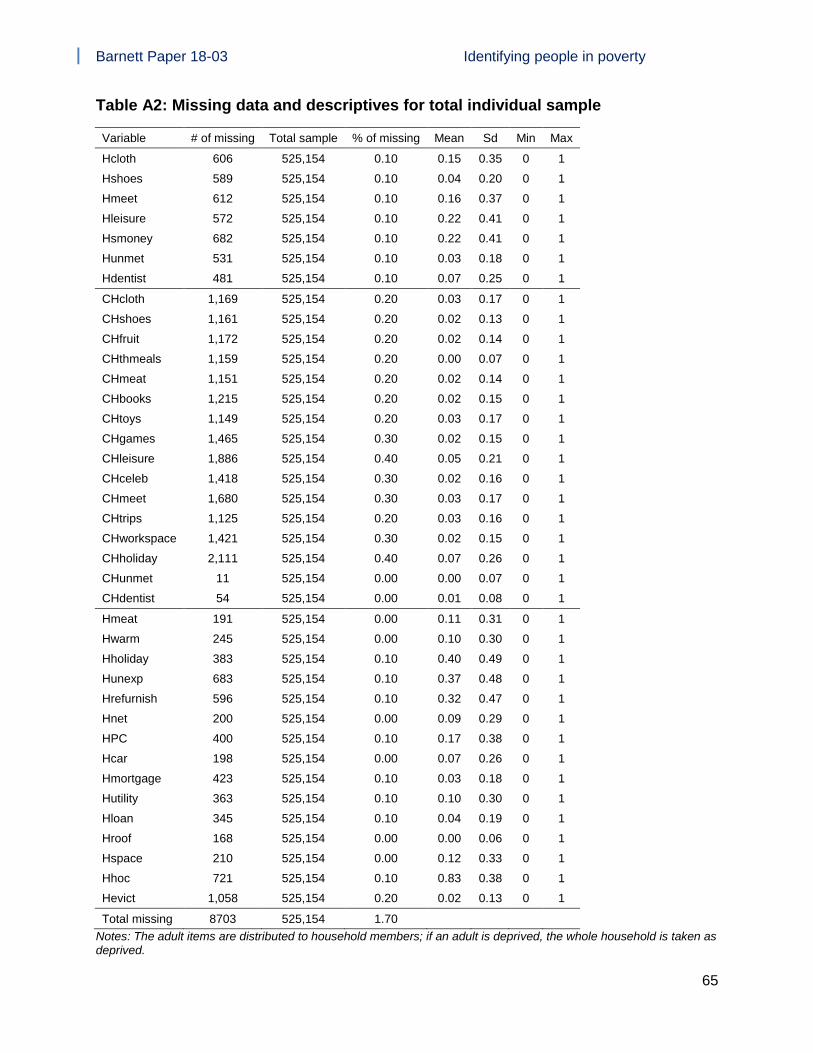
Barnett Paper 18-03 Identifying people in poverty
65
Table A2: Missing data and descriptives for total individual sample
Variable # of missing Total sample % of missing Mean Sd Min Max
Hcloth 606 525,154 0.10 0.15 0.35 0 1
Hshoes 589 525,154 0.10 0.04 0.20 0 1
Hmeet 612 525,154 0.10 0.16 0.37 0 1
Hleisure 572 525,154 0.10 0.22 0.41 0 1
Hsmoney 682 525,154 0.10 0.22 0.41 0 1
Hunmet 531 525,154 0.10 0.03 0.18 0 1
Hdentist 481 525,154 0.10 0.07 0.25 0 1
CHcloth 1,169 525,154 0.20 0.03 0.17 0 1
CHshoes 1,161 525,154 0.20 0.02 0.13 0 1
CHfruit 1,172 525,154 0.20 0.02 0.14 0 1
CHthmeals 1,159 525,154 0.20 0.00 0.07 0 1
CHmeat 1,151 525,154 0.20 0.02 0.14 0 1
CHbooks 1,215 525,154 0.20 0.02 0.15 0 1
CHtoys 1,149 525,154 0.20 0.03 0.17 0 1
CHgames 1,465 525,154 0.30 0.02 0.15 0 1
CHleisure 1,886 525,154 0.40 0.05 0.21 0 1
CHceleb 1,418 525,154 0.30 0.02 0.16 0 1
CHmeet 1,680 525,154 0.30 0.03 0.17 0 1
CHtrips 1,125 525,154 0.20 0.03 0.16 0 1
CHworkspace 1,421 525,154 0.30 0.02 0.15 0 1
CHholiday 2,111 525,154 0.40 0.07 0.26 0 1
CHunmet 11 525,154 0.00 0.00 0.07 0 1
CHdentist 54 525,154 0.00 0.01 0.08 0 1
Hmeat 191 525,154 0.00 0.11 0.31 0 1
Hwarm 245 525,154 0.00 0.10 0.30 0 1
Hholiday 383 525,154 0.10 0.40 0.49 0 1
Hunexp 683 525,154 0.10 0.37 0.48 0 1
Hrefurnish 596 525,154 0.10 0.32 0.47 0 1
Hnet 200 525,154 0.00 0.09 0.29 0 1
HPC 400 525,154 0.10 0.17 0.38 0 1
Hcar 198 525,154 0.00 0.07 0.26 0 1
Hmortgage 423 525,154 0.10 0.03 0.18 0 1
Hutility 363 525,154 0.10 0.10 0.30 0 1
Hloan 345 525,154 0.10 0.04 0.19 0 1
Hroof 168 525,154 0.00 0.00 0.06 0 1
Hspace 210 525,154 0.00 0.12 0.33 0 1
Hhoc 721 525,154 0.10 0.83 0.38 0 1
Hevict 1,058 525,154 0.20 0.02 0.13 0 1
Total missing 8703 525,154 1.70
Notes: The adult items are distributed to household members; if an adult is deprived, the whole household is taken as deprived.

Barnett Paper 18-03 Identifying people in poverty
66
Table A3: Missing data for deprivation indicators for each country
Country # of missing Total sample % of missing
AT 295 13,610 2.20
BE 455 14,721 3.10
BG 23 15,047 0.20
CY 0 9,283 0.00
CZ 7 23,302 0.00
DE 1,298 28,368 4.60
DK 703 15,025 4.70
EE 322 13,542 2.40
EL 0 18,035 0.00
ES 524 36,865 1.40
FI 607 25,157 2.40
FR 939 25,611 3.70
HU 557 25,053 2.20
IE 443 12,641 3.50
IT 0 51,196 0.00
LT 12 12,852 0.10
LU 459 11,406 4.00
LV 10 14,403 0.10
NL 616 23,687 2.60
PL 5 38,541 0.00
PT 335 13,013 2.60
RO 0 18,703 0.00
SI 35 29,576 0.10
SK 268 16,137 1.70
UK 790 19,380 4.10
Total 8,703 525,154 1.70
SE 8,387 18,441 45.50
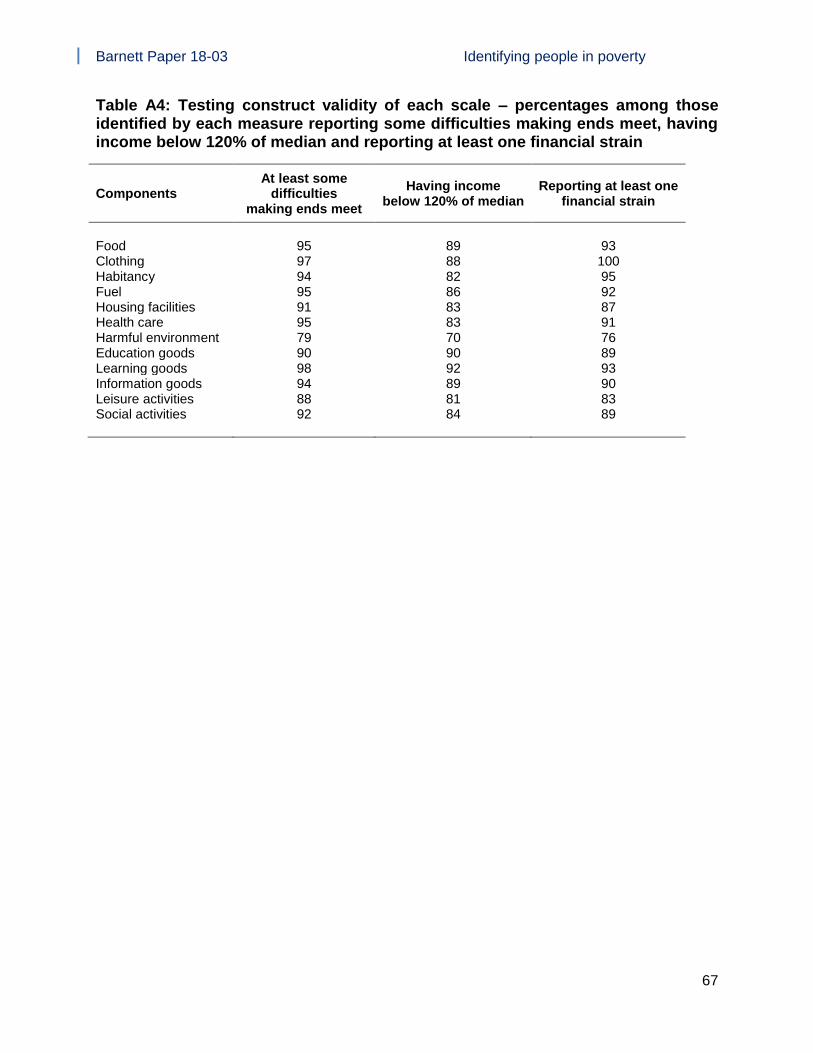
Barnett Paper 18-03 Identifying people in poverty
67
Table A4: Testing construct validity of each scale – percentages among those identified by each measure reporting some difficulties making ends meet, having income below 120% of median and reporting at least one financial strain
Components At least some
difficulties making ends meet
Having income below 120% of median
Reporting at least one financial strain
Food 95 89 93 Clothing 97 88 100 Habitancy 94 82 95 Fuel 95 86 92 Housing facilities 91 83 87 Health care 95 83 91 Harmful environment 79 70 76 Education goods 90 90 89 Learning goods 98 92 93 Information goods 94 89 90 Leisure activities 88 81 83 Social activities 92 84 89

Barnett Paper 18-03 Identifying people in poverty
68
Table A5: Rates for each scale for each country
Country Food Clothing Habitancy Fuel Housing facilities
Health care
Harmful environment
Education goods
Learning goods
Information goods
Leisure activities
Social activities
AT 0.10 0.09 0.02 0.07 0.10 0.01 0.03 0.02 0.01 0.05 0.34 0.10
BE 0.05 0.08 0.02 0.09 0.09 0.02 0.05 0.03 0.02 0.06 0.31 0.12
BG 0.42 0.68 0.03 0.70 0.37 0.26 0.13 0.12 0.18 0.26 0.81 0.60
CY 0.05 0.12 0.04 0.30 0.29 0.13 0.04 0.03 0.02 0.06 0.49 0.08
CZ 0.11 0.09 0.03 0.08 0.15 0.01 0.08 0.02 0.02 0.08 0.44 0.05
DE 0.10 0.10 0.02 0.08 0.10 0.05 0.04 0.03 0.01 0.07 0.35 0.27
DK 0.01 0.06 0.01 0.04 0.05 0.02 0.01 0.01 0.01 0.02 0.13 0.02
EE 0.10 0.13 0.01 0.11 0.21 0.08 0.02 0.03 0.03 0.07 0.54 0.12
EL 0.09 0.13 0.04 0.27 0.24 0.14 0.07 0.06 0.04 0.14 0.53 0.11
ES 0.02 0.05 0.05 0.10 0.15 0.07 0.03 0.02 0.01 0.11 0.42 0.10
FI 0.03 0.07 0.03 0.08 0.04 0.01 0.01 0.01 0.00 0.03 0.16 0.02
FR 0.08 0.12 0.04 0.11 0.12 0.08 0.03 0.03 0.01 0.06 0.36 0.08
HU 0.29 0.35 0.03 0.25 0.19 0.07 0.06 0.03 0.08 0.15 0.73 0.42
IE 0.03 0.06 0.05 0.13 0.09 0.06 0.04 0.02 0.01 0.08 0.44 0.10
IT 0.07 0.11 0.03 0.18 0.07 0.14 0.06 0.05 0.03 0.05 0.50 0.14
LT 0.21 0.29 0.01 0.29 0.24 0.06 0.05 0.04 0.05 0.12 0.65 0.32
LU 0.02 0.06 0.02 0.02 0.12 0.01 0.02 0.05 0.01 0.02 0.18 0.06
LV 0.24 0.41 0.04 0.28 0.33 0.25 0.08 0.04 0.09 0.10 0.76 0.32
NL 0.02 0.03 0.01 0.03 0.09 0.01 0.05 0.02 0.00 0.01 0.17 0.02
PL 0.19 0.20 0.01 0.25 0.21 0.11 0.04 0.05 0.06 0.15 0.68 0.20
PT 0.05 0.25 0.04 0.30 0.22 0.22 0.06 0.08 0.07 0.14 0.67 0.28
RO 0.30 0.47 0.01 0.37 0.33 0.27 0.07 0.23 0.29 0.28 0.87 0.68
SI 0.11 0.15 0.02 0.20 0.21 0.00 0.03 0.02 0.01 0.05 0.37 0.07
SK 0.25 0.17 0.04 0.14 0.11 0.03 0.10 0.04 0.05 0.13 0.61 0.15
UK 0.04 0.08 0.02 0.08 0.10 0.01 0.07 0.02 0.01 0.04 0.36 0.12
Total 0.10 0.14 0.03 0.15 0.14 0.08 0.05 0.04 0.04 0.09 0.45 0.18
Notes: Weighted

Barnett Paper 18-03 Identifying people in poverty
69
Table A6: Rates of each scale for each country after adjustment
Country Food Clothing Habitancy Fuel Housing facilities
Health care
Harmful environment
Education goods
Learning goods
Information goods
Leisure activities
Social activities
AT 0.06 0.05 0.02 0.04 0.05 0.01 0.01 0.01 0.01 0.03 0.14 0.06
BE 0.04 0.07 0.02 0.07 0.06 0.02 0.02 0.02 0.02 0.04 0.17 0.08
BG 0.35 0.44 0.03 0.45 0.24 0.19 0.08 0.09 0.14 0.19 0.49 0.39
CY 0.04 0.09 0.04 0.24 0.22 0.12 0.02 0.03 0.02 0.05 0.36 0.07
CZ 0.06 0.06 0.03 0.05 0.06 0.01 0.02 0.02 0.02 0.05 0.17 0.03
DE 0.06 0.06 0.01 0.05 0.06 0.03 0.02 0.01 0.01 0.04 0.16 0.12
DK 0.01 0.03 0.01 0.02 0.02 0.02 0.01 0.01 0.01 0.01 0.06 0.01
EE 0.07 0.09 0.01 0.08 0.10 0.05 0.01 0.01 0.02 0.04 0.24 0.07
EL 0.07 0.10 0.04 0.20 0.16 0.10 0.03 0.04 0.03 0.09 0.30 0.09
ES 0.01 0.04 0.05 0.08 0.10 0.05 0.02 0.02 0.01 0.08 0.26 0.08
FI 0.02 0.04 0.02 0.05 0.02 0.00 0.00 0.00 0.00 0.02 0.09 0.01
FR 0.06 0.08 0.04 0.09 0.07 0.04 0.02 0.02 0.01 0.04 0.18 0.06
HU 0.21 0.25 0.03 0.21 0.14 0.06 0.04 0.03 0.07 0.11 0.40 0.28
IE 0.02 0.05 0.05 0.10 0.06 0.03 0.02 0.02 0.01 0.06 0.25 0.08
IT 0.06 0.09 0.03 0.15 0.05 0.10 0.03 0.04 0.03 0.04 0.29 0.10
LT 0.14 0.19 0.01 0.17 0.14 0.04 0.02 0.03 0.04 0.09 0.32 0.20
LU 0.01 0.05 0.02 0.02 0.07 0.01 0.01 0.02 0.01 0.01 0.11 0.05
LV 0.20 0.29 0.04 0.23 0.20 0.19 0.05 0.04 0.08 0.08 0.43 0.23
NL 0.01 0.02 0.01 0.02 0.04 0.01 0.01 0.01 0.00 0.01 0.07 0.02
PL 0.13 0.14 0.01 0.17 0.13 0.07 0.02 0.04 0.05 0.09 0.32 0.14
PT 0.03 0.16 0.04 0.15 0.12 0.13 0.02 0.05 0.05 0.08 0.28 0.16
RO 0.20 0.28 0.00 0.25 0.21 0.17 0.03 0.16 0.19 0.17 0.41 0.36
SI 0.08 0.11 0.02 0.14 0.13 0.00 0.02 0.01 0.00 0.03 0.22 0.05
SK 0.14 0.10 0.04 0.08 0.07 0.02 0.04 0.03 0.04 0.08 0.23 0.08
UK 0.03 0.06 0.02 0.05 0.05 0.00 0.03 0.01 0.01 0.03 0.19 0.08
Total 0.07 0.09 0.02 0.11 0.08 0.05 0.02 0.03 0.03 0.06 0.23 0.11

Barnett Paper 18-03 Identifying people in poverty
70
Table A7: Missing data and descriptives of poverty and validity measures for the whole sample
# of missing Total sample % of missing mean sd min max
Poverty measures
EU 2020 poverty target 8,863 525,154 1.69 0.26 0.44 0 1
13 item index (7+ deprived items) 8,703 525,154 1.66 0.13 0.33 0 1
Income poverty (60% median) 0 525,154 0.00 0.16 0.36 0 1
Low work intensity 160 525,154 0.03 0.06 0.24 0 1
Validity measures
Ability to make ends meet 440 525,154 0.08 3.20 1.30 1 6
HH income below 120% median 0 525,154 0.00 0.65 0.48 0 1
Financial strain index 2,044 525,154 0.39 1.71 1.27 0 5
Having difficulty making ends meet 440 525,154 0.08 0.29 0.46 0 1
Inability to pay unexpected expenses 683 525,154 0.13 0.37 0.48 0 1
Having structural arrears 631 525,154 0.12 0.12 0.33 0 1
Feeling heavy burden of housing cost 721 525,154 0.14 0.83 0.38 0 1
Feeling heavy burden of debt 202 525,154 0.04 0.10 0.30 0 1
Total 9,162 525,154 1.74

Barnett Paper 18-03 Identifying people in poverty
71
Table A8: Missing data and descriptives of explanatory variables for household reference person
# of missing Total sample % of missing mean sd min max
Resources
HRP Social class (ESEC) 2,722 204,169 1.33 3.04 1.71 1 6
HRP Education (ISCED) 4,114 204,169 2.01 2.07 0.77 1 3
Unemployed in HH 0 204,169 0.00 0.10 0.31 0 1
Tenant 8 204,169 0.00 0.18 0.38 0 1
Needs
Disability in HH 840 204,169 0.41 0.39 0.49 0 1
Chronic health pr. In HH 754 204,169 0.37 0.46 0.50 0 1
Self-rated bad health in HH 627 204,169 0.31 0.19 0.39 0 1
Child aged 0-2 in HH 0 204,169 0.00 0.07 0.26 0 1
Child aged 3-4 in HH 0 204,169 0.00 0.05 0.21 0 1
Child aged 5-11 in HH 0 204,169 0.00 0.14 0.35 0 1
Child aged 12-15 in HH 0 204,169 0.00 0.11 0.31 0 1
Single parenthood 66 204,169 0.03 0.04 0.19 0 1
Extended family 66 204,169 0.03 0.07 0.26 0 1
HRP Divorced / separated 639 204,169 0.31 0.11 0.31 0 1
HRP female 0 204,169 0.00 0.40 0.49 0 1
Total 7,263 204,169 % 3.56

Barnett Paper 18-03 Identifying people in poverty
72
Table A9: Comparing the proposed measure and the EU 2020 poverty target measure without low-work intensity indicator based on identified risk factors – relative risk ratios
Multinomial logit / Base outcome = EU 2020 without low-work intensity only
None Both Proposed only
Resource indicators
HRP Social class (ref=Salariat)
Intermediate 0.830** 1.302*** 1.282**
Small self-emp. 0.291*** 1.538*** 0.465***
Non-manual labor 0.654*** 1.702*** 1.246*
Manual labor 0.493*** 1.666*** 1.016
Never worked 0.203*** 1.406*** 0.400***
HRP Education (ref=Third level)
Upper secondary 0.776*** 1.216** 1.128
Low second/Primary/Pre 0.595*** 1.720*** 1.117
Unemployed in HH 0.463*** 2.179*** 1.098
Tenant 0.782*** 2.154*** 1.739***
Need indicators
Disability in HH 0.955 1.351*** 1.317***
Chronic health pr. in HH 1.088 1.101* 1.205***
Bad subj. health 0.836*** 1.649*** 1.471***
Child aged 0-2 in HH 0.832* 1.199* 1.085
Child aged 3-4 in HH 0.984 1.187 1.169
Child aged 5-11 in HH 0.843** 1.151* 1.138
Child aged 12-15 in HH 0.915 1.378*** 1.209**
Single parent household 0.689*** 1.466*** 1.231*
Extended family 1.042 0.804** 1.045
HRP divorced/separated 0.747*** 1.355*** 1.178*
HRP Female 0.807*** 1.259*** 1.182***
Country (ref=AT)
BE 0.796** 1.017 1.476**
BG 0.240*** 3.207*** 1.484**
CY 1.116 4.301*** 17.141***
CZ 1.614*** 1.763*** 4.277***
DE 0.911 1.726*** 0.783
DK 0.550*** 0.276*** 0.233***
EE 0.866 2.721*** 2.012***
EL 1.637*** 3.731*** 10.101***
ES 0.999 1.403*** 4.386***
FI 0.681*** 0.553*** 0.759*
FR 1.195* 1.266* 2.203***
HU 0.614*** 2.542*** 4.665***
IE 0.845 1.213 2.502***

Barnett Paper 18-03 Identifying people in poverty
73
IT 1.281*** 2.110*** 6.164***
LT 0.604*** 2.943*** 2.846***
LU 1.059 0.825 0.833
LV 0.588*** 4.139*** 2.856***
NL 0.813* 0.505*** 0.531***
PL 0.977 3.471*** 5.051***
PT 1.119 1.455** 1.869***
RO 0.249*** 2.042*** 0.855
SI 1.051 2.623*** 5.725***
SK 1.183 2.343*** 4.281***
UK 0.556*** 0.868 1.094
Notes: The EU poverty measure is calculated using only income poverty and material deprivation measure.

Barnett Paper 18-03 Identifying people in poverty
74
Supplementary material

Barnett Paper 18-03 Identifying people in poverty
75
S1. Why is accounting for multidimensionality important?
To examine the utility of multidimensionality, the total deprivation rate is decomposed
into its dimensions, and i) the amount of people captured by only one dimension, ii)
the association between dimensions, and iii) the risk profiles of the groups captured
by each dimension are examined. In this respect, in Table S1, the correlations
between dimensions are shown. In Table S2, the incidence rates for each dimension
are presented (as a ratio to the total reference population). In Table S3, the results of
four multinomial logit models are presented (details explained below).
The value of accounting for dimensionality can be shown based on three points.
First, as shown in Table S1, the correlations between dimensions are reasonably
high yet still not perfect. This might show that the dimensions represent different
aspects of the same phenomenon of poverty while each still capture a distinct group.
Table S1: Correlations among dimensions
Basic Health Education Social Poor60
Basic 1.00
Health 0.54 1.00
Education 0.64 0.43 1.00
Social 0.77 0.50 0.67 1.00
Poor60 0.44 0.28 0.44 0.49 1
Indeed and secondly, for all countries, a significant amount of people is deprived
only in one dimension – again usually highest for social dimension and lowest for
health or education dimension.15 These people who are deprived in only one
15 The high rate in the dimension of leisure and social activities depends partly on the holiday
item – once it is excluded from the social dimension, the amount of captured only by basic
goods dimension increases to 7%, by health to 3%, and by education to 2%, while the
amount captured only by leisure and social activities dimension decreases to 8% in average
in the EU.

Barnett Paper 18-03 Identifying people in poverty
76
dimension might possibly not be identified in a unidimensional scale where different
types of deprivations put together and a non-zero threshold applied. Indeed, as
presented in the next section of the Supplementary Material, when compared to
other deprivation scales such as the 9-item basic deprivation index of Whelan and
Maitre (2012), and the 13 item index of Guio et al. (2016), the proposed
multidimensional deprivation measure captures an additional group of people, a
significant majority of whom reports difficulties making ends meet, have income
below 120% of median, and report significant financial strain.
Table S2: Deprivation across dimensions in 25 EU countries
Country Basic Health Education Social Only basic
Only health
Only education
Only social
AT 0.24 0.04 0.07 0.34 0.05 0.01 0.01 0.15
BE 0.20 0.07 0.09 0.32 0.03 0.02 0.01 0.13
BG 0.87 0.33 0.37 0.82 0.06 0.01 0.00 0.03
CY 0.48 0.17 0.10 0.49 0.09 0.02 0.01 0.10
CZ 0.28 0.09 0.10 0.44 0.05 0.03 0.01 0.19
DE 0.23 0.08 0.10 0.39 0.03 0.01 0.01 0.17
DK 0.12 0.04 0.03 0.14 0.05 0.01 0.01 0.06
EE 0.35 0.10 0.11 0.55 0.05 0.01 0.01 0.22
EL 0.44 0.19 0.18 0.53 0.05 0.03 0.02 0.12
ES 0.24 0.10 0.12 0.42 0.04 0.02 0.01 0.18
FI 0.16 0.02 0.04 0.17 0.07 0.01 0.01 0.07
FR 0.26 0.10 0.08 0.37 0.05 0.02 0.01 0.14
HU 0.56 0.12 0.20 0.75 0.03 0.01 0.00 0.20
IE 0.22 0.09 0.11 0.44 0.03 0.02 0.01 0.21
IT 0.26 0.18 0.10 0.50 0.03 0.03 0.01 0.21
LT 0.55 0.10 0.16 0.67 0.07 0.01 0.00 0.17
LU 0.17 0.04 0.07 0.18 0.06 0.01 0.02 0.06
LV 0.64 0.30 0.18 0.76 0.05 0.01 0.00 0.16
NL 0.12 0.05 0.03 0.17 0.04 0.02 0.01 0.09
PL 0.45 0.14 0.20 0.68 0.03 0.01 0.01 0.22
PT 0.47 0.25 0.20 0.67 0.03 0.02 0.00 0.17
RO 0.70 0.31 0.46 0.88 0.01 0.01 0.00 0.13
SI 0.39 0.04 0.07 0.37 0.11 0.01 0.00 0.10
SK 0.41 0.13 0.17 0.61 0.05 0.03 0.01 0.21
UK 0.21 0.08 0.06 0.37 0.04 0.03 0.01 0.17
Total 0.30 0.12 0.13 0.46 0.04 0.02 0.01 0.16
Barnett Paper 18-03 Identifying people in poverty
77
Thirdly, the groups deprived in one dimension have substantively different profiles
than those deprived in other dimensions in terms of their resources and needs. The
results of which have been presented in Table S3, a multinomial logit model is run
for each dimension to explore the profiles of people captured by each dimension.
The dependent variables are categorized as not-identified, identified only in one
dimension (e.g. basic) and identified in other dimensions (e.g. health, education and
social). The reference category in each model is selected as “identified in other
dimensions” to see how the profiles of deprived in each dimension are compared to
the profiles of deprived in other dimensions. (The models are run for the whole EU
sample with country fixed effects.) Same as the model applied in the main analysis,
the explanatory variables are considered as the risk factors and represent either
resources or needs (see Table 6 in the main text).
As shown in Table S3, for each dimension, the coefficients for many resource and
need variables are statistically significant. In other words, the groups captured by
one dimension significantly differ from the groups captured by other dimensions in
terms of social class, education, economic well-being and various other need factors
related to health, education and care. In addition, each dimension captures certain
groups who are more likely to have needs in relevant dimensions. For example, the
coefficients for variables that would proxy health care needs (e.g. disability or chronic
health problem, or self-rated bad health in the household) are all significant and have
higher effect sizes for health dimension than in others (except social dimension
which shows the association between health and leisure and social activities). In
other words, the households with higher health care needs are more likely to be
captured by the health than in other dimensions. The households with education

Barnett Paper 18-03 Identifying people in poverty
78
needs (e.g. having children in the household) are more likely to be deprived in
education than in other dimensions.
Table S3: Comparing the profiles captured by each dimension using multinomial logit models– incidence rate ratios (IRR)
Base outcomes = Other deprived
Model 1 Basic
Model 2 Health
Model 3 Education
Model 4 Social
Resources
HRP Social class (ref=Salariat)
Intermediate employee 1.054 0.941 1.198*** 1.223***
Small self-emp. 1.066 0.810*** 1.225*** 1.429***
Non-manual labor 1.054 0.938 1.468*** 1.297***
Manual labor 1.217*** 0.851*** 1.650*** 1.753***
Excluded 1.078 0.792*** 1.184* 1.539***
HRP Education (ref=Third level)
Upper 2ndary 0.977 0.847*** 1.169*** 1.434***
Low2nd/Primary/Pre 1.033 0.831*** 1.365*** 1.924***
Unemployed in HH 1.685*** 1.489*** 1.504*** 1.990***
Tenant 1.778*** 1.439*** 1.917*** 0.937
Income (log equiv.) 0.633*** 0.976 0.622*** 0.420***
Needs
Disability in HH 1.078** 1.160*** 1.122** 1.364***
Chronic health pr. In HH 1.076* 1.292*** 0.917* 0.989
Bad subj. health 1.344*** 1.303*** 1.160*** 1.743***
Child aged 0-2 in HH 1.240*** 1.130** 1.491*** 1.034
Child aged 3-4 in HH 1.120* 1.061 1.586*** 0.974
Child aged 5-11 in HH 1.245*** 1.218*** 1.814*** 1.184***
Child aged 12-15 in HH 1.081* 1.131** 1.557*** 1.182***
Single parent household 1.297*** 1.158* 1.108 1.324***
Extended family 1.019 1.089 1.154*** 1.404***
HRP divorced/separated 1.229*** 1.197*** 1.316*** 1.344***
HRP Female 1.173*** 0.998 1.039 1.202***
These findings show the value of including each dimension and evaluating them
separately to cover different experiences of poverty.
Barnett Paper 18-03 Identifying people in poverty
79
S2. A consistent poverty measure using the unadjusted proposed deprivation measure – a comparison to the consistent poverty measure of Whelan et al. (2013)
In this section, a consistent poverty measure is constructed combining the proposed
multidimensional deprivation measure with a relative income poverty measure (60%
of median) and compared to the measure proposed by Maitre et al. (2013) (MWN
hereafter) in their performance for identifying the people in poverty. For doing this,
first, the agreement (and disagreement) between each measure is examined; then,
the profiles of groups captured by each measure are compared based on some
outcome indicators such as having difficulties making ends meet, financial strain and
social class (ESEC 5).
In Table S4, headcount rates for each measure are presented for all countries. The
results show that i) in average in the EU, the proposed measure identified 13% of the
population while the MWN measure identifies 9% of the population, ii) the variance of
the proposed compared to the Maitre measure is slightly higher (0.11 vs. 0.08), iii)
the agreement between the two measure is very high and the only difference
between the two measure is the additional group captured by the proposed measure.
Following that, the question is whether this additional group improves the
performance of a deprivation measure in identifying the people in poverty.
As shown in Table S5, among this additionally identified group, 78% report having
difficulties making ends meet compared to the EU average of 56%; 48% report
significant financial strain (2+ from the five item financial strain index) compared to
the EU average of 33%; more than 50% of the household heads (household
reference person) is either working class or never worked compared to the EU
average of 40%; and only 12% of the household heads are in salariat class

Barnett Paper 18-03 Identifying people in poverty
80
compared to the EU average of 30%. Therefore, the proposed consistent poverty
measure captures an additional group compared to the WMN measure; and this
group is predominantly working class or never worked, and more likely to report
difficulties making ends meet and financial strain.
Table S4: Poverty rates and mismatch between the proposed and the MWN measure across EU countries
Country Consistent Deprived
Consistent WMN
Agreement Only
deprived Only MWN
AT 0.09 0.06 0.95 0.03 0
BE 0.11 0.07 0.95 0.04 0
BG 0.21 0.21 0.98 0.01 0
CY 0.12 0.07 0.94 0.05 0
CZ 0.07 0.05 0.97 0.02 0
DE 0.12 0.09 0.96 0.03 0
DK 0.05 0.02 0.93 0.03 0
EE 0.17 0.09 0.92 0.08 0
EL 0.18 0.13 0.94 0.05 0
ES 0.14 0.06 0.90 0.08 0
FI 0.07 0.03 0.94 0.04 0
FR 0.10 0.07 0.96 0.03 0
HU 0.12 0.10 0.98 0.02 0
IE 0.12 0.05 0.93 0.06 0
IT 0.15 0.08 0.91 0.07 0
LT 0.18 0.14 0.95 0.04 0
LU 0.10 0.04 0.94 0.05 0
LV 0.24 0.20 0.95 0.05 0
NL 0.06 0.02 0.94 0.03 0
PL 0.16 0.11 0.94 0.05 0
PT 0.16 0.13 0.92 0.03 0
RO 0.22 0.20 0.97 0.02 0
SI 0.09 0.05 0.95 0.04 0
SK 0.10 0.07 0.97 0.03 0
UK 0.12 0.07 0.92 0.05 0
Total 0.13 0.09 0.94 0.04 0
Variance 0.11 0.08 0.06 0.04 0

Barnett Paper 18-03 Identifying people in poverty
81
Table S5: The profiles of the group identified only by the proposed measure
Outcome indicators codeprived=1 | WMN= 0 EU average
Having difficulties making ends meet
78% 56%
Financial strain (2+) 48% 33%
ESEC (among HRP)
Salariat 11.8 % 30%
Intermediate 14.1% 18.9%
Small self-employed 21.6 % 11.2%
Non-manual labor 11.5 % 8.8%
Manual labor 31.8% 27.7%
Never worked 9.3 % 3.3 %
Notes: The second column (codeprived=1 | WMN= 0) shows the ratios among the group identified additionally by the proposed measure.
Another issue to consider is the cross-country variation of the people identified only
by the proposed measure. We see that the rate is around 1-2% for countries like
Bulgaria, Romania and Hungary, while it is around 6-8% for countries like Spain,
Italy, Ireland and Estonia. This variation might be due to two different sources: i) as
empirically shown by Beduk (2018b), the applied non-zero threshold in W&M
measure is more effective in distinguishing deprived and non-deprived for less
affluent countries, and vice versa; therefore, a non-zero threshold is more likely to
miss some people experiencing poverty in more affluent countries; ii) the difference
might be higher in countries where health care and education is not publicly
provided, thus in those countries, W&M scale tend to miss people experience
poverty related to missing dimensions.