Embed Size (px)
Citation preview
Identifying Potential Markets for Commercial Behind-the-
Meter Battery Storage
September 19, 2017
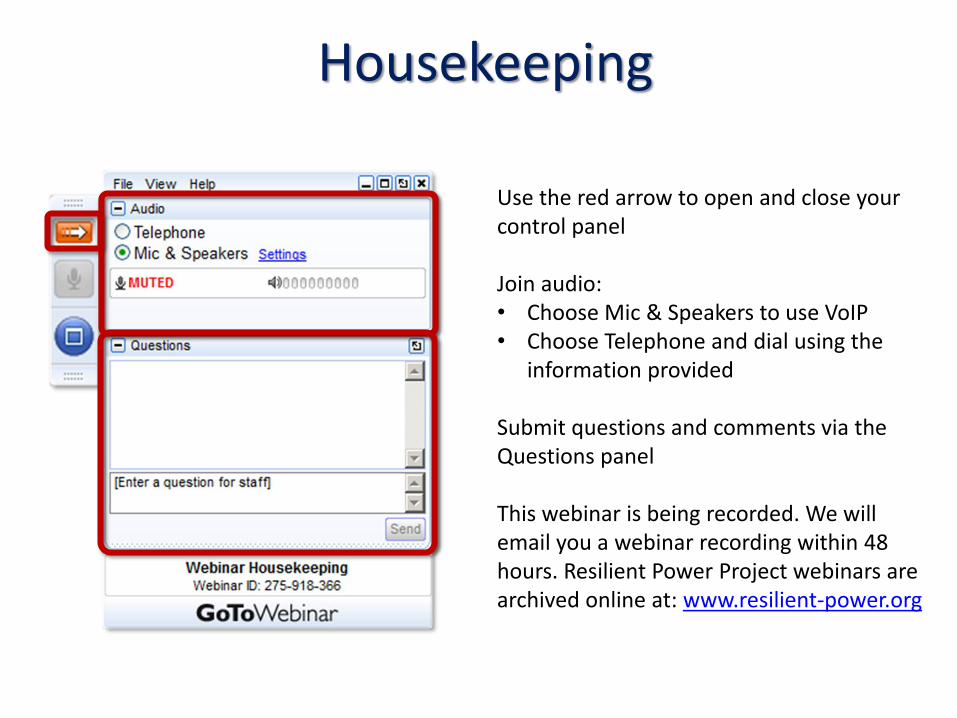
Housekeeping
Use the red arrow to open and close your control panel
Join audio:• Choose Mic & Speakers to use VoIP • Choose Telephone and dial using the
information provided
Submit questions and comments via the Questions panel
This webinar is being recorded. We will email you a webinar recording within 48 hours. Resilient Power Project webinars are archived online at: www.resilient-power.org
Who We Are
3
www.cleanegroup.org
www.resilient-power.org
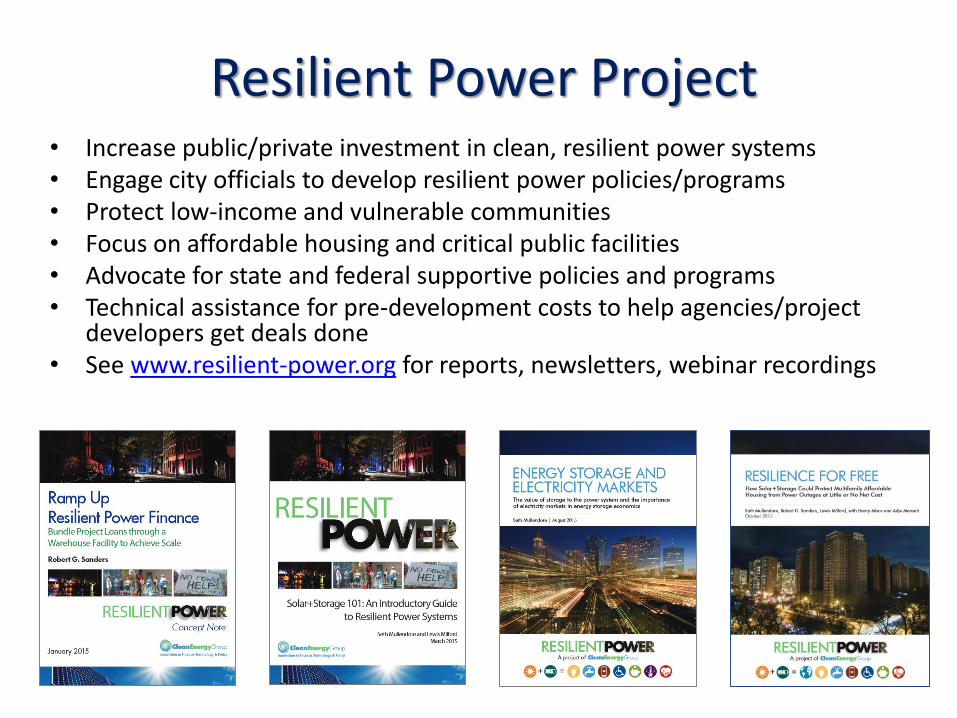
Resilient Power Project
4
• Increase public/private investment in clean, resilient power systems • Engage city officials to develop resilient power policies/programs• Protect low-income and vulnerable communities• Focus on affordable housing and critical public facilities• Advocate for state and federal supportive policies and programs• Technical assistance for pre-development costs to help agencies/project
developers get deals done• See www.resilient-power.org for reports, newsletters, webinar recordings
www.resilient-power.org
6
Panelists
• Joyce McLaren, Senior Energy Analyst, National Renewable Energy Laboratory
• Seth Mullendore, Project Director, Clean Energy Group (Moderator)
Seth MullendoreClean Energy GroupSeptember, 19 2017
Identifying Potential Markets for Behind-the-Meter Battery Energy Storage:
A Survey of U.S. Demand Charges
2
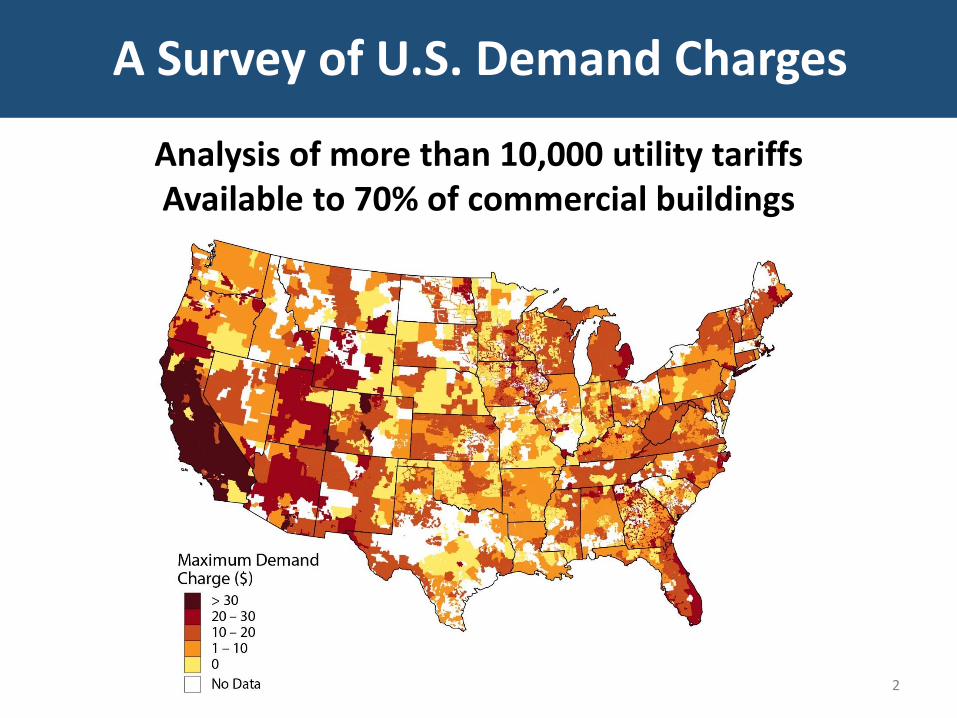
A Survey of U.S. Demand Charges
Analysis of more than 10,000 utility tariffsAvailable to 70% of commercial buildings
3
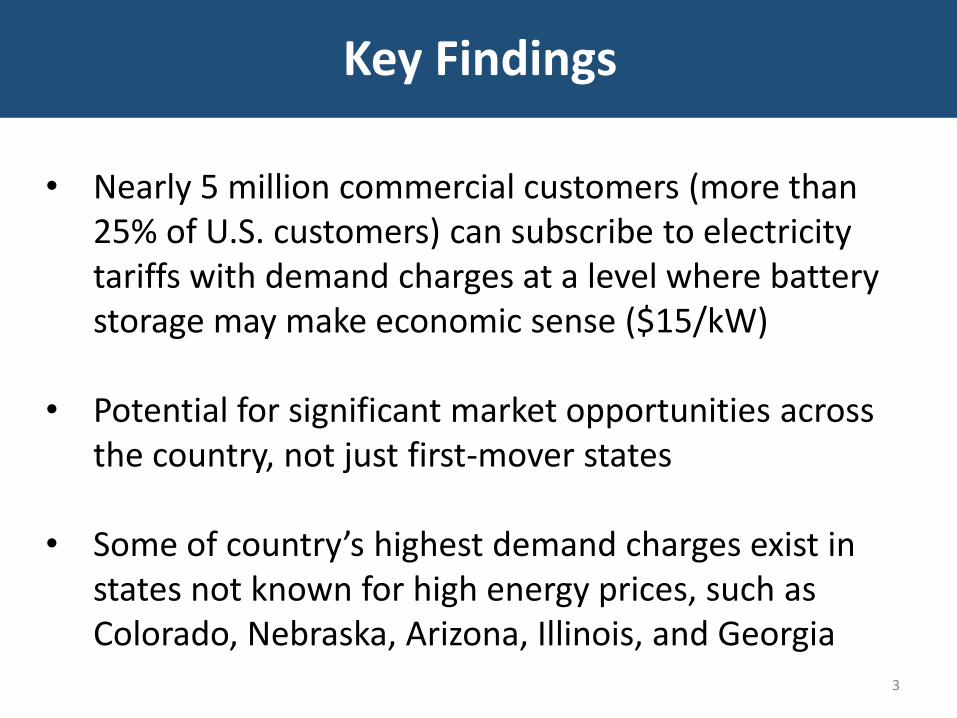
Key Findings
• Nearly 5 million commercial customers (more than 25% of U.S. customers) can subscribe to electricity tariffs with demand charges at a level where battery storage may make economic sense ($15/kW)
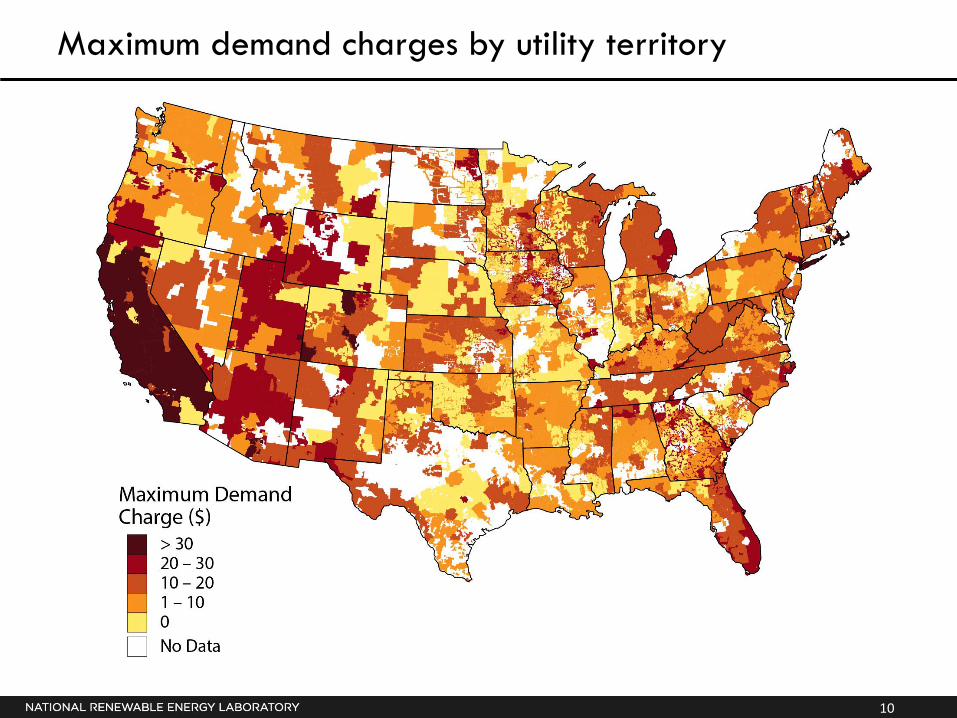
• Potential for significant market opportunities across the country, not just first-mover states
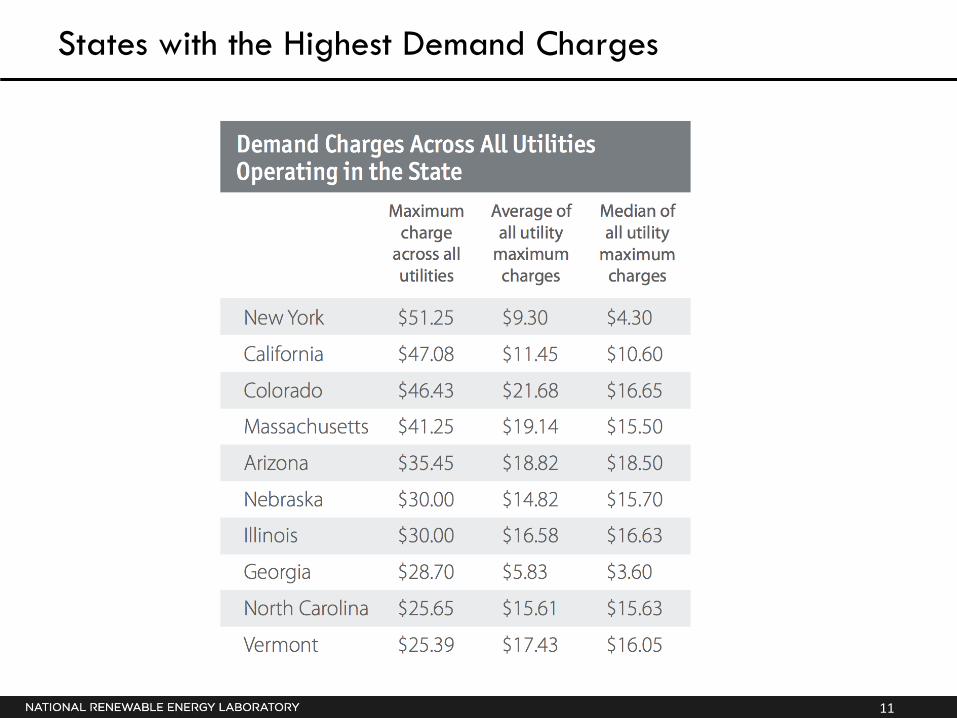
• Some of country’s highest demand charges exist in states not known for high energy prices, such as Colorado, Nebraska, Arizona, Illinois, and Georgia
4
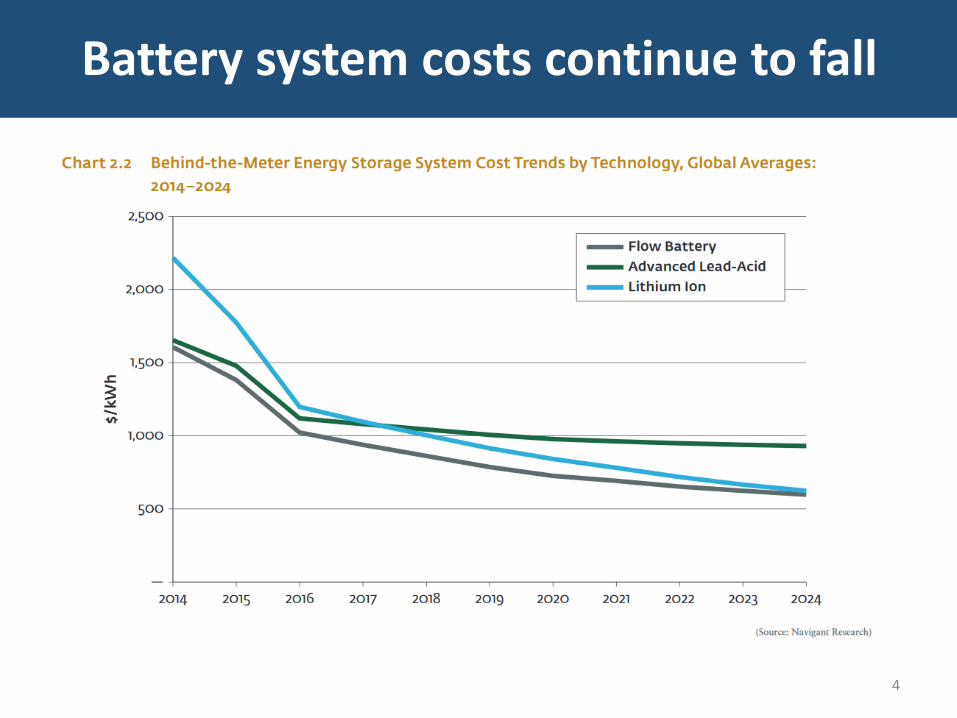
Battery system costs continue to fall
5
What are demand charges?
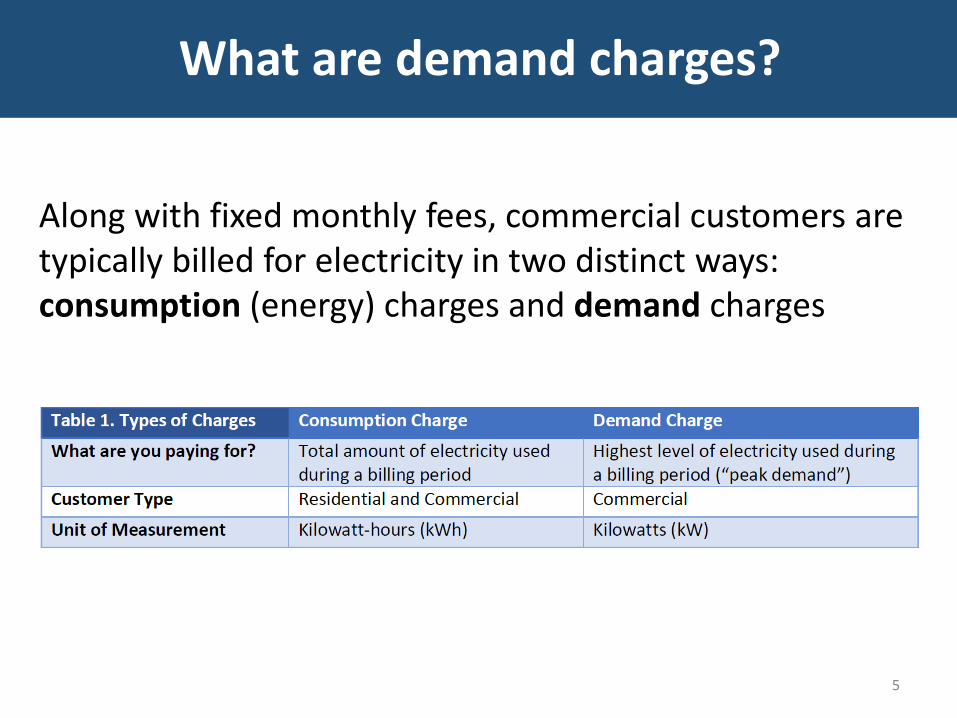
Along with fixed monthly fees, commercial customers are typically billed for electricity in two distinct ways: consumption (energy) charges and demand charges
6
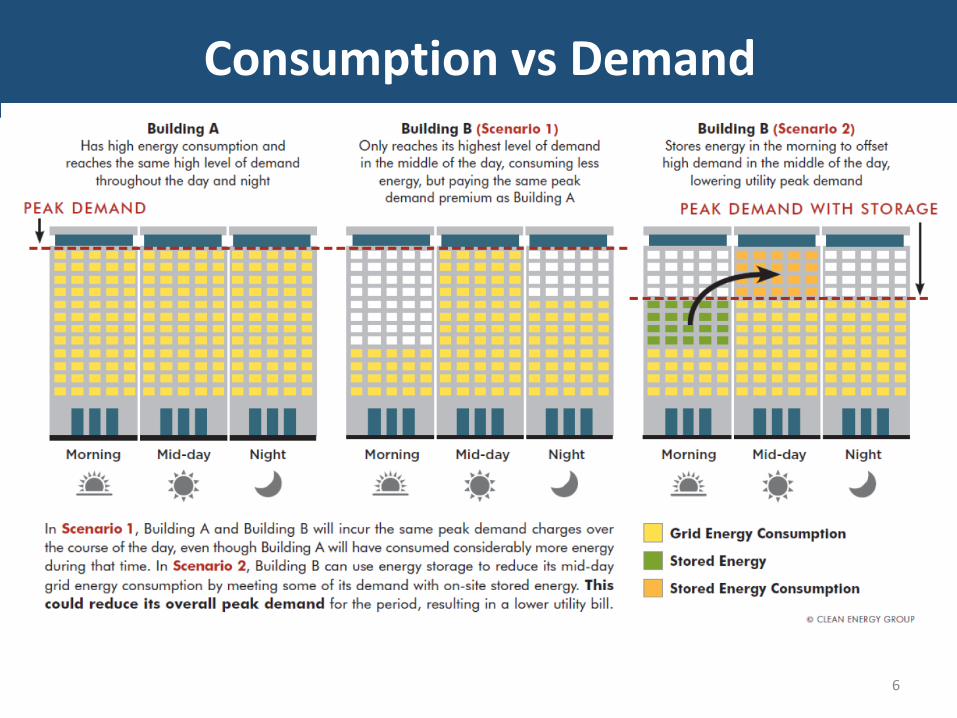
Consumption vs Demand
7
Who pays demand charges?
• Nearly all medium and large commercial customers in every state are obligated to pay demand charges
• This includes traditional commercial customers (private and nonprofit businesses) as well as a wide array of additional customer types such as community facilities, public buildings, and multifamily housing properties
8
How are customers billed for demand?
• Demand charges are typically based on a customer's peak demand during each billing period
• Peak demand is usually defined as the highest average electricity usage occurring within a defined time interval (often 15 minutes)
• Demand charges often account for 30% - 70% of a customer's monthly electric bill.
• Demand charge rates vary considerably across utilities, locations, building sizes, and building types.
9
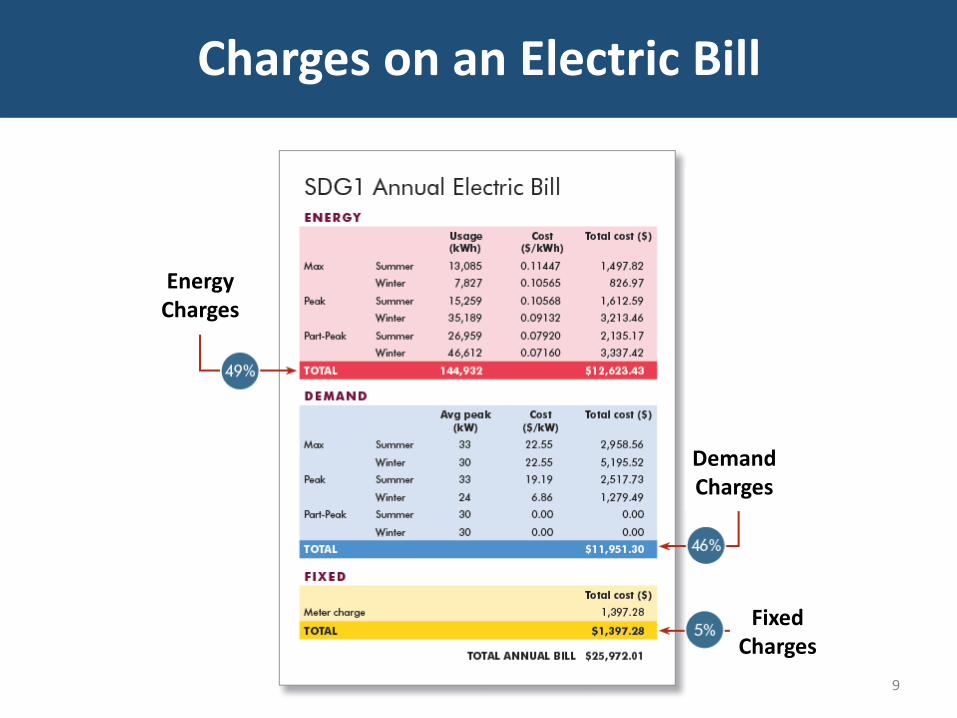
Charges on an Electric Bill
EnergyCharges
DemandCharges
FixedCharges
10
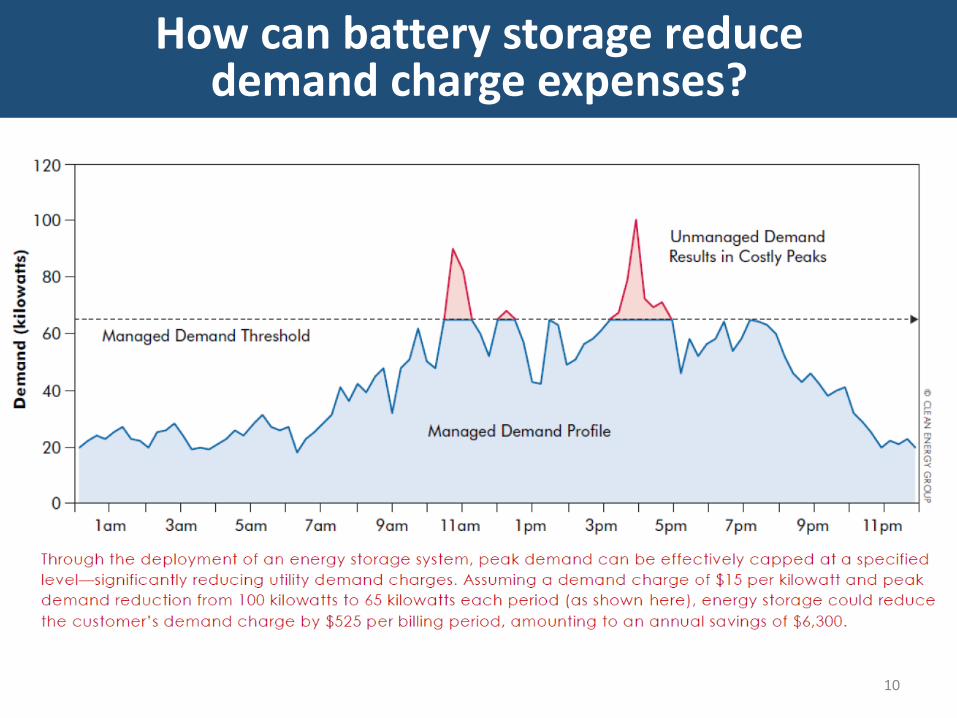
How can battery storage reducedemand charge expenses?
Find us online: www.resilient-power.org
www.cleanegroup.orgwww.facebook.com/clean.energy.group
@cleanenergygrp on Twitter @Resilient_Power on Twitter
11
Seth MullendoreProject Director
Clean Energy Group [email protected]
Contact Information
NREL is a national laboratory of the U.S. Department of Energy, Office of Energy Efficiency and Renewable Energy, operated by the Alliance for Sustainable Energy, LLC.
A Survey of U.S.
Demand Charges
Clean Energy Group Webinar
Joyce McLaren
September 19, 2017
2
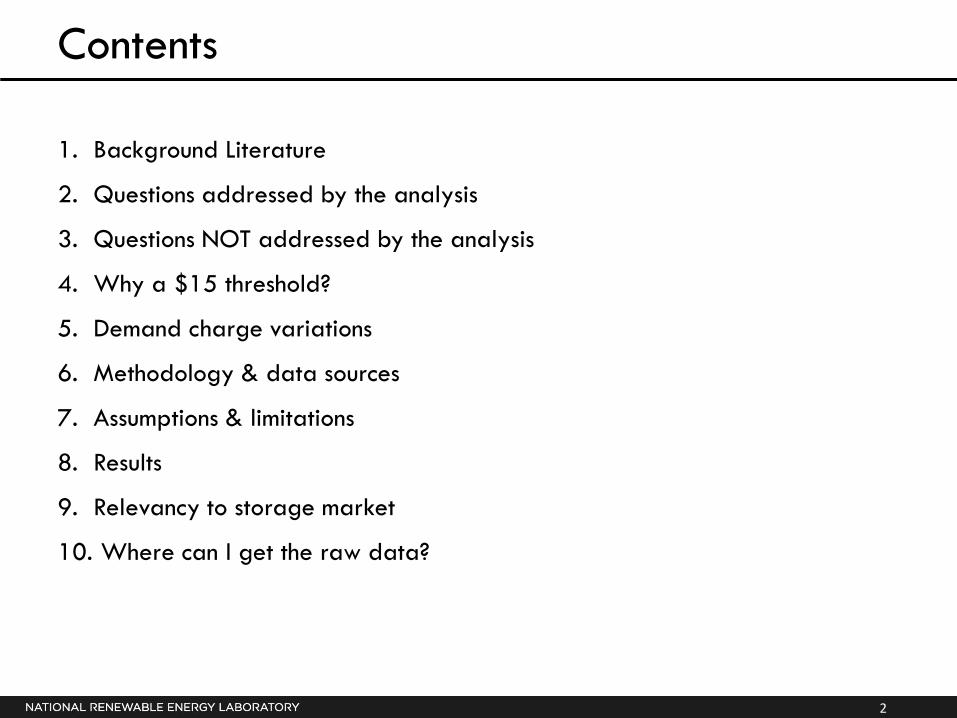
Contents
1. Background Literature
2. Questions addressed by the analysis
3. Questions NOT addressed by the analysis
4. Why a $15 threshold?
5. Demand charge variations
6. Methodology & data sources
7. Assumptions & limitations
8. Results
9. Relevancy to storage market
10. Where can I get the raw data?
3
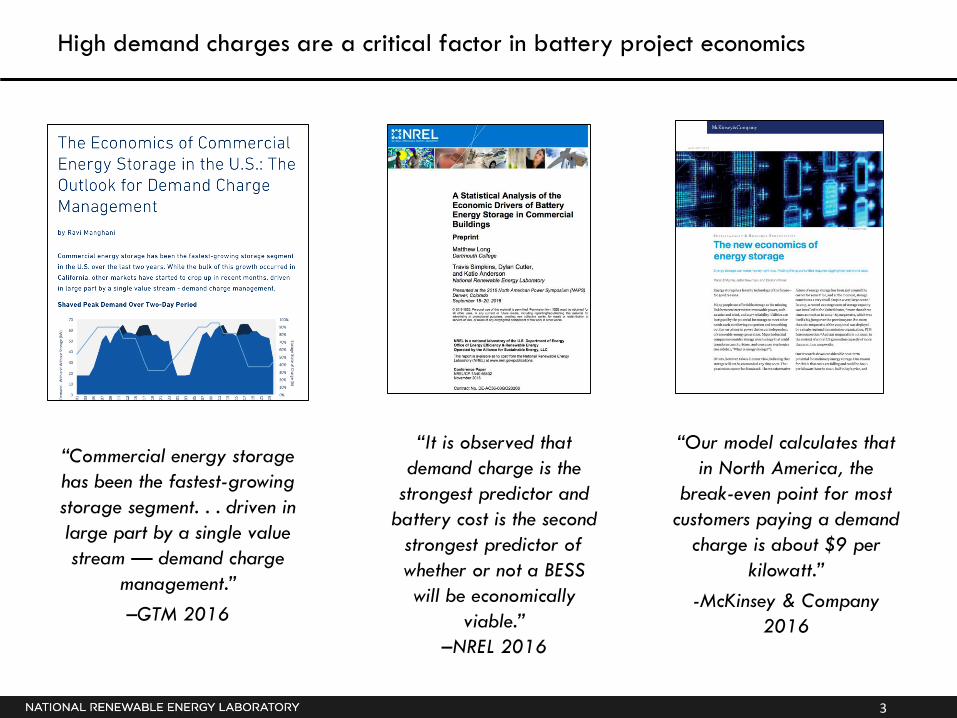
“Commercial energy storage
has been the fastest-growing
storage segment. . . driven in
large part by a single value
stream — demand charge
management.”
–GTM 2016
“Our model calculates that
in North America, the
break-even point for most
customers paying a demand
charge is about $9 per
kilowatt.”
-McKinsey & Company
2016
“It is observed that
demand charge is the
strongest predictor and
battery cost is the second
strongest predictor of
whether or not a BESS
will be economically
viable.”
–NREL 2016
High demand charges are a critical factor in battery project economics
4
Questions addressed by the analysis
• How prevalent are commercial demand charges?
• How are demand charges dispersed across the country?
• How high are demand charges?
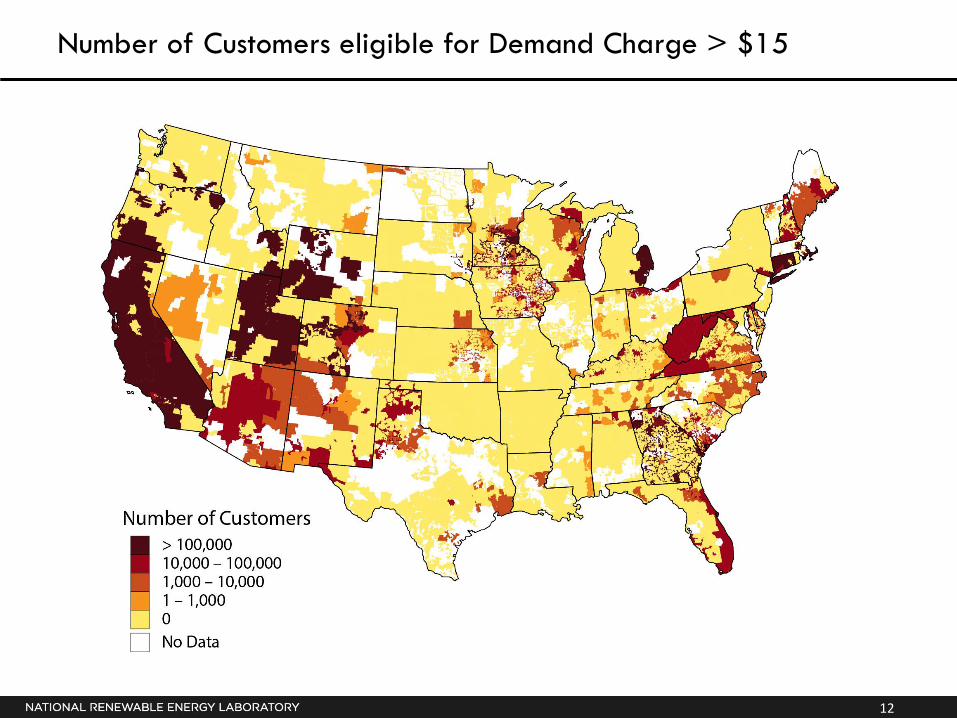
• How many customers are eligible for a rate with a
maximum demand charge of >$15?
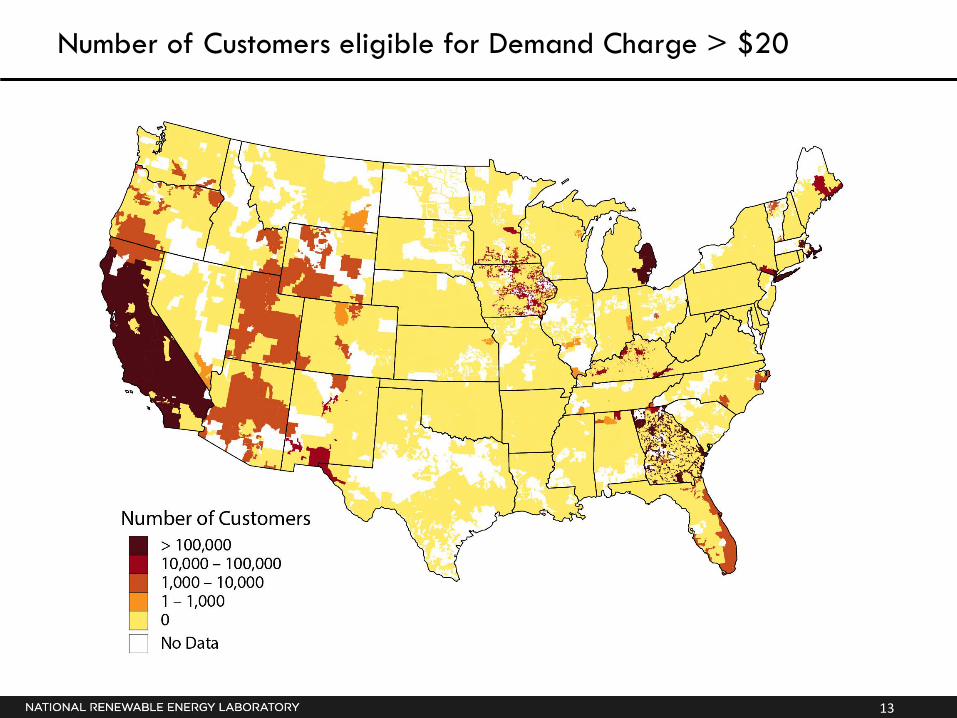
• How about >$20?
5
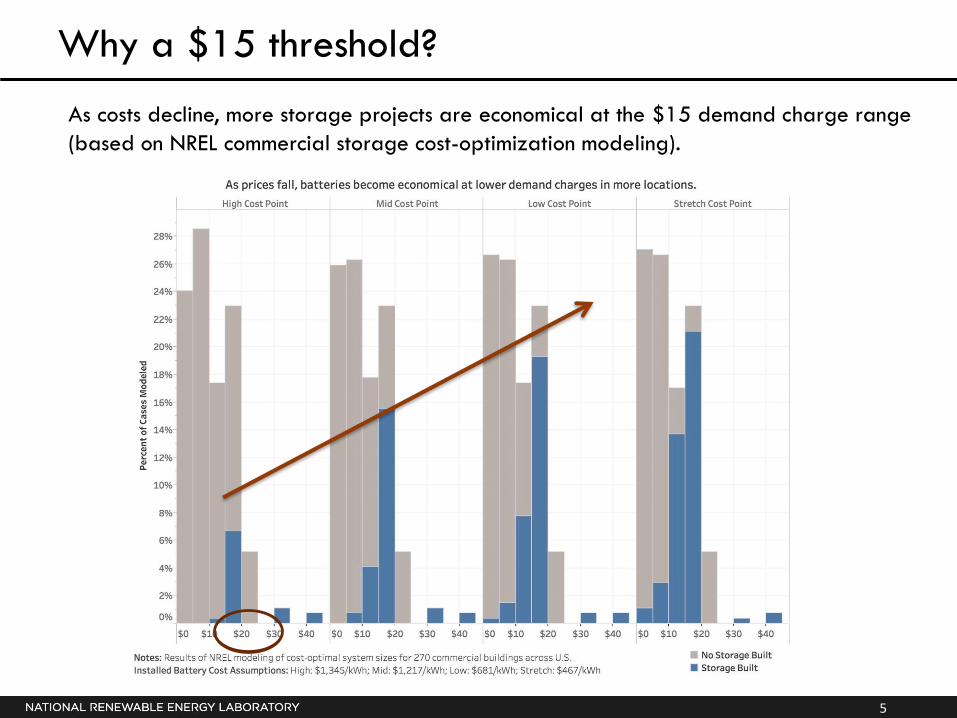
Why a $15 threshold?
As costs decline, more storage projects are economical at the $15 demand charge range
(based on NREL commercial storage cost-optimization modeling).
6
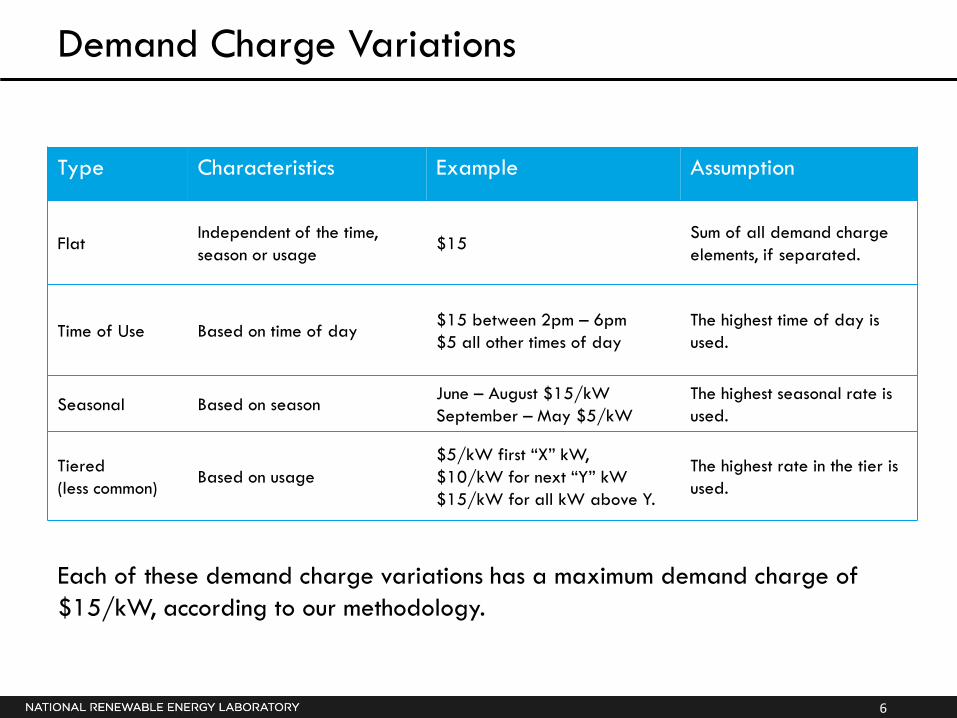
Demand Charge Variations
Type Characteristics Example Assumption
FlatIndependent of the time,
season or usage$15
Sum of all demand charge
elements, if separated.
Time of Use Based on time of day$15 between 2pm – 6pm
$5 all other times of day
The highest time of day is
used.
Seasonal Based on seasonJune – August $15/kW
September – May $5/kW
The highest seasonal rate is
used.
Tiered
(less common)Based on usage
$5/kW first “X” kW,
$10/kW for next “Y” kW
$15/kW for all kW above Y.
The highest rate in the tier is
used.
Each of these demand charge variations has a maximum demand charge of
$15/kW, according to our methodology.
7
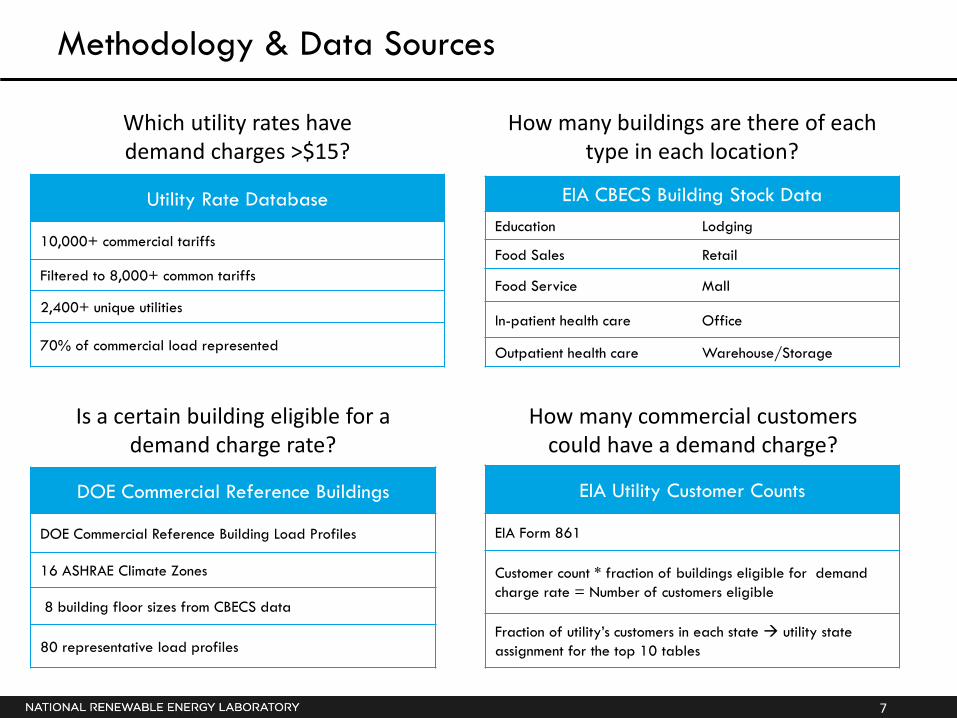
Utility Rate Database
10,000+ commercial tariffs
Filtered to 8,000+ common tariffs
2,400+ unique utilities
70% of commercial load represented
EIA CBECS Building Stock Data
Education Lodging
Food Sales Retail
Food Service Mall
In-patient health care Office
Outpatient health care Warehouse/Storage
DOE Commercial Reference Buildings
DOE Commercial Reference Building Load Profiles
16 ASHRAE Climate Zones
8 building floor sizes from CBECS data
80 representative load profiles
Is a certain building eligible for a demand charge rate?
Which utility rates have demand charges >$15?
How many buildings are there of each type in each location?
How many commercial customers could have a demand charge?
EIA Utility Customer Counts
EIA Form 861
Customer count * fraction of buildings eligible for demand
charge rate = Number of customers eligible
Fraction of utility’s customers in each state utility state
assignment for the top 10 tables
Methodology & Data Sources
8
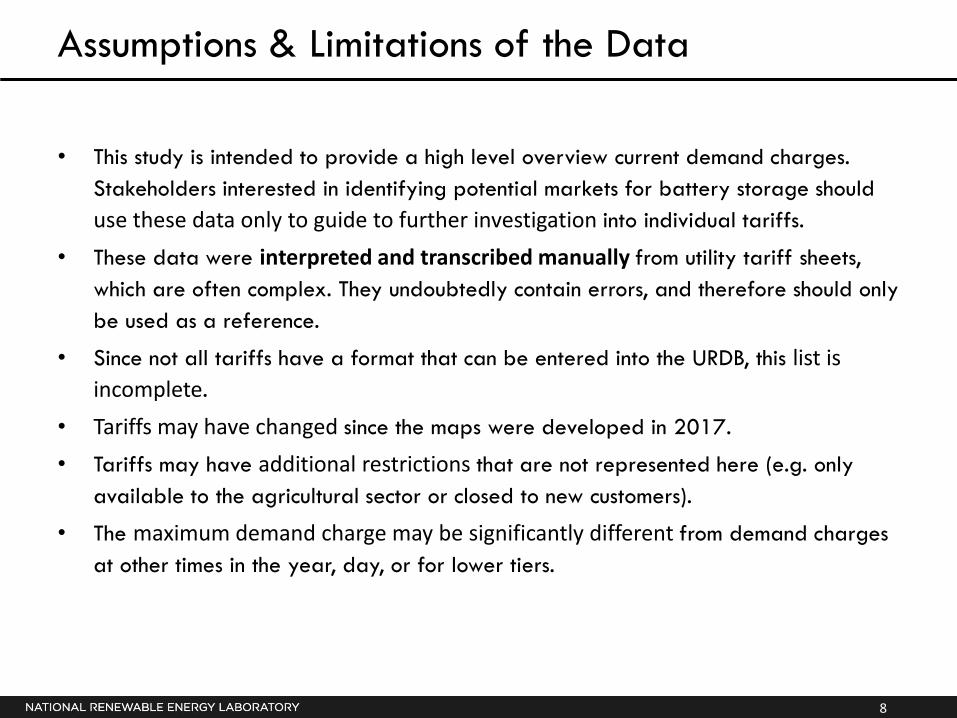
Assumptions & Limitations of the Data
• This study is intended to provide a high level overview current demand charges.
Stakeholders interested in identifying potential markets for battery storage should
use these data only to guide to further investigation into individual tariffs.
• These data were interpreted and transcribed manually from utility tariff sheets,
which are often complex. They undoubtedly contain errors, and therefore should only
be used as a reference.
• Since not all tariffs have a format that can be entered into the URDB, this list is
incomplete.
• Tariffs may have changed since the maps were developed in 2017.
• Tariffs may have additional restrictions that are not represented here (e.g. only
available to the agricultural sector or closed to new customers).
• The maximum demand charge may be significantly different from demand charges
at other times in the year, day, or for lower tiers.
9
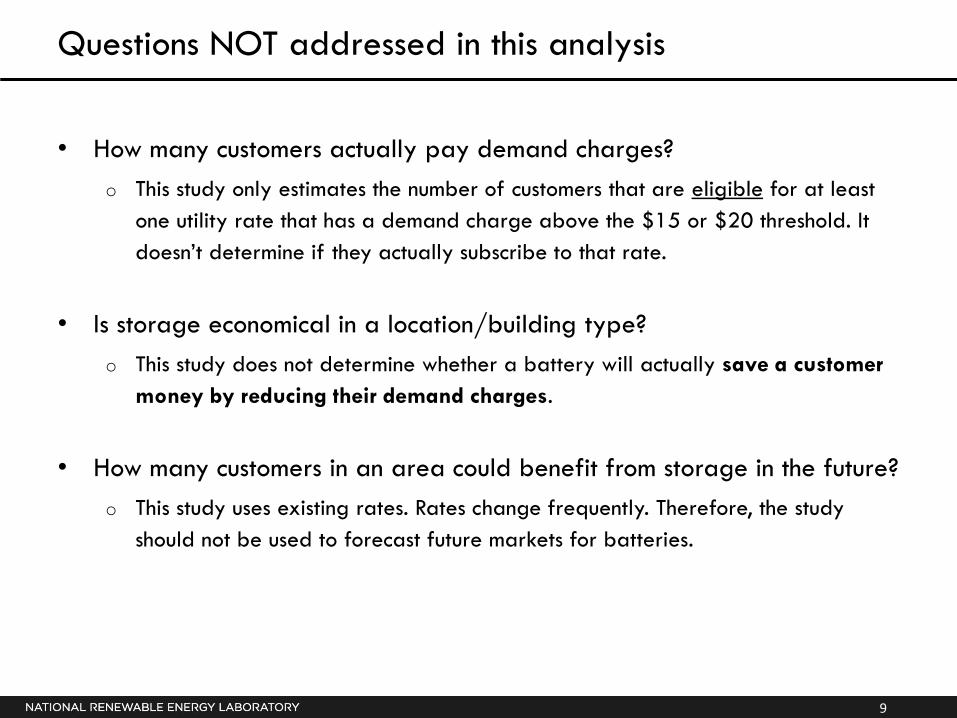
Questions NOT addressed in this analysis
• How many customers actually pay demand charges?
o This study only estimates the number of customers that are eligible for at least
one utility rate that has a demand charge above the $15 or $20 threshold. It
doesn’t determine if they actually subscribe to that rate.
• Is storage economical in a location/building type?
o This study does not determine whether a battery will actually save a customer
money by reducing their demand charges.
• How many customers in an area could benefit from storage in the future?
o This study uses existing rates. Rates change frequently. Therefore, the study
should not be used to forecast future markets for batteries.
10
Maximum demand charges by utility territory
11
States with the Highest Demand Charges
12
Number of Customers eligible for Demand Charge > $15
13
Number of Customers eligible for Demand Charge > $20
14
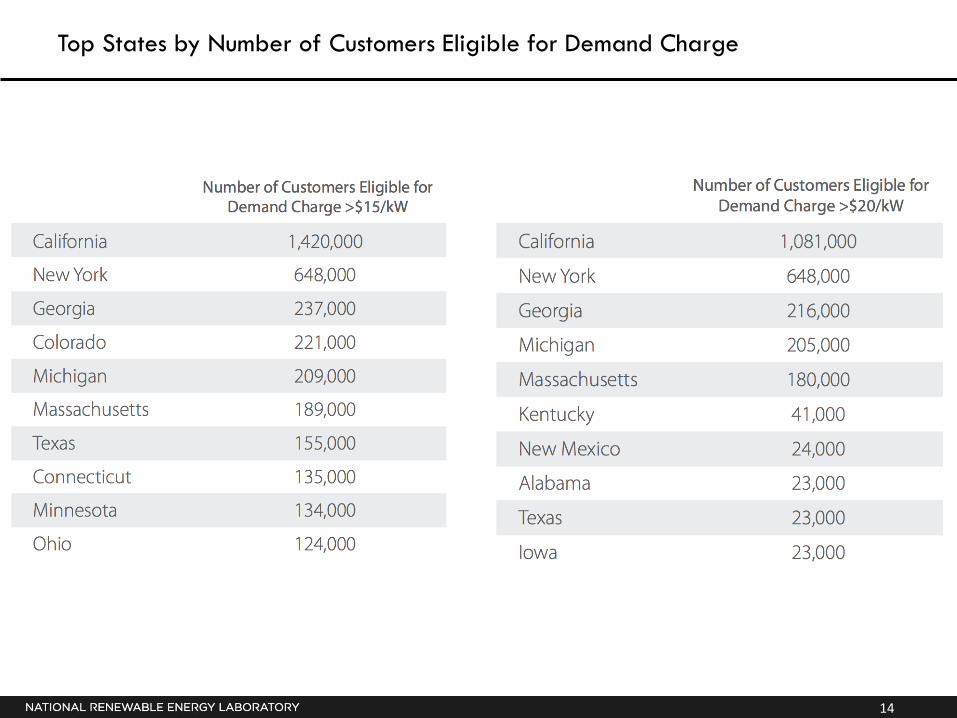
Top States by Number of Customers Eligible for Demand Charge
15
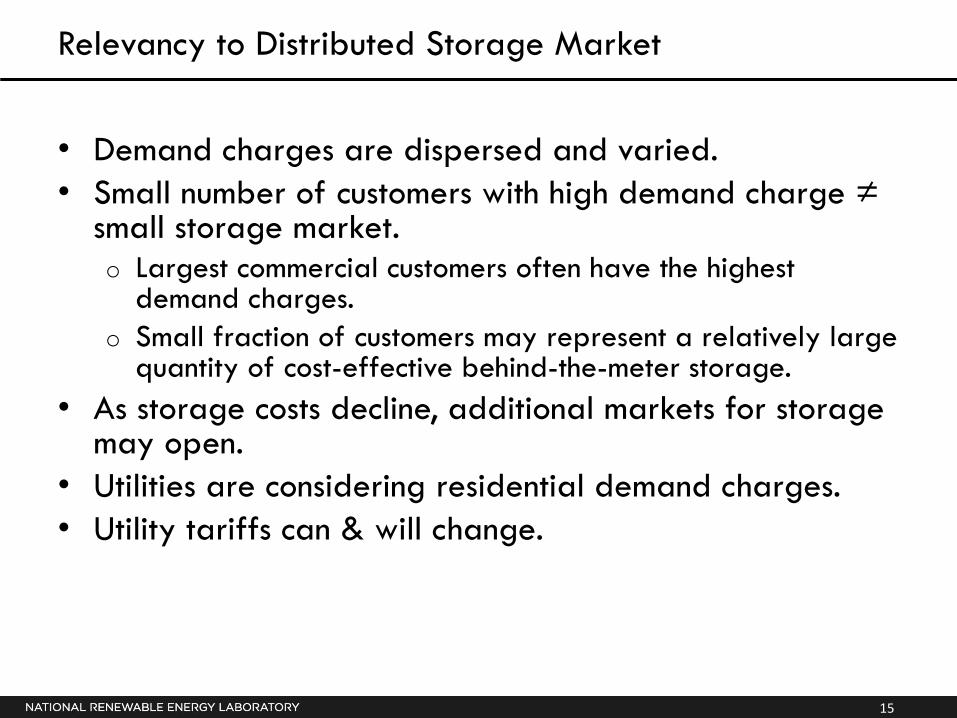
Relevancy to Distributed Storage Market
• Demand charges are dispersed and varied.
• Small number of customers with high demand charge ≠ small storage market. o Largest commercial customers often have the highest
demand charges.
o Small fraction of customers may represent a relatively large quantity of cost-effective behind-the-meter storage.
• As storage costs decline, additional markets for storage may open.
• Utilities are considering residential demand charges.
• Utility tariffs can & will change.
16
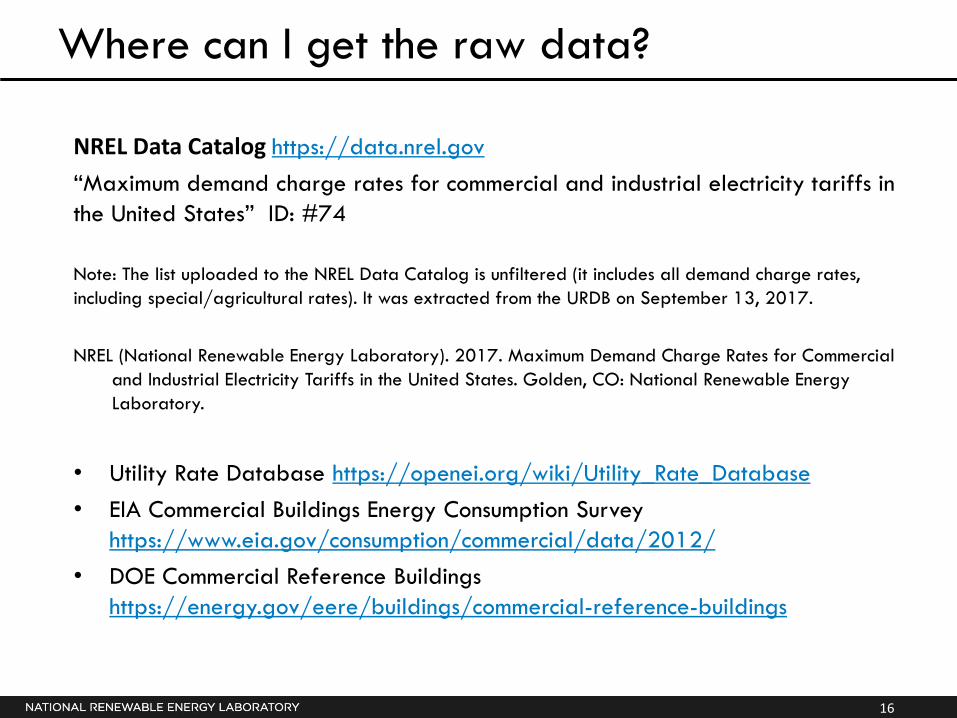
Where can I get the raw data?
NREL Data Catalog https://data.nrel.gov
“Maximum demand charge rates for commercial and industrial electricity tariffs in
the United States” ID: #74
Note: The list uploaded to the NREL Data Catalog is unfiltered (it includes all demand charge rates,
including special/agricultural rates). It was extracted from the URDB on September 13, 2017.
NREL (National Renewable Energy Laboratory). 2017. Maximum Demand Charge Rates for Commercial
and Industrial Electricity Tariffs in the United States. Golden, CO: National Renewable Energy
Laboratory.
• Utility Rate Database https://openei.org/wiki/Utility_Rate_Database
• EIA Commercial Buildings Energy Consumption Survey
https://www.eia.gov/consumption/commercial/data/2012/
• DOE Commercial Reference Buildings
https://energy.gov/eere/buildings/commercial-reference-buildings
17
Questions?
Identifying Potential Markets for Behind-the-Meter
Battery Energy Storage: A Survey of U.S. Demand
Charges
https://www.nrel.gov/docs/fy17osti/68963.pdf
Find us online: www.resilient-power.org
www.cleanegroup.orgwww.facebook.com/clean.energy.group
@cleanenergygrp on Twitter @Resilient_Power on Twitter
Seth MullendoreProject Director
Clean Energy Group [email protected]
Thank you for attending our webinar
Upcoming Webinar
Energy Storage for Rural Affordable Housing: The McKnight Lane Redevelopment Project
Wednesday, September 27, 1-2pm ET
http://bit.ly/Webinar-9-27-17