Embed Size (px)
Citation preview

Identifying social and economic push and pull factors for migration to the UK by Bulgarian and Romanian nationals
www.communities.gov.uk

Identifying social and economic push and pull factors for migration to the UK by Bulgarian and Romanian nationals
Dr. Rukhsana Kausar

This research was commissioned by the previous government. The views and analysis expressed in this report are those of the authors and do not necessarily reflect those of the Department for Communities and Local Government. This document is being published in the interests of transparency. Department for Communities and Local Government Eland House Bressenden Place London SW1E 5DU Telephone: 030 3444 0000 Website: www.communities.gov.uk © Queen’s Printer and Controller of Her Majesty’s Stationery Office, 2011 Copyright in the typographical arrangement rests with the Crown.
This publication, excluding logos, may be reproduced free of charge in any format or medium for research, private study or for internal circulation within an organisation. This is subject to it being reproduced accurately and not used in a misleading context. The material must be acknowledged as Crown copyright and the title of the publication specified.
You may re-use this information (not including logos) free of charge in any format or medium, under the terms of the Open Government Licence. To view this licence, visit http://www.nationalarchives.gov.uk/doc/open-government-licence/ or write to the Information Policy Team, The National Archives, Kew, London TW9 4DU, or e-mail: [email protected].
If you require this publication in an alternative format please email [email protected] DCLG Publications Tel: 030 0123 1124 Fax: 030 0123 1125 Email: [email protected] Online via the website: www.communities.gov.uk ISBN: 978 1 4098 3171 6
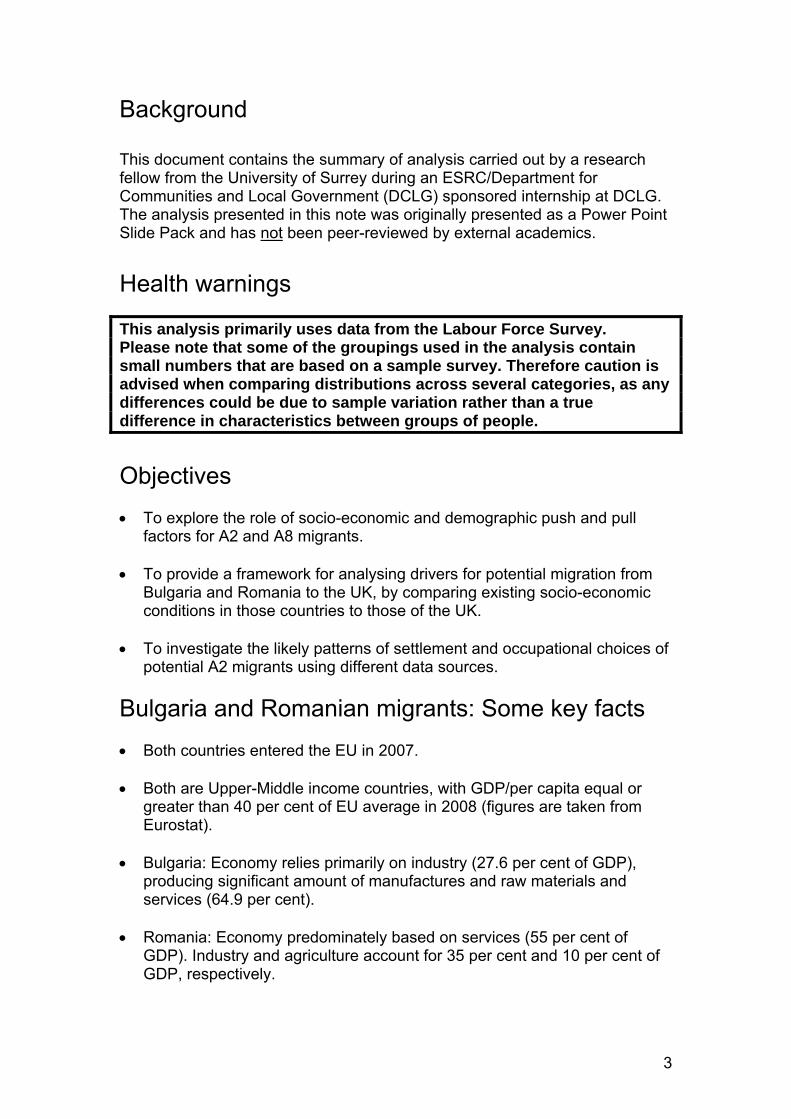
Background This document contains the summary of analysis carried out by a research fellow from the University of Surrey during an ESRC/Department for Communities and Local Government (DCLG) sponsored internship at DCLG. The analysis presented in this note was originally presented as a Power Point Slide Pack and has not been peer-reviewed by external academics. Health warnings This analysis primarily uses data from the Labour Force Survey. Please note that some of the groupings used in the analysis contain small numbers that are based on a sample survey. Therefore caution is advised when comparing distributions across several categories, as any differences could be due to sample variation rather than a true difference in characteristics between groups of people.
Objectives
• To explore the role of socio-economic and demographic push and pull
factors for A2 and A8 migrants. • To provide a framework for analysing drivers for potential migration from
Bulgaria and Romania to the UK, by comparing existing socio-economic conditions in those countries to those of the UK.
• To investigate the likely patterns of settlement and occupational choices of
potential A2 migrants using different data sources. Bulgaria and Romanian migrants: Some key facts • Both countries entered the EU in 2007. • Both are Upper-Middle income countries, with GDP/per capita equal or
greater than 40 per cent of EU average in 2008 (figures are taken from Eurostat).
• Bulgaria: Economy relies primarily on industry (27.6 per cent of GDP),
producing significant amount of manufactures and raw materials and services (64.9 per cent).
• Romania: Economy predominately based on services (55 per cent of
GDP). Industry and agriculture account for 35 per cent and 10 per cent of GDP, respectively.
3

• Labour Force Participation: 7.5 per cent of Bulgarians are employed in Agriculture, 35.5 per cent in industry and 56.9 per cent in services; whilst for Romanians 29.5 per cent of the population works in agriculture, 31.4 per cent in industry and 39.1 per cent in services. In comparison, Poland at the time of accession had 18 per cent of their workforce employed in agriculture, 28.8 per cent in industry and 53.2 per cent in services.
• Access to the UK labour market: limited to the following means:
- work permits and Highly Skilled Migrant Programme - accession worker registration - registration certificates - quota-based restricted access for low-skilled in:
a) Sector-Based Scheme b) Seasonal Agriculture Work Scheme
Table 1: Push and pull factor differentials for A2 and A8 migrants (a comparison between 2004, 2007 and 2010)
Years 2004 2007 2009
Population GDP per capita in purchasing power standards
UnemploymentRate (%)
Exchange Rates (Between £ and A8/A2 National Currencies)
Crude Rate of Net Migration*
UK 59,699,828 60,781,352 62,008,048p
124 117 116
4.7 5.3 7.9
1 1 1
3.8 2.9 2.9
BULGARIA 7,801,273 7,679,290 7.563,710
34 38 41
12.1 6.9 9.9
2.8 2.7 2.3
0.0 -0.2 -2.1
ROMANIA 21,711,252 21,565,119 21,462,186
34 42 46
8.1 6.4 8.2
5.6 4.9 5.0
-0.5 0.0 -0.1
POLAND 38,190,608 38,125,479 38,167,329
51 54 56
19.0 9.6 9.6
5.8 5.0 4.6
-0.2 -0.5 0.0
SLOVAKIA 5,380,053 5,393,637 5,424,925
57 68 72
18.2 11.1 14.5
56.5 46.6 1.1
0.5 1.3 0.8
LITHUANIA 3,445,857 3,384,879 3,329,039
50 59 53
11.4 4.3 17.8
4.9 4.8 4.0
-2.8 -1.6 -4.6
* The net migration plus adjustment is the difference between the total change and the natural change of the population. This is defined as the ratio of net migration plus adjustment during the year to the average population in that year, expressed per 1,000 inhabitants.
4

Key findings from the table above are: • Declining population in Bulgaria and Romania as well as in Poland and
Lithuania over the last six years as shown by negative crude rate of net migration.
• In contrast, the UK’s population has increased over this period, partly, (but
not entirely) due to a higher positive crude rate of net migration. • GDP per capita in purchasing power standards has increased for the A2
and A8 countries while it has decreased for the UK, albeit from a much higher base.
• During 2004-2007, the UK experienced an increase in the unemployment
rate, whereas A2 and A8 countries have experienced falling unemployment rates (possibly due to declining population).
• The recent increases in unemployment rates in all countries can most
likely be attributed to the economic downturn. Table 2: Regional distribution of A2 migrants in the UK (national insurance number registrations for 2002-2010) Romania Bulgaria
Midlands 11.6% Midlands 9.4%
East of England
7.4% East of England
6.5%
South East 13.9% South East 10.2%
London 46.3% London 56.4%
North & Others
19.0% North & Others
16.7%
Key findings from the table above are: • London is the most popular destination for both Romanian and Bulgarian
immigrants. National insurance number registrations show that around half of the national insurance numbers issued to A2 migrants over this period were in London.
• The Northern regions were the second most common destination, with
more than one-tenth of national insurance numbers issued in the North and Other regions.
• It should be noted that national insurance number data contains short term
migrants and not everyone issued with a national insurance number actually arrived in the UK.
5

Trends in migration from the A8 and A2 countries Chart 1: Trends in quarterly migration to the UK amongst A8 migrants (based on national insurance number data)
Migration rate of A8 migrants (2002-2010)
0.000
0.500
1.000
1.500
2.000
2.500
3.000
3.500
Jan 02
‐ Mar 02
Apr 02 ‐ Jun
02
Jul 0
2 ‐ Sep
t 02
Oct 02 ‐ D
ec 02
Jan 03
‐ Mar 03
Apr 03 ‐ Jun
03
Jul 0
3 ‐ Sep
t 03
Oct 03 ‐ D
ec 03
Jan 04
‐ Mar 04
Apr 04 ‐ Jun
04
Jul 0
4 ‐ Sep
t 04
Oct 04 ‐ D
ec 04
Jan 05
‐ Mar 05
Apr 05 ‐ Jun
05
Jul 0
5 ‐ Sep
t 05
Oct 05 ‐ D
ec 05
Jan 06
‐ Mar 06
Apr 06 ‐ Jun
06
Jul 0
6 ‐ Sep
t 06
Oct 06 ‐ D
ec 06
Jan 07
‐ Mar 07
Apr 07 ‐ Jun
07
Jul 0
7 ‐ Sep
t 07
Oct 07 ‐ D
ec 07
Jan 08
‐ Mar 08
Apr 08 ‐ Jun
08
Jul 0
8 ‐ Sep
t 08
Oct 08 ‐ D
ec 08
Jan 09
‐ Mar 09
Apr 09 ‐ Jun
09
Jul 0
9 ‐ Sep
t 09
Oct 09 ‐ D
ec 09
Jan 10
‐ Mar 10
Apr10
‐ Jun 10
Mig
ratio
n ra
te
Latvia Lithuania Poland Slovakia
Key points on the graph above are: • Migration rates are calculated as a percentage of active population in the
respective countries using quarterly national insurance numbers data. • Migration rates fluctuated substantially over the period, with a post-
enlargement surge for all A8 nationality groups, but with different groups reaching peaks at different times.
• An upward trend can be seen for Latvia and Lithuania from 2009, before
falling in the first quarter of 2010 for Latvia.
6

Chart 2: Trends in quarterly migration to the UK amongst A2 migrants (based on national insurance number data)
Migration Rate of A2 Migrants (2002‐2010)
00.10.20.30.4
0.50.60.70.80.9
Jan 02
‐ Mar 02
Apr 02 ‐ Jun
02
Jul 02 ‐ Sep
t 02
Oct 02 ‐ D
ec 02
Jan 03
‐ Mar 03
Apr 03 ‐ Jun
03
Jul 03 ‐ Sep
t 03
Oct 03 ‐ D
ec 03
Jan 04
‐ Mar 04
Apr 04 ‐ Jun
04
Jul 04 ‐ Sep
t 04
Oct 04 ‐ D
ec 04
Jan 05
‐ Mar 05
Apr 05 ‐ Jun
05
Jul 05 ‐ Sep
t 05
Oct 05 ‐ D
ec 05
Jan 06
‐ Mar 06
Apr 06 ‐ Jun
06
Jul 06 ‐ Sep
t 06
Oct 06 ‐ D
ec 06
Jan 07
‐ Mar 07
Apr 07 ‐ Jun
07
Jul 07 ‐ Sep
t 07
Oct 07 ‐ D
ec 07
Jan 08
‐ Mar 08
Apr 08 ‐ Jun
08
Jul 08 ‐ Sep
t 08
Oct 08 ‐ D
ec 08
Jan 09
‐ Mar 09
Apr 09 ‐ Jun
09
Jul 09 ‐ Sep
t 09
Oct 09 ‐ D
ec 09
Jan 10
‐ Mar 10
Apr10
‐ Jun 10
Migration
rate
Bulgaria Romania
Key points on the graph above are:
• Trend in quarterly migration rates (national insurance numbers as
percentage of active population) is quite similar for Bulgaria and Romania. • The migration rate fluctuated substantially for both countries post-
enlargement, with an obvious increase after 2007. • There was a large fall in the migration rate since September 2009 - likely
due to the economic downturn.
7
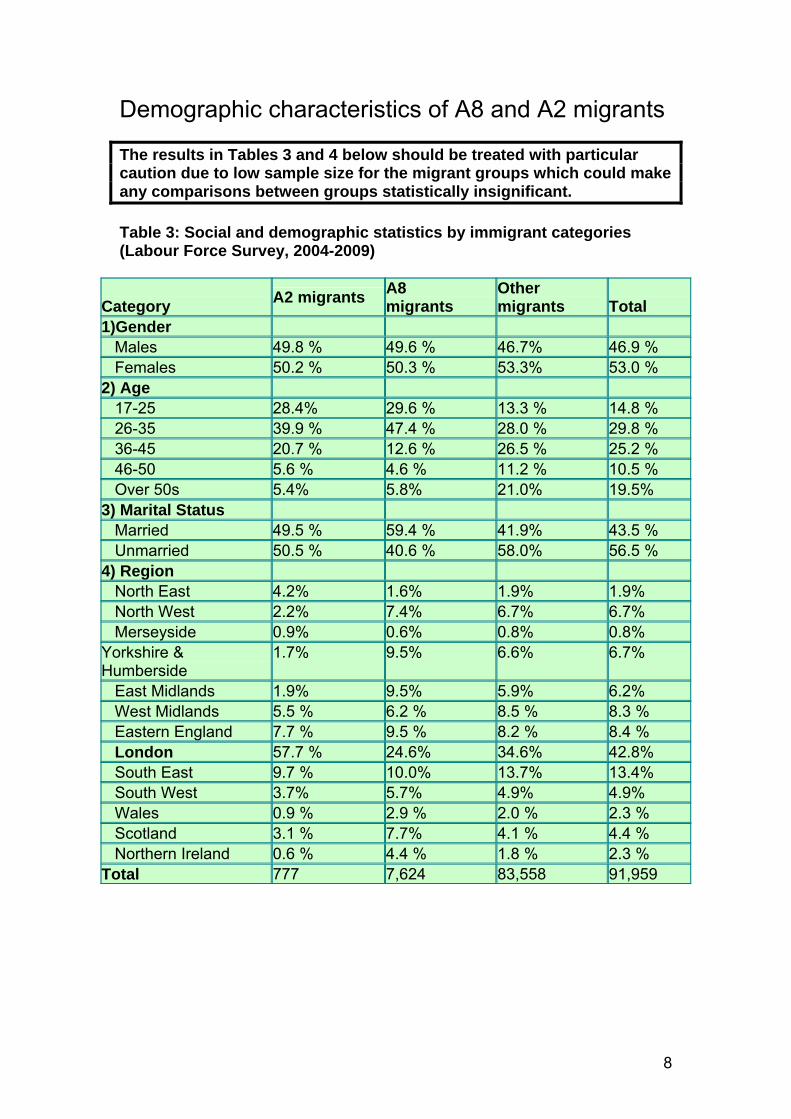
Demographic characteristics of A8 and A2 migrants The results in Tables 3 and 4 below should be treated with particular caution due to low sample size for the migrant groups which could make any comparisons between groups statistically insignificant. Table 3: Social and demographic statistics by immigrant categories (Labour Force Survey, 2004-2009)
Category A2 migrants A8
migrants Other migrants
Total
1)Gender Males 49.8 % 49.6 % 46.7% 46.9 % Females 50.2 % 50.3 % 53.3% 53.0 % 2) Age 17-25 28.4% 29.6 % 13.3 % 14.8 % 26-35 39.9 % 47.4 % 28.0 % 29.8 % 36-45 20.7 % 12.6 % 26.5 % 25.2 % 46-50 5.6 % 4.6 % 11.2 % 10.5 % Over 50s 5.4% 5.8% 21.0% 19.5% 3) Marital Status Married 49.5 % 59.4 % 41.9% 43.5 % Unmarried 50.5 % 40.6 % 58.0% 56.5 % 4) Region North East 4.2% 1.6% 1.9% 1.9% North West 2.2% 7.4% 6.7% 6.7% Merseyside 0.9% 0.6% 0.8% 0.8% Yorkshire & Humberside
1.7% 9.5% 6.6% 6.7%
East Midlands 1.9% 9.5% 5.9% 6.2% West Midlands 5.5 % 6.2 % 8.5 % 8.3 % Eastern England 7.7 % 9.5 % 8.2 % 8.4 % London 57.7 % 24.6% 34.6% 42.8% South East 9.7 % 10.0% 13.7% 13.4% South West 3.7% 5.7% 4.9% 4.9% Wales 0.9 % 2.9 % 2.0 % 2.3 % Scotland 3.1 % 7.7% 4.1 % 4.4 % Northern Ireland 0.6 % 4.4 % 1.8 % 2.3 % Total 777 7,624 83,558 91,959
8

The table above shows that: • Age profile: Nearly two-fifths of A2 and A8, and over a quarter of all other
migrants are in 26-35 years age band. • Settlement patterns: London and the South East are the most popular
destinations for all migrants with London particularly popular amongst A2 migrants (over 50 per cent).
• London, the South East, the East of England, the East Midlands and
Yorkshire and Humberside are the most popular areas of settlement for A8 migrants.
Table 4: Social and demographic statistics (continued) Category
A2 migrants
A8 migrants
Other migrants
Total
5) Education Levels* Low (≤17) 26.8% 33.2% 50.4% 48.8 % Medium (18-20) 34.8% 35.1 % 17.6 % 19.3 % High (≥21) 38.3% 31.7 % 31.9 % 31.9 % 6) No. of Dependent Children
No Child 62.5% 62.4% 54.2% 54.9% 1-2 Children 31.3% 34.2% 34.3% 34.3% 3-4 Children 3.1 % 3.4 % 10.2% 9.5% More than 4 Children 3.1 % 0.0 % 1.3 % 1.2 % Total 777 7,624 83,558 91,959 * Education is divided into low, medium and high level depending upon the age - age left full time education. The table shows that: • Education level: The proportion of those with lower education levels is
lower amongst A2 and A8 migrants than amongst all other migrants. A2 migrants also have a higher proportion of highly educated people compared to other migrants.
• Dependent children: A2 and A8 migrants are more likely to have no
children than other migrants. Nearly two-thirds of A2 and A8 migrants don’t have any dependent children. However, A2 migrants are also more likely to have more than four children.
9
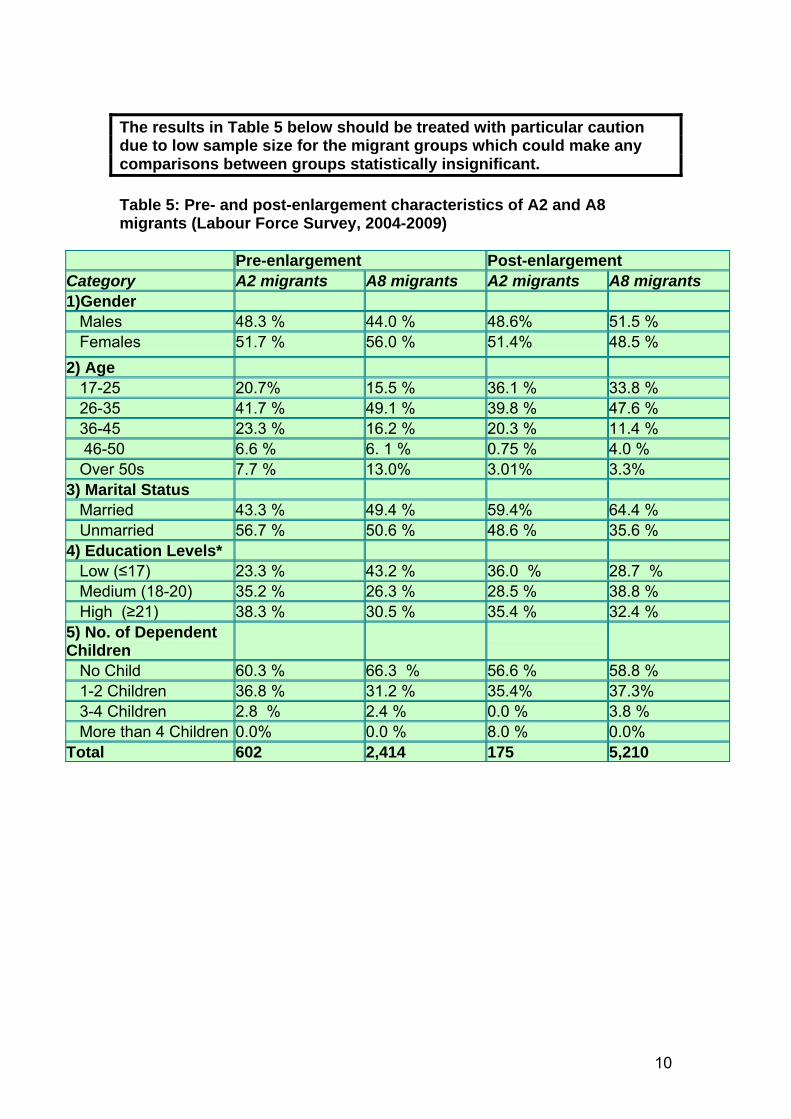
The results in Table 5 below should be treated with particular caution due to low sample size for the migrant groups which could make any comparisons between groups statistically insignificant. Table 5: Pre- and post-enlargement characteristics of A2 and A8 migrants (Labour Force Survey, 2004-2009)
Pre-enlargement Post-enlargement Category A2 migrants A8 migrants A2 migrants A8 migrants 1)Gender Males 48.3 % 44.0 % 48.6% 51.5 % Females 51.7 % 56.0 % 51.4% 48.5 % 2) Age 17-25 20.7% 15.5 % 36.1 % 33.8 % 26-35 41.7 % 49.1 % 39.8 % 47.6 % 36-45 23.3 % 16.2 % 20.3 % 11.4 % 46-50 6.6 % 6. 1 % 0.75 % 4.0 % Over 50s 7.7 % 13.0% 3.01% 3.3% 3) Marital Status Married 43.3 % 49.4 % 59.4% 64.4 % Unmarried 56.7 % 50.6 % 48.6 % 35.6 % 4) Education Levels* Low (≤17) 23.3 % 43.2 % 36.0 % 28.7 % Medium (18-20) 35.2 % 26.3 % 28.5 % 38.8 % High (≥21) 38.3 % 30.5 % 35.4 % 32.4 % 5) No. of Dependent Children
No Child 60.3 % 66.3 % 56.6 % 58.8 % 1-2 Children 36.8 % 31.2 % 35.4% 37.3% 3-4 Children 2.8 % 2.4 % 0.0 % 3.8 % More than 4 Children 0.0% 0.0 % 8.0 % 0.0% Total 602 2,414 175 5,210
10

The results in Table 6 below should be treated with particular caution due to low sample size for the migrant groups which could make any comparisons between groups statistically insignificant. Table 6: Pre- and post-enlargement regional distribution of A2 and A8 migrants (Labour Force Survey, 2004-2009)
Pre-enlargement Post-enlargement Category A2 migrants A8 migrants A2 migrants A8 migrants Region North East 1.16 % 1.6 % 8.0 % 2.1% North West 3.9% 6.4% 1.7% 8.7% Yorkshire & Humberside 2.9% 5.8% 2.3% 11.4% East Midlands 2.3% 5.8% 1.1% 11.0 % West Midlands 3.1 % 5.6 % 6.3 % 7.1 % Eastern England 5.3% 4.9 % 16.57% 9.7 % London 60.5 % 44.9% 42.8% 16.1% South East 4.8% 11.9% 6.8% 9.9% South West 0.8% 3.9% 5.1% 6.0% Wales 3.2 % 1.5 % 1.1 % 3.6 % Scotland 0.8 % 4.0% 6.8 % 8.2 %
11

The results relating to A2 and A8 migrants in Table 7 below should be treated with particular caution due to low sample size amongst this group especially when looking at the propensity to claim particular types of benefits from what is an already small pool of migrant benefit claimants. Table 7: Benefit claimants by type of immigrant and UK-born (Labour Force Survey, 2004-2009)
UK-born A2 migrants A8 migrants Other migrants
Total
1) Claiming Benefits Yes
40.4%
15.4%
23.1%
38.8%
39.8%
2) Type of Social Benefits Claimed
i) Unemployment related
3.7% 5.7 % 3.7% 5.3% 3.9 %
ii) Income Support 9.9 % 5.7 % 4.4 % 13.2% 10.4 % iii) Sickness 13.8% 5.7 % 2.4 % 8.6 % 12.9 % iv) State Pension 28.6% 9.4 % 7.4 % 17.0% 26.6 % v) Family related (working and child tax credits etc)
0.3 % 0.0% 0.4% 0.4 % 0.3 %
vi) Child Benefit 41.2% 69.8% 77.2% 50.4% 42.9 % vii) Housing/council 1.2 % 1.8% 2.6% 2.6 % 1.4 % viii) Others 1.2 % 1.8 % 1.9 % 2.7 % 1.5 % 3) Type of Housing Benefits Claimed
i) Housing Benefit 81.6% 91.6% 91.6% 84.9% 82.4% ii) Council Tax Benefit 18.4% 8.3% 10.6% 15.1% 17.6% Total 78,232 396 3710 41,097 93,419
The table above shows that: • A much higher share of the UK-born and the other migrants group claim
benefits relative to A2 and A8 migrants. • The majority of those claiming benefits are UK-born and other migrants. • Apart from child benefit, sickness, state pension and income support are
the major types of benefits claimed by the UK-born. • Of the relatively small pool of A2 and A8 migrants who claim benefits, the
majority claim child benefit. • Of the relatively small pool of A2 and A8 migrants who claim benefits, the
share of A2 migrants claiming unemployment benefits is higher compared
12

to other migrant groups. However, as the sample size for the A2 group is particularly small these comparisons need to be treated with caution.
• Of the relatively small pool of A2 and A8 migrants who claim benefits, a
slightly higher proportion of A2 migrants claim housing/council tax benefits compared to other migrant groups. The comparison with the UK-born is unlikely to be statistically significant given the very small differences in the claimant rates between the two groups and the large standard error likely to be associated with the estimate for the A2 group.
Type of housing benefits claimed • Of those individuals claiming housing benefits, more than three-quarters
from each group (i.e. UK-born, A2 migrants, A8 migrants and other migrants) claims housing benefit.
• The UK-born and other migrant groups are more likely to claim council tax
benefits than A8 and A2 migrants. The results in Table 8 below should be treated with particular caution due to low sample size for the migrant groups which could make comparisons with the UK-born statistically insignificant. Table 8: Economic activity/inactivity by immigrant category and UK-born (Labour Force Survey, 2004-2009) Activity reported UK-
born A2 migrants
A8 migrants
Other migrants
Total
Employed 79.7% 85.3% 84.0% 71.0% 78.3% Unemployed 3.5% 3.5% 5.0% 5.6% 3.8% Student 0.3% 0.5% 0.2% 0.5% 0.3% Looking after family/home
3.9% 1.5% 2.1% 4.8% 4.0%
Temp sick/injured/disabled
0.7% 0.9% 0.6% 1.2% 0.7%
Long term sick/injured/disabled
6.7% 5.8% 5.8% 10.8% 7.4%
Not looking for jobs 5.2% 2.4% 2.0% 6.0% 5.3% Total 273,310 570 5,551 55,184 334,615 The table above shows: • A2 and A8 migrants are more likely to be in employment than the UK-born
and other migrants. Furthermore, they are less likely to not be looking for jobs, suggesting that economic motive is the key motivation behind their migration to the UK. However, these differences could be the result of
13

sample variability rather than reflect the true difference in employment status between the UK-born and various migrant groups.
• Over this period, A2 migrants were as likely to be unemployed as the UK-
born, whereas A8 migrants appear to have had both a higher employment rate and a higher unemployment rate than the UK-born and the A2 group. However, these differences could again be the result of sample variability rather than reflect the true differences in unemployment between the UK-born and the various migrant groups.
• The percentage of those who stated long-term illness as the reason for
inactivity is roughly the same for the UK-born, A2 and A8 migrants but is higher for the other migrants group.
• Inactivity due to long term sick/injured /disability is the highest form of
economic inactivity for all groups. The results relating to A2 migrants in Table 9 below should be treated with particular caution due to low sample size amongst this group which could makes comparisons with the UK-born and other migrant groups statistically insignificant. Table 9: Economic activity/inactivity by immigrant category and UK-born (Labour Force Survey, 2010) Activity reported UK-born A2
migrants A8 migrants
Other migrants Total
Employed
79.0%
84.2%
83.8%
71.8%
78.4%
Unemployed
5.9%
4.4%
5.6%
6.4%
5.9%
Student
0.2%
0.6 %
0.4%
0.3%
0.2%
Looking after family/home
1.6%
0.6%
1.9%
2.5%
1.7%
Temp sick/injured/ disabled
0.8%
1.2%
0.7%
1.0%
0.9%
long term sick/ injured/disabled
6.4%
6.3%
6.1%
12.0%
6.9%
Not looking for jobs
5.9%
2.5%
1.5%
5.9%
5.9%
Total
57,690
158
1118
6,681
65,647
14
The table above shows: • In 2010 employment decreased marginally and unemployment has
increased for all categories, possibly due to economic downturn. However, this decrease may not be statistically significant.
• Percentage of temp/sick/injured/ disabled increased for all except the other
migrants category and long term sick/ injured decreased for the UK-born, while it remained the greatest for other migrants in 2010.
• The number of those looking after family and the home fell by nearly half
for all, except for A8 migrants over the period. • Inactivity due to long term sick/injured /disability is the highest form of
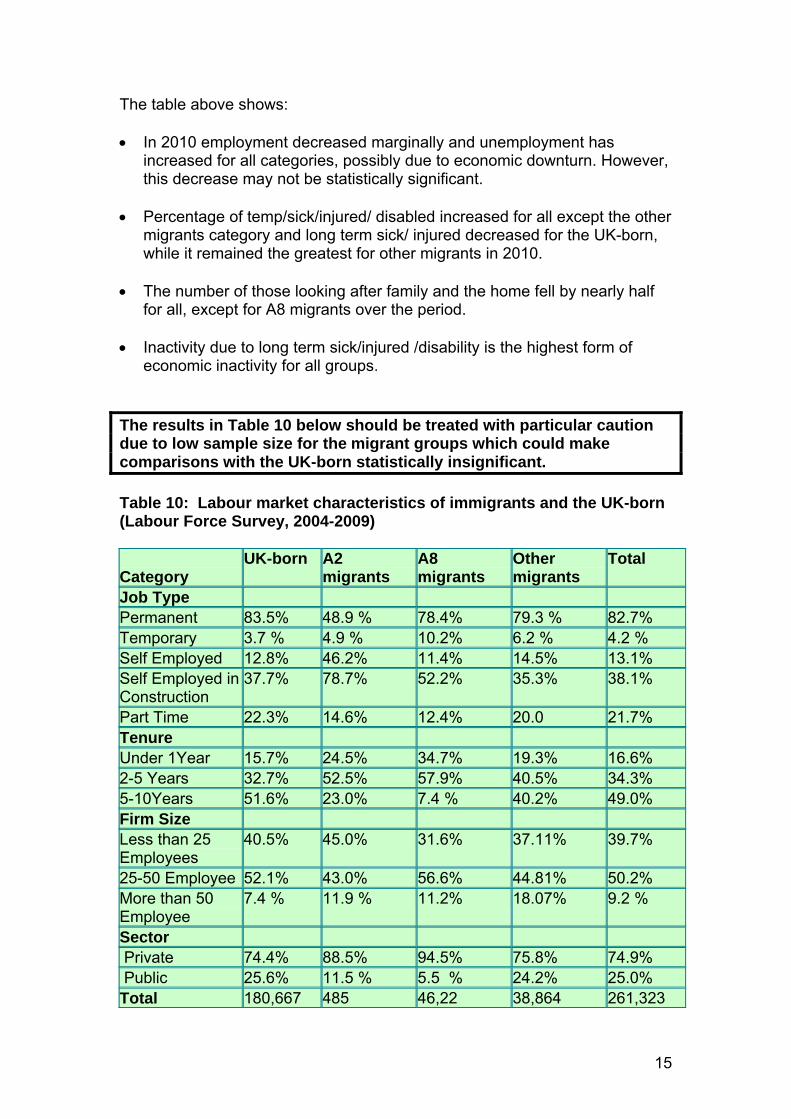
economic inactivity for all groups. The results in Table 10 below should be treated with particular caution due to low sample size for the migrant groups which could make comparisons with the UK-born statistically insignificant. Table 10: Labour market characteristics of immigrants and the UK-born (Labour Force Survey, 2004-2009) Category
UK-born A2 migrants
A8 migrants
Other migrants
Total
Job Type Permanent 83.5% 48.9 % 78.4% 79.3 % 82.7% Temporary 3.7 % 4.9 % 10.2% 6.2 % 4.2 % Self Employed 12.8% 46.2% 11.4% 14.5% 13.1% Self Employed in Construction
37.7% 78.7% 52.2% 35.3% 38.1%
Part Time 22.3% 14.6% 12.4% 20.0 21.7% Tenure Under 1Year 15.7% 24.5% 34.7% 19.3% 16.6% 2-5 Years 32.7% 52.5% 57.9% 40.5% 34.3% 5-10Years 51.6% 23.0% 7.4 % 40.2% 49.0% Firm Size Less than 25 Employees
40.5% 45.0% 31.6% 37.11% 39.7%
25-50 Employee 52.1% 43.0% 56.6% 44.81% 50.2% More than 50 Employee
7.4 % 11.9 % 11.2% 18.07% 9.2 %
Sector Private 74.4% 88.5% 94.5% 75.8% 74.9% Public 25.6% 11.5 % 5.5 % 24.2% 25.0% Total 180,667 485 46,22 38,864 261,323
15
The table above shows: • Over three-quarters of the UK-born, A8 and other migrants in employment
are permanently employed. • Temporary employment is highest for A8 migrants and nearly half of the
A2 migrants are self-employed. Among the self-employed group, more than half of A2 and A8 migrants are employed in construction.
• Nearly one-fifth of the UK-born and other migrants are part-time employed. • More than half of A2 and A8 migrants have two to five years of job tenure -
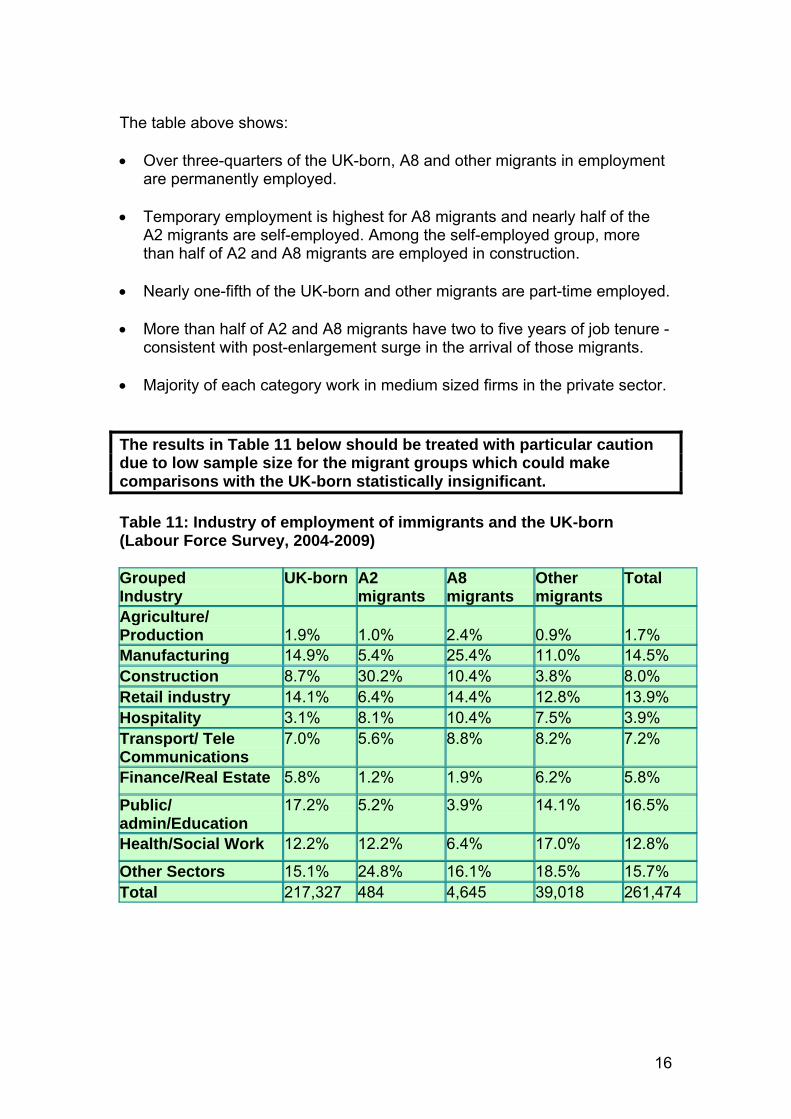
consistent with post-enlargement surge in the arrival of those migrants. • Majority of each category work in medium sized firms in the private sector. The results in Table 11 below should be treated with particular caution due to low sample size for the migrant groups which could make comparisons with the UK-born statistically insignificant. Table 11: Industry of employment of immigrants and the UK-born (Labour Force Survey, 2004-2009) Grouped Industry
UK-born A2 migrants
A8 migrants
Other migrants
Total
Agriculture/ Production
1.9%
1.0%
2.4%
0.9%
1.7%
Manufacturing 14.9% 5.4% 25.4% 11.0% 14.5% Construction 8.7% 30.2% 10.4% 3.8% 8.0% Retail industry 14.1% 6.4% 14.4% 12.8% 13.9% Hospitality 3.1% 8.1% 10.4% 7.5% 3.9% Transport/ Tele Communications
7.0% 5.6% 8.8% 8.2% 7.2%
Finance/Real Estate 5.8% 1.2% 1.9% 6.2% 5.8%
Public/ admin/Education
17.2% 5.2% 3.9% 14.1% 16.5%
Health/Social Work 12.2% 12.2% 6.4% 17.0% 12.8%
Other Sectors 15.1% 24.8% 16.1% 18.5% 15.7% Total 217,327 484 4,645 39,018 261,474
16

The table above shows: • Amongst A8 migrants, manufacturing is the most common sector of
employment. • A2 migrants are concentrated in construction and other sectors. • The share of A2 and A8 migrants in finance and real estate is low
compared to the UK-born and other migrants. • The share of migrants who work in public/admin/education is low relative
to the UK-born. • The share of UK-born and A2 migrants who work in health and social work
is the same, although this finding should be treated with caution given the low sample of A2 migrants.
17
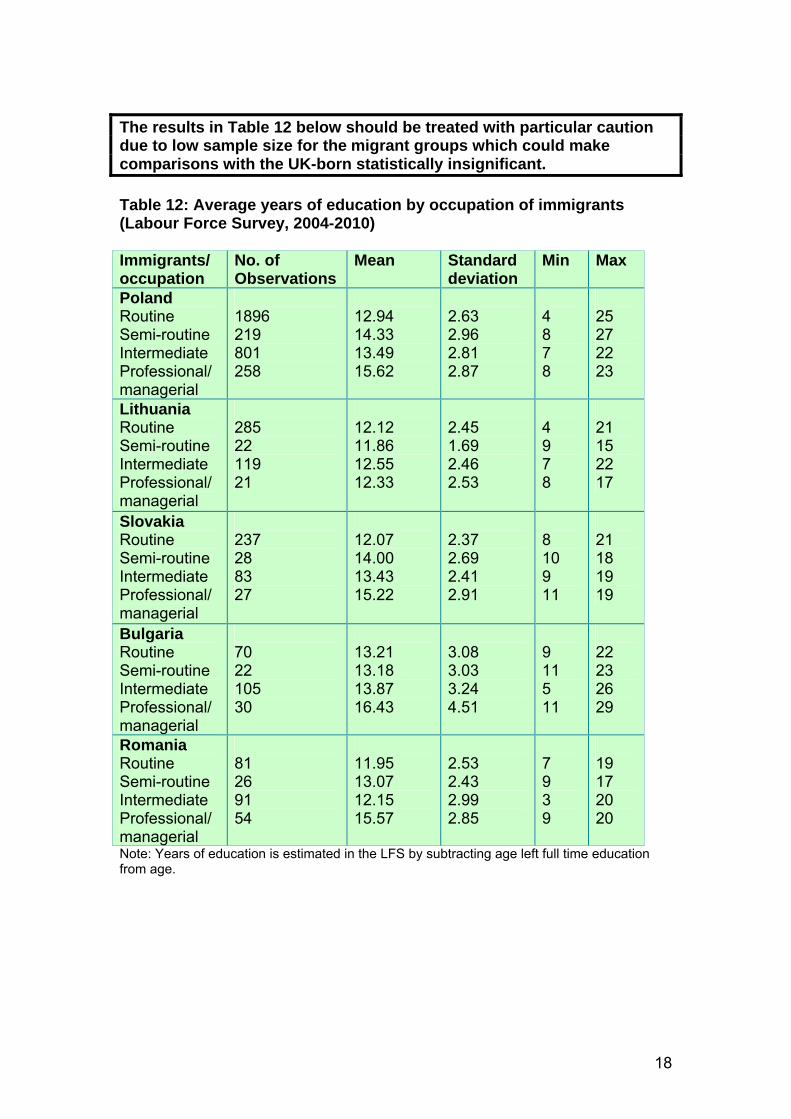
The results in Table 12 below should be treated with particular caution due to low sample size for the migrant groups which could make comparisons with the UK-born statistically insignificant. Table 12: Average years of education by occupation of immigrants (Labour Force Survey, 2004-2010) Immigrants/ occupation
No. of Observations
Mean Standard deviation
Min Max
Poland Routine Semi-routine Intermediate Professional/ managerial
1896 219 801 258
12.94 14.33 13.49 15.62
2.63 2.96 2.81 2.87
4 8 7 8
25 27 22 23
Lithuania Routine Semi-routine Intermediate Professional/ managerial
285 22 119 21
12.12 11.86 12.55 12.33
2.45 1.69 2.46 2.53
4 9 7 8
21 15 22 17
Slovakia Routine Semi-routine Intermediate Professional/managerial
237 28 83 27
12.07 14.00 13.43 15.22
2.37 2.69 2.41 2.91
8 10 9 11
21 18 19 19
Bulgaria Routine Semi-routine Intermediate Professional/managerial
70 22 105 30
13.21 13.18 13.87 16.43
3.08 3.03 3.24 4.51
9 11 5 11
22 23 26 29
Romania Routine Semi-routine Intermediate Professional/managerial
81 26 91 54
11.95 13.07 12.15 15.57
2.53 2.43 2.99 2.85
7 9 3 9
19 17 20 20
Note: Years of education is estimated in the LFS by subtracting age left full time education from age.
18

The table above shows the following: • Average number of years of education by occupation is highest for
Bulgarians and lowest for Romanians in routine and intermediate jobs. • In semi-routine jobs, on average Polish migrants are the most, and
Lithuanians are the least educated migrants. • For professional and managerial occupations, Bulgarian migrants are the
most educated group whilst Lithuanians are the least educated immigrant group.
The results in Table 13 below should be treated with particular caution due to low sample size for the migrant groups which could make comparisons with the UK-born statistically insignificant. Table 13: Occupational attainment by immigrant category and UK-born (Labour Force Survey, 2004-2009) Category UK-born A2
migrants A8 migrants
Other migrants
Total
Managers and senior officials
14.8% 8.1% 3.9% 15.1% 14.7%
Professional occupations
12.0% 8.5% 4.2% 17.4% 12.7%
Associate professional and technical
13.6% 6.4% 4.4% 15.7% 13.7%
Administrative and secretarial
12.7% 7.5% 5.6% 9.2% 12.1%
Skilled trade occupations
12.0% 26.4% 14.8% 7.4% 11.4%
Personal service occupations
7.9% 8.8% 7.5% 8.3% 7.9%
Sales and customer service occupations
7.8% 3.1% 3.9% 6.7% 7.5%
Process, plant and machine operatives
7.9% 6.4% 17.8% 7.7% 8.1%
Elementary occupations
11.1% 24.8% 37.8% 12.5% 11.8%
Total 134,613 295 2,926 24,403 162,237
19

The table above shows: • The UK-born are employed in higher level jobs such as managers and
senior officials in proportions compared to A2 and A8 migrants. • Over 15 per cent of other migrants are employed in associate professional
and technical jobs whilst A2 and A8 migrants are much more concentrated in low skilled occupations and more than one-third of A8 and a quarter of A2 migrants are in elementary occupations.
• The UK-born are also more concentrated in administrative and secretarial
jobs compared to other migrants. • Over a quarter of A2 migrants work in skilled trade occupations. • The smallest fraction of A2 and A8 migrants is found in sales and
customer service occupations. Summary findings: Labour Force Survey analysis Social and demographic characteristics
• Social and demographic characteristics of A2 and A8 migrants are similar.
Around half of the A2 and A8 migrants are in the 17-35 age group, married, female, and without any children. The A2 migrants are both more likely to have no children and to have more than four children, compared to other migrant groups. However, due to particularly small sample sizes for this group, it is impossible to say whether these likelihoods are statistically significant.
• London and South East are the most popular destination for the A2 and A8
migrant groups, but London dominates as the destination choice for A2 migrants, with more than half of the A2 migrants based in London.
• A2 and A8 migrants have a lower proportion of low educated people
compared to other migrants. A2 migrants also have a higher proportion of highly educated people compared to other migrants.
Labour market characteristics • Employment is high amongst A2 and A8 migrants - a higher proportion of
migrants from the two groups is employed compared to the UK-born and other migrant groups, although this difference may not be statistically significant.
• Around half of the A2 and A8 migrant groups have two to five years job
tenure and are working in medium-size firms in private sector.
20
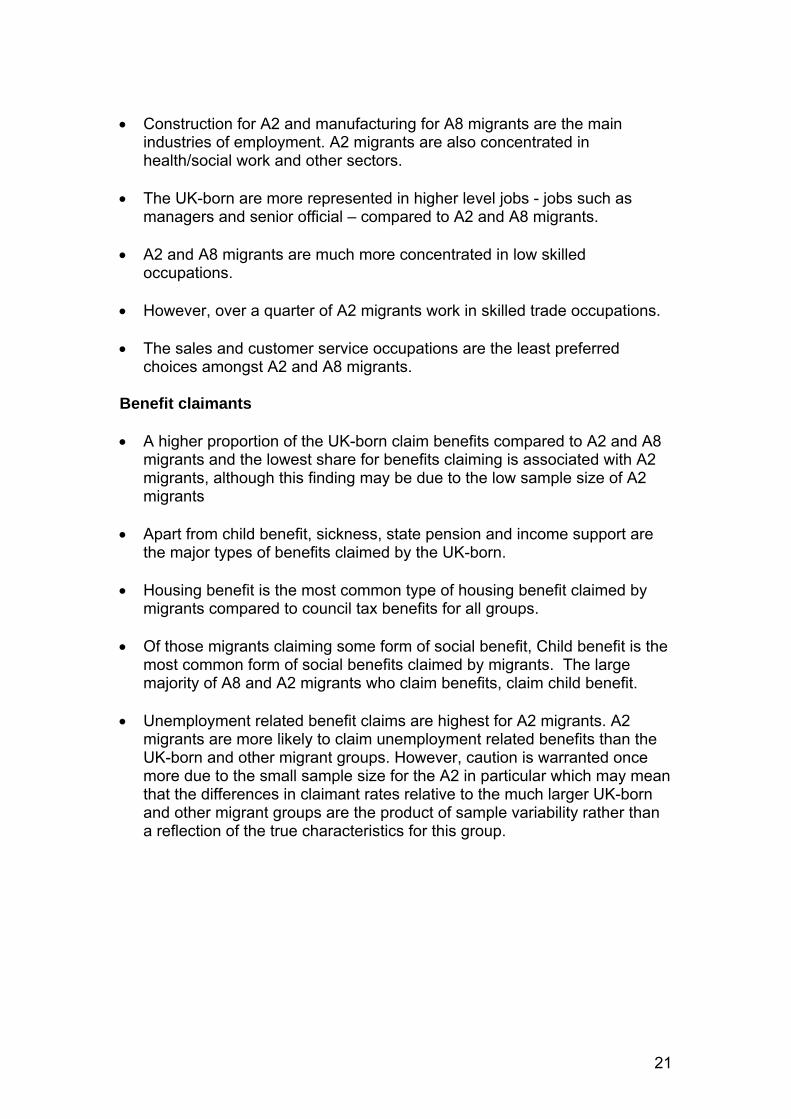
• Construction for A2 and manufacturing for A8 migrants are the main
industries of employment. A2 migrants are also concentrated in health/social work and other sectors.
• The UK-born are more represented in higher level jobs - jobs such as
managers and senior official – compared to A2 and A8 migrants. • A2 and A8 migrants are much more concentrated in low skilled
occupations. • However, over a quarter of A2 migrants work in skilled trade occupations. • The sales and customer service occupations are the least preferred
choices amongst A2 and A8 migrants. Benefit claimants • A higher proportion of the UK-born claim benefits compared to A2 and A8
migrants and the lowest share for benefits claiming is associated with A2 migrants, although this finding may be due to the low sample size of A2 migrants
• Apart from child benefit, sickness, state pension and income support are
the major types of benefits claimed by the UK-born. • Housing benefit is the most common type of housing benefit claimed by
migrants compared to council tax benefits for all groups. • Of those migrants claiming some form of social benefit, Child benefit is the
most common form of social benefits claimed by migrants. The large majority of A8 and A2 migrants who claim benefits, claim child benefit.
• Unemployment related benefit claims are highest for A2 migrants. A2
migrants are more likely to claim unemployment related benefits than the UK-born and other migrant groups. However, caution is warranted once more due to the small sample size for the A2 in particular which may mean that the differences in claimant rates relative to the much larger UK-born and other migrant groups are the product of sample variability rather than a reflection of the true characteristics for this group.
21

Using the A8 experience to gauge potential inflows from the A2 Empirical methodology • To evaluate the potential migration flows from Bulgaria and Romania an
econometric analysis of the determinants of A8 migration to the UK is used to gauge the potential future migration flows from the A2 countries to the UK.
• In the second step an out of sample prediction is made using the
estimated coefficients of determinants of A8 migration to simulate the potential emigration rates from Bulgaria and Romania.
• The equation is estimated for three periods; the entire period (2002-2009),
the pre-enlargement period (2002-2004Q2) and for the post-enlargement period (2004Q3-2009).
Limitations • Data limitations and shortcomings. • Assumption of static and permanent migration decision. • Conceptual problems of specification. • The potential effect of other EU countries’ decisions. Econometric methodology
• Following Bauer and Zimmermann’s (1999) methodology, the following
equation was estimated using a fixed effects estimator for a quarterly panel data set of 330 observations.
εβββββ shtsththt
st
ht
sts
st
sht SActiveMStockZrGDPrGDP
UnempUnemp
PopulationEmigration
+++++= −−
−
−
−
−
−
14131
12
1
11
1
lnlnln lnln o
Where as S = Source Country, h = Host Country and t = year = dummy variables indicating the respective sending countries.
sZ
Unemp = Unemployment Rate, r GDP = Real GDP per capita Mstock = Share of Migrants Stock in the host Country.
22

Sactive = Demographic Share of Active Population (aged 15-39) in the source Country. Table 14: Drivers of A8 migration: Estimation results
Total Period (2002-2009)
Pre- Enlargement (2002-Q2 2004)
Post- Enlargement (Q3 2004-2009)
Relative Real GDP per capita
4.730*** (0.653)
1.733* (0.699)
-1.381** (0.422)
Relative Unemployment Rate
0.540*** (0.120)
0.425 (0.287)
0.0833 (0.067)
Migrant Stock
0.731*** (0.073)
0.159 (0.086)
0.182*** (0.051)
Demographic Share 15-39 year olds
-9.947*** (2.693)
-19.32*** (3.472)
0.225 (1.929)
Observations 330 100 230
Adjusted R-squared 0.508 0.259 0.103 Standard errors in parentheses, *p<0.05, **p<0.01, ***P<0.001 The key results shown in the table above are: • The impact of relative real GDP per capita turns out to be negatively
significant on the post enlargement migration to the UK. • The relative rate of unemployment and the share of active young
population in the source country are positive push factors for migration to the UK, though post enlargement results are not significant.
• The share of migrant stocks in the UK is an important pull factor for
migrants and is positively significant for the total period and the post - enlargement period.
Table 15: Out of sample prediction for A2 migration to the UK based on the post enlargement sample Country Average Migration Rate
Bulgaria 0.61
Romania 0.38
Total 0.49
23
Policy implications
• Housing: there may be scope for DCLG to use these results of potential migration from the A2 countries to feed into scenario analysis of the demand for housing going forwards.
• Local Government Finance: the estimates presented here could be
important for local authority finance settlements, which are dependent on accurate and up to date population forecasts.
• Localism, Decentralisation and Building the Big Society: the methodology
and estimates presented here could be a valuable information source for local authorities in deciding the best way to allocate resources.
24