Embed Size (px)
Citation preview
Identifying the Relationship between Non-StemCancer Cell and Cancer Stem Cell Genes for Breast
Cancer: An In-Silico based Approach
Monalisa Mandal Xavier University, Bhubaneswar
Odisha-752050, [email protected]
Sanjeeb Kumar Sahoo Institute of Life Sciences,
Bhubaneswar Odisha-751023, [email protected]
Abstract—It has not been established yet that the cancer stemcell genes have any relation with the non-stem cell cancer genes.It could be interesting to find which non-stem cancer genes aremore prone to be affected by cancer stem cell genes. In this paper,an in-silico model has been developed to find out the breast cancernon-stem cell genes which have shown a strong relationship withthe breast cancer stem cell genes. First, a set of genes (appearingat antecedent) having a high association with the class labels (asconsequent) have been computed using the Apriori algorithm.Then, the cancer non-stem cell genes are identified from theassociation where one of the genes is cancer stem cell gene.Finally, these cancer non-stem cell genes are optimized accordingto their differential ability. The experiment has been done on apublicly available Breast Cancer data set. The resultant genesare cross-validated, and accuracy has been reported.
I. INTRODUCTION
Cancers, the deadliest disease are most likely curable ifit is diagnosed at the earlier stage. The process involvesconventional treatments such as surgery, chemotherapy andradiotherapy. But the cancers that are also diagnosed at a laterstage have become progressive and metastasize to other organs.In the former case, even after treating cancer at the early stage,some residual cells still persist and sometime later it causestumour recurrence. Then it becomes more aggressive whichleads to metastasis. From the years of the experiment, theresearchers concluded that these residual cells which couldbe found during any stage of cancer progression are thecancer stem cells (CSCs) [1]. These CSCs are regarded asthe origin of the diseases which have stem-like properties andare responsible for causing the therapeutic resistance [2], [3].However, this should not infer that CSCs are originated fromnormal stem cells. The primary function of a stem cell is self-renewal irrespective of the fact that a cell being normal ormalignant. In the process of self-renewal, a stem cell producesone non-CSC (asymmetric division) or two CSCs (symmetricdivision) that keep holding the self-renewal property againensuring long-term sustainability [4], [5]. The spontaneousinterconversion between non-CSCs and a CSC state seemsto be a very rare and slow event, which can be inducedby several factors such as the infiltration of inflammatorycells, cytokines, chemokines and hypoxia. Signals from the
tumour microenvironment [6], [7] and interactions betweencells within the tumour could induce and regulate the levelof tumour stemness [8], [9]. Experimental evidence suggeststhat this reversible transition is, in some cases regulated by theprocess of epithelial-to-mesenchymal transition (EMT) duringtumour progression [10]. Importantly, CSC-rich tumours arealso associated with aggressive disease and poor prognosis,indicating that an understanding of CSCs biology is pertinentto developing effective therapies [11]. In CSC paradigm, CSCsare thought to be self-renewing and to reside at the top ofthe cellular hierarchy [12]. Through asymmetric division anddifferentiation, these stem cells generate more differentiatedprogeny that lack self-renewal capacity. However, recent stud-ies also indicated that CSCs can be spontaneously generatedfrom non-stem cancer cells (NSCCs) [10], [13]. The relation-ships between CSCs and NSCCs [10], [14], [15] have receivedenormous attention but remain controversial. However, the ba-sis of this phenomenon is not well understood. Therefore, it isbelieved that if CSCs theory will revolutionize the developmentof cellular and molecular events during the cancer progressioncontributing to therapy resistance, recurrence and metastasis[16], [17].
The goal of this study was a bit different than most.Generally, researchers are more interested to find drugs thatmake tumors grow or shrink. However, what feature genesare more affected by these cells that initiate tumor growthis interest to us [8]–[10], [12]. These feature genes mightbe more prone to transform into CSCs. In the current study,Apriori association rule mining algorithm has been applied onthe breast cancer gene expression data where the class labelhas been set as RHS of a rule. A set of rules having oneof the genes is CSC gene are identified and the associatednon-stem cancer genes are collected for the next step. Lastly,by applying t-test, the top ten genes with the least p-valuesare distinguished and validated using linear Support VectorMachine (SVM).
II. MATERIALS AND METHODS
A. Association Rules Mining
Mining frequent patterns is an important aspect in DataMining. Association rule mining [18] is used to find thefrequent patterns among the features in a data set [2]. These
______________________________________________________PROCEEDING OF THE 25TH CONFERENCE OF FRUCT ASSOCIATION
ISSN 2305-7254
rules work on the basis of if/then statements. In associ-ation analysis, the antecedent or LHS (if) and consequentor RHS (then) are sets of items (called itemsets) that aredisjoint. These statements help to reveal associations betweenindependent data in a database, relational database or otherinformation repositories. These rules are used to identify theassociation relationships between the objects which are usuallyused together. An example of a standard association rule havethe form X → Y which implies if X is true of an instance ina database, so is Y true of the same instance, with a certainlevel of significance as measured by two indicators, supportand confidence. These two measures express the degree of un-certainty about the rule. The goal of standard association rulemining is to output all rules whose support and confidence arerespectively above some given support and coverage thresholds[3].
1) Minimum Support Threshold: The support simply de-termines how often a rule is applicable to a given data set.The support [4] of an association pattern is the percentage oftask-relevant data transaction for which the pattern is true. Itis a very important measure of the quality of the rule as lowsupport may occur simply by chance. An item set satisfiesminimum support if the occurrence frequency of the item set(A set of items) is greater than or equal to minimum support.If an item set satisfies minimum support, then it is a frequentitem set.
Supp(A → B) = Supp of the set(A ∪B)/total tuples (1)
2) Minimum Confidence Threshold: Confidence, on theother hand, measures the reliability or trustworthiness asso-ciated with each discovered pattern. For a given rule X → Y ,the higher the confidence, the more likely it is for Y tobe present in transactions that contain X . Confidence alsoprovides an estimate of the conditional probability of Y givenX . Confidence [4] is defined as the measure of certainty
Conf(A → B) = Supp of the set(A ∪B)/Supp of A (2)
3) Lift of a rule: The lift value of an association rule is theratio of the confidence of the rule and the expected confidenceof the rule. In other words, it can be expressed by the ratiobetween the rules confidence and the support of the item setin the rule consequence.
Lift(A → B) = Conf of the set(A ∪B)/Supp of B (3)
B. Apriori Algorithm:
Generating association rules are meaningful in differentfield of research but how do we generate them? One of thecommon methods is to bruteforce all possible rules. This is themost inefficient way to generate rules as it is computationallyinfeasible to compute the support and confidence of all theserules if the data set is medium or large. However, the Apriorialgorithm is introduced in [19] for mining frequent item setsand strong association rules in 1994. Apriori algorithm is, themost classical and important algorithm for mining frequentitem sets. It reduces the number of candidates by having theproperty that if an itemset is frequent, all of its subsets are fre-quent. It employs an iterative approach known as a breadth-firstsearch (level-wise search) through the search space, where k-itemsets are used to explore (k+1) itemsets [5]. The algorithm
terminates when no further successful extensions are found.But it has to generate a large amount of candidate itemsetsand scans the data as many times as the length of the longestfrequent itemsets. The advantage of the algorithm is that beforereading the database at every level, it prunes many of the setswhich are unlikely to be frequent sets by using the Aprioriproperty, which states that all nonempty subsets of frequentsets must also be frequent. This property belongs to a specialcategory of properties called anti-monotone in the sense thatif a set cannot pass a test, all of its supersets will fail the sametest as well [8].
Step1 First scan the database once to get frequent 1-itemset
Step2 RepeatStep3 Generate length(k + 1) candidate itemsets from
length k frequent itemsetsStep4 Test the candidates against database to find fre-
quent (k + 1) itemsetsStep5 Set k := k + 1Step6 Until no freaquent itemsets can be generated
End users of ARM encounter problems as the algorithm donot return result in a reasonable time [4]. b. It only tells thepresence and absence of an item in transactional database. c.It is not efficient in case of large dataset. d. ARM treats allitems in database equally by considering only the presenceand absence of an item within the transaction. It does not takeinto account the significance of item to user or business [4].Apriori algorithm suffers from some weaknesses in spite ofbeing clear and simple. The main limitation is costly wastingof time to hold vast number of candidate sets with muchfrequent itemsets, low minimum support or large itemsets.Further, Apriori algorithm also scans the database multipletimes to calculate the frequency of the itemsets in k-itemset.So, Apriori algorithm turns out to be very slow and inefficient,especially when memory capacity is limited and the numberof transactions is large.
C. Student’s t-test:
Student’s t-distribution [20], [21] is a continuous proba-bility distribution that is considered when the sample size isless and standard deviation of the population is not known.It is also called t-distribution and estimates the mean of anormally distributed population where samples are drawn froma full population. Normally, for each sample, the t-distributionshould be different from each other. But it is noticed thatif the sample size increases, t-distribution follows a normaldistribution. A t-test is a statistical hypothesis test in whichthe test statistic follows a Student’s t-distribution if the nullhypothesis is believed to be true. It is mostly applied to thosehypothesis tests which would follow a normal distribution. Allsuch two-sample location tests are usually called Student’s t-tests, where the null hypothesis states that the means of twonormally distributed populations are equal. Although, the twopopulation variances are also presumed to be equal in t -test. However, when this assumption is dropped from t-testthen that form of t-test is called Welch’s t-test. Usually, thistype of t-test is called as “unpaired” or “independent samples”t-tests because they are applied particularly for those testswhere the non-overlapping samples are being compared. Two-
______________________________________________________PROCEEDING OF THE 25TH CONFERENCE OF FRUCT ASSOCIATION
---------------------------------------------------------------------------- 528 ----------------------------------------------------------------------------
sample t-tests [20] for a data having difference in mean canbe categorized into paired or unpaired t-test.
D. Problem Description
A key unresolved issue for cancer biology and therapy iswhether the relentless growth of a tumour is driven by mostof its cells or, as proposed by the CSC hypothesis, exclusivelyby a minor subpopulation capable of self-renewal, akin tothe numerically rare normal stem cells that maintain tissues(Adams et al, 2007). For more effective cancer therapies, it iscritical to determine which cancer cells have the potential tocontribute to the disease progression. To this view, anti-tumourtreatments are specifically designed to target CSCs, althoughtheoretically unable to cause rapid shrinkage of tumour lesions,it might nonetheless achieve long-term disease eradication byexhausting self-renewal and growth potential of cancer tissues(Dalerba et al, 2007). Our results clarified the impact of CSCson NSCCs. As the CSC database is still incomplete, the recentstudy can add some the probable CSC markers. In addition,these findings may correlate with the interconversion betweenCSCs and NSCCs.
E. Proposed Method
In the first phase, the association between two genes thatinfer the classes of the samples are investigated. Essentially therule would look like Genea, Geneb ← ClassLabel. A ruleessentially indicates the strongly associated genes that inferthe class labels of the samples. Therefore the genes at the leftside not only differentiate the different classes of samples butthey are also strongly correlated with each other. For eachrule, there are rule judging qualifiers such as Support andConfidence. According to the minimum specified support andconfidence, the rules are generated. Then the association ruleshaving one CSC gene between the pair of genes presents inthe rule are separated to get the set of cancerous genes havinga high association with CSC genes. For any association rule tobe meaningful, it is critical to have sufficiently high values ofsupport and confidence. The thresholds for the support andthe confidence are defined by the user as requires by theexperiment. Therefore, different results may be received byassigning different sets of support and confidence. One has totry different settings in order to have a better result. Also, theminimum length of a rule can be the externally provided bythe user as per the demand of the experiment. In this paper,the high dimensional breast cancer data is preprocessed byreducing the dimension according to the standard deviation(sd) which denotes the spread of a feature across the samples.For each of the feature gene, the sd is calculated and thenthese feature genes are sorted in descending order of theirsd values. The ”knee point” or the ”elbow” denoting themaximum difference in between two consecutive sd values.So the reduced data consists of all samples and the featuregenes that have larger sd values than the knee point. Next, theApriori association rule mining algorithm has been appliedon the reduced dataset with the set up of minimum rulelength = 3, support= 0.3 and confidence = 1. This setup hasbeen experimentally validated and even after setting minimumrule is 3, only rules having a length of 3 are generated bythe algorithm. After executing the Apriori, 25765 rules arereceived. Then the rules that contain one CSC gene at the left
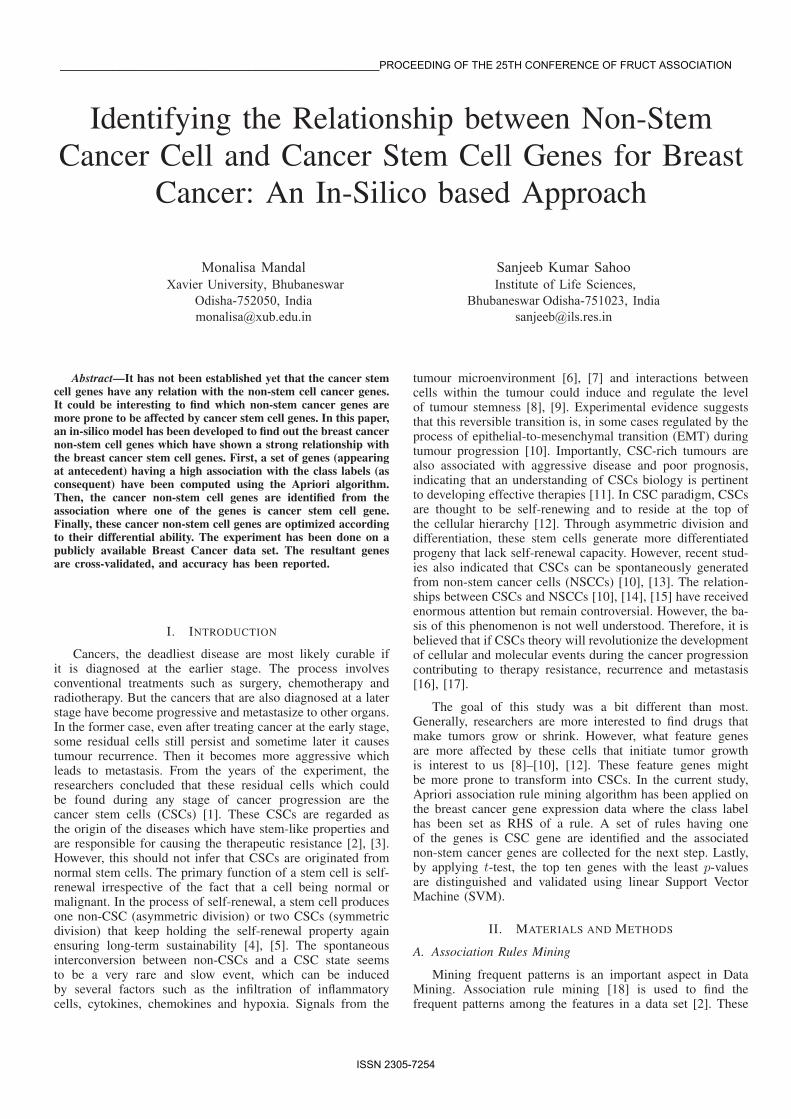
side are identified and the list of other genes associated with the CSC genes are separated. Finally, 52 non-CSC cancer genes are the resultant set. Next, unpaired t-test has been applied on the reduced set to get the p − values for each of the gene. So, the top 10 genes are taken from the set of genes which are sorted according to the increasing order of their p − values. The proposed method has been depicted in Fig. 1.
Preprocessing
Standard deviation with 'knee-point'considered as cut-off
Breast CancerData
[24x12625]
Apriori Algorithm
Applied Apriori algorithm to get rules withassociated genes in LHS and class label in
RHS
Data[24x1670]
Association withCSC genes
Rules with none of the genes in LHS is CSCgene are filtered out
25823 ruleshave beenidentified
t-Test
Applied t-Test and top 10 genes areextracted from the list of genes with lowest
p-values
Resultant 52rules imply
Data[24x52]
Data[24x10]
Fig. 1. Flow chart of the proposed method
F. DataSet
Data set name: GSE349 350 This data has been obtainedfrom http://www.ncbi.nlm.nih.gov/projects/geo/query/acc.cgi?acc=GSE349, http://www.ncbi.nlm.nih.gov/projects/geo/query/acc.cgi?acc=GSE350. The data is being collected from anexperiment where patients with breast cancer are given withneoadjuvant docetaxel treatment. In response to treatment, pa-tients can be resistant or sensitive. The samples were obtainedbefore treatment and the tumour response to neoadjuvanttreatment was later assessed. The number of samples forresistant to docetaxel treatment (resistant) is 14 and sensitiveto docetaxel treatment (sensitive) is 10 that leads 24 samplesin the dataset. The total number of genes present in this datais 12625.
G. CSCdb Database
Cancer Stem Cell research is still in its beginning phase.Therefore, the databases of CSC genes are very limited.Moreover, the total number of CSC genes are not very large.Altogether, 1600 CSC genes are collected from the database[13]. One can find other useful information related to CSCrelated genes.
III. RESULTS AND DISCUSSIONS
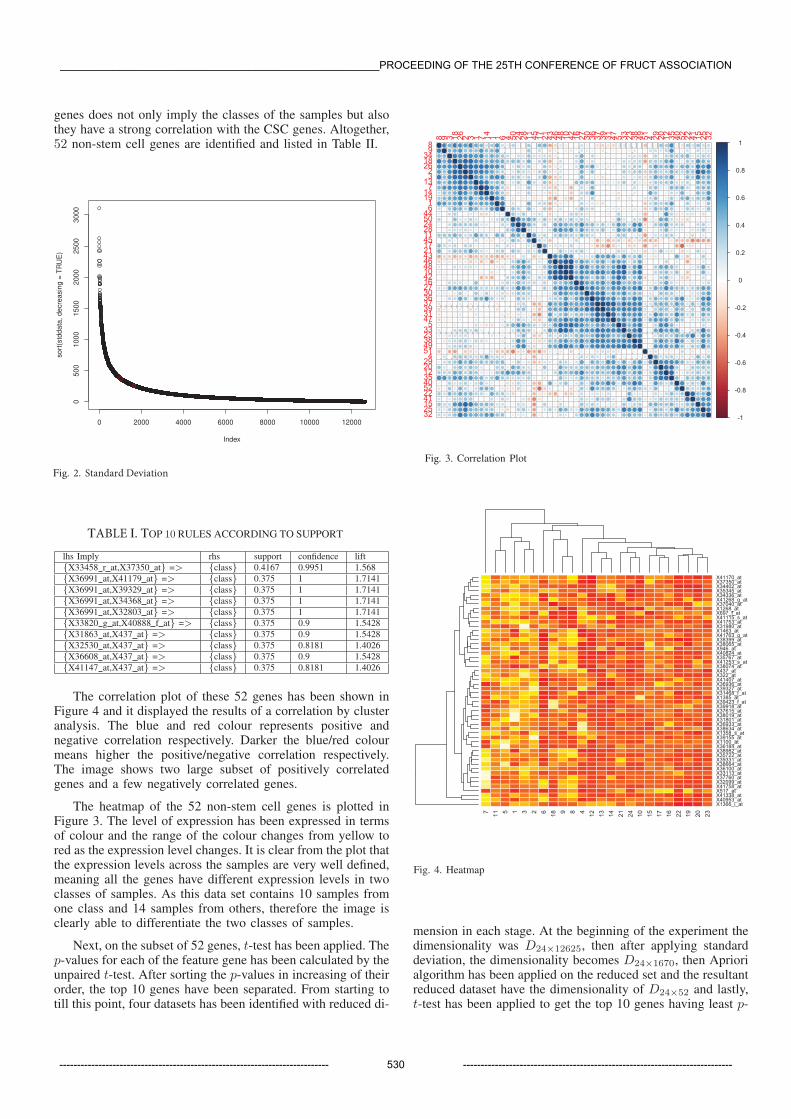
The high dimensionality of the caused the Apriori algo-rithm to hang. So the dimension of the dataset has beenreduced by applying standard deviation on to it. The standarddeviation of a feature represents how much a feature genevalues are spread across the samples and higher the valuesmean better the feature. Then according to the ’Knee-Point’analysis, the feature gene with larger sd values are kept in thedataset. The sd values for the feature genes has been plotted inFigure 2 and the ’Knee-Point’ is 1663 which has been shownin red. Therefore, 1670 feature genes have been consideredfor the next step. After applying the Apriori algorithm on thereduced dataset, a set of 25823 rules have been achieved. Someof the rules are listed on the Table I. Then from the rules, thenon-stem cell genes where one of the genes is CSC gene inLHS of the rule are extracted. So, this subset of non-stem cell
______________________________________________________PROCEEDING OF THE 25TH CONFERENCE OF FRUCT ASSOCIATION
---------------------------------------------------------------------------- 529 ----------------------------------------------------------------------------
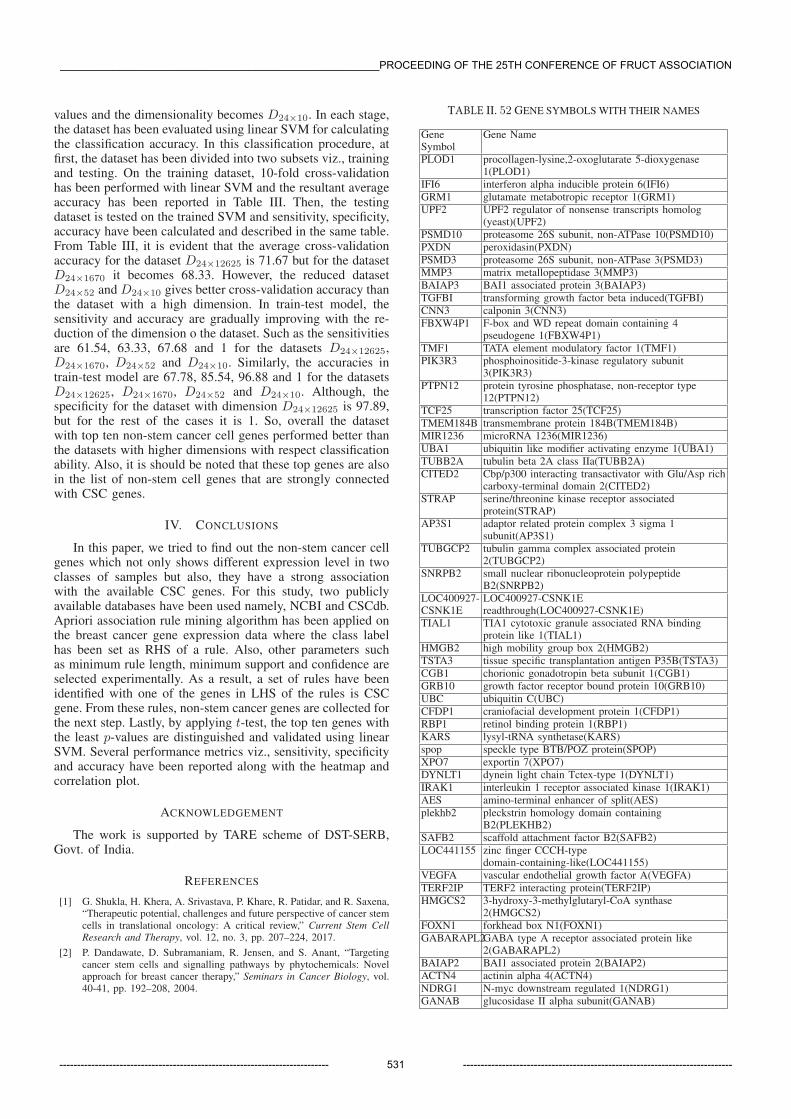
genes does not only imply the classes of the samples but alsothey have a strong correlation with the CSC genes. Altogether,52 non-stem cell genes are identified and listed in Table II.
0 2000 4000 6000 8000 10000 12000
050
010
0015
0020
0025
0030
00
Index
sort
(std
data
, dec
reas
ing
= T
RU
E)
TABLE I. TOP 10 RULES ACCORDING TO SUPPORT
lhs Imply rhs support confidence lift
{X33458 r at,X37350 at} => {class} 0.4167 0.9951 1.568
{X36991 at,X41179 at} => {class} 0.375 1 1.7141
{X36991 at,X39329 at} => {class} 0.375 1 1.7141
{X36991 at,X34368 at} => {class} 0.375 1 1.7141
{X36991 at,X32803 at} => {class} 0.375 1 1.7141
{X33820 g at,X40888 f at} => {class} 0.375 0.9 1.5428
{X31863 at,X437 at} => {class} 0.375 0.9 1.5428
{X32530 at,X437 at} => {class} 0.375 0.8181 1.4026
{X36608 at,X437 at} => {class} 0.375 0.9 1.5428
{X41147 at,X437 at} => {class} 0.375 0.8181 1.4026
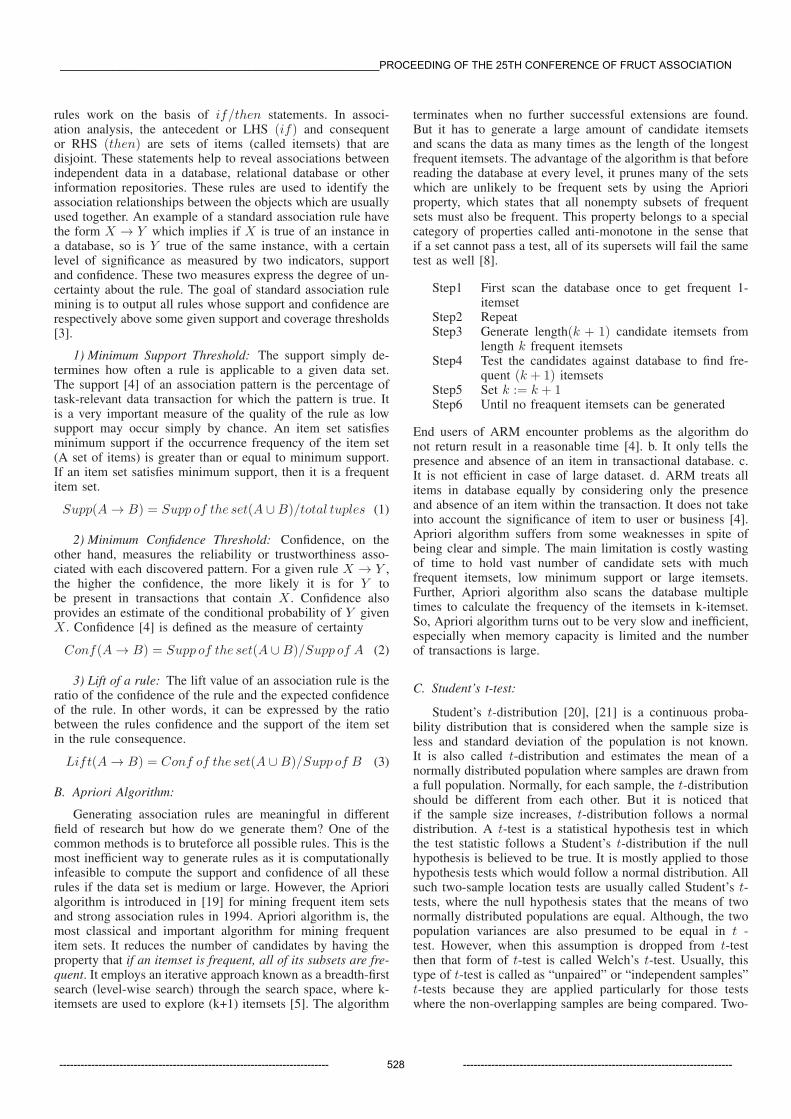
The correlation plot of these 52 genes has been shown inFigure 4 and it displayed the results of a correlation by clusteranalysis. The blue and red colour represents positive andnegative correlation respectively. Darker the blue/red colourmeans higher the positive/negative correlation respectively.The image shows two large subset of positively correlatedgenes and a few negatively correlated genes.
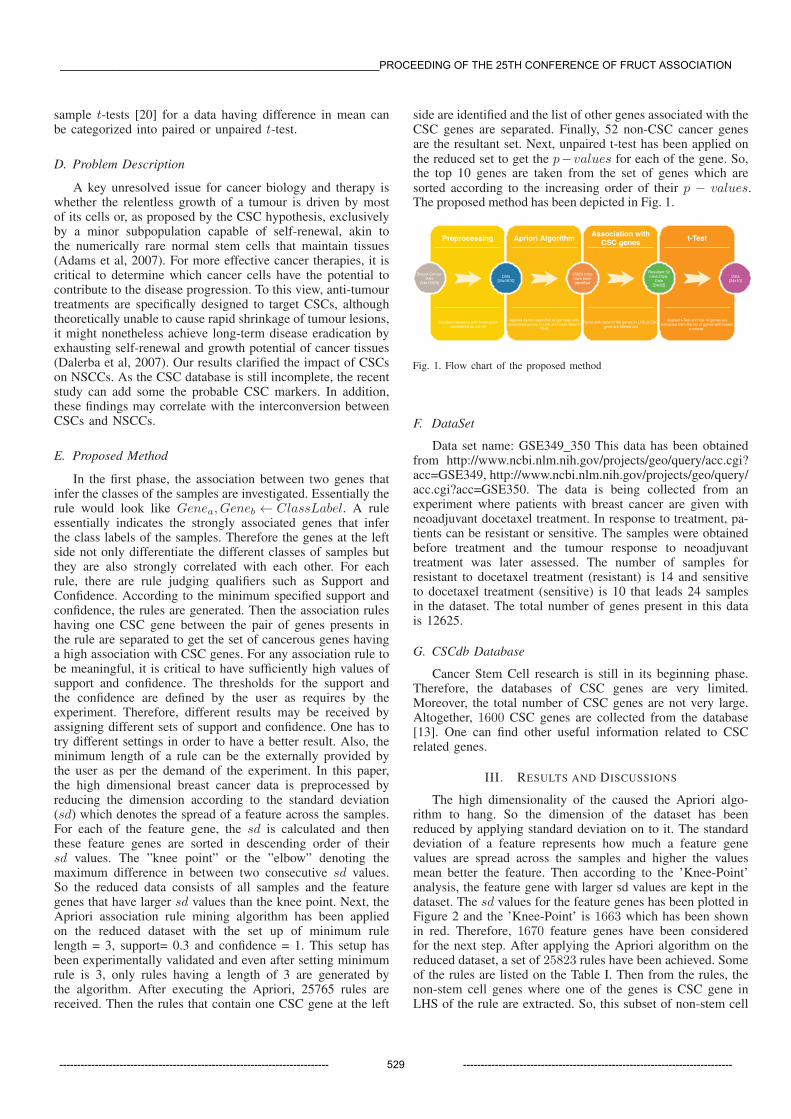
The heatmap of the 52 non-stem cell genes is plotted inFigure 3. The level of expression has been expressed in termsof colour and the range of the colour changes from yellow tored as the expression level changes. It is clear from the plot thatthe expression levels across the samples are very well defined,meaning all the genes have different expression levels in twoclasses of samples. As this data set contains 10 samples fromone class and 14 samples from others, therefore the image isclearly able to differentiate the two classes of samples.
Next, on the subset of 52 genes, t-test has been applied. Thep-values for each of the feature gene has been calculated by theunpaired t-test. After sorting the p-values in increasing of theirorder, the top 10 genes have been separated. From starting totill this point, four datasets has been identified with reduced di-
-1
-0.8
-0.6
-0.4
-0.2
0
0.2
0.4
0.6
0.8
1
8 9 3 18 26 2 3 1 7 14 1 1 6 4 50 24 28 11 45 17 21 43 46 48 10 42 16 27 30 36 37 39 31 47 5 33 23 38 49 51 4 29 20 12 35 40 52 22 41 15 25 32
89341826231371419164450242811451721434648104216273036373931475332338495142920123540522241152532
Fig. 3. Correlation Plot
7 11 5 1 3 2 6 18 9 8 4 12 13 14 21 24 10 15 17 16 22 19 20 23
X1366_i_atX40953_atX41338_atX517_atX41758_atX32099_atX37760_atX33113_atX36100_atX38664_atX39331_atX35722_atX38982_atX36184_atX1100_atX39155_atX1358_s_atX38634_atX36933_atX31801_atX38019_atX37615_atX39918_atX39423_f_atX1385_atX31468_f_atX39327_atX36936_atX41407_atX322_atX437_atX38074_atX41253_s_atX35767_atX40824_atX946_atX38065_atX38399_atX41763_g_atX1463_atX31980_atX41753_atX41115_s_atX697_f_atX1268_atX37040_atX41268_g_atX34336_atX35345_atX34402_atX37350_atX41170_at
Fig. 4. Heatmap
mension in each stage. At the beginning of the experiment thedimensionality was D24×12625, then after applying standarddeviation, the dimensionality becomes D24×1670, then Apriorialgorithm has been applied on the reduced set and the resultantreduced dataset have the dimensionality of D24×52 and lastly,t-test has been applied to get the top 10 genes having least p-
Fig. 2. Standard Deviation
______________________________________________________PROCEEDING OF THE 25TH CONFERENCE OF FRUCT ASSOCIATION
---------------------------------------------------------------------------- 530 ----------------------------------------------------------------------------
values and the dimensionality becomes D24×10. In each stage,the dataset has been evaluated using linear SVM for calculatingthe classification accuracy. In this classification procedure, atfirst, the dataset has been divided into two subsets viz., trainingand testing. On the training dataset, 10-fold cross-validationhas been performed with linear SVM and the resultant averageaccuracy has been reported in Table III. Then, the testingdataset is tested on the trained SVM and sensitivity, specificity,accuracy have been calculated and described in the same table.From Table III, it is evident that the average cross-validationaccuracy for the dataset D24×12625 is 71.67 but for the datasetD24×1670 it becomes 68.33. However, the reduced datasetD24×52 and D24×10 gives better cross-validation accuracy thanthe dataset with a high dimension. In train-test model, thesensitivity and accuracy are gradually improving with the re-duction of the dimension o the dataset. Such as the sensitivitiesare 61.54, 63.33, 67.68 and 1 for the datasets D24×12625,D24×1670, D24×52 and D24×10. Similarly, the accuracies intrain-test model are 67.78, 85.54, 96.88 and 1 for the datasetsD24×12625, D24×1670, D24×52 and D24×10. Although, thespecificity for the dataset with dimension D24×12625 is 97.89,but for the rest of the cases it is 1. So, overall the datasetwith top ten non-stem cancer cell genes performed better thanthe datasets with higher dimensions with respect classificationability. Also, it is should be noted that these top genes are alsoin the list of non-stem cell genes that are strongly connectedwith CSC genes.
IV. CONCLUSIONS
In this paper, we tried to find out the non-stem cancer cellgenes which not only shows different expression level in twoclasses of samples but also, they have a strong associationwith the available CSC genes. For this study, two publiclyavailable databases have been used namely, NCBI and CSCdb.Apriori association rule mining algorithm has been applied onthe breast cancer gene expression data where the class labelhas been set as RHS of a rule. Also, other parameters suchas minimum rule length, minimum support and confidence areselected experimentally. As a result, a set of rules have beenidentified with one of the genes in LHS of the rules is CSCgene. From these rules, non-stem cancer genes are collected forthe next step. Lastly, by applying t-test, the top ten genes withthe least p-values are distinguished and validated using linearSVM. Several performance metrics viz., sensitivity, specificityand accuracy have been reported along with the heatmap andcorrelation plot.
ACKNOWLEDGEMENT
The work is supported by TARE scheme of DST-SERB,Govt. of India.
REFERENCES
[1] G. Shukla, H. Khera, A. Srivastava, P. Khare, R. Patidar, and R. Saxena,“Therapeutic potential, challenges and future perspective of cancer stemcells in translational oncology: A critical review,” Current Stem CellResearch and Therapy, vol. 12, no. 3, pp. 207–224, 2017.
[2] P. Dandawate, D. Subramaniam, R. Jensen, and S. Anant, “Targetingcancer stem cells and signalling pathways by phytochemicals: Novelapproach for breast cancer therapy,” Seminars in Cancer Biology, vol.40-41, pp. 192–208, 2004.
TABLE II. 52 GENE SYMBOLS WITH THEIR NAMES
GeneSymbol
Gene Name
PLOD1 procollagen-lysine,2-oxoglutarate 5-dioxygenase1(PLOD1)
IFI6 interferon alpha inducible protein 6(IFI6)GRM1 glutamate metabotropic receptor 1(GRM1)UPF2 UPF2 regulator of nonsense transcripts homolog
(yeast)(UPF2)PSMD10 proteasome 26S subunit, non-ATPase 10(PSMD10)PXDN peroxidasin(PXDN)PSMD3 proteasome 26S subunit, non-ATPase 3(PSMD3)MMP3 matrix metallopeptidase 3(MMP3)BAIAP3 BAI1 associated protein 3(BAIAP3)TGFBI transforming growth factor beta induced(TGFBI)CNN3 calponin 3(CNN3)FBXW4P1 F-box and WD repeat domain containing 4
pseudogene 1(FBXW4P1)TMF1 TATA element modulatory factor 1(TMF1)PIK3R3 phosphoinositide-3-kinase regulatory subunit
3(PIK3R3)PTPN12 protein tyrosine phosphatase, non-receptor type
12(PTPN12)TCF25 transcription factor 25(TCF25)TMEM184B transmembrane protein 184B(TMEM184B)MIR1236 microRNA 1236(MIR1236)UBA1 ubiquitin like modifier activating enzyme 1(UBA1)TUBB2A tubulin beta 2A class IIa(TUBB2A)CITED2 Cbp/p300 interacting transactivator with Glu/Asp rich
carboxy-terminal domain 2(CITED2)STRAP serine/threonine kinase receptor associated
protein(STRAP)AP3S1 adaptor related protein complex 3 sigma 1
subunit(AP3S1)TUBGCP2 tubulin gamma complex associated protein
2(TUBGCP2)SNRPB2 small nuclear ribonucleoprotein polypeptide
B2(SNRPB2)LOC400927-CSNK1E
LOC400927-CSNK1Ereadthrough(LOC400927-CSNK1E)
TIAL1 TIA1 cytotoxic granule associated RNA bindingprotein like 1(TIAL1)
HMGB2 high mobility group box 2(HMGB2)TSTA3 tissue specific transplantation antigen P35B(TSTA3)CGB1 chorionic gonadotropin beta subunit 1(CGB1)GRB10 growth factor receptor bound protein 10(GRB10)UBC ubiquitin C(UBC)CFDP1 craniofacial development protein 1(CFDP1)RBP1 retinol binding protein 1(RBP1)KARS lysyl-tRNA synthetase(KARS)spop speckle type BTB/POZ protein(SPOP)XPO7 exportin 7(XPO7)DYNLT1 dynein light chain Tctex-type 1(DYNLT1)IRAK1 interleukin 1 receptor associated kinase 1(IRAK1)AES amino-terminal enhancer of split(AES)plekhb2 pleckstrin homology domain containing
B2(PLEKHB2)SAFB2 scaffold attachment factor B2(SAFB2)LOC441155 zinc finger CCCH-type
domain-containing-like(LOC441155)VEGFA vascular endothelial growth factor A(VEGFA)TERF2IP TERF2 interacting protein(TERF2IP)HMGCS2 3-hydroxy-3-methylglutaryl-CoA synthase
2(HMGCS2)FOXN1 forkhead box N1(FOXN1)GABARAPL2GABA type A receptor associated protein like
2(GABARAPL2)BAIAP2 BAI1 associated protein 2(BAIAP2)ACTN4 actinin alpha 4(ACTN4)NDRG1 N-myc downstream regulated 1(NDRG1)GANAB glucosidase II alpha subunit(GANAB)
______________________________________________________PROCEEDING OF THE 25TH CONFERENCE OF FRUCT ASSOCIATION
---------------------------------------------------------------------------- 531 ----------------------------------------------------------------------------
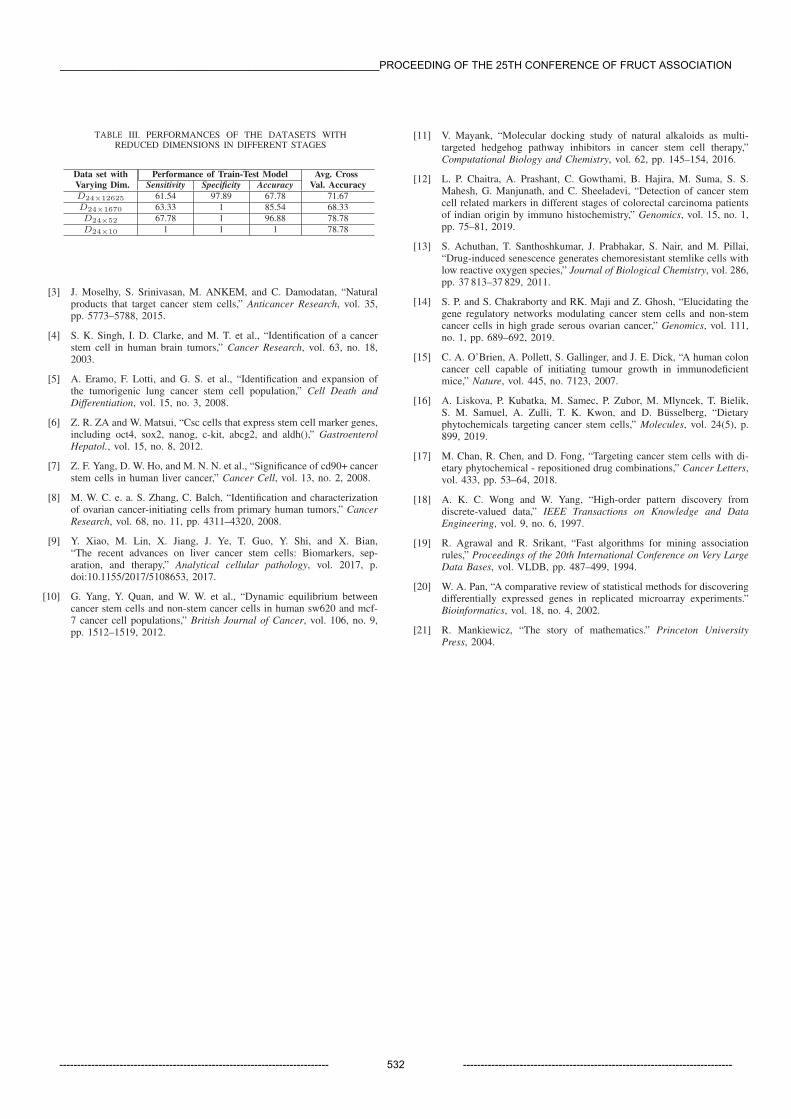
TABLE III. PERFORMANCES OF THE DATASETS WITH REDUCED DIMENSIONS IN DIFFERENT STAGES
Data set with Performance of Train-Test Model Avg. CrossVarying Dim. Sensitivity Specificity Accuracy Val. AccuracyD24×12625 61.54 97.89 67.78 71.67
D24×1670 63.33 1 85.54 68.33
D24×52 67.78 1 96.88 78.78
D24×10 1 1 1 78.78
[3] J. Moselhy, S. Srinivasan, M. ANKEM, and C. Damodatan, “Naturalproducts that target cancer stem cells,” Anticancer Research, vol. 35,pp. 5773–5788, 2015.
[4] S. K. Singh, I. D. Clarke, and M. T. et al., “Identification of a cancerstem cell in human brain tumors,” Cancer Research, vol. 63, no. 18,2003.
[5] A. Eramo, F. Lotti, and G. S. et al., “Identification and expansion ofthe tumorigenic lung cancer stem cell population,” Cell Death andDifferentiation, vol. 15, no. 3, 2008.
[6] Z. R. ZA and W. Matsui, “Csc cells that express stem cell marker genes,including oct4, sox2, nanog, c-kit, abcg2, and aldh(),” GastroenterolHepatol., vol. 15, no. 8, 2012.
[7] Z. F. Yang, D. W. Ho, and M. N. N. et al., “Significance of cd90+ cancerstem cells in human liver cancer,” Cancer Cell, vol. 13, no. 2, 2008.
[8] M. W. C. e. a. S. Zhang, C. Balch, “Identification and characterizationof ovarian cancer-initiating cells from primary human tumors,” CancerResearch, vol. 68, no. 11, pp. 4311–4320, 2008.
[9] Y. Xiao, M. Lin, X. Jiang, J. Ye, T. Guo, Y. Shi, and X. Bian,“The recent advances on liver cancer stem cells: Biomarkers, sep-aration, and therapy,” Analytical cellular pathology, vol. 2017, p.doi:10.1155/2017/5108653, 2017.
[10] G. Yang, Y. Quan, and W. W. et al., “Dynamic equilibrium betweencancer stem cells and non-stem cancer cells in human sw620 and mcf-7 cancer cell populations,” British Journal of Cancer, vol. 106, no. 9,pp. 1512–1519, 2012.
[11] V. Mayank, “Molecular docking study of natural alkaloids as multi-targeted hedgehog pathway inhibitors in cancer stem cell therapy,”Computational Biology and Chemistry, vol. 62, pp. 145–154, 2016.
[12] L. P. Chaitra, A. Prashant, C. Gowthami, B. Hajira, M. Suma, S. S.Mahesh, G. Manjunath, and C. Sheeladevi, “Detection of cancer stemcell related markers in different stages of colorectal carcinoma patientsof indian origin by immuno histochemistry,” Genomics, vol. 15, no. 1,pp. 75–81, 2019.
[13] S. Achuthan, T. Santhoshkumar, J. Prabhakar, S. Nair, and M. Pillai,“Drug-induced senescence generates chemoresistant stemlike cells withlow reactive oxygen species,” Journal of Biological Chemistry, vol. 286,pp. 37 813–37 829, 2011.
[14] S. P. and S. Chakraborty and RK. Maji and Z. Ghosh, “Elucidating thegene regulatory networks modulating cancer stem cells and non-stemcancer cells in high grade serous ovarian cancer,” Genomics, vol. 111,no. 1, pp. 689–692, 2019.
[15] C. A. O’Brien, A. Pollett, S. Gallinger, and J. E. Dick, “A human coloncancer cell capable of initiating tumour growth in immunodeficientmice,” Nature, vol. 445, no. 7123, 2007.
[16] A. Liskova, P. Kubatka, M. Samec, P. Zubor, M. Mlyncek, T. Bielik,S. M. Samuel, A. Zulli, T. K. Kwon, and D. Busselberg, “Dietaryphytochemicals targeting cancer stem cells,” Molecules, vol. 24(5), p.899, 2019.
[17] M. Chan, R. Chen, and D. Fong, “Targeting cancer stem cells with di-etary phytochemical - repositioned drug combinations,” Cancer Letters,vol. 433, pp. 53–64, 2018.
[18] A. K. C. Wong and W. Yang, “High-order pattern discovery fromdiscrete-valued data,” IEEE Transactions on Knowledge and DataEngineering, vol. 9, no. 6, 1997.
[19] R. Agrawal and R. Srikant, “Fast algorithms for mining associationrules,” Proceedings of the 20th International Conference on Very LargeData Bases, vol. VLDB, pp. 487–499, 1994.
[20] W. A. Pan, “A comparative review of statistical methods for discoveringdifferentially expressed genes in replicated microarray experiments.”Bioinformatics, vol. 18, no. 4, 2002.
[21] R. Mankiewicz, “The story of mathematics.” Princeton UniversityPress, 2004.
______________________________________________________PROCEEDING OF THE 25TH CONFERENCE OF FRUCT ASSOCIATION
---------------------------------------------------------------------------- 532 ----------------------------------------------------------------------------


![IDENTIFYING THE DATA SCIENTIST AMONGST STEM EDUCATORS [Autosaved]](https://img.pdfslide.net/doc/110x75/58a5a76d1a28ab1a628b5041/identifying-the-data-scientist-amongst-stem-educators-autosaved.jpg)