Embed Size (px)
Citation preview
Identifying true brain interaction from EEG data usingthe imaginary part of coherency
Guido Nolte*, Ou Bai, Lewis Wheaton, Zoltan Mari, Sherry Vorbach, Mark Hallett
Human Motor Control Section, NINDS, NIH, 10 Center Drive MSC 1428, Bldg 10, Room 5N226, Bethesda, MD 20892-1428, USA
Accepted 17 April 2004
Available online 10 July 2004
Abstract
Objective: The main obstacle in interpreting EEG/MEG data in terms of brain connectivity is the fact that because of volume conduction,the activity of a single brain source can be observed in many channels. Here, we present an approach which is insensitive to false connectivityarising from volume conduction.Methods: We show that the (complex) coherency of non-interacting sources is necessarily real and, hence, the imaginary part of coherency
provides an excellent candidate to study brain interactions. Although the usual magnitude and phase of coherency contain the sameinformation as the real and imaginary parts, we argue that the Cartesian representation is far superior for studying brain interactions. Themethod is demonstrated for EEG measurements of voluntary finger movement.Results: We found: (a) from 5 s before to movement onset a relatively weak interaction around 20 Hz between left and right motor areas
where the contralateral side leads the ipsilateral side; and (b) approximately 2–4 s after movement, a stronger interaction also at 20 Hz in theopposite direction.Conclusions: It is possible to reliably detect brain interaction during movement from EEG data.Significance: The method allows unambiguous detection of brain interaction from rhythmic EEG/MEG data.
q 2004 International Federation of Clinical Neurophysiology. Published by Elsevier Ireland Ltd. All rights reserved.
Keywords: Coherence; EEG; Connectivity; Motor control; Volume conduction; Time-lag
1. Introduction
The millisecond temporal resolution of electroencepha-lography (EEG) and magnetoencephalography (MEG)measurements make these techniques ideal candidates tostudy the brain as a dynamic system. Recently, muchattention has been paid to interpreting rhythmic EEG/MEGactivity in terms of brain connectivity. Probably the simplestand most popular measure of ‘interaction’ at a specificfrequency is coherence, a generalization of correlation to thefrequency domain (Nunez et al., 1997, 1999). Coherence isalmost always studied as a relation between EEG or MEGchannels while one is interested in relations between brainsites. Since the activity of a single generator within the brainis typically observable in many channels outside the head,with details of this mapping depending on the volumeconductor (Sarvas, 1987), it is likely that a relation between
channels is rather a trivial ‘volume conduction artefact’ thana reflection of an underlying interacting brain (Nunez et al.,1997). Mathematically similarly, for EEG one always needsa reference. If this reference is the same for the electrodepairs being studied, it can contribute significantly to thecoherence, and thus, relative power changes may also affectcoherencies without reflecting a change in coupling (Feinet al., 1988; Florian et al., 1998).
A plausible attempt to avoid artefacts from volumeconduction is first to apply an inverse method (see Bailletet al. (2001) for an overview) to the data and then tocalculate coherence or any other measure of interaction ofthe estimated source amplitudes (Gross et al., 2001). Theproblem is that a fully satisfactory inverse method does notexist and cannot exist (Sarvas, 1987). Any inverse method isbased on prejudices about the underlying sources. If theseprejudices are wrong (and sometimes even if they arecorrect) the separation of channel amplitudes into sourceamplitudes will be wrong (incomplete), and again it is likely
Clinical Neurophysiology 115 (2004) 2292–2307
www.elsevier.com/locate/clinph
1388-2457/$30.00 q 2004 International Federation of Clinical Neurophysiology. Published by Elsevier Ireland Ltd. All rights reserved.
doi:10.1016/j.clinph.2004.04.029
* Corresponding author. Tel.: !1-301-435-1578.E-mail address: [email protected] (G. Nolte).
that artefacts of volume conduction will be misinterpretedas brain interaction.
In this paper, we interpret brain interaction from aquantity, namely the imaginary part of coherency, whichitself cannot be generated as an artefact of volumeconduction as will be shown below. The fundamentalassumption we make to arrive at this conclusion is that thethe quasi-static approximation holds for EEG, i.e. that anobserved scalp potential has no time-lag to the underlyingsource activity, which is indeed widely accepted (Stinstraand Peters, 1998). The imaginary part of coherency is onlysensitive to synchronizations of two processes which aretime-lagged to each other. If volume conduction does notcause a time-lag, the imaginary part of coherency is henceinsensitive to artifactual ‘self-interaction’.
It is conceivable that in many experiments this imaginarypart is very small or even vanishing if the time-lag betweentwo processes is small or even vanishing. Therefore, it islikely that our approach misses parts and in the worst caseall of the brain interaction. However, because of this specialproperty of being inconsistent with non-interacting sources,in our opinion, it deserves special attention. If we find a non-vanishing imaginary part, the interpretation as a reflection oftrue brain interaction is almost immediate.
Thus, the experimental question is whether an imaginarypart of coherency can be observed in real data. We willexemplify this for EEG measurement of voluntary left andright-hand movements, which has been the objective ofmany EEG coherence studies (Andrew and Pfurtscheller,1999; Florian et al., 1998; Gerloff and Andres, 2002; Ginteret al., 2001; Leocani et al., 1997; Manganotti et al., 1998;Mima et al., 2000; Pfurtscheller and Andrew, 1999). Whilean increased coherence at around 20 Hz (beta-activity)between electrodes over the left and right motor areasduring movement and a decrease after movement is wellknown, it has been argued that these effects are essentiallyartefacts of volume conduction and that beta-activity is notinvolved in the connection between left and right motorareas (Andrew and Pfurtscheller, 1999; Pfurtscheller andAndrew, 1999). Regardless of whether this is right or wrong,of special interest to this paper is the debate itself.Coherence (as an absolute value) is ambiguous: anyoutcome is perfectly consistent with non-interactingsources. In contrast, such a debate is unnecessary whenanalyzing the imaginary part of coherency. We show herethat in fact beta-activity is involved in the communicationbetween left and right motor areas, but that the timing ofthese interactions differs from the one expected from‘standard’ coherence analysis.
This paper is organized as follows. In Section 2.1 werecall the definition of coherence. A coherence matrixcontains a large amount of information. Our solution as tohow to visualize this information is presented in Section 2.2.In Section 2.3, we discuss the special role of the imaginarypart of coherency, and in Section 2.4, we present thestatistics of coherency including a method to control for
multiple comparisons. In Section 3, we give the results for asimple motor task. The paradigm is explained in Section 3.1and the results of standard coherence and power analysis arepresented in Section 3.2. Our main results are shown inSection 3.3, which contains the results for the imaginarypart of coherency. Finally, we discuss our findings inSection 4.
2. Theoretical aspects of coherency
2.1. Definition of coherency/coherence
Coherency between two EEG-channels is a measure ofthe linear relationship of the two at a specific frequency.Here, we recall the basic definitions (Nunez et al., 1997).Let xi"f # and xj"f # be the (complex) Fourier transforms ofthe time series x̂i"t# and x̂j"t# of channel i and j; respectively.Then the cross-spectrum is defined as
Sij"f # ; kxi"f #xpj "f #l "1#
where p means complex conjugation and k l meansexpectation value. In practice, the expectation value canonly be estimated as an average over a sufficiently largenumber of epochs. Coherency is now defined as thenormalized cross-spectrum:
Cij"f # ;Sij"f #
"Sii"f #Sjj"f ##1=2"2#
and coherence is defined as the absolute value of coherency
Cohij"f # ; lCij"f #l "3#
We note that the terminology varies in different papers.Since it is the major objective of this paper to exploit phasestructure as shown below, we use the two terms ‘coherency’and ‘coherence’ to distinguish the full complex informationfrom its magnitude.
In the case of ‘event-related coherence’, we areinterested in the dependence of coherency as a function ofthe time relative to a given stimulus. We then divide a longepoch (typically in the order of a few seconds) into segmentsof length T (typically between 250 ms and 1 s) which aresmall enough for the desired time-resolution, given by Titself, and large enough for the desired frequency resolution,given by 1=T : Coherency then becomes a function of bothfrequency and time
Cij"f #! Cij"f ; t# "4#
where t indicates the time of the center of the respectivesegment.
Coherency essentially measures how the phases inchannel i and j are coupled to each other. In the following,frequency dependence is implicitly understood. If wewrite the Fourier transformed signals as xi $ ri exp"iFi#
G. Nolte et al. / Clinical Neurophysiology 115 (2004) 2292–2307 2293
and xj $ rj exp"iFj# then the cross-spectrum becomes
Sij"f # $ krirj exp"iDF#l "5#
where DF $ Fi 2Fj is the phase difference between thesignals in channel i and j at a specific frequency. The cross-spectrum is the average of exp"iDF# weighted with theproduct of the amplitudes ri and rj: For coherency, wemerely normalize with respect to the ‘global amplitudes’kr2i l1=2 and kr2j l1=2: If the signals in the two channels areindependent, DF is a random number and the coherency iszero.
It is worthwhile to compare coherency with (1:1) ‘Phase-Locking’ or ‘Phase Synchrony’ defined as an unweightedaverage
P $ kexp"iDF#l "6#
Lachaux et al. (1999) gave two arguments why phasesynchrony is preferable to coherency.1 First, it is argued thatcoherency can only be applied to stationary signals, andsecond, it is noted that phase synchrony specificallyquantifies phase relationships. We disagree with the firstargument. Coherency is a characteristic quantity of astationary as well as a non-stationary process. Only if weinterpret it as a parameter of a stationary process we actuallyassume stationarity. Similarly, we do not assume that theprocesses are linear by calculating a linear measure. Weonly look at the linear properties.
The second argument is more subtle. Phase synchrony isindeed a clearer measure of the phase relationship only, andif DF is statistically independent of the amplitudes, there isno reason to weight with respect to amplitudes. However,the question is whether this is the case, and, if not, whetherthe weights result in statistically more robust estimators ofphase relationships. Note, that independence of phases andamplitudes leads to
Cij $ kexp"iDF#l krirjl"kr2i lkr2j l#1=2
"7#
and since
krirjl"kr2i lkr2j l#1=2
# 1 "8#
we find
lCijl # lPijl "9#
In our experience, this inequality is (slightly) violated inreal data examples and the results for coherency are(slightly) more robust than for phase synchrony. To someextent, this is surprising since phase synchrony is obviouslyless sensitive to outliers. However, this result indicates adependence of the phase difference on the amplitudes: if thesignal is weak it is more likely that noise destroys the phase
structure. We want to emphasize that we do not claim thatthis is always the case but we do believe that the question ofwhat quantity is preferable is ultimately a statistical and nota conceptual one.
2.2. Visualising coherency
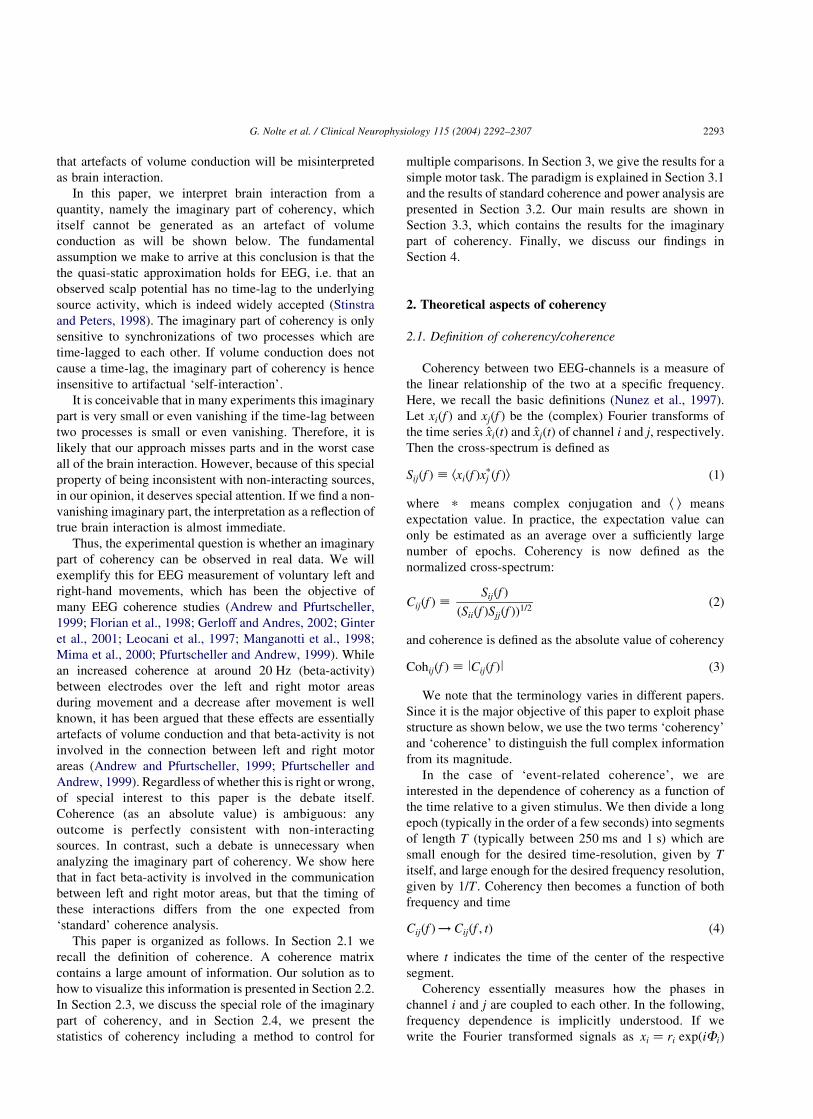
A coherence/coherency matrix contains an enormousamount of information. In order to assess this information,looking at all connections in one plot is very helpful. Oursolution to this problem is presented in Fig. 1 where weshow coherence in the alpha band at rest. The single largecircle represents the whole scalp. At each electrode position,we place a small circle also representing the scalp andcontaining the coherence of the respective electrode with allother electrodes, i.e. the ith small circle contains the ith rowof the coherence matrix lCijl: In Fig. 1, we observe strongcoherence with all neighboring electrodes which is (at leastqualitatively) consistent with a uniform distribution ofindependent sources in the brain.
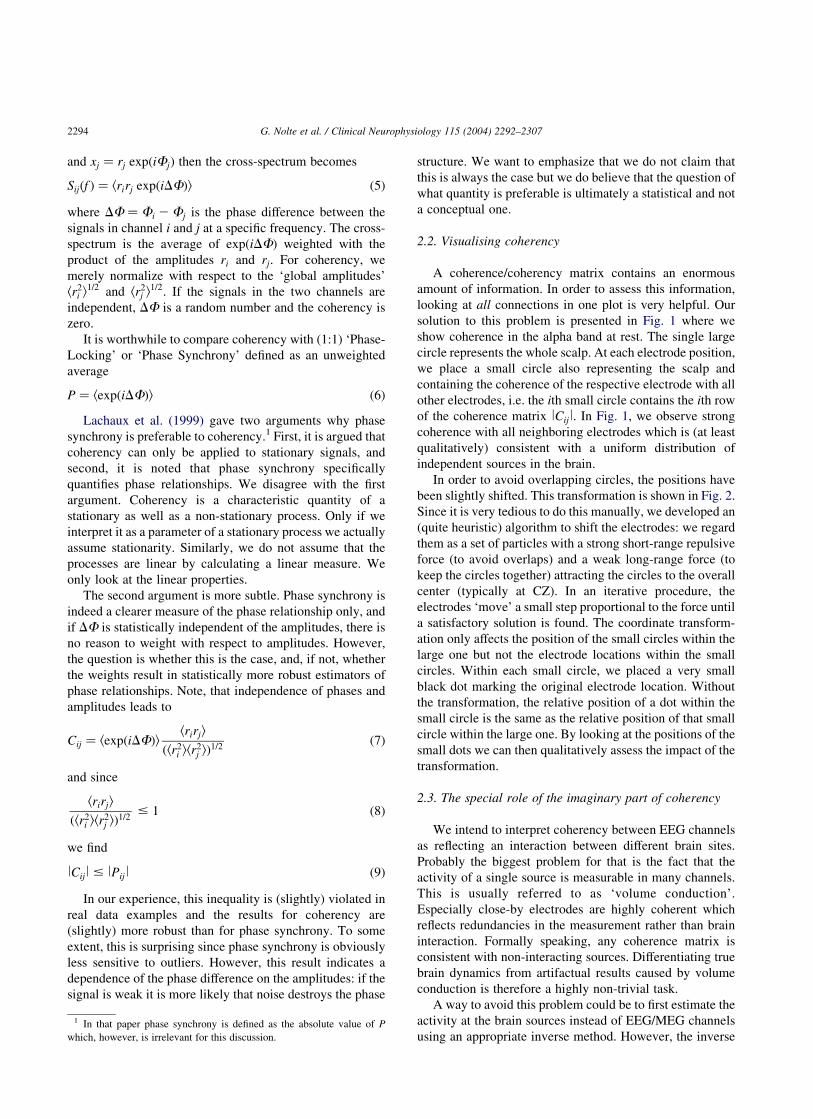
In order to avoid overlapping circles, the positions havebeen slightly shifted. This transformation is shown in Fig. 2.Since it is very tedious to do this manually, we developed an(quite heuristic) algorithm to shift the electrodes: we regardthem as a set of particles with a strong short-range repulsiveforce (to avoid overlaps) and a weak long-range force (tokeep the circles together) attracting the circles to the overallcenter (typically at CZ). In an iterative procedure, theelectrodes ‘move’ a small step proportional to the force untila satisfactory solution is found. The coordinate transform-ation only affects the position of the small circles within thelarge one but not the electrode locations within the smallcircles. Within each small circle, we placed a very smallblack dot marking the original electrode location. Withoutthe transformation, the relative position of a dot within thesmall circle is the same as the relative position of that smallcircle within the large one. By looking at the positions of thesmall dots we can then qualitatively assess the impact of thetransformation.
2.3. The special role of the imaginary part of coherency
We intend to interpret coherency between EEG channelsas reflecting an interaction between different brain sites.Probably the biggest problem for that is the fact that theactivity of a single source is measurable in many channels.This is usually referred to as ‘volume conduction’.Especially close-by electrodes are highly coherent whichreflects redundancies in the measurement rather than braininteraction. Formally speaking, any coherence matrix isconsistent with non-interacting sources. Differentiating truebrain dynamics from artifactual results caused by volumeconduction is therefore a highly non-trivial task.
A way to avoid this problem could be to first estimate theactivity at the brain sources instead of EEG/MEG channelsusing an appropriate inverse method. However, the inverse
1 In that paper phase synchrony is defined as the absolute value of P
which, however, is irrelevant for this discussion.
G. Nolte et al. / Clinical Neurophysiology 115 (2004) 2292–23072294
problem is not solvable in principle. To end up with amathematically unique solution, one has to impose a largenumber of constraints reflecting the researcher’s prejudicesabout the underlying source rather than the unknownproperties of the actual true source.
Here, we pursue a different approach. We isolate that partof coherency which necessarily reflects interaction and that isgiven by the imaginary part of the coherency. This does notreplace the ultimate goal to also localize the sources of inter-action, but the interpretation of observed synchronizations
Fig. 1. Coherence in the alpha range for one subject.
Fig. 2. Original electrode locations (left) are slightly shifted to avoid overlapping spheres (right).
G. Nolte et al. / Clinical Neurophysiology 115 (2004) 2292–2307 2295
as brain interactions does not depend on the validity of theinverse method. To see this, let us assume that the signals inchannel i and j arise from a linear superposition of Kindependent sources sk"f #
xi"f # $X
K
k$1
aiksk"f # "10#
and similarly for xj"f #: We further assume that mapping ofsources to sensors is instantaneous, implying that the phasesare not distorted resulting in real coefficients aik and ajk:
We then have for the cross-spectrum
Sij"f # $ kxi"f #xpj "f #l $X
kk0aikajk0 ksk"f #spk0"f #l
$X
k
aikajkksk"f #spk"f #l $X
k
aikajklsk"f #l2 "11#
which is real. Since the normalization is also real, it followsimmediately that coherency is also real.
For the derivation, we assumed a linear superposition ofsources which is certainly justified because the Maxwellequations are linear. The assumption that the mappingbetween sources and sensors is free of phase shifts is lesstrivial to assess. Note, that a phase shift in the frequencydomain corresponds to a time-lag in the time domain. Theimaginary part of coherency is insensitive to artifactual‘self-interaction’ caused by volume conduction because asignal is not time-lagged to itself.
In fact, our assumption that volume conduction does notcause phase shifts follows from the validity of the quasi-static approximation of the forward problem, stating thatone can ignore time-derivatives in the Maxwell equations,which actually depends on the frequencies under study.Plonsey and Heppner (1967) estimated the quasi-staticapproximation to be valid below 2 kHz. In a detailed study,Stinstra and Peters (1998) found no phase shifts for frequen-cies below 100 Hz for both EEG and MEG (higherfrequencies were not analyzed). Since we are interested infrequencies in typical EEG bands ", 50 Hz#; we believethat our assumption is justified.
At this point, we would like to make clear what weprecisely mean by stating that the imaginary part ofcoherency is insensitive to artifacts of volume conduction.Since we still measure at channels and since the sourceamplitudes are ‘volume conducted’ to the electrodes, thisvolume conduction affects where we measure whatinteraction. Furthermore, the coherency is normalized withrespect to the diagonal elements of the cross-spectrumwhich belong to the real part of it and are also affected bynon-interacting sources. Adding non-interacting sources(e.g. noise) causes a decrease in the imaginary part ofcoherency. However, it can never cause an increase und thusit cannot ‘create’ a non-vanishing imaginary part ofcoherency. The situation is slightly different for the cross-spectrum itself. While there, too, volume conduction affectswhat signal is observable at what channel, non-interacting
sources do not affect the result at all-apart, of course, fromrandom fluctuations which vanish in the mean.
The above result is, in our opinion, a relatively trivialobservation which just has not been exploited so far.Magnitude and phase of coherency are common measures ofconnectivity in many studies. Since the real and imaginaryparts of coherency are just a different representation(Cartesian instead of polar) of the complex coherency, wedo not calculate different quantities but rather we look atcoherency from a different viewpoint.
Although magnitude and phase contain the sameinformation as the real and imaginary parts, there are subtlebut important advantages/lack of disadvantages to look atthe imaginary part instead of the phase: (1) Non-interactingsources do not lead to small but rather to random phases. Wecannot interpret a phase without having an estimate of itssignificance at the same time. (2) One usually calculatescoherency with respect to a baseline (a rest condition). Sincein the individual coherencies the real parts are typicallymuch larger than the imaginary parts, the phase flips by pdepending on whether the real part of coherency is larger inthe rest or active condition. The interesting structure iseasily obscured by this rather meaningless effect. (3) Phaseis usually regarded as an additional information about timedelay between two processes. However, volume conductionstrongly affects the real part but does not create animaginary part. Processes can appear to be synchronizedwith almost vanishing time delay while it is only the volumeconducted copies of the signals which do not have a timedelay.
An illustration of the imaginary part of the same data asfor Fig. 1 is given in Fig. 3. In contrast to the absolute valueof coherency, we observe interesting structure. Althoughvery blurred, we can see interactions between occipital andleft parietal electrodes. The imaginary part of coherencybetween parietal and occipital electrodes is positive (thecentral circles are red in occipital regions) which means thecentral activity precedes the occipital one.
For comparison, we also show the phase of coherency inFig. 4. The structure now looks very different. Significantdeviation from zero phase can be seen for very remote (here:frontal and occipital) pairs of electrodes. However, this doesnot necessarily reflect an interaction. In fact, similar patternscan be seen for all frequencies, and they are likely to be aconsequence of anti-correlated ‘self-interaction’ due toopposite polarity of the electric potential of neuronal dipolesin remote electrode pairs. If the imaginary part is negligible,then anti-correlation leads to phases fluctuating near ^p.Interestingly, although the imaginary part of coherency iseasily calculated from coherence and phase, we see thisoccipital-parietal interaction neither in the coherence (Fig. 1)nor in the phase (Fig. 4) themselves which are bothdominated by the effects of volume conduction. Finally, wenote that the shown plots are actually based on one-quarterof the available data for this subject. The same plots for
G. Nolte et al. / Clinical Neurophysiology 115 (2004) 2292–23072296
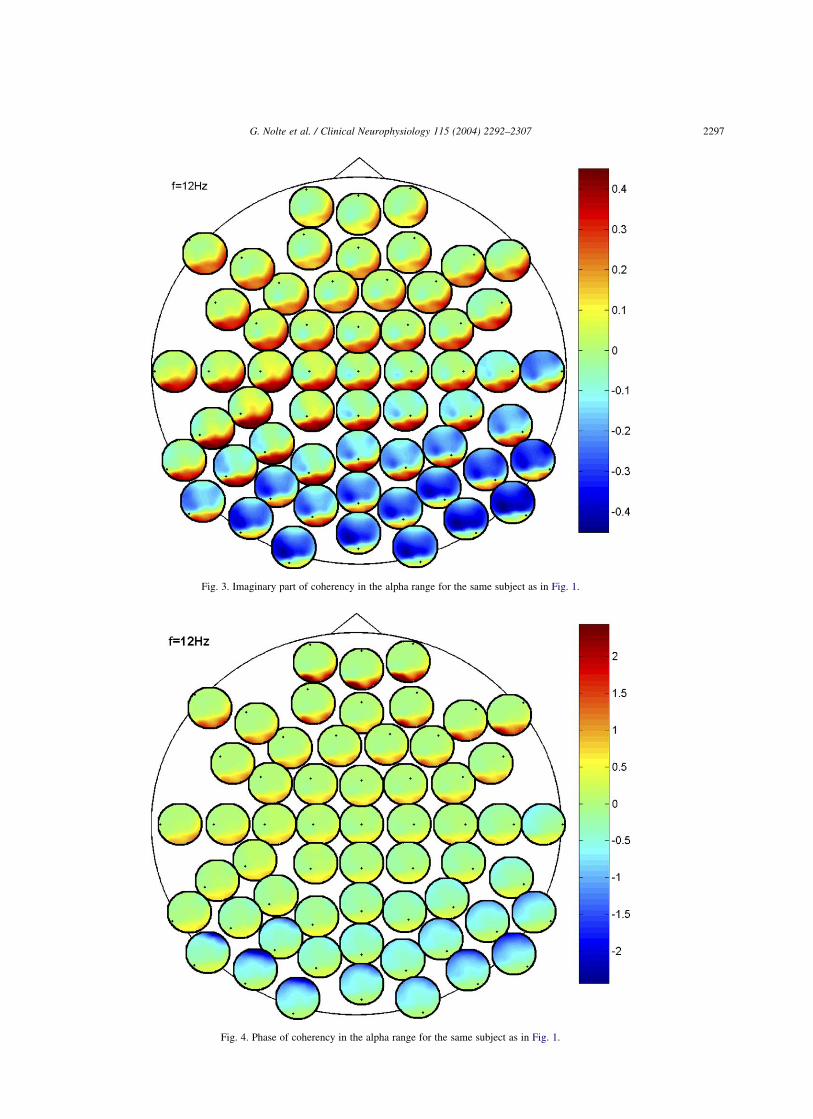
Fig. 3. Imaginary part of coherency in the alpha range for the same subject as in Fig. 1.
Fig. 4. Phase of coherency in the alpha range for the same subject as in Fig. 1.
G. Nolte et al. / Clinical Neurophysiology 115 (2004) 2292–2307 2297
the other quarters are almost undistinguishable by eye fromthe ones shown.
2.4. Statistics
2.4.1. The statistics of a single pair of channelsThe statistic for coherence is well known and described
in detail; e.g. by Rosenberg et al. (1989) or by Amjad et al.(1997). If c is a coherence calculated from N Gaussiandistributed observations, then for large N; the Fisher’s Ztransform arctanh"c# is approximately Gaussian distributedwith a standard deviation of approximately 1=
!!!!
2Np
: This is avery good approximation unless c is very close to zero. Inthis case, c is distributed like a radius of a two-dimensionalGaussian distribution and the standard deviation isoverestimated.
We are interested in the statistic of (complex) coherency.The stabilizing Z-transform of a coherency Cij then becomesa scale transformation in the complex plane:
Cij !Cij
lCijlarctanh"lCijl# ; ~Cij "12#
and ~Cij is approximately Gaussian in the two-dimensionalcomplex plane. To discuss the covariance matrix, let usfirst assume that the true phase is zero and later performa rotation to arbitrary phases. In this case, the imaginarypart fluctuates randomly around zero and must beuncorrelated with the real part. For the variance of thereal part, one obtains the usual result 1=2N: In contrast tocoherence, the real part of coherency is not constrainedto non-negative values and the approximation is alsovalid for real parts close to zero. The variance of theimaginary part is, in general, reduced due to the presenceof a non-vanishing real part. The non-transformedimaginary parts have variance "12 lCijl2#=2N whichfollows immediately from the variance of the phaseapproximately given by "1=lCijl2 2 1#=2N (Mima et al.,2000). Due to the transformation, the imaginary part isadditionally scaled by a factor arctanh"lCijl#=lCijl and thetotal variance reads
var"Im"Cij## $"12 lCijl2#
2N
arctanh2"lCijl#lCijl2
"13#
For general phases, the same arguments as for the realand imaginary parts apply for the coordinates in thedirection of the phase and orthogonal to it, respectively.In this case, the variances of real and imaginary parts arefound by projection and read
var"Re"Cij## $1
2N"g"Cij#sin2"F# ! cos2"F## "14#
var"Im"Cij## $1
2N"g"Cij#cos2"F# ! sin2"F## "15#
with the abbreviation
g"x# $ "12 lxl2# arctanh2"lxl#
lxl2"16#
To obtain an averaged coherency (over subjects) or adifference of coherencies, the average/difference is taken forthe Z-transformed coherencies and the variances addaccordingly. An exception to this rule is an average overtime which is done for the cross-spectra since we can regardthat as an increased number of epochs. A P-value iscalculated from the number of standard deviations themeasured quantity differs from zero. The averaged/differ-enced coherency is finally transformed with the inverse
~Cij !~Cij
l ~Cijltanh"l ~Cijl# "17#
2.4.2. Correction for multiple comparisons using the falsediscovery rate
To assess whether a specific spatial pattern in coherencyis significant, we must correct for multiple comparisons.Because coherencies are largely redundant in neighboringchannels with dense electrode settings, a Bonferronicorrection is surely overconservative. Here, we adopt theFalse Discovery Rate (FDR), well established in functionalmagnetic resonance imaging (Benjamini and Hochberg,1995; Benjamini and Yekutieli, 2001; Genovese et al.,2002).
FDR controls for the rate of true detections out of alldetections. The general procedure is as follows: For Ncomparisons, the P-values are sorted in ascending order"pi; i $ 1;…;N# and one finds the maximum of the "pi#which satisfies the relation
pi ,ai
Nc"N# "18#
where a is the level we control at. All P-values lower orequal to this maximum are regarded as significant detection.The function c"N# should be set according to the statistics ofthe P-values: for general distributions c"N# $ PN
i$1 1=i andfor positively correlated P-values, it is sufficient to setc"N# $ 1: Here, positively correlated P-values mean that anincreased deviation from the null-hypothesis in oneelectrode-pair does not lead to decreased deviations inother pairs. Regardless of whether one uses the ‘pessimistic’"c"N# $ P
1=i# or ‘optimistic’ "c"N# $ 1# variant of FDR,the lowest P-value is always compared to the Bonferronilevel a=N:
Setting, e.g. a $ 0:05 means that on average, 95% of alldetections are true detections. The ratio true detections/alldetections is defined as always being one if the denominator(and hence also the numerator) is zero. This means that ifthere is no true effect in (at least) 95% of hypotheticalrepetitions of the experiment, one does not detect anythingsignificant.
G. Nolte et al. / Clinical Neurophysiology 115 (2004) 2292–23072298

3. Interhemispheric connectivity in voluntaryfinger movement
3.1. Paradigm and preprocessing
In this experiment, nine right-handed subjects wereasked to perform brisk voluntary movement with either leftor right-hand fingers lasting approximately 1 s with aninterval of about 10 s between movements. The subjectswere supposed to switch randomly between left and right-hand finger movements which, in practice, turned out to bedominated by alternating movements.
The EEG was measured continuously in 122 channels ata sampling rate of 1 kHz with reference set to the rightearlobe. Impedances were kept below 5 kV. Four occipitalchannels were taken out either because they were corruptedby artefacts or because different analogue filter settings werechosen, which significantly affects the analysis of theimaginary part of coherency. EMG and EOGwere measuredsimultaneously. The remaining EEG channels were dividedinto 20 s epochs with movement onset set to 10 s. Eachepoch was divided into 80 non-overlapping segments of250 ms duration. Since the epochs are very long, there wereeye-blinks in almost all of them. Therefore, we corrected foreye-blinks (and other artefacts) segment-wise by taking outan artefact if the maximum of the detrended signal is above100 mV in any of the EEG or EOG channels. Coherency wascalculated for each segment and for all electrode pairs byapplying a Fourier-transform to Hanning windowed data.
3.2. Coherence and power
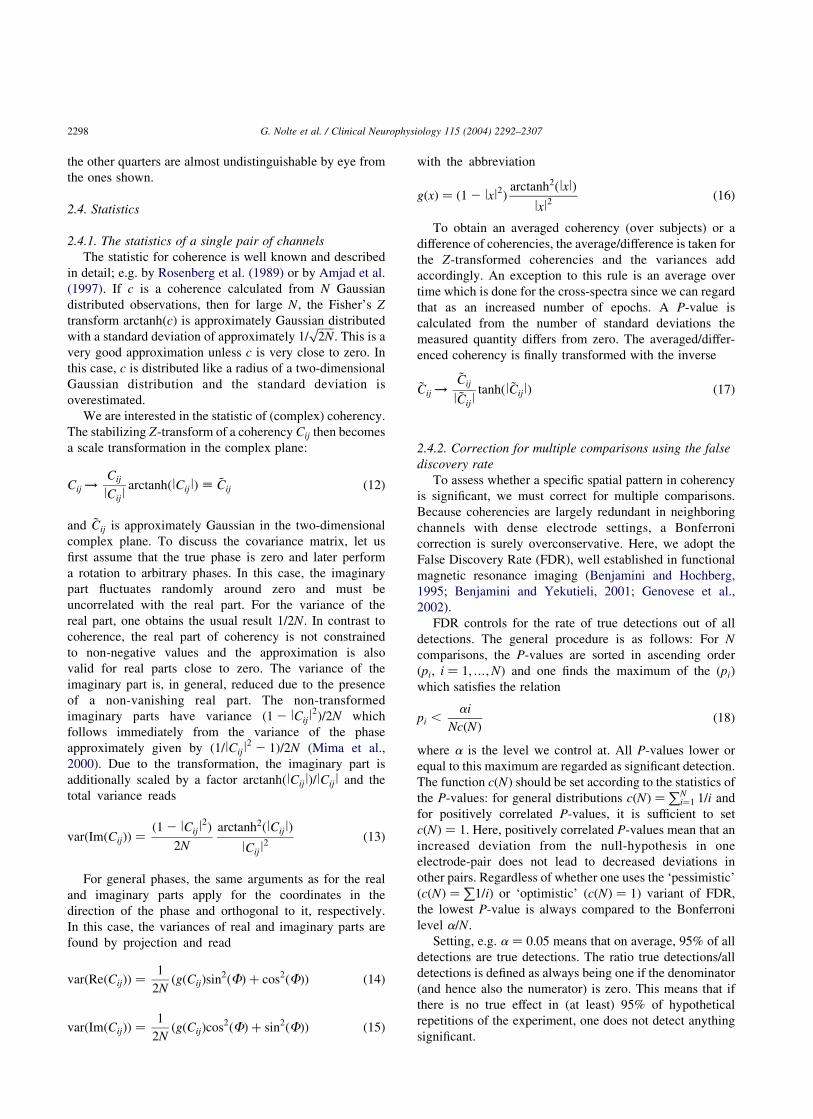
In this motor experiment, we expect to find coherence/coherency especially between electrodes over central areasclose to motor regions such as C3 and C4 which is the usualapproach in the literature. Let us first look at the coherencebetween C3 and C4 as a function of time and frequencywhich is presented in Fig. 5 for left and right-hand fingermovement and with and without subtraction of a baseline.Here (and for all the following plots), we averaged over all 9subjects. If we subtract a baseline, calculated from a time-average between 27.5 and 25 s, we observe a strongincrease of coherence during movement and a decrease ofcoherence after movement (left column) which is wellknown in the literature. It is instructive to also look at thesame coherence without subtracting a baseline (rightcolumn). Apparently, coherence is very low in the beta-range almost during the whole cycle but returns to ‘normal’during movement. This figure suggests that an observedincrease of coherence with respect to baseline duringmovement is due to the absence of beta-activity duringactivity which itself is just less coherent than backgroundnoise. In view of the later analysis of the imaginary part ofcoherency, we also plotted the difference of coherencesbetween left and right-hand movement. Although the main
effects (of course) cancel out, slight and temporarily blurreddifferences remain.
That the absence or presence of activity in the beta rangeis a factor contributing to the observed increased ordecreased coherences is supported by Fig. 6. We observesynchronization and desynchronization at the same times aswe observe changes in coherence. Interestingly, the poweralso changes in the alpha range with less pronounced changein coherence. This discrepancy between alpha and betaindicates that a mere change in the strength of the rhythm isprobably too simple an explanation for the observedchanges in coherence. For a more detailed discussion ofphenomena and possible explanations for coherence in thealpha range, we refer to the work of Florian et al. (1998). Weemphasize that we do not claim that coherence is only aconsequence of volume conduction. It is just difficult tointerpret: we do not know what part reflects real interactionand what part is due to volume conduction.
For completeness, we present the spatial pattern of powerin the beta range during and after movement in Fig. 7. Thesefindings are well known. Desynchronization during move-ment is essentially bilateral while synchronization aftermovement is clearly contralateral.
Finally, we show the full coherence during (at t $ 125 ms)and after (averaged from 2 to 4 s) movement for left handfinger movement in Figs. 8 and 9, respectively. Duringmovement we observe three rather than two foci of activity:left and right motor area and a slightly frontal area.While leftand right motor areas are common candidates for coherenceanalysis for this type of paradigm, the frontal area issomewhat a surprise. Again, whether the observed coherencereflects a true interaction is difficult to deduce from coherenceitself. Even more difficult is interpreting the spatial pattern ofcoherence after movement which also shows somewhatcentral, but at least spatially asymmetric structures. It isconceivable that the relevant activities stem from SMA but adetailed source analysis is beyond the scope of this paper.
3.3. The imaginary part of coherency
The imaginary part of coherency between C3 and C4 as afunction of time and frequency is displayed in Fig. 10. Themost prominent feature is a burst approximately 2–4 s aftermovement. For left hand finger movement, this imaginarypart is positive and for right-hand movement, it is negative.This ismost clearly seen in the left columnwhere a baseline issubtracted but it is even visible in the coherency withoutbaseline subtraction, although a relatively strong backgroundactivity is present mainly in the alpha but also in the betarange.
In general, if the imaginary part of C"x; y# is positive,then x and y are interacting and x is earlier than y; indicatingthat information is flowing from x to y: At specificfrequencies, however, ‘earlier’ and ‘later’ are ambigious;e.g. at 10 Hz 10 ms earlier is the same as 90 ms later. For thepresent interpretation we assumed that the smaller delay in
G. Nolte et al. / Clinical Neurophysiology 115 (2004) 2292–2307 2299
Fig. 5. Coherence as a function of time and frequency for right and left hand finger movement. In the left column, a baseline was subtracted consisting of the
coherence time-averaged in the interval %27:5 s;25 s&:
Fig. 6. Relative power as a function of time and frequency in C3 and C4. Displayed is log"P=Prest# where Prest is calculated from a time average between27.5
and 25 s.
G. Nolte et al. / Clinical Neurophysiology 115 (2004) 2292–23072300

absolute value is the more probable explanation; e.g. in theabove example we would favor ‘10 ms earlier’ over ‘90 mslater’. Note, that we can make this interpretation just fromthe sign of the imaginary part of coherency without actuallycalculating a delay for which we would need a reliable realpart of coherency.
The signs for the post-movement activity indicate that theinteraction is directed from the ipsilateral to the contralateralside. This might be considered as surprising since, generally,the contralateral hemisphere is expected to control move-ments. However, over a relatively long period of approxi-mately 5 s prior to movement, we also observe the opposite
Fig. 7. Spatial pattern of relative power in the beta-range during movement (at t $ 125 ms) and after movement (averaged from 2 to 4 s) for left and right-handfinger movement. Displayed is log"P=Prest# where Prest is calculated from a time average between 27.5 and 25 s.
Fig. 8. Coherence in the beta range between all channel pairs during left hand finger movement.
G. Nolte et al. / Clinical Neurophysiology 115 (2004) 2292–2307 2301
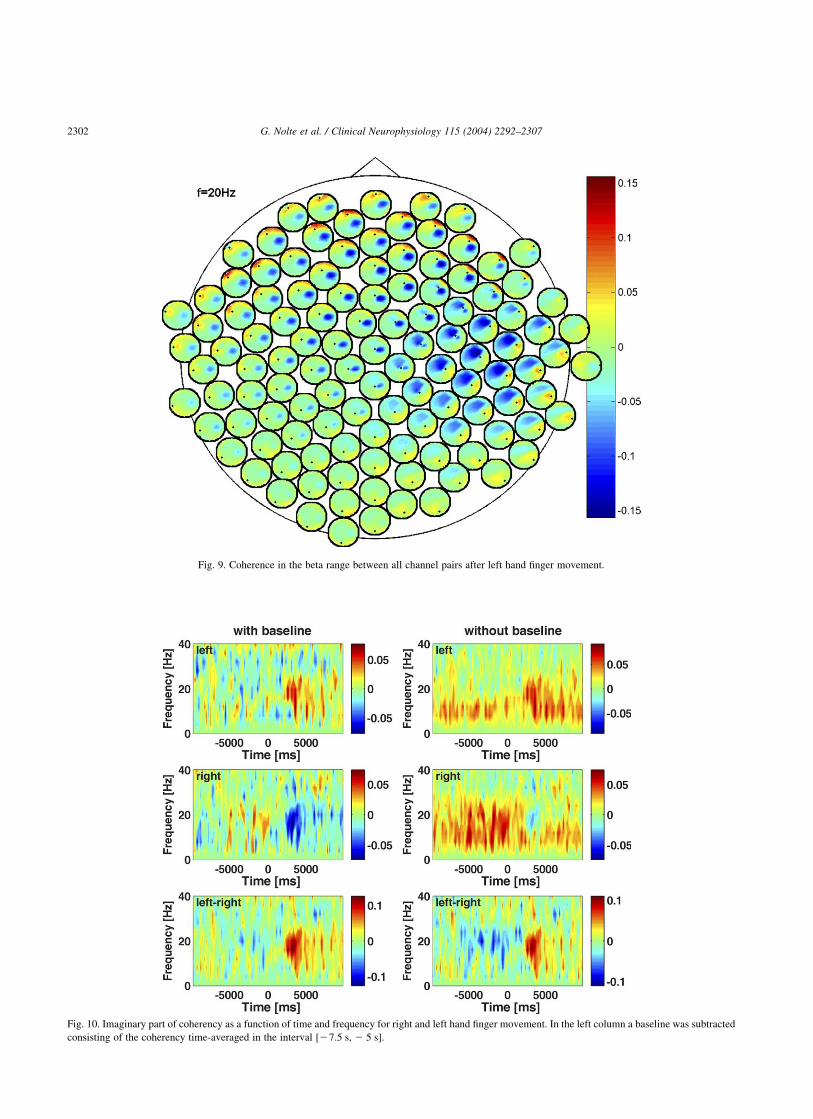
Fig. 9. Coherence in the beta range between all channel pairs after left hand finger movement.
Fig. 10. Imaginary part of coherency as a function of time and frequency for right and left hand finger movement. In the left column a baseline was subtracted
consisting of the coherency time-averaged in the interval [27.5 s, 2 5 s].
G. Nolte et al. / Clinical Neurophysiology 115 (2004) 2292–23072302
behaviour: the imaginary part of coherency between C3 andC4 is largely negative. This can only be seen if we do notsubtract a baseline and most clearly if we look at thedifference between left and right-hand finger movement.
In contrast to coherence, subtracting left and rightfinger movement for the imaginary part of coherencyenhances the signal we are interested in. This is indeed aconsequence of the antisymmetry of the imaginary part"Im"Cij# $ 2Im"Cji##: If we have a paradigm where the leftand right hemispheres switch their roles, then the differenceis potentially a very useful quantity. Let us denote by CR
ij andCLij coherencies of right and left hand finger movement,
respectively. If we assume that
CLC4;C3 < CR
C3;C4 "19#
we get for the difference
Im"CLC3;C4#2 Im"CR
C3;C4# < Im"CLC3;C4#2 Im"CL
C4;C3#
$ Im"CLC3;C4# ! Im"CL
C3;C4# "20#
and we double the signal. Note, that in this difference,anything which is not task-related cancels out and hencethe task itself serves as an almost perfect baseline. Similar tothe study of lateralized readiness potentials (Vidal et al.,2003), we also miss interactions which are identical in leftand right-hand finger movement. However, since for theimaginary part of coherency, this difference gives theclearest signal, from now on we will focus on thisdifference. We want to emphasize that for this constructionto be meaningful it is unnecessary that the hemispheresexactly switch their roles between the left and right-handparadigm; rather, we enhance that part which does have thisproperty. In other words, we look for this property ratherthan assume it; Eq. (20) is the reasoning behind taking thedifference rather than an assumed accurate property of braininteraction.
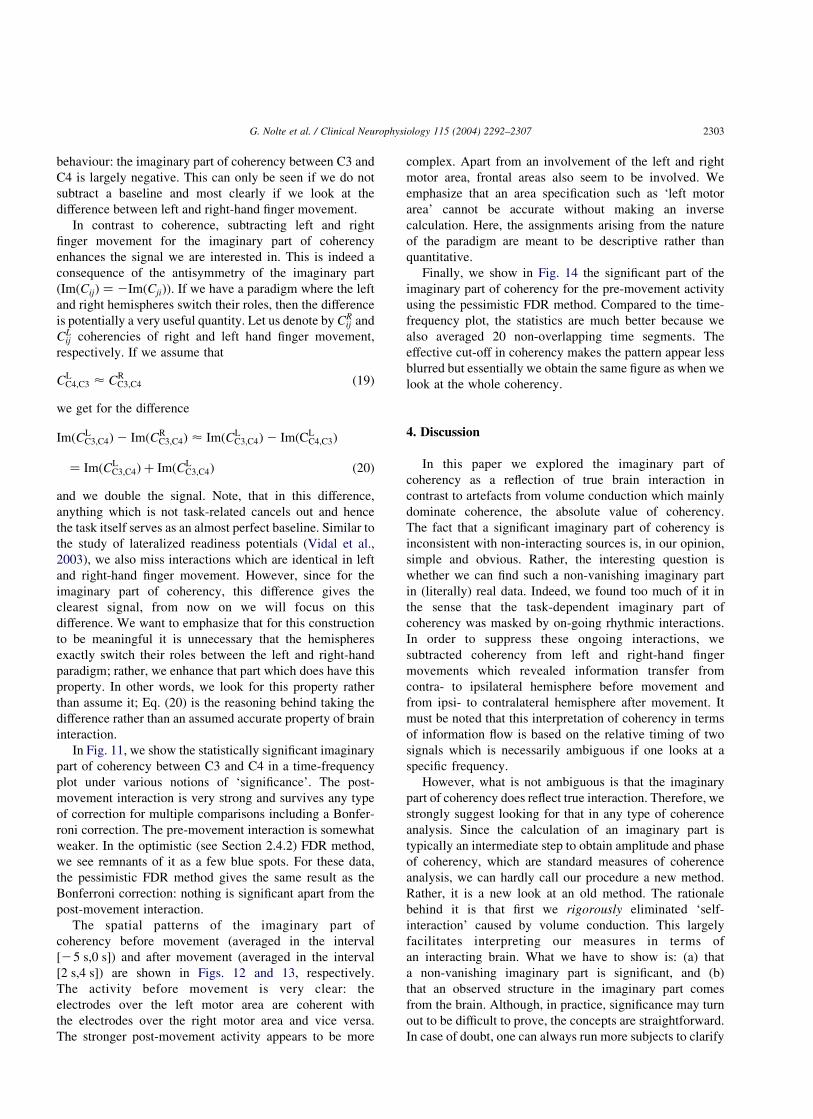
In Fig. 11, we show the statistically significant imaginarypart of coherency between C3 and C4 in a time-frequencyplot under various notions of ‘significance’. The post-movement interaction is very strong and survives any typeof correction for multiple comparisons including a Bonfer-roni correction. The pre-movement interaction is somewhatweaker. In the optimistic (see Section 2.4.2) FDR method,we see remnants of it as a few blue spots. For these data,the pessimistic FDR method gives the same result as theBonferroni correction: nothing is significant apart from thepost-movement interaction.
The spatial patterns of the imaginary part ofcoherency before movement (averaged in the interval[25 s,0 s]) and after movement (averaged in the interval[2 s,4 s]) are shown in Figs. 12 and 13, respectively.The activity before movement is very clear: theelectrodes over the left motor area are coherent withthe electrodes over the right motor area and vice versa.The stronger post-movement activity appears to be more
complex. Apart from an involvement of the left and rightmotor area, frontal areas also seem to be involved. Weemphasize that an area specification such as ‘left motorarea’ cannot be accurate without making an inversecalculation. Here, the assignments arising from the natureof the paradigm are meant to be descriptive rather thanquantitative.
Finally, we show in Fig. 14 the significant part of theimaginary part of coherency for the pre-movement activityusing the pessimistic FDR method. Compared to the time-frequency plot, the statistics are much better because wealso averaged 20 non-overlapping time segments. Theeffective cut-off in coherency makes the pattern appear lessblurred but essentially we obtain the same figure as when welook at the whole coherency.
4. Discussion
In this paper we explored the imaginary part ofcoherency as a reflection of true brain interaction incontrast to artefacts from volume conduction which mainlydominate coherence, the absolute value of coherency.The fact that a significant imaginary part of coherency isinconsistent with non-interacting sources is, in our opinion,simple and obvious. Rather, the interesting question iswhether we can find such a non-vanishing imaginary partin (literally) real data. Indeed, we found too much of it inthe sense that the task-dependent imaginary part ofcoherency was masked by on-going rhythmic interactions.In order to suppress these ongoing interactions, wesubtracted coherency from left and right-hand fingermovements which revealed information transfer fromcontra- to ipsilateral hemisphere before movement andfrom ipsi- to contralateral hemisphere after movement. Itmust be noted that this interpretation of coherency in termsof information flow is based on the relative timing of twosignals which is necessarily ambiguous if one looks at aspecific frequency.
However, what is not ambiguous is that the imaginarypart of coherency does reflect true interaction. Therefore, westrongly suggest looking for that in any type of coherenceanalysis. Since the calculation of an imaginary part istypically an intermediate step to obtain amplitude and phaseof coherency, which are standard measures of coherenceanalysis, we can hardly call our procedure a new method.Rather, it is a new look at an old method. The rationalebehind it is that first we rigorously eliminated ‘self-interaction’ caused by volume conduction. This largelyfacilitates interpreting our measures in terms ofan interacting brain. What we have to show is: (a) thata non-vanishing imaginary part is significant, and (b)that an observed structure in the imaginary part comesfrom the brain. Although, in practice, significance may turnout to be difficult to prove, the concepts are straightforward.In case of doubt, one can always run more subjects to clarify
G. Nolte et al. / Clinical Neurophysiology 115 (2004) 2292–2307 2303
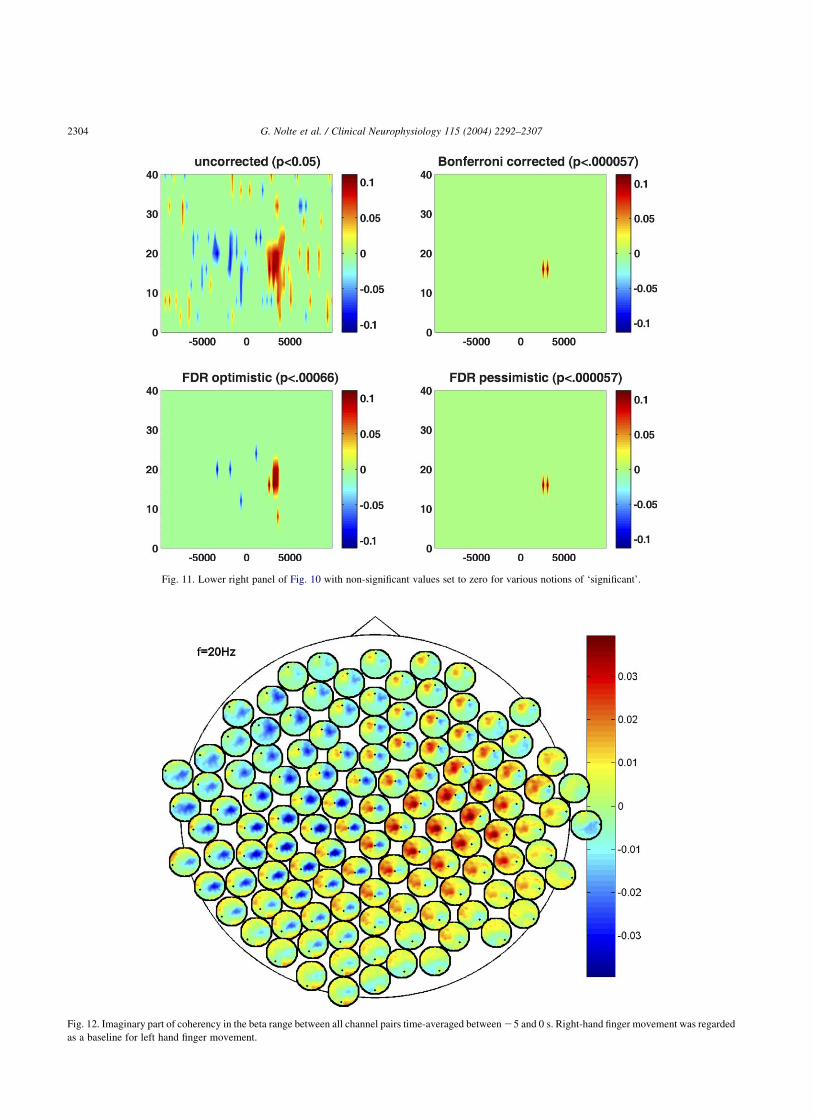
Fig. 11. Lower right panel of Fig. 10 with non-significant values set to zero for various notions of ‘significant’.
Fig. 12. Imaginary part of coherency in the beta range between all channel pairs time-averaged between25 and 0 s. Right-hand finger movement was regarded
as a baseline for left hand finger movement.
G. Nolte et al. / Clinical Neurophysiology 115 (2004) 2292–23072304
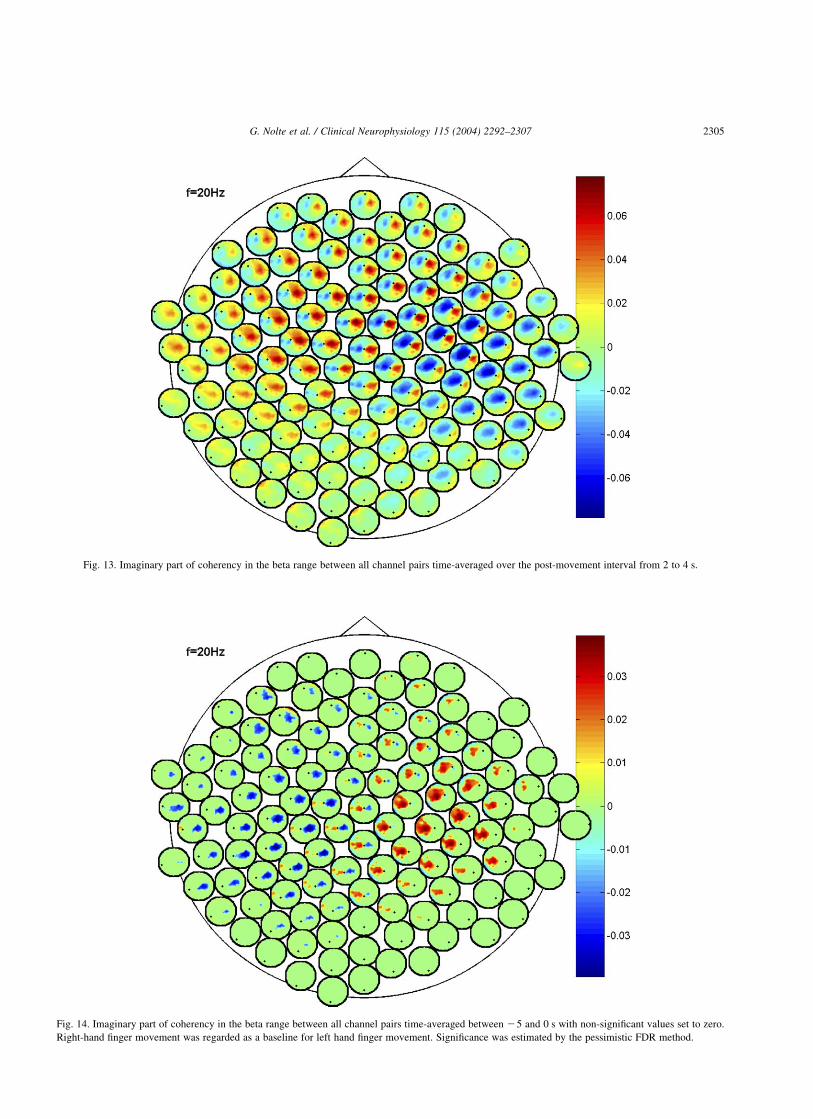
Fig. 13. Imaginary part of coherency in the beta range between all channel pairs time-averaged over the post-movement interval from 2 to 4 s.
Fig. 14. Imaginary part of coherency in the beta range between all channel pairs time-averaged between 25 and 0 s with non-significant values set to zero.
Right-hand finger movement was regarded as a baseline for left hand finger movement. Significance was estimated by the pessimistic FDR method.
G. Nolte et al. / Clinical Neurophysiology 115 (2004) 2292–2307 2305
an issue. That an observed structure originates from thebrain is usually quite obvious from the qualitative spatialpattern of the interaction. One can obtain a moredetailed picture of the origin of the coherency frominverse calculations which, however, is beyond the scopeof this paper.
The important question in the context of this paper iswhether the imaginary part of coherency is superior to othermeasures of brain connectivity. In our opinion, this isclearly the case if the citerion is how robust the method is toartefacts from volume conductions. Recently, more com-plicated methods have become popular. In the directedtransfer function (DTF) approach, a linear autoregressivemodel is fitted to the data and interaction is deduced andcharacterized from mixing coefficients (Baccala andSameshima, 2001; Cassidy and Brown, 2003; Hesse et al.,2003; Kaminski et al., 2001; Korzeniewska et al., 2003;Mima et al., 2001). DTF can be regarded as a special versionof the more general concept of Granger causality (Chavezet al., 2003; Hesse et al., 2003; Kaminski et al., 2001). Asignal A is said to Granger cause signal B if the present andpast of signal A contains information about the future ofsignal B not contained in the present or past of signal Bitself. Ideally, this solves the problem of volume conductionbecause a copy of a signal does not contain additionalinformation. The problem, however, is additive noise. If Acontains a simple and predictable signal plus white noise,then all we can expect in the prediction of the future is agood estimate of the predictable part. This estimate will beimproved if we average the channels A and B, the latter, say,containing the same signal plus white noise independent ofthe noise in A.
A similar argument applies to estimating the directionof information flux. This direction is usually estimatedfrom the asymmetry in the Granger causality: theinformation flux goes from A to B if A provides moreuseful information to predict B than vice versa. Asymme-tries, however, can also be due to asymmetric noiselevels. Let us discuss an extreme case: if A is noise-freeand contains only a simple and predictable signal and Bcontains the same signal plus white noise then B cannotcontribute additional information to predict the future of Abut knowing A is optimal to predict the future of B. Inpractice, channels are not noise-free but noise levels orsignal-to-noise-ratios vary substantially between channels,and it is conceivable that an estimated direction ofinformation flux using Granger causality merely indicatesthe direction from ‘good’ to ‘bad’ channels.
Coherency is a linear measure: for a linear (andstationary) system the cross-spectrum, on which coherencyis based, completely determines the dynamics. There isnothing more to know. For non-linear systems, however,coherency might yield only an incomplete picture and moregeneral non-linear measures might be preferable. However,‘sensitive to more’ also means ‘potentially less robust’.With regard to the difficulty to even detect non-linear
dynamics in human EEG (Stam et al., 1999; Theiler andRapp, 1996), it is questionable whether non-linear methodsare superior to linear ones, unless, of course, the non-linearity of the dynamics is the objective of a study itself.
We believe that the imaginary part of coherency is a veryuseful measure to study brain connectivity. Being incon-sistent with non-interacting sources its presence necessarilyreflects a dynamical interaction in contrast to volumeconducted ‘self-interaction’. Since volume conduction is, inour opinion, the main obstacle in interpreting EEG/MEGdata in terms of brain connectivity, the value of such aproperty cannot be overemphasized. It is possible that inmany studies the imaginary parts of coherencies essentiallyvanish. This could mean that there is no interaction(measured by EEG/MEG) or that the interaction betweentwo sources is not delayed or rather symmetrically delayedsuch that none of the sources leads the other one.
This was found by Roelfsema et al. (1997), where theauthors report ‘zero time-lag synchronization amongcortical areas’ in visuomotor integration studied in cats.However, the title of that paper is rather sketchy, e.g. theauthors found a small (<2 ms) but non-zero time-lagbetween area 18 and 21. A time-lag of 2 ms at 20 Hz caninduce an imaginary part of the coherency up to sin"2 'ms £ 2p=50 ms# < 0:25 which is much larger than what wehave observed. Indeed, the authors argue that the observedsynchronization is not mediated by volume conductionbecause the time-lag is non-vanishing and because thecross-correlation is asymmetric. Since a symmetric cross-correlation is equivalent to a vanishing imaginary part ofcoherency, which follows from the fact that the imaginarypart of the cross-spectrum is the Fourier-transform of theantisymmetric part of the cross-covariance, our argument isalso equivalent.
Larger time-lags in the beta-range were found byTallon-Baudry et al. (2001) in visual areas during rehearsalof an object in visual short-term memory studied withintracranial EEG in epilepsy patients. The authors report fortwo subjects stable time-lags of 5.4 and 12.4 ms in waveswith period 50 and 62.5 ms, respectively. Note, that thetime-lag in the second subject is almost a quarter periodgiving rise to an almost vanishing real part of the coherency.
There is always a trade-off between how much we wantto say about a system and how sure we are that what we sayis correct. By looking at the imaginary part of coherency, wetake an extreme position. We see, at best, only half of thepicture. But that half is safe. In conclusion, we do not thinkthat our approach can replace ‘classical’ analysis, but werecommend analyzing the imaginary part of coherencyseparately in all coherence studies.
References
Amjad AM, Halliday DM, Rosenberg JR, Conway BA. An extended
difference of coherence test for comparing and combining several
G. Nolte et al. / Clinical Neurophysiology 115 (2004) 2292–23072306
independent coherence estimates: theory and application to the study ofmotor units and physiological tremor. J Neurosci Methods 1997;73:
69–79.
Andrew C, Pfurtscheller G. Lack of bilateral coherence of post-movement
central beta oscillations in the human electroencephalogram. NeurosciLett 1999;273:89–92.
Baccala LA, Sameshima K. Partial directed coherence: a new concept in
neural structure determination. Biol Cybern 2001;84:463–74.Baillet S, Mosher JC, Leahy RM. Electromagnetic brain mapping. IEEE
Signal Process Mag 2001;18:14–30.
Benjamini Y, Hochberg Y. Controlling the false discovery rate: a
practicaland powerful approach to multiple testing. J R Stat Soc B1995;57:289–300.
Benjamini Y, Yekutieli D. The control of the false discovery ratein multiple
testing under dependency. Ann Stat 2001;29:1165–88.
Cassidy M, Brown P. Spectral phase estimates in the setting ofmultidirectional coupling. J Neurosci Methods 2003;127:95–103.
Chavez M, Martinerie J, Le Van Quyen M. Statistical assessment of
nonlinear causality: application to epileptic EEG signals. J NeurosciMethods 2003;124:113–28.
Fein G, Raz J, Brown FF, Merrin EL. Common reference coherence data
are confounded by power and phase effects. Electroencephalogr Clin
Neurophysiol 1988;69:581–4.Florian G, Andrew C, Pfurtscheller G. Do changes in coherence always
reflect changes in functional coupling? Electroencephalogr Clin
Neurophysiol 1998;106:87–91.
Genovese CR, Lazar NA, Nichols T. Thresholding of statistical maps infunctional neuroimaging using the false discovery rate. Neuroimage
2002;15:870–8.
Gerloff C, Andres FG. Bimanual coordination and interhemispheric
interaction. Acta Psychol (Amst) 2002;110:161–86.Ginter Jr J, Blinowska KJ, Kaminski M, Durka PJ. Phase and amplitude
analysis in time-frequency space: application to voluntary finger
movement. J Neurosci Methods 2001;110:113–24.Gross J, Kujala J, Hamalainen M, Timmermann L, Schnitzler A, Salmelin
R. Dynamic imaging of coherent sources: studying neural interactions
in the human brain. Proc Natl Acad Sci USA 2001;98:694–9.
Hesse W, Moller E, Arnold M, Schack B. The use of time-variant EEGGranger causality for inspecting directed interdependencies of neural
assemblies. J Neurosci Methods 2003;124:27–44.
Lachaux JP, Rodriguez E, Martinerie J, Varela FJ. Measuring phase
synchrony in brain signals. Hum Brain Mapp 1999;8:194–208.Leocani L, Toro C, Manganotti P, Zhuang P, Hallett M. Event-related
coherence and event-related desynchronization/synchronizationin
the 10 Hz and 20 Hz EEG during self-paced movements. Electro-encephalogr Clin Neurophysiol 1997;104:199–206.
Kaminski M, Ding M, Truccolo WA, Bressler SL. Evaluating causal
relations in neural systems:granger causality, directed transfer function
and statistical assessment of significance. Biol Cybern 2001;85:145–57.
Korzeniewska A, Manczak M, Kaminski M, Blinowska KJ, Kasicki S.
Determination of information flow direction among brain structures by
amodified directed transfer function (dDTF) method. J Neurosci
Methods 2003;125:195–207.
Manganotti P, Gerloff C, Toro C, Katsuta H, Sadato N, Zhuang P, Leocani
L, Hallett M. Task-related coherence and task-related spectral power
changes during sequential finger movements. Electroencephalogr Clin
Neurophysiol 1998;109:50–62.
Mima T, Matsuoka T, Hallett M. Functional coupling of human right and
left cortical motor areas demonstrated with partial coherence analysis.
Neurosci Lett 2000;287:93–6.
Mima T, Matsuoka T, Hallett M. Information flow from the sensorimotor
cortex to muscle in humans. Clin Neurophysiol 2001;112:122–6.
Nunez PL, Srinivasan R, Westdorp AF, Wijesinghe RS, Tucker DM,
Silberstein RB, Cadusch PJ. EEG coherency. I. Statistics, reference
electrode, volume conduction, Laplacians,cortical imaging, and
interpretation at multiple scales. Electroencephalogr Clin Neurophysiol
1997;103:499–515.
Nunez PL, Silberstein RB, Shi Z, Carpenter MR, Srinivasan R, Tucker DM,
Doran SM, Cadusch PJ, Wijesinghe RS. EEG coherency. II.
Experimental comparisons of multiple measures. Clin Neurophysiol
1999;110:469–86.
Pfurtscheller G, Andrew C. Event-related changes of band power and
coherence: methodology and interpretation. J Clin Neurophysiol 1999;
16:512–9.
Roelfsema PR, Engel AK, Konig P, Singer W. Visuomotor integration is
associated with zero time-lag synchronization among cortical areas.
Nature 1997;385:157–61.
Rosenberg JR, Amjad AM, Breeze P, Brillinger DR, Halliday DM. The
Fourier approach to the identification of functional coupling between
neuronal spike trains. Prog Biophys Mol Biol 1989;53:1–31.
Plonsey R, Heppner D. Considerations on quasi-stationarity in electro-
physiological systems. Bull Math Biophys 1967;29:657–64.
Sarvas J. Basic mathematical and electromagnetic concepts of the
biomagnetic inverse problem. Phys Med Biol 1987;32:11–22.
Stam CJ, Pijn JPM, Suffczynski P, Lopes da Silva FH. Dynamics of the
human alpha rhythm: evidence for non-linearity? J. Clin. Neurophysiol.
1999;110:1801–13.
Stinstra JG, Peters MJ. The volume conductor may act as a temporal filter
on the ECG and EEG. Med Biol Eng Comput 1998;36:711–6.
Tallon-Baudry C, Bertrand O, Fischer C. Oscillatory synchrony between
human extrastriate areas during visual short-termmemory maintenance.
J Neurosci 2001;21:RC177.
Theiler J, Rapp PE. Re-examination of the evidence for low-dimensional,
non-linear structure in the human electroencephalogram. Electromyogr
Clin Neurophysiol 1996;98:213–22.
Vidal F, Grapperon J, Bonnet M, Hasbroucq T. The nature of unilateral
motor commands in between-hand choice tasksas revealed by surface
Laplacian estimation. Psychophysiology 2003;40:796–805.
G. Nolte et al. / Clinical Neurophysiology 115 (2004) 2292–2307 2307


![WONOEP appraisal: Imaging biomarkers in epilepsy...recent advances in identifying the irritative zone (e.g., scalp and intracranial electroencephalography–functional MRI [EEG-fMRI])](https://img.pdfslide.net/doc/110x75/6055314f35bedc66711e5aef/wonoep-appraisal-imaging-biomarkers-in-epilepsy-recent-advances-in-identifying.jpg)


![NSF Project EEG CIRCUIT DESIGN. Micro-Power EEG Acquisition SoC[10] Electrode circuit EEG sensing Interference](https://img.pdfslide.net/doc/110x75/56649cfb5503460f949ccecd/nsf-project-eeg-circuit-design-micro-power-eeg-acquisition-soc10-electrode.jpg)