Embed Size (px)
Citation preview
1
Identity, Trust and Altruism:
An Experiment on Preferences and Microfinance Lending
Josie I Chen1, Andrew Foster2, and Louis Putterman3#
1 Department of Economics, National Taipei University, No.151, Daxue Rd., Sanxia Dist., New Taipei City 23741, Taiwan (R.O.C.). Email: [email protected]. 2 Department of Economics, Brown University, 64 Waterman St, Providence, RI 02912, U.S.A. Email: [email protected] 3 Department of Economics, Brown University, 64 Waterman St, Providence, RI 02912, U.S.A. Email: [email protected] # Corresponding author. [email protected]. TEL: +1 (401) 863-3837.
Abstract. We construct a dedicated web interface and use it to conduct a laboratory experiment to study willingness to lend and preference over borrowers in micro-finance lending. We distinguish between perceptions of transaction-related factors, such as neediness and trustworthiness, and identity-related factors such as ethnicity and gender. By looking at both channels together we are able to assess the extent to which identity-related differences in lending can be attributed to differences in how transaction-related factors are perceived among people with similar and different identities. We find that (1) both financial return and philanthropic motivation affect the amount lent, with little evidence that the former crowds out the latter; (2) lenders have a statistically significant preference for borrowers with whom they share gender and ethnic similarity even after controlling for perceived riskiness, neediness, and other factors including physical attractiveness and weight; and (3) lenders are willing to trade greater risk in order to help more needy borrowers, but at a rate sensitive to their own degree of financial exposure.
Keywords: microfinance, pro-social preferences, gender, ethnicity, homophily, discrimination JEL codes: C91, D64, O17, J15
2
1. Introduction
In mid-2017, Americans were reported by the Federal Deposit Insurance Corporation
to be holding almost $11 trillion of savings in bank accounts, the lion’s share in checking and
other accounts paying only nominal rates of interest. At the same time, small farmers and
business operators in less developed countries were seeking billions of dollars to finance their
farms and enterprises, with interest rates averaging around 27% offered by microfinance
institutions standing at the low end of the available supply, and with much microfinance
lending coming from conventional banks, not non-profits.1 Why more money was not
flowing from rich country savers to poor country borrowers is part of the broader question of
why capital fails to flow in greater quantities from developed to developing countries (Lucas,
1990). But a further puzzle is why this flow is not larger considering that a substantial share
of rich country savings is held by members of a reportedly values-conscious generation said
to “integrate their beliefs and causes into their choice of companies to support” and to “make
an effort to buy products from companies that support the causes they care about” (Solomon,
2014). Would such values-conscious consumers not be attracted to savings vehicles offering
both a higher return than their checking accounts and the warm glow of helping poor
countries’ hard working, capital starved entrepreneurs? Or is this seeming win-win
opportunity a non-starter due to the “hidden cost of reward,” as discussed by Benabou and
Tirole (2003)? To answer this question and provide broader insights into the trade-off
between philanthropic and financial incentives in the context of lending to small-scale
entrepreneurs, we designed a decision experiment in which U.S. student subjects are faced
with lending decisions under different conditions of return and of information about the
charitable nature of the opportunity. Our experiment also permits unusually careful analysis of the degree to which
willingness to lend in this context is influenced by identity considerations. Specifically, once
our subjects determine the amount they wish to lend, they also evaluate and rank individual
prospective borrowers, similar to the choosing of borrowers by lenders that occurs in on-line
lending platforms such as kiva.org and zidisha.org. Ethnic and other forms of identity have
long been thought to play an important role in social networks. For example, in choosing a
marriage partner, most people prefer someone who resembles them (see review in Kalmijn,
1998); in renting an apartment, many prefer to rent from someone of the same ethnicity;
ethnic clustering of immigrants is widely observed in the world’s cities (for example,
1 Estimated average interest rate based on Awaworyi Churchill et al. (2015).
3
Constant et al., 2013); and people tend to make friends in high school of the same ethnicity
(Currarini, Jackson and Pin, 2009).2 Evidence of such identity effects have also been
confirmed in lab and field experiments; people make more charitable donations to those who
share their ethnicity and send back more money to trustors when it is known that their
partners are of the same ethnicity (Fong and Luttmer, 2009; Glaeser, Laibson, Scheinkman
and Soutter, 2000).
Yet homophily does not always dominate other considerations. Several experimental
studies show that where the trustworthiness or reciprocity of a partner is a top concern,
members of one’s own group can be disfavored if those in another group are viewed as a
safer option (Andreoni and Petrie, 2008; Chuah et al., 2007; Fershtman and Gneezy, 2001;
Friesen et al., 2012; List and Price, 2009). Members of an advantaged group might also prefer
to help those from groups not their own because they are perceived as more needy (for
instance, white Americans donating to African famine relief; see also Eckel & Grossman
(1996) and Konow (2010) for lab experiment results).3
Perceptions of other groups may also importantly influence homophilic behavior. The
same visual cues may be interpreted differently by individuals with whom one shares a
context than with someone from a different group. While this issue has received little direct
attention by economists, there is a related sociological literature that looks at differences in
trustworthiness within and across races. Simpson et al. (2007) show that cross-group play in a
trust game differs significantly from within-group play, for example, and Abascal and
Baldassari (2015) look at reported trustworthiness across races in an observational study. But
neither study considers neediness; nor is a link made in either study between reported
perceptions and behaviors.
Hoping to better understand the motives behind peer-to-peer and possibly more
generalizable retail microfinance lending, as well as to investigate the intersection of
homophily, beliefs about trustworthiness, and judgment of need, we recruited subjects
without known past interest in microfinance and offered them opportunities to keep for
themselves or lend part or all of $10. We used our own free-standing web interface. This
interface shares some features of a one-to-one microfinance lending platform, but it has an
additional degree of experimenter control, including separation of the lending decision from
the choice of borrower, as well as substantial additional information capture. In the first
2 TED talk by Airbnb co-founder and Chief Product Officer Joe Gebbia, “How Airbnb Designs for Trust,” 2016 (weblink: https://www.ted.com/talks/joe_gebbia_how_airbnb_designs_for_trust?language=zh-tw). 3 Consider the impact of the Malian girl’s photograph in Small, Loewenstein and Slovic (2007).
4
stage, we varied across treatments the potential return to the lender and the lender’s
knowledge, at the moment of choice, regarding the poverty status of recipients (i.e. that
borrowers were poor country micro-entrepreneurs). Being separated from information and
evaluation of individual borrowers, decisions at this stage are similar to those a prospective
saver might make when faced with a banking product like a CD or money market fund,
which could conceivably advertise that all or most funds go to developing world
microfinance partners as a “hook” to lure value-conscious customers.4 Having made his or
her decision on the amount to lend, each subject was then asked to choose specific
borrowers—identifiable via photos, first names, and descriptions—from a panel of choices
structured to give equal representation to both genders and to each of three broad
regional/ethnic groupings. Finally, we elicited considerably richer information about our
lenders’ identities and backgrounds than has been available to past studies; we used tasks to
measure their risk-aversion and time preference; and we elicited their assessments of
individual borrowers’ repayment prospects and “neediness.” Separately, we collected
independent assessments—from individuals not engaged in the experimental sessions—of the
same borrowers’ repayment prospects and neediness, as well as their attractiveness,
happiness, weight, and other features, as conveyed by their photos. We minimized social
pressure by making lender decisions anonymous to the experimenters and avoiding the
physical presence of the borrowers, which may complicate other studies of identity effects in
cooperation and philanthropy (see below).
We find that the large majority of subjects are willing to make loans and respond
positively both to financial incentives and to a depiction of borrowers as poor micro-
entrepreneurs, inviting interpretation of the choice as a philanthropic opportunity. We find
little indication of crowding out. In line with most past studies, we find evidence of an
identity or homophily effect; lenders have a bias toward lending to borrowers of matching
ethnicity (as defined below) and to borrowers of the same gender. This holds true even when
we control for judgment of borrower riskiness and neediness, each of which is also a
significant determinant of which borrowers are chosen, although usually not significantly
affected by the intersection of lender and borrower ethnicity. We show evidence of a
4The resemblance is imperfect in that our subjects bore the risk of non-repayment, whereas a bank would presumably take on that risk by bundling together large sets of loans to different intermediaries that likewise do the same. In addition, our subjects were told that once they made their lending decision they would proceed to a final part of the experiment in which they would see information about prospective individual borrowers and get to indicate their preference among them. However, no information about individual borrowers was displayed at the time of the lending decision itself.
5
philanthropic motive in lending decisions, with significant preference for borrowers
evaluated as needier, but limited willingness to bear additional risk toward this end.
The rest of the paper proceeds as follows. In Section 2, we discuss the literatures on
homophily, trust, charity, and crowding out, and briefly describe relevance to the lending side
of microfinance. Section 3 details our experimental design and provides a theoretical
framework to structure hypotheses about the impacts of identity, risk aversion, assessment of
trustworthiness, and perceived need. Section 4 begins with a discussion of subjects’ initial
lending decisions, then provides a detailed analysis of lenders’ choices of whom to lend to in
the potential borrower set. Section 5 discusses issues raised by the analysis and provides
concluding comments.
2. Literature
Preference for interacting with those of one’s own ethnicity or race is reported in
numerous contexts. Currarini, Jackson and Pin (2009) build a model in which having more
friends of the same than of other ethnicities or races is the expected outcome due to biases
both in preferences and in the simple likelihoods of meeting. They find empirical support in
the friendship patterns of white versus black students in U.S high schools. By contacting
individuals whose profiles were browsed in an on-line dating site, Hitsch, Hortacsu and
Ariely (2010) find that both men and women display a preference for a partner of their own
ethnicity. Fisman, Iyengar, Kamenica and Simonson (2008) find that participants in a speed
dating activity show a preference for others of the same ethnicity when deciding who to give
their email addresses to. Stoll, Raphael and Holzer (2004) find that firms with African
American hiring agents are considerably more likely to hire black applicants than those
without such agents. Holzer and Ihlanfeldt (1988) find that firms hiring for jobs involving
direct contact with customers hire individuals whose race or ethnicity resembles that of the
relevant customer population. Glaeser et al. (2000) find that Harvard ‘principles of
economics’ students return more to their partner in a trust game if the latter is of the same
rather than of different nationality. Bouckaert and Dhaene (2004), however, find that average
levels of trust and reciprocity in a trust game are independent of sender and receiver ethnic
origin in a study of Turkish and Belgian small businessmen in a Belgian city. Fong and
Luttmer (2009) find that African American subjects—and white subjects who reported
themselves to feel close to their own racial group—were likely to send more to Hurricane
Katrina victims in experimental manipulations that increase the perception that victims are of
their own race (black, white respectively). Adida, Laitin and Valfort (2015) find that subjects
6
in a laboratory experiment in France who have information about the religion of fellow
participants vote for group leaders—empowered to distribute experiment payoffs—of the
same religion, although religion ends up not being a significant factor in the leaders’ choices
once selected. Meer (2011) finds that alumni are more likely to donate to their former
universities and that they donate more when they are solicited by same-race individuals.
An important detail to take into account when judging experimental studies of bias in
altruism and trust is that it is necessary to consider not only the anonymity of decisions to the
researcher, but also whether there is direct contact between recipient and donor or lender,
which may give rise to social pressure. In a field experiment, Landry, Lange, List, Price and
Rupp (2007) find that door-to-door solicitation is far more effective at yielding a high
participation rate than mailing, but conditional on responding, households contacted by mail
donate far more. This suggests that it is more difficult to say ‘no’ to a solicitor on one's
doorstep than it is to ignore a letter. DellaVigna, List and Malmendier (2012) test for the
presence of altruism and social pressure by conducting a field experiment in which
prospective donors have the opportunity to avoid contact with solicitors. They find that “both
altruism and social pressure are important determinants of giving… with stronger evidence
for the role of social pressure.” In a different setting, Habyarimana et al. (2007) stage a
variety of public good provision games among co-ethnics and non-co-ethnics from a slum
neighborhood in Kampala, Uganda. There, higher levels of contributions among co-ethnics
are attributed to differences in strategy selection rather than to greater commonalities of taste,
altruism, or productivity. The differences in strategy selection are linked to differences in
enforcement of cooperative norms that in turn arise from the relative network proximity of
co-ethnic participants. An important aspect of our experimental design is that our lender
subjects are never in the presence of the prospective borrowers and are assured of a high
degree of anonymity relative to the experimenters, hence any bias exhibited with respect to
one’s own ethnic group or gender is unlikely to be a result of social pressure.
Some cases of ethnic or racial bias diverge from homophily since they entail two or
more groups who seemingly share a belief that one group is more deserving of their trust or
assistance. List and Price (2009) report a field experiment in which white and non-white
soliciters separately engage in door-to-door fundraising, finding that both solicited whites and
solicited non-whites donate more when the solicitor is white, a result they attribute to whites
being stereotyped as more trustworthy. Fershtman and Gneezy (2001) asked Israeli Jews with
Ashkenazi (European)-sounding names and with Sephardic or Eastern-sounding names to
play laboratory trust games with members of their own or the other group. They found that
7
members of both groups sent more as first-movers (“trustors”) to Ashkenazi second-movers
than to Sephardi second-movers (“trustees”), suggesting that both groups believed that
Ashkenazi subjects are more trustworthy (and will send more back). Actual second-mover
decisions failed to align with that belief.
With respect to dealings by the genders with members of the same and the opposite
gender, the literature appears to show fewer cases of homophily. Ben-Ner, Kong and
Putterman (2004) report dictator games with male and female student subjects in which
senders are sometimes but not always told the gender of the recipient. They find that amounts
sent by men are unaffected by having information on recipient’s gender, but female senders
send significantly less when the recipient is known to be female than when the recipient is of
unknown gender or known to be male. Buchan, Croson and Solnick (2008) find that the
amount returned by recipients in a trust game is not affected by the gender of their paired
trustors. Sutter, Bosman, Kocher and van Winden (2009) report that in a bargaining game,
members of each sex bargain more aggressively with those known to be of the same sex.
They note that their result could reflect intra-sex competition of the kind emphasized by
evolutionary psychology, a possibility that may also apply to Ben-Ner et al.’s finding for
female subjects. Solidarity or homophily among those of the same gender could conceivably
be stronger than any tendency towards intra-sex competition in our experimental setting, in
part because lenders and borrowers live in geographically distant and socioeconomically
separate social worlds.
While there is now a vast literature on microfinance, the overwhelming majority of it
concerns the effects of borrowing on borrowers’ earnings, consumption, health, and other
outcomes, and the sustainability of funding entities from the standpoint of operating costs,
interest and repayment rates, and presence or absence of government, non-profit, and
philanthropic support. Yet there are studies, e.g., Liu, Chen, Chen, Mei and Salib (2012),
Heller and Badding (2012), Choo, Lee, Lee, Zha and Park (2014), Chen, Chen, Liu and Mei
(2015), and Jenq, Pan and Theseira (2015), that investigate lender decisions, in each case
ones made at kiva.org. Most relevant to our study are Heller and Badding (2012), who
determine that loans made to the borrowers of kiva microfinance partners with higher default
rates tend to be funded slightly more slowly, “indicating that the perceived riskiness of a
project may indeed exert a small influence on a lender’s decision to fund a given loan
request.” They also find that female borrowers are funded approximately 30% faster than
male borrowers, borrowers from Africa are funded faster than borrowers from Asia and the
Americas, and farmers are funded faster than retailers. Also related to our study is Jenq et al.
8
(2015), who find that lenders prefer borrowers who are more attractive, lighter-skinned, and
less obese, even though such borrowers do not have better loan performance than the others.
Although we also study lender preference among specific borrowers whose information is
ultimately drawn from kiva.org, our study differs in that our subjects encounter the borrowers
at an experimental interface constructed by us, never see kiva.org search screens, and are not
informed that kiva.org is the intermediary that we work through. We recruit to our lab
subjects with no known prior interest in microfinance because we are interested in learning
how members of a more general population react to the opportunities in question, whereas all
of the above-listed papers study existing patrons of kiva.org who left data at the site in the
course of their spontaneous web visits. We collect detailed survey and task-based information
on our lenders that is unavailable to those studies, and we vary treatment conditions that have
no counterpart in their analysis.
A paper on peer-to-peer lending that shares some themes with our paper is Ravina
(2012), who explores how borrowers’ attributes affect lenders’ decisions using a subset of
borrowers whose photos are available at Prosper.com. The latter, unlike kiva.org, is a site at
which Americans can loan or borrow amounts in the range of $2,000 to $35,000 on a person-
to-person basis at mutually agreed upon rates of interest. Similar to our paper, the author
employs raters to judge borrowers’ physical characteristics including attractiveness and
weight, and they study evidence of racial bias in lending decisions. Like Heller and Badding
(2012) and Jenq et al. (2015) and unlike our study, Ravina examines field data of actual loan
requests and lending, rather than conducting a controlled experiment, and the data on lenders’
characteristics and views is accordingly more limited. Whereas we use lenders’ self-reported
subjective evaluations of the riskiness of lending to each borrower, as well as how needy they
judge each borrower to be, Ravina uses data on actual repayment rates to measure actual
default rates of individuals grouped by race. Finding that black borrowers are less likely to
receive loans and more likely to offer higher interest rates, Ravina investigates whether this is
due to taste-based discrimination, statistical discrimination, or false beliefs about lower
repayment rates. She finds that statistical discrimination can explain these outcomes—i.e.,
black borrowers as a group demonstrate lower repayment rates at Prosper.com, hence
material self-interest and the convenience of distinguishing borrowers by race can lead to
fewer and higher-interest loans to blacks, absent any taste-based dislike or false belief.
Ravina finds that black lenders make more loans to black borrowers than white lenders do,
but argues that this could be due to a comparative advantage in judging the trustworthiness of
individual black loan-seekers, rather than simple homophily—similar to the finding of
9
Fisman, Paravisini and Vig (2017).5 Ravina also finds a significant positive effect of physical
attractiveness on ease of obtaining loans.
The question of crowding out of philanthropic motivation for individual microfinance
lending by rich country lenders to poor country borrowers appears to have been little studied,
and not at all, to our knowledge, via analysis of individual lender decisions. Liu et al. (2012)
and Choo et al. (2014) provide evidence that existing lenders in peer-to-peer microfinance
websites are motivated mostly by charitable motivation, but their studies are not designed to
examine whether financial incentives would detract from or add to philanthropic ones.
Numerous corporations have engaged in high profile campaigns to raise money for charities
in conjunction with the sale of their products (Elfenbein and McManus, 2010), an example
being the Product Red campaign in which well-known American companies including Nike,
Apple, Coca-Cola, Starbucks, and Gap marketed products from which some proceeds went to
support the Global Campaign to fight AIDS, tuberculosis, and malaria, among other efforts.
However, customer interest in the pairing of savings products such as certificates of deposit
with lending to the global poor has not been tested, to our knowledge.6 Major efforts to
encourage individuals to make funds available for microfinance lending have instead adopted
either a fully philanthropic model—exemplified by Accion International and FINCA
International—which solicit outright gifts by donors, or the largely philanthropic model of
kiva.org—with ‘regifting’ opportunities—which returns repaid principle to lenders’ accounts
without interest. Kiva’s founders believed that offering interest to lenders would reduce the
lending opportunity’s attractiveness by crowding out philanthropic motivation.
Crowding out has been much studied in other contexts. In a well-known early study,
sociologist Richard Titmuss (1971) reported that offering payment for blood donations both
reduced the supply and raised issues of quality of the blood donated. Another well-known
sociological study is Deci (1971). Lane (1991), a political psychologist, includes a survey on
the topic, as do Gneezy, Meier and Rey-Biel (2011) for economics readers. Frey and
Oberholzer-Gee (1997) and Gneezy and Rustichini (2000) provide other examples in the
5Fisman et al. examine field data on loan requests and lending in a large state-owned bank in India. They find that when borrowers matched officers with respect to religion, or when both are Hindus, in terms of caste, they were more likely to get credit, be approved for larger loans, and be required to put up less collateral. These borrowers had better repayment performance, even if the officer involved had left the bank. They interpret their result as indicating that officers are better at screening in-group borrowers, but they do not rule out the possibility that the loan officers also favor in-group borrowers. 6 Our statement should be understood to be pertaining to small or “retail” banking customers. There do exist vehicles of microfinance lending catering to wealthy individuals and large organizations. In these cases, there has been some activity involving, for example, the financial services company TIAA-CREF, the Skoll Foundation, and some European banks, such as Credit Suisse.
10
literature of economics. Many economists now concede the possibility that adding a
monetary incentive—where intrinsic or image-directed incentives were already eliciting
contributions, effort, or norm compliance—is sometimes counterproductive. Benabou and
Tirole (2006) provide a theoretical analysis of social image, intrinsic and extrinsic
incentives, incorporating the idea that “people would like to appear as prosocial (public-
spirited) and disinterested (not greedy),” and Ariely, Bracha and Meier (2009) find support
in an experiment, showing that monetary incentives tend to crowd out pro-social charitable
donations when the latter are publicly observable but encourage the donations when made
privately. However, the degree to which crowding out is to be expected may depend not
only on the publicness of the setting, but also on the exact nature of the pro-social impulse
and the action setting. Thus, kiva.org’s directors could be right that kiva lenders would lend
less if the organization offered interest, yet this need not rule out the possibility that there
could be a quite different market segment—for example, customers encountering alternative
products at their local bank—for whom a return on investment in a microfinance fund would
have no deterrent effect. Although we focus on one-to-one lending choices in our
experiment, our interest in willingness to lend to micro-entrepreneurs extends also to the
potential appeal of such products, as discussed further in the concluding section.
3. Experimental design and analytical framework
3.1. Experimental design and procedures
Undergraduate students from across all disciplines at Brown University were invited
to participate in experiment sessions conducted in a computer classroom.7 At the heart of the
design lies an opportunity to keep or to make partly or wholly available for multiplication and
lending (see below) a sum of $10, divisible in 1/3 dollar increments. This is followed by a
procedure for evaluating each of twelve potential recipients of the money with respect to the
perceived riskiness of lending to them and their perceived neediness. Participants then submit
an ordered ranking of their three most preferred borrowers. These core stages were preceded
by elicitations of time preference and risk aversion and were followed by completion of a
questionnaire. We describe first the two core stages, then briefly describe the prior and post-
core elements.
7 Because each subject made decisions independently with no information about others’ choices, we permitted session size to vary with the numbers that responded to recruitment invitations. The average session had just over 12 subjects, with minimum and maximum session sizes of 6 and 23, and standard deviation 4.31.
11
In the first stage of the core experiment, subjects are asked to play a modified trust
game.8 In the game, subjects, who are guaranteed a $10 participant fee independent of their
choices, are given an additional $10 endowment that each can allocate as he/she wishes,
choosing between payout to self at completion of session without multiplication, or loaning
some or all of the $10 to an entrepreneur in another country, with the amount chosen being
tripled by the experimenter. Two treatment dimensions vary among sessions, with subjects
aware of the settings for their own sessions only. First, treatments differ with respect to
whether participants know, at the time of the first-stage lending decision, that the borrowers
will be micro-entrepreneurs “in poor developing countries such as Bolivia, Kenya and
Cambodia” (a “poverty framing,” PF), as opposed to having the borrowers be described, at
that stage, only as entrepreneurs in other countries (“neutral framing,” NF).9 Second,
treatments differ in maximum potential return to the lender, which has three settings: in
Project Return (PR) treatments, all money repaid by the borrower returns to the research
project for later lending; in Medium Return (MR) treatments, half of any repaid funds go to
the lender, and the rest to the project, and in High Return (HR) treatments, all repaid funds
go to the lender. Thus, the loan is effectively a gift to the borrower and perhaps then the
research fund and other borrowers in PR treatments (making the game resemble a Dictator
Game with matching). Meanwhile the loan can yield the lender a 50% return on investment
in 18 months in MR and a 200% return in HR treatments. At the time of their lending
decisions, subjects were told that the likelihood of repayment is at least 90%.10 To avoid
having choices of $0 be made with the sole aim of completing the experiment more quickly,
subjects were told (truthfully) that they would need to complete the procedures of the next
stage (which had not yet been described in detail) regardless of their decision. The
8 We chose the trust game because it is one of the most-studied laboratory experiments and because the one-to-one microfinance model shares some similar characteristics to it, in that the first-mover has an investment opportunity the return from which depends on the second-mover’s actions. In the canonical game, a first-mover (trustor) can send part of his/her endowment to a second-mover (trustee), knowing that the amount he/she sends will be doubly matched by the experimenters and that the second-mover can choose how much (if anything) to send back. Our tripling of returns, as in the original trust or investment game design (Berg, Dickhaut and McCabe, 1995), also makes lending attractive on altruistic grounds, in treatments in which returned funds go back to research use, and potentially on both altruistic and self-interested grounds, in those in which such funds are returned to the participant. Modified dictator game experiments in which there was matching of money given, in order potentially to bolster altruistic motivation, include De Oliveira, Croson and Eckel (2011), and Eckel, De Oliveira, and Grossman (2007). 9 Instructions in the PF treatments also gave subjects a short description of microfinance, mentioning that the concept’s “pioneer developer was awarded the Nobel Peace Prize in 2006” and quoting from the Nobel Committee’s citation (“even the poorest of the poor can work to bring about their own development”.) 10 We used the 90% figure rather than the 97% figure provided on the website of the intermediary, Kiva.org, in order to eliminate any chance of misleading subjects with an overly optimistic estimate.
12
intersection of the two framings and three return conditions gives us six treatments: NF-PR,
NF-MR, NF-HR, PF-PR, PF-MR and PF-HR.
In the second stage of the core experiment, subjects learn more about, provide their
impressions of, and rank the prospective borrowers. Specifically, having already decided the
total amount they will lend, subjects now study photos of 12 possible borrowers who—
although it is not explicitly mentioned to the lenders—differ with respect to gender,
ethnicity/region (defined here as from Latin America, sub-Saharan Africa, and Southeast
Asia),11 and occupation (farmer or retailer).12 Each of the 12 types made possible by the
crossing of these three dimensions always has one representative, with the specific
individuals included changing from session to session so as always to be current loan-
seekers. Subjects see 12 photos at once, and they click on each photo to read the narrative of
the borrower.13,14 Figure 1 shows an example of how we display the available borrowers in
one of the sessions. After reading each narrative, subjects are asked to rate (a) the neediness
and (b) the riskiness of each of the prospective borrowers, on scales ranging from 1 to 7, with
11 Latin American borrowers used are from Belize, Costa Rica, El Salvador, Guatemala, Nicaragua, Bolivia, Chile, Colombia, Ecuador, Paraguay, Peru or Mexico; African borrowers are from Burundi, Cameroon, Congo, Ghana, Kenya, Liberia, Mali, Mozambique, Senegal, Sierra Leone, Tanzania, Togo, or Uganda; and Southeast Asian borrowers are from Cambodia or Vietnam. We selected the three regions because there were adequate borrowers from each region listed on kiva.org, because each group’s members differ identifiably from those of the others with respect to characteristic physical features and names, and because each group also has a corresponding or “matching” U.S. minority group (as well as some foreign students at the university) with which it has at least superficial linkage—Latin Americans with U.S. Hispanics (and international students from Latin America), Africans with African Americans (and international students from sub-Saharan Africa), and Southeast Asians with U.S. Asians (and international students from East and Southeast Asia). We considered the use of East Asian or South Asian borrowers as alternatives but did not find sufficient numbers in kiva.org’s borrower pool. We selected Latin American borrowers who appeared to have Amerindian or mixed race (Mestizo) ancestry in order that there be a sense of ethnic/racial distinction from U.S. students of strictly European ancestry, as with the other two regions.We accordingly grouped the 2 participants self-identified as Native American together with Hispanic Americans and students from Latin America in the category corresponding to Latin American borrowers. In our analysis of lender-borrower ethnic pairing, we thus have a fourth ethnic/racial category for the U.S., namely white non-Hispanic, whose members we thought not likely to perceive themselves as sharing an ethnic/racial identity with any of the three borrower ethnic/racial categories. 12 To clearly distinguish the two occupations, we exclude from the retailer category ones who sell food or fruit. Borrowers in agriculture are mostly from rural areas and borrowers in retail are mostly from urban areas. 13 We also partially randomize the order in which borrowers are displayed, according to category, so as to minimize any influence of screen location on choice of borrower. Arrangements are not fully random in that we avoid ones that happen to cluster borrowers of a particular ethnicity or gender in the same part of the screen. With respect to ethnicity, each session used one of twelve configurations such that every group is represented both in each row and in each column, but with the positions of the three groups varying across configurations. In our analysis, we check for influence of screen position on subjects’ ranking of borrowers. 14 As examples of borrowers’ narratives, consider the following: Example 1. Rith is a farmer in Cambodia. She grows maize and rice as the main source of income. She is requesting a loan to buy insecticide for her crop and to pay plowing fees. Example 2. Paul is a business man in Kenya. He sells polythene bags and some other retail commodities. Paul is seeking a loan in order to buy inventory for his shop.
13
the instructions requesting that ratings be varied to the greatest extent possible.15 They then
choose which of the borrowers they prefer to lend the amount determined in stage 1,
indicating their top three borrowers (in order) out of the 12 choices, and being truthfully
informed that every effort would be made to implement their preference but that the
experimenters could not fully guarantee that the participant’s loan would go to their most
preferred borrowers.16
The two stages are independent of each other except insofar as the amount lent
influences second-stage choices (an influence we will find to be minimal),17 and the data
generated holds different analytical interest. From Stage 1 decisions, we will draw insights
about the potential roles of philanthropic and financial motivations in encouraging lending
within a broader population than those who have on their own sought out microfinance due,
say, to social concerns. The question of crowding out of philanthropic by financial motivation
is especially of interest. Stage 2’s focus on evaluation and choice among individual
borrowers, and the lender information generated by the questionnaire, allows us to perform
novel analysis of how gender and ethnicity influence the way a potential recipient is
perceived in terms of trustworthiness/riskiness and as a deserving recipient of philanthropy
(i.e., being needy), and of whether there are homophily effects even after controlling for such
influences.
In the pre-stage games, we elicit subjects’ time preferences and risk preferences by
two standard choice list tasks.18 Subjects are informed that with probability 0.1 one of the
pre-stage decisions will be randomly chosen for payoff realization, and that if this occurs,
they will learn the payment result at the end of the experiment, which prevents contamination
15 The instructions explain that by “neediness” we mean financial need or poverty, not the merit of the borrower’s project as such. “Riskiness” was described as referring to the relative likelihood that the borrower would not repay his or her loan. To minimize the order effect, subjects decided on each rating for all 12 borrowers before submitting them, and subjects were not allowed to change these answers during the next step, which is selection and ordering of borrowers to whom they wish to lend. 16 Excerpts from the Instructions include: “We try to honor your preferences as closely as possible when making today’s loans, although there are reasons why we may not be able to lend all of the money you’ve made available to your first choice. … Most of your loan is likely to go to at least one of the three top choices of borrower”. For further details, please consult the Instructions (in Appendix B.1) and in footnote 23, below. To give subjects whose Stage 1 lending choice is zero an incentive to make decisions in this second stage, we informed them (truthfully) in Stage 2 that there was a 1% chance that a $10 loan would be randomly assigned to them and go to the top borrowers they choose, with any repaid funds reverting to the lender as to any other subject in MR and HR treatments. 17 The Stage 2 evaluation and ordering of borrowers has no influence on the Stage 1 lending decision since subjects have not seen the borrower photos and are not informed of Stage 2’s procedural content when making the Stage 1 choice. That the amount they decide to lend in Stage 1 is, in the event, not influential on Stage 2 decisions is reported near the end of our discussion of Table 4, below. 18 The instruments used are chosen and revised from Sutter, Kocher, Glätzle-Rützler and Trautmann (2013). This method has been widely used in experiments; see also Holt and Laury (2002).
14
of ensuing choices by a wealth effect. The risk aversion task confronts subjects with 10 rows,
in each of which they must choose between an uncertain option and a certain one. The
uncertain option is a lottery consisting of a 90% chance of getting $30 and a 10% chance of
getting $0. The certain option is initially $16 and is increased by $2 in each subsequent row,
reaching a maximum of $34. The great majority of subjects prefer the uncertain option
initially and switch to a certain option at or before the latter’s maximum. Our measure of risk
aversion is directly decreasing in the level of certain payoff at which a subject switches from
the uncertain to certain option. In the time preference task, subjects are given 9 rows and are
asked to choose between two certain options with different timing. In each row, one option is
receiving $10 at the end of the experiment session. The other option is an amount to be
received in 18 months, which is $10 in the first row and rises by $5 in each subsequent row to
a maximum of $50. Our measure of present time preference is directly decreasing in the level
of the first delayed payoff the subject prefers to receiving $10 the same day.
After the core stages of the experiment, subjects are asked to provide demographic
information about themselves, yielding the lender characteristics information important to our
analysis. This is a key aspect of our design, because past studies of microfinance lending, in
addition to being limited to persons already actively seeking such a lending opportunity,
lacked information on lender characteristics and could thus only focus on characteristics of
the borrowers. We anticipated that Brown University’s diverse student body would lead to
having subjects from varying ethnic groups, without taking special recruiting steps. All
subjects, including but not limited to those who might have loan repayment funds due back to
them in 18 months, are also asked to click on a link to a separate website where they provide
their contact information for receiving a future payment (if due), with care taken to assure
subjects that the personal information provided could not be linked to their decisions.
Importantly, subjects were truthfully informed that all loan repayments and delayed payouts
due to time preference choices would be administered by a university office not linked to the
experiment team, as an added guarantee of anonymity between subject and experimenters.19
In order to obtain information on actual borrowers—to implement loans and to obtain
repayments—we used borrower information obtained from kiva.org and implemented the
loans there, although subjects were not told the name of the microfinance intermediary and
19 An instruction for all treatments can be found in Part B.1 of the Appendix. To reduce concern about logistical barriers to delayed payouts (including loan repayments), only students who still had at least 18 months until graduation were recruited as subjects.
15
were never in a kiva.org web interface during the session.20 After each session, we ran an
algorithm to calculate the exact loan amounts from lender i to borrower j, based on lenders’
loan amounts and their choices for their top three borrowers. Then, we carried out the loans
via kiva.org.21
3.2 Third-party borrower evaluations
A possible concern with our experimental design is that choice of borrower might be
influenced by factors other than the three dimensions by which we selected them for
inclusion. To deal with such uncontrolled factors, including the perceived physical
attractiveness of borrowers and whether they are smiling in their photos, we recruited from
the same student subject pool eight raters who were not participants in the experiment to
review all borrowers’ photographs and narratives and to quantify certain objective and
subjective qualities of each borrower. For the sake of balance, we chose as raters students of
varying ethnicities (Asian or Asian American, African or African American, Hispanic or
Hispanic American, and Caucasian/White) and gender (male/female). Each rater was paid a
flat fee of $12 per hour. 22 Raters were given instructions by an experimenter prior to their
first evaluations, with the coding instructions being borrowed and revised from Jenq et al.
20 Our goal is not to understand decisions at kiva.org, but rather inclinations with respect to lending to micro-entrepreneurs, more generally. The experimental interface our subjects encountered was one constructed by our team to maximize our control over the information and its presentation. Especially important in this respect is that each of our subjects only learned about twelve borrowers fitting the array of gender, ethnicity, and occupational categories described above. The most common way to search for borrowers on kiva.org, in contrast, would involve first selecting a region and country, which means that exposure to such a diverse set of borrowers would be unlikely to occur in a short period of time and without considerable effort on the lender’s part. We cropped the borrowers’ photos to make the sizes uniform (2 inches X 2.4 inches) and showed only a borrower’s shoulders and head, for consistency across borrowers (see Figure 1). For each borrower, we rewrote and formalized his/her narrative to include only occupation, country, and the purpose of the loan, deleting all other information about the borrower if shown at kiva.org such as family structure, total loan amount sought, borrowers’ last name, experience, and income. We choose borrowers who appeared to be between 20 and 50 years old. 21 We used an algorithm to allocate the loans because loan amounts at kiva.org need to be at least $25 or in multiples of $25, and each subject in our experiment could have decided on an integer loan amount as small as $1 or as large as $30. Put briefly, the algorithm searched for ways to bundle together loan amounts below $25, attempting to implement first choices in preferences to second and in turn to third, and favoring loans to the borrowers most favored by participants in a given session, when implementing some individuals’ preferences directly was impossible. All loaned money was given to borrowers. Although the Instructions are clear that preferences may not be possible to follow precisely, some details about the implementation problem were withheld so as not to diminish effort on the borrower selection task or to encourage preference for making specific loan amounts. 22 Each rater spent a total of 6 to 9 hours over several days (no more than 2 hours per day) to complete the evaluation of the 214 borrowers that were available in one or more experiment sessions. We conducted 25 experiment sessions in total and thus had 25*12=300 borrower displays. However, we used some borrowers in more than 1 session after checking that their loan eligibility had not expired, which left us only 214 different borrowers. Raters, like subjects, were never told ethnicity was of focal interest to us.
16
(2015) (see Appendix B.2). Each rater saw all 214 borrowers’ photos and was asked to use a
7-point scale for most of the subjective qualities, and to think of the number 4 as average for
each subjective quality. Raters could review all borrowers’ photos and reconsider ratings at
any point, if they wished to. In addition to attractiveness and apparent happiness (smiling),
raters reported their impressions of a borrower’s weight and gave assessments of each
borrower’s riskiness and neediness, like subjects. The rater evaluations provide valuable
controls for our analysis.
3.3 Analytical framework
Stage 1 decisions regarding amounts to lend are analyzed with a simple model in
which these amounts are expected to be an increasing function of the return to the lender and
of poverty framing and a decreasing function of lender risk aversion and degree of present
bias of time preference. We will focus especially on the possible interaction between return
and poverty framing. Specifically, we estimate versions of
Li = c1 + c2 PF + c3MR + c4HR + c5PFxMR + c6PFxHR + c7×(risk preference) + c8×(time
preference) + ξi (1)
and related variants, where Li is the amount lent by individual i, PF is an indicator for poverty
framing condition, MR and HR are indicators for medium and high return conditions,
PFxMR and PFxHR are interaction terms, the c’s are parameters to be estimated and ξi is an
error term.
We devote considerable attention to the Stage 2 assessments of borrower riskiness
and neediness and ranking of top three borrowers, given the richness of our data in relevant
dimensions. Although some predictions flow immediately from economic theory—for
example, lenders will more heavily disfavor borrowers they perceive as riskier the more
private return is at stake for them (hence most in HR, least in PR)—we go directly to a
reduced form framework for measuring possible associations, whether attributable to
economic considerations or to social/behavioral factors. In particular, we consider the linear
equations (2) – (6):
' 'ij T ij T ij i T j T j ijV N R Z X X ea h r= + + L + + (2)
' 'jij i j j ijN N Z X X ub t= + Q + + (3)
' 'jij i j j ijR R Z X X wd w= + Y + + (4)

17
'j j jN X nf= + (5)
'j j jR X rg= + (6)
where !"#is the value (or priority) lender i assigns to borrower j;
$"# is borrower j’s neediness level evaluated by lender i;
$% is borrower j’s neediness level evaluated by third-party evaluators;
&"# is borrower j’s riskiness level evaluated by lender i;
&% is borrower j’s riskiness level evaluated by third-party evaluators;
'" is a vector of lender characteristics;
() is a vector of borrower characteristics as assessed by the raters;
Ʌ+, ψ, Θ are matrices with non-zero elements for particular gender and ethnicity
combinations with the T subscript indicating that coefficients may differ by return condition;
ρ+, -, ., / and 0 are coefficient vectors;
α, η, β and δ are scalar coefficients;
and 1"#, 2"#, 3"#, 4#, 5# are error terms.
Beginning with the simplest equations, (5) and (6) hypothesize that the average
assessments of the neediness and riskiness of a given borrower, j, by the third-party raters is
determined by the vector of borrower characteristics Xj, which include attractiveness, weight,
apparent happiness, gender, ethnicity (region), and occupation. Note that individual raters’
own ethnicities and genders are omitted since these two equations predict average rather than
rater-specific evaluations. With few raters of each ethnicity, rater-specific factors can be
expected to be idiosyncratic, and they are picked up in the aggregate in the error terms nj and
rj.
Next, consider subjects’ assessments of borrowers’ neediness and riskiness,
represented by equations (3) and (4) respectively. Here, observations are specific to both
lender (i) and borrower (j). A borrower’s characteristics influence a lender’s assessments both
in ways common to all lenders, indicated by the -6(# and .6(# terms; in ways lenders share
with raters, indicated by the b $% and d&%terms, and in ways specific to the pairing of
18
particular lender and borrower characteristics, indicated by '"6Θ(# and '"6ψ(#.23 These latter
terms would pick up judgments specific to the group pair, for example if white lenders tend
to believe African borrowers are the neediest, we expect a higher coefficient in Θ for white i,
African j. Our analysis will mainly inquire into matching group effects—for example, do
Asian American and Asian lenders judge Asian borrowers to be needier than others do?24
Finally, equation (2) addresses our main interest: confronted with twelve potential
borrowers each having different gender, ethnicity, and occupational features, which does
lender i value most highly (choose to lend to)? We hypothesize that α+ > 0 , i.e., subjects will
on average prefer to help borrowers they view as needier (Nij, as determined in (3)), once
controlling for repayment prospect R and other modeled factors. Conversely, we predict η+,
i.e., subjects prefer lending to less risky borrowers, with h+being largest in absolute value
when T is an HR treatment, η+ < 0 followed by MR and last PR treatments. (Even in PR,
philanthropic subjects may avoid, ceteris paribus, the borrowers they view as most risky,
since repayment to the project makes possible future lending.) Factors Xj including j’s
attractiveness and weight may affect i’s valuation of j as borrower independently of i’s own
characteristics, as indicated by weights ρ – a set of terms we will represent in practice by
substituting the averages of the third party evaluations in our estimating equations. Finally,
lender and borrower characteristics interact in the expression '"6Ʌ+(#, with non-zero elements
in Ʌ+ for gender and ethnicity cross-effects, our empirical focus being to test the hypothesis
of homophily: that female and male lenders prefer borrowers of their own gender more than
lenders of the opposite gender do, that African American lenders prefer African borrowers
more than other lenders do, and so forth.
Note that equations (5) and (6) predict $% and &% terms in equations (3) and (4),
respectively, and that equations (3) and (4) predict the Nij and Rij terms of equation (2). In
practice, we leave (5) and (6) unestimated, because precisely how borrower characteristics
affect the judgments of the eight raters is not a major focus. More importantly, we estimate
equations (2), (3), and (4) independently of one another, on the maintained assumptions that
23Note that for observed characteristics of borrowers we use the characteristics as reported (on average) by the raters rather than as reported by the lender. The concern is that lenders who assess a borrower as riskier or needier might report borrower characteristics that justify such an assessment leading to biased coefficients in (3) and (4).24 See Footnote 13 regarding which student subjects, categorized by self-reported ethnicity and race, are treated as corresponding with or matching a given ethnic/racial category of borrowers. We also use subjects’ self-reported sex and the sex of the borrower as indicated by their photograph, name, and description in kiva.org to define a same vs. other gender variable.
19
Corr (1"#, 2"#) = 0 and Corr (1"#, 3"#) = 0. We discuss other issues of estimation in section
4.2.
4. Experimental Results
We conducted 25 sessions between May 2013 and September 2014. In all, 295
subjects participated. Each session took about 75 minutes. We drop the decision data of 28
subjects because they have inconsistent choice patterns in one or both of the pre-stage games,
so we use only 267 subject observations in the analysis that follows. Table 1 shows our six
treatments and the number of subjects recruited by treatment. We sought the same number for
each return condition, but put about twice as many subjects in Poverty Framing as in Neutral
Framing sessions because we deem the smaller number of observations in Neutral Framing to
be sufficient for judging framing’s impact, and we wanted to be sure many Stage 2 decisions
would be made with the larger stakes we anticipated having under Poverty Framing. 51.7%
of subjects listed their gender as male, 48.3% female. With respect to ethnicity, based on
standard U.S. census categories, 43% of the subjects self-identified as non-Hispanic white,
29% as (non-Hispanic) Asian, 11% as Hispanic [or Native American], and 9% as (non-
Hispanic) black.25 Not surprisingly, given the random assignment, the subjects in the six
treatments look similar along every dimension (see Appendix Table 1). Subjects’
demographic information (a minor exception being semester level) is not significantly
different between treatments.
4.1 Stage 1 lending decisions
218 out of the 267 subjects (81.65%) choose to lend a positive amount rather than
keep all the money available; 73 of 267 (27.3%) lend the maximum of $10, which makes $30
available to one or more borrowers. The average (tripled) loan amount of the 267 subjects is
$14.54, 48.5% of the maximum; in the four treatments more closely resembling the trust
game because money could be returned to the first-mover, the average is $16.79, 56.0% of
the amount possible. These numbers are close to the average amount sent in 84 trust game
experiments surveyed by Johnson and Mislin (2011), exactly 50%. Although one might
expect still higher first-mover sending because subjects in PF treatments were provided with
a philanthropic motive and ones in MR and PR treatments were sending to borrowers
25 Subjects were recruited by emailed invitations to undergraduates registered with the Brown University Social Science Experiment Laboratory. The proportions of different ethnic groups in the subject pool are not significantly different from the undergraduate population at Brown except that Asian students are over-represented.
20
explicitly obligated (by microfinance intermediaries) to repay their loans, countervailing
factors included the need—unlike in the laboratory trust games—to wait 18 months, and
perhaps doubts about the experimenter’s logistical abilities and commitment and the subject’s
own ability to remember and seek out their payments.26 The effects of philanthropic and
return motives must in any event be assessed with respect to the behaviors in individual
treatments, to which we turn presently.
Figure 2 shows the average loan amount and the percentage of subjects choosing to
make a positive loan by treatment. The percentage choosing to loan money ranges from
55.6% in NF-PR treatment to 91.5% in PF-HR treatment, reflecting the fact that both
poverty framing and higher return encouraged making loans. The same qualitative variation
is seen in the amount lent, which ranges from making available for loans $6.81 (by allocating
to it $2.27 of the available $10) in NF-PR to loaning $19.83 (by allocating $6.61 of $10) in
PF-HR. Within a framing, the amount lent and the percentage lending a positive amount
steadily rises with return (from PR to MR to HR), and for given return condition, indicators
are higher in poverty than in neutral framing—with the exception that the positive loan
percentage is nearly the same at 92.0% and 91.5% in NF-HR and PF-HR, respectively.
Table 2 reports Tobit regressions in which the amount loaned is a function of the
treatment variables, and in some specifications controls for subject time preference and risk
aversion. In column (1), we consider the impact of framing only, confirming that subjects in
the poverty framing treatments, that is those already made aware that the borrowers would be
the sort of small-scale entrepreneurs in poor countries who receive loans from microfinance
organizations, tend to choose larger loan amounts in Stage 1, although significant at the 10%
level only. In column (2), we drop the framing control and instead enter dummy variables for
each of the two subject return (SR) conditions. Consistent with expectations, the regression
indicates that subjects loan significantly more in each subject return condition than when the
entire return goes to the project. Both coefficients are significant at the 1% level, with the
coefficient for HR being larger than that for MR, as anticipated, and the difference between
26To be clear, our procedure did not require subjects to take any action, i.e. they were in fact automatically contacted by our administrative counterparts after 18 months if a payment was due them. Still, as she made her decision, a participant could perhaps doubt that the payment would come, could anticipate a need to inquire if the payment failed to come, and could anticipate not remembering to do so, all rendering actual payment uncertain. To check whether subjects nevertheless felt unsure they would receive their payments, we asked in an exit question whether they had such doubts and if so to estimate their severity. Two-thirds of subjects asked in the MR and HR treatments responded that they considered the likelihood of a future payment failure to be less than 10%. We find a positive but statistically insignificant correlation between amount lent and self-reported subjective probability of non-payment.”
21
the coefficients being statistically significant at the 5% level. In column (3), the controls for
both the framing and the return conditions are included. Here, poverty framing shows
significance at the 5% level with almost no change in point estimate, and the return
conditions are also little changed, with magnitudes and significance levels suggesting that
return is a somewhat more important factor than framing (also suggested by comparing the χ2
values of regressions (2) and (3) to that of (1)).
While regression (3) suggests that both philanthropic and financial inducements
positively affect subjects’ loan decisions, we conduct a more complete investigation of
whether financial return crowds out philanthropic motivation by adding interaction terms in
specification (4). The result suggests that having a personal financial return, if anything,
weakens the impact of the philanthropic motive. While the coefficient on neither interaction
term is significant, the point estimates are negative and their inclusion considerably raises the
still-significant positive point estimates of the other three coefficients, implying that poverty
framing and financial returns would have larger impacts but for their negative interactions.
When controls for measured individual risk aversion and time preference are added in
column (5), the PFxMR interaction becomes marginally significant, although the PF
coefficient itself declines in value and significance level. The respective magnitudes of these
two coefficients (-11.3 and +7.4) imply that adding the medium return makes the net effect of
poverty framing negative, while the PFxHR interaction coefficient is still negative but
insignificant, and its magnitude remains consistent with poverty framing having a net positive
marginal effect when return on investment is high. The risk aversion measure does not obtain
a significant coefficient, whereas the coefficient on the time preference measure is significant
at the 1% level and has the expected negative sign. Finally, column (6) shows an alternative
specification in which the return available to the subject is simply coded as 0 for PR, 1 for
MR, and 2 for HR. This variable, return, obtains a highly significant positive coefficient. In
this specification, neither the stand-alone poverty framing variable nor its interaction with
return is statistically significant, but the magnitudes of the two coefficients are not supportive
of crowding out.27 With the exception of regression (5)’s marginally significant results for the
MR treatments, the indication overall is that while positive financial return reduces the
philanthropic impact of the poverty framing—or equivalently, poverty framing reduces the
financial appeal of prospective returns—these negative impacts are not so strong as to
27 We also estimated variants of the six specifications of Table 2 in which we added controls for subject gender and ethnicity. Results are qualitatively similar, differing mainly in significance levels of the coefficient on poverty framing (it is never more than marginally significant, with these controls added).
22
prevent both philanthropic and financial motives from being associated with larger loans. Put
more simply, there is no net crowding out.
Our findings raise the possibility that although organizations like kiva.org might
displease enthusiasts by capturing a small part of the interest borrowers pay and sharing it
with lenders, it may still be the case that less charitably identified entities like banks could tap
into the less intensive philanthropic “warm glow” of a wider spectrum of financial services
customers, including some of the values-conscious “millennials” mentioned in our
introduction, with a microfinance-invested product that promises some interest. Banks in
several countries are already engaged in microfinance lending as part of their for-profit
business model, but we don’t know of instances in which a portfolio of mainly microfinance
loans is offered to retail savers as a savings instrument with potential warm glow appeal.28
Although analyses like that of Benabou and Tirole (2006) suggest that the bundling of
interest return with philanthropic appeal would deprive purchasers of a credible signal of pro-
sociality, there need be no conflict between intrinsic warm glow and monetary return. Our
findings below may have bearing on what qualities of borrowers would appeal to which
segments of the banking customer population even when lending is not one-to-one—for
instance, which photos and stories should be placed on brochures about the fund to be placed
alongside those about home mortgage loans and similar products at the bank branch counter
or in online advertising. Banks, or less traditional entities that go into the business, may as yet
be underexploiting potential demand side opportunities that could simultaneously benefit
savers, borrowers, and intermediaries.
While the possibility that philanthropic and financial return motives are not in conflict
when it comes to microfinance lending is indeed suggested by the results just discussed, there
are limits that should be borne in mind when judging the scope of their applicability . First,
rates of return in the MR and HR treatments are far above what may be realistically possible,
although our subjects probably discount expected returns due to absence of the secure
organizational infrastructure of a financial institution. Recall that we chose the tripling
convention partly to match the canonical trust game and partly for its beneficial inducement
28 An example of a microfinance portfolio available to values-conscious private investors and institutions is given by Credit Suisse, which (according to statements accessed at https://www.credit-suisse.com/corporate/en/responsibility/economy-society/focus-themes/microfinance.html in Sept. 2017) offers its clients investment opportunities in the area of microfinance” and “by end of March 2016” its “Global Microfinance Fund, which reported more than 1.12 billion USD in assets under management, had provided loans to over 784,500 microentrepreneurs in 77 countries through more than 250 microfinance institutions (MFI).” To our knowledge, this product is not being promoted to retail bank customers as an alternative to money market or similar savings vehicles.
23
of substantial loan amounts that cause the Stage 2 decisions to be well incentivized. Second,
although subjects were told that borrowers were required to pay substantial interest to the
intermediaries with whom we were working, they could nonetheless infer that the tripling of
their own funds (of which they would obtain the full repaid amount in HR and half in MR
treatments) came not from the borrowers but from the foundation supporting the experiment.
Hence, potential guilt over earning interest off of the hard labor of poor borrowers is largely
removed from consideration in the experiment.29 Accordingly, our findings are merely
suggestive with respect to the practical question of how financial return and philanthropic
motives would interact in influencing demand for future microfinance-linked financial
products.
4.2. Stage 2 assessments and choices among borrowers
Table 3 shows estimates of regression models corresponding to equations (2) and (3)
of section 3.3., in which each subject’s assessments of the neediness of borrower j and the
riskiness of lending to that borrower are assumed to be linear functions of borrower and
subject characteristics and of interactions between borrower and subject gender and ethnicity.
Given 267 subjects each judging 12 borrowers, we have 3,204 subject-borrower observations.
Because of the subjectivity of each lender’s evaluations, we normalize each subject’s scores
to yield a standardized scale across different subjects.30,31 For each dimension, we show two
specifications, one of which includes the average third party evaluations of the borrower and
one omitting them.
The first four independent variables are controls for borrower gender, ethnicity, and
occupation, with the omitted categories being male, Latin American, and retailer. The
estimates show female gender to have no significant correlation with assessed riskiness but a
highly significant positive association with assessed neediness. Asian borrowers tend to be
assessed as significantly more risky and needy than Latin American ones, with African
29Of course, this consideration could be large for a decision-maker who is comparing such a savings vehicle with donating to a charity, but of little weight for one who is instead comparing the parking of her funds in this savings vehicle versus another one that invests in the money market or municipal bonds. Oversight and assurance that the financing helps borrowers rather than trapping them in unsustainable indebtedness may be important to some customer segments, and must certainly be considered in any objective welfare assessment. 30 For example, let A"# be the rating for neediness that lender i gives to borrower j (j=1,…,N); a normalized score is generated by A
B
"# =[A"# − A"E/$]BEHI /J". Here, j represents any specific borrower, k is a generic index for
borrowers, N = 12 is the number of available borrowers being evaluated by any one subject, i, and J" is an standard error for lender i’s evaluations. 31 Prior to normalization, subjects’ average numbers for the neediness (riskiness) evaluation is 4.12(3.82), with an average minimum evaluation of 2.75(2.42) and an average maximum evaluation of 5.42(5.42). The average standard deviation for the neediness (riskiness) evaluation is 1.89(1.84), with the minimum of 0.79(0.65) and the maximum number of 2.38(2.35).
24
borrowers assessed as still more risky and needy. The difference between the coefficients for
Asian borrowers and African borrowers is significant at the 1% (5%) level in regressions
without (with) controls for the average third party evaluations of the borrower. Farmers are
assessed to be significantly more risky and needy than retailers by large margins.
The next two coefficients should tell us whether assessment of riskiness or neediness
is influenced by the borrower being of same gender and of same or similar ethnicity to the
lender versus of another gender or ethnicity. All estimated coefficients on same ethnicity, and
those on the same gender in the neediness regressions, are statistically insignificant. The
coefficient for same gender is negative and marginally significant in the specification with
third-party evaluations. It is significant at the 5% level with those evaluations, indicating a
modest tendency for subjects to view recipients of their own gender as moderately more
likely to default on their loans.
Consider, finally, the effects of the five borrower attributes measured by the average
scores given by our raters. Interestingly, borrowers whose faces are judged more attractive
and less happy by the average rater are judged needier by the lenders, ceteris paribus,
significant at the 5% level. These judgments and those regarding weight show no correlation
with lender judgments of borrower riskiness. Raters’ judgments of borrower riskiness and
neediness are highly correlated with those of the lenders, even when other controls are
included.32 Perhaps reassuringly, third-party-rated riskiness has a higher positive coefficient
than rated neediness, in the subject riskiness evaluation regression (column (2)), and rated
neediness has a higher positive coefficient than rated riskiness in the subject neediness
evaluation regression (column (4)).33
Table 4 contains our most important results, namely our findings about whether
subjects show preference for lending to those of their own gender and ethnicity, both in the
absence and in the presence of controls for the assessed neediness and riskiness of those
borrowers. Each regression represents an alternative way of operationalizing equation (1) of
32 For each borrower, we conduct Mann-Whitney tests of the hypothesis that rater and subject evaluations of riskiness (neediness) are drawn from different distributions. For 89.7% (76.6%) of borrowers, we cannot reject that the evaluations of riskiness (neediness) are drawn from the same distribution. This suggests that playing the role of lender has little if any effect on chosen assessments of the riskiness and neediness of individual borrowers. 33 Notice that in Table 3 and equations (2) and (3), subjects’ own assessment of neediness is not included in the riskiness regressions, and conversely for riskiness in the neediness regressions. We chose this approach because while the two attributes, as perceived by subjects, may well be correlated with one another, such correlation is likely to reflect the fact that both are influenced by the same borrower attributes, albeit in different ways. The simple correlation between perceived riskiness and perceived neediness for the 3,204 lender-borrower observations is 0.4669 (p-value < 0.01).
25
section 3.3. We use two alternative dependent variables: Top 1, which is simply an indicator
of whether the borrower was ranked first among the twelve available, and Preference, which
takes values 3 (for first ranked), 2 (second ranked), 1 (third ranked), or 0 (one of the
remaining nine borrowers, for whom no ranking was elicited). We estimate logit regressions
for the specifications using Top 1, and we estimate rank-ordered logit regressions for the
specifications using Preference. For each dependent variable, we report estimates of four
specifications, which differ (like those of Table 3) with regard to whether we include controls
for the average rater evaluations, and also with regard to whether we control for the lender’s
evaluations of the borrower’s riskiness and neediness.
Consider first the controls for borrower gender, ethnicity, and occupation. We find
significant preference for lending to female and agricultural borrowers in all specifications.
Among the first potential explanations for these preferences that come to mind is beliefs that
females and small scale farmers are particularly needy and that females may be more
responsible than males about repaying. However, we note that these coefficients remain
significant even when controls for neediness and riskiness evaluation are included. Unlike
gender and occupation, ethnicity or region of borrower fails to have a significant effect (other
than one marginally significant coefficient in the specification with fewest controls) on
subjects’ choice of top borrower. With fewest controls, we see a higher ranking of Asian than
of Latin American borrowers within the top 3 preferences, but this effect is significant at the
5% level only before rater controls and lender neediness and riskiness assessments are added.
Preference for African over Latin American and Asian borrowers (in the top 3 context) is
more robust, but also becomes insignificant in the specification that includes all controls.
Our main results concern the coefficients for the borrower and lender being of the
same gender or same (similar, matched) ethnicity. The coefficient for same gender is positive
and significant at the 1% level in all specifications, while that for same ethnicity is positive
and significant for Top 1 choice in the absence of controls for riskiness and neediness
assessments, and at the 5% level in all other estimates. The magnitudes of the coefficients are
similar to those displayed on other significant terms. For example, being of the same gender
or same ethnicity increases the likelihood of being the top choice by a similar degree as does
being a farmer, although less than being female does, when all controls are included
(coefficients 0.48, 0.34, 0.44, and 0.60 respectively, in column (4)). Note that these
coefficients for same gender and same ethnicity represent effects additional to those of other
variables, including those for gender and ethnicity as such. Thus, with similar numbers of
female and male lenders in our sample, the large positive coefficient on borrowers being
26
female reflects that even male lenders show a preference for female borrowers, with the large
positive coefficient on same gender then indicating that female lenders favor female
borrowers considerably more than male lenders do. Among our 267 lenders, 52% of the 138
male lenders choose a female top borrower, whereas 74% of the 129 female lenders do so.
The results shown in Table 4 allow us to estimate the probability of lender i preferring
a specific borrower j, holding other things equal. Consider a case in which a lender chooses
between a female borrower and a male borrower. These two borrowers are identical in all
subjective/objective qualities (all control variables listed in column (8) of Table 4) and differ
only in gender. Suppose the lender is female. Then, the probability that the female lender
prefers a female borrower rather than a male borrower is 66%. Suppose the lender is male.
Then, the probability that the male lender prefers a female borrower rather than a male
borrower is 53% (estimated by the coefficient in column (8) of Table 4).34 Thus, a female
lender prefers to lend to a female borrower 25% more than does a male lender, and a male
lender prefers to lend to a male borrower 38% more than does a female lender.
Logit regressions allow us to estimate the odds ratio of being selected as first choice
among borrowers. Calculated from column (4) of table 4, we can see that the odds of being
selected as first choice are e0.482 = 1.62 times larger if a borrower is of the same gender as the
lender than if he/she is of different gender.
Consider a case in which a lender chooses between three borrowers who are identical
in all subjective and objective qualities (all control variables listed in column (8) of Table 4)
and only differ in ethnicity (Asian, African, or Hispanic). Supposing that the lender belongs
to one of the ethnic groups having a “matched” borrower category (Asian/Asian American,
African/African American, or Latin American/Hispanic), the probability that this lender
prefers a borrower of that ethnicity to one of a different ethnicity is 18% greater than a non-
Hispanic white or other unmatched lender’s preference for a borrower of that ethnicity, and
30% greater than the probability that the “matched” ethnicity subject chooses a borrower
belonging to one of the remaining two ethnicities (estimated by the coefficient in column (8)
of Table 4).35 When estimating from logit regression, we can see that for being the same
34 We denote the probability of lender i preferring a specific borrower j by K5LA
"
#, i =female or male and j = female or male. K5LA
"HMNOPQN
#HMNOPQN= exp^(0.375+0.272)/[exp^(0.375+0.272)+1] = 1.91/2.91=0.66; K5LA"HOPQN
#HMNOPQN = exp^(0.375)/[exp^(0.375)+ exp^(0.272)] = 1.45/2.76=0.53. 35 We denote the probability of lender i preferring a specific borrower j by K5LA
"
#, i = Asian, African, Hispanic, white, or other. j = Asian, African, or Hispanic. K5LA
"HPR"PS
#HPR"PS= K5LA"HPMT"UPS
#HPMT"UPS= K5LA"HV"RWPS"U
#HV"RWPS"U= exp^(0.248)/[exp^(0.248)+2] = 0.39. K5LA
"HPR"PS
#HPMT"UPS = K5LA"HPR"PS
#HV"RWPS"U = K5LA"HPMT"UPS
#HPR"PS = K5LA"HPMT"UPS
#HV"RWPS"U= K5LA
"HV"RWPS"U
#HPR"PS= K5LA
"HV"RWPS"U
#HPMT"UPS=1/[exp^(0.248)+2] = 0.30. K5LA"HYV"ZN
#HPR"PS = K5LA"HYV"ZN
#HPMT"UPS = K5LA"HYV"ZN
#HV"RWPS"U=
K5LA"H[ZVNTR
#HPR"PS = K5LA"H[ZVNTR
#HPMT"UPS = K5LA"H[ZVNTR
#HV"RWPS"U=1/3.
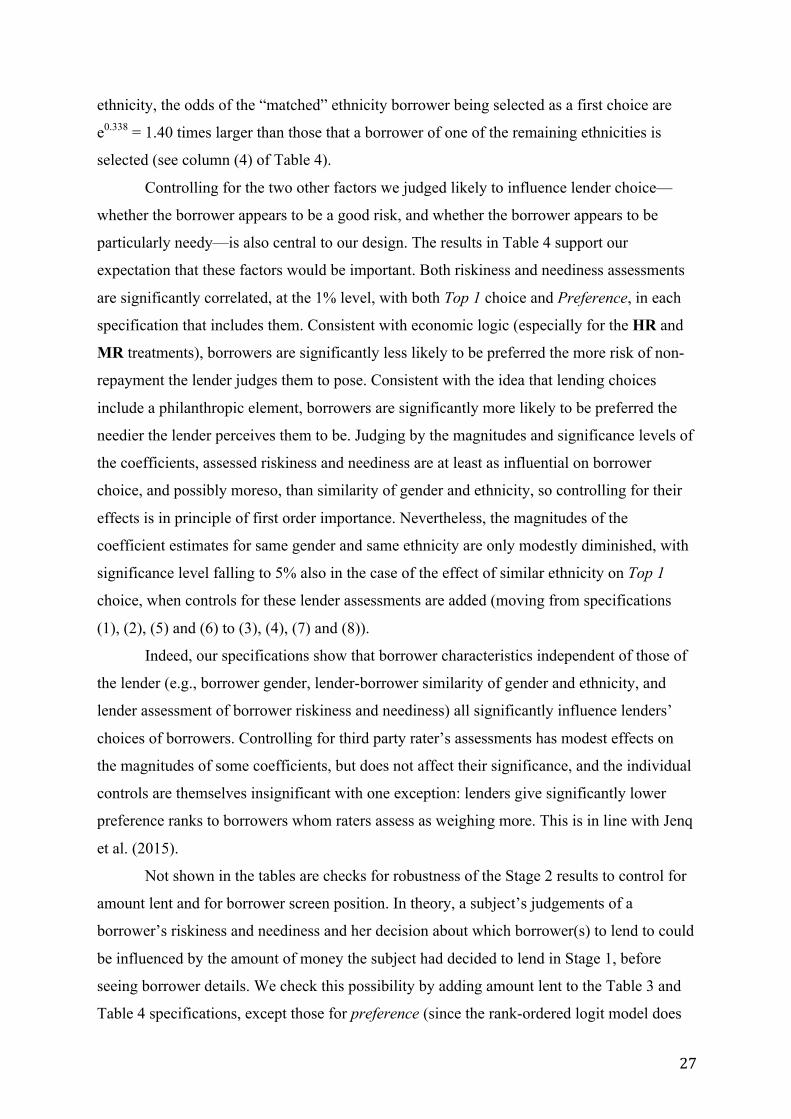
27
ethnicity, the odds of the “matched” ethnicity borrower being selected as a first choice are
e0.338 = 1.40 times larger than those that a borrower of one of the remaining ethnicities is
selected (see column (4) of Table 4).
Controlling for the two other factors we judged likely to influence lender choice—
whether the borrower appears to be a good risk, and whether the borrower appears to be
particularly needy—is also central to our design. The results in Table 4 support our
expectation that these factors would be important. Both riskiness and neediness assessments
are significantly correlated, at the 1% level, with both Top 1 choice and Preference, in each
specification that includes them. Consistent with economic logic (especially for the HR and
MR treatments), borrowers are significantly less likely to be preferred the more risk of non-
repayment the lender judges them to pose. Consistent with the idea that lending choices
include a philanthropic element, borrowers are significantly more likely to be preferred the
needier the lender perceives them to be. Judging by the magnitudes and significance levels of
the coefficients, assessed riskiness and neediness are at least as influential on borrower
choice, and possibly moreso, than similarity of gender and ethnicity, so controlling for their
effects is in principle of first order importance. Nevertheless, the magnitudes of the
coefficient estimates for same gender and same ethnicity are only modestly diminished, with
significance level falling to 5% also in the case of the effect of similar ethnicity on Top 1
choice, when controls for these lender assessments are added (moving from specifications
(1), (2), (5) and (6) to (3), (4), (7) and (8)).
Indeed, our specifications show that borrower characteristics independent of those of
the lender (e.g., borrower gender, lender-borrower similarity of gender and ethnicity, and
lender assessment of borrower riskiness and neediness) all significantly influence lenders’
choices of borrowers. Controlling for third party rater’s assessments has modest effects on
the magnitudes of some coefficients, but does not affect their significance, and the individual
controls are themselves insignificant with one exception: lenders give significantly lower
preference ranks to borrowers whom raters assess as weighing more. This is in line with Jenq
et al. (2015).
Not shown in the tables are checks for robustness of the Stage 2 results to control for
amount lent and for borrower screen position. In theory, a subject’s judgements of a
borrower’s riskiness and neediness and her decision about which borrower(s) to lend to could
be influenced by the amount of money the subject had decided to lend in Stage 1, before
seeing borrower details. We check this possibility by adding amount lent to the Table 3 and
Table 4 specifications, except those for preference (since the rank-ordered logit model does
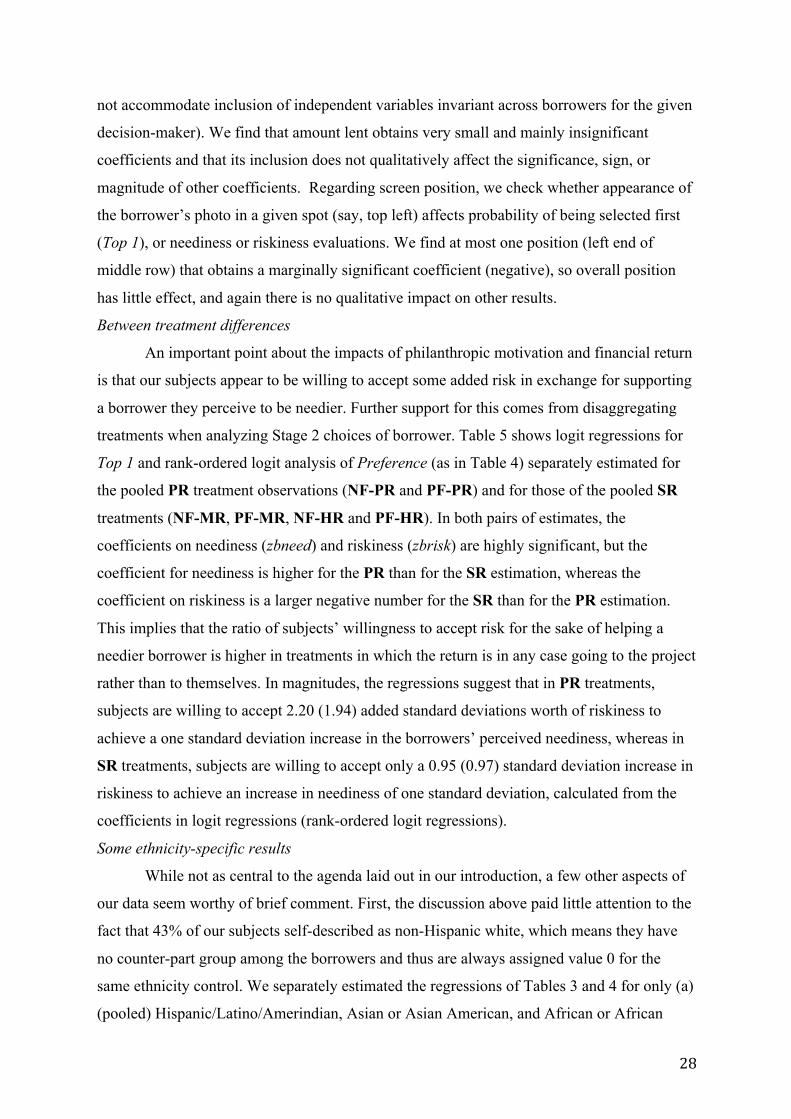
28
not accommodate inclusion of independent variables invariant across borrowers for the given
decision-maker). We find that amount lent obtains very small and mainly insignificant
coefficients and that its inclusion does not qualitatively affect the significance, sign, or
magnitude of other coefficients. Regarding screen position, we check whether appearance of
the borrower’s photo in a given spot (say, top left) affects probability of being selected first
(Top 1), or neediness or riskiness evaluations. We find at most one position (left end of
middle row) that obtains a marginally significant coefficient (negative), so overall position
has little effect, and again there is no qualitative impact on other results.
Between treatment differences
An important point about the impacts of philanthropic motivation and financial return
is that our subjects appear to be willing to accept some added risk in exchange for supporting
a borrower they perceive to be needier. Further support for this comes from disaggregating
treatments when analyzing Stage 2 choices of borrower. Table 5 shows logit regressions for
Top 1 and rank-ordered logit analysis of Preference (as in Table 4) separately estimated for
the pooled PR treatment observations (NF-PR and PF-PR) and for those of the pooled SR
treatments (NF-MR, PF-MR, NF-HR and PF-HR). In both pairs of estimates, the
coefficients on neediness (zbneed) and riskiness (zbrisk) are highly significant, but the
coefficient for neediness is higher for the PR than for the SR estimation, whereas the
coefficient on riskiness is a larger negative number for the SR than for the PR estimation.
This implies that the ratio of subjects’ willingness to accept risk for the sake of helping a
needier borrower is higher in treatments in which the return is in any case going to the project
rather than to themselves. In magnitudes, the regressions suggest that in PR treatments,
subjects are willing to accept 2.20 (1.94) added standard deviations worth of riskiness to
achieve a one standard deviation increase in the borrowers’ perceived neediness, whereas in
SR treatments, subjects are willing to accept only a 0.95 (0.97) standard deviation increase in
riskiness to achieve an increase in neediness of one standard deviation, calculated from the
coefficients in logit regressions (rank-ordered logit regressions).
Some ethnicity-specific results
While not as central to the agenda laid out in our introduction, a few other aspects of
our data seem worthy of brief comment. First, the discussion above paid little attention to the
fact that 43% of our subjects self-described as non-Hispanic white, which means they have
no counter-part group among the borrowers and thus are always assigned value 0 for the
same ethnicity control. We separately estimated the regressions of Tables 3 and 4 for only (a)
(pooled) Hispanic/Latino/Amerindian, Asian or Asian American, and African or African
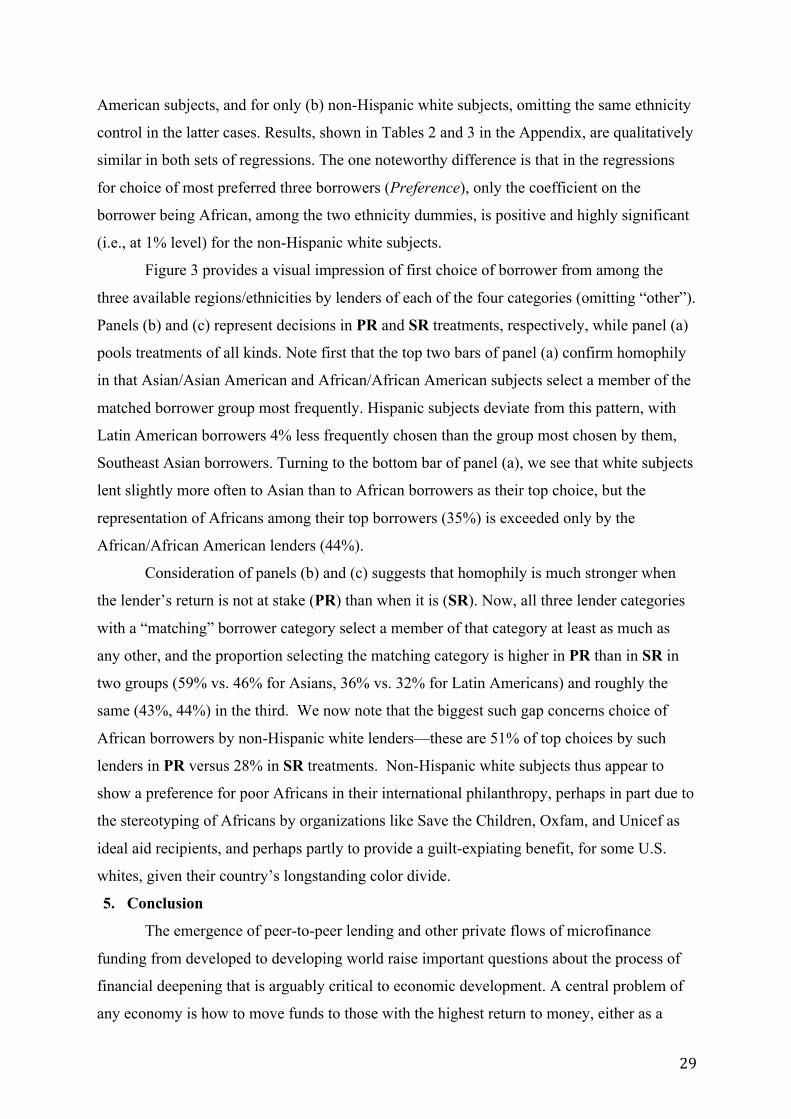
29
American subjects, and for only (b) non-Hispanic white subjects, omitting the same ethnicity
control in the latter cases. Results, shown in Tables 2 and 3 in the Appendix, are qualitatively
similar in both sets of regressions. The one noteworthy difference is that in the regressions
for choice of most preferred three borrowers (Preference), only the coefficient on the
borrower being African, among the two ethnicity dummies, is positive and highly significant
(i.e., at 1% level) for the non-Hispanic white subjects.
Figure 3 provides a visual impression of first choice of borrower from among the
three available regions/ethnicities by lenders of each of the four categories (omitting “other”).
Panels (b) and (c) represent decisions in PR and SR treatments, respectively, while panel (a)
pools treatments of all kinds. Note first that the top two bars of panel (a) confirm homophily
in that Asian/Asian American and African/African American subjects select a member of the
matched borrower group most frequently. Hispanic subjects deviate from this pattern, with
Latin American borrowers 4% less frequently chosen than the group most chosen by them,
Southeast Asian borrowers. Turning to the bottom bar of panel (a), we see that white subjects
lent slightly more often to Asian than to African borrowers as their top choice, but the
representation of Africans among their top borrowers (35%) is exceeded only by the
African/African American lenders (44%).
Consideration of panels (b) and (c) suggests that homophily is much stronger when
the lender’s return is not at stake (PR) than when it is (SR). Now, all three lender categories
with a “matching” borrower category select a member of that category at least as much as
any other, and the proportion selecting the matching category is higher in PR than in SR in
two groups (59% vs. 46% for Asians, 36% vs. 32% for Latin Americans) and roughly the
same (43%, 44%) in the third. We now note that the biggest such gap concerns choice of
African borrowers by non-Hispanic white lenders—these are 51% of top choices by such
lenders in PR versus 28% in SR treatments. Non-Hispanic white subjects thus appear to
show a preference for poor Africans in their international philanthropy, perhaps in part due to
the stereotyping of Africans by organizations like Save the Children, Oxfam, and Unicef as
ideal aid recipients, and perhaps partly to provide a guilt-expiating benefit, for some U.S.
whites, given their country’s longstanding color divide.
5. Conclusion
The emergence of peer-to-peer lending and other private flows of microfinance
funding from developed to developing world raise important questions about the process of
financial deepening that is arguably critical to economic development. A central problem of
any economy is how to move funds to those with the highest return to money, either as a
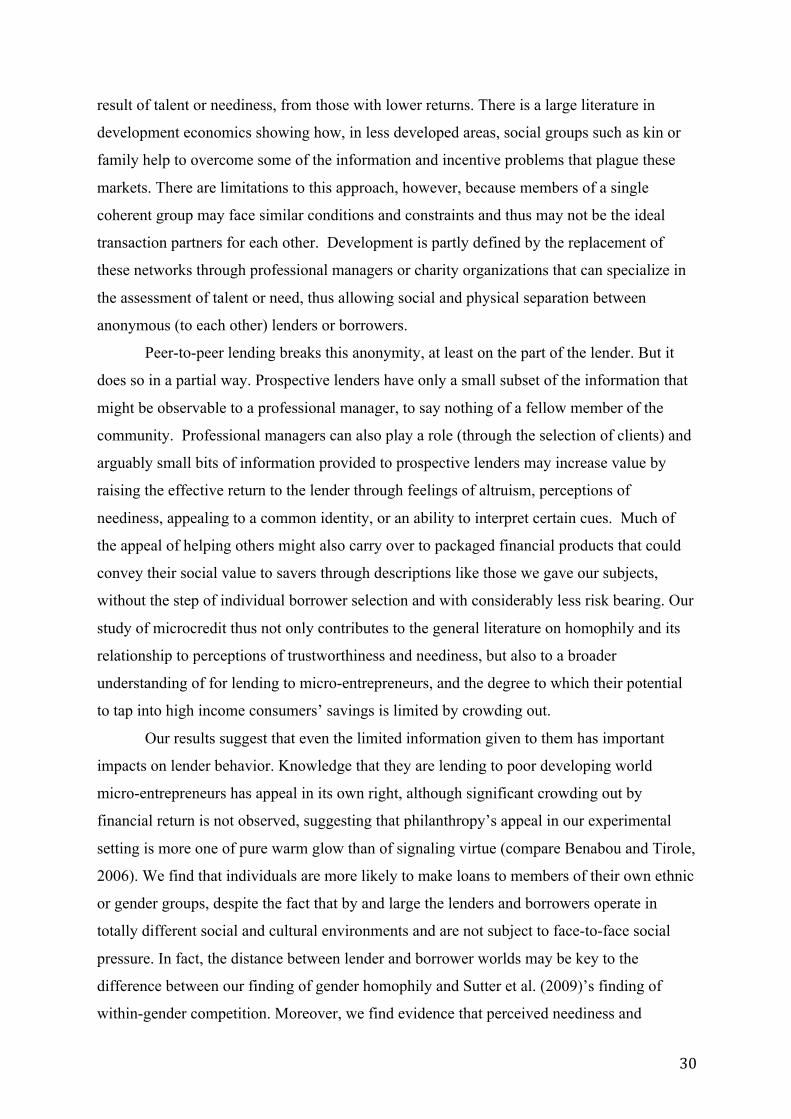
30
result of talent or neediness, from those with lower returns. There is a large literature in
development economics showing how, in less developed areas, social groups such as kin or
family help to overcome some of the information and incentive problems that plague these
markets. There are limitations to this approach, however, because members of a single
coherent group may face similar conditions and constraints and thus may not be the ideal
transaction partners for each other. Development is partly defined by the replacement of
these networks through professional managers or charity organizations that can specialize in
the assessment of talent or need, thus allowing social and physical separation between
anonymous (to each other) lenders or borrowers.
Peer-to-peer lending breaks this anonymity, at least on the part of the lender. But it
does so in a partial way. Prospective lenders have only a small subset of the information that
might be observable to a professional manager, to say nothing of a fellow member of the
community. Professional managers can also play a role (through the selection of clients) and
arguably small bits of information provided to prospective lenders may increase value by
raising the effective return to the lender through feelings of altruism, perceptions of
neediness, appealing to a common identity, or an ability to interpret certain cues. Much of
the appeal of helping others might also carry over to packaged financial products that could
convey their social value to savers through descriptions like those we gave our subjects,
without the step of individual borrower selection and with considerably less risk bearing. Our
study of microcredit thus not only contributes to the general literature on homophily and its
relationship to perceptions of trustworthiness and neediness, but also to a broader
understanding of for lending to micro-entrepreneurs, and the degree to which their potential
to tap into high income consumers’ savings is limited by crowding out.
Our results suggest that even the limited information given to them has important
impacts on lender behavior. Knowledge that they are lending to poor developing world
micro-entrepreneurs has appeal in its own right, although significant crowding out by
financial return is not observed, suggesting that philanthropy’s appeal in our experimental
setting is more one of pure warm glow than of signaling virtue (compare Benabou and Tirole,
2006). We find that individuals are more likely to make loans to members of their own ethnic
or gender groups, despite the fact that by and large the lenders and borrowers operate in
totally different social and cultural environments and are not subject to face-to-face social
pressure. In fact, the distance between lender and borrower worlds may be key to the
difference between our finding of gender homophily and Sutter et al. (2009)’s finding of
within-gender competition. Moreover, we find evidence that perceived neediness and
31
trustworthiness also play a role in lender decisions, although the way that neediness is
factored in depends importantly on the extent to which repayment is captured by the lender.
Finally, differences in perceptions do not seem to explain the effects of identity, as one might
have expected if the primary consequence of ethnic identification is that one differentially
interprets the cues that are provided by those with whom one shares a common identity.
Thus, the role identity plays, for our subjects, seems to be a deep-seated reaction about
helping those with whom one has something in common even if that something seems (at
least based on the measures we test) payoff irrelevant. Peer-to-peer lending appears to
harness those feelings in the form of targeted loans, though perhaps one might be equally
effective with loans or transfers that target particular identities without the selection of
individual recipients. Of course, the flip side of such feelings is that others who are not able
to access this “identity capital” may be excluded from this type of lending. From this
perspective, it still seems critical that more anonymous forms of financial deepening such as
more traditional microcredit and, eventually, credit monitoring systems such as credit
bureaus, accompany growth in the microfinance lending market.
Acknowledgement
We are grateful to Oliver Moller for his work on programming our experiment including its
borrower selection algorithm. Our appreciation also to Tom Alarie and Sue Silviera of the
Population Studies and Training Center at Brown University, which receives funding from
the NIH (P2C HD041020), for their helpful logistical support. We thank Pedro Dal Bó, Mark
Dean, Joseph Tao-yi Wang, and seminar participants at Brown’s Theory Workshop, at Kiel
Institute for the World Economy’s Behavioral Economics Seminar, at the 2014 Economic
Science Association International Meetings, and at the 2017 Asia-Pacific Economic Science
Association Meetings for helpful comments. This research was supported in part by the
Russell Sage Foundation, by the William R. Rhodes Center for International Economics and
Finance at Brown University and by the Ministry of Science and Technology in Taiwan
(MOST 105-2410-H-305-001-MY2).
32
References
Abascal, Maria, and Delia Baldassarri. 2015. “Love thy Neighbor? Ethnoracial Diversity and Trust, Reexamined.” American Journal of Sociology 121 (3): 722-782. Adida, Claire L., David D. Laitin, and Marie�Anne Valfort. 2015. “Religious Homophily in a Secular Country: Evidence from a Voting Game in France.” Economic Inquiry, 53 (2): 1187-1206. Andreoni, James, and Ragan Petrie. 2008. “Beauty, gender and stereotypes: Evidence from laboratory experiments.” Journal of Economic Psychology 29 (1): 73-93. Ariely, Dan, Anat Bracha and Stephan Meier, 2009, “Doing Good or Doing Well? Image Motivation and Monetary Incentives in Behaving Prosocially,” American Economic Review 99 (1): 544 – 555. Awaworyi Churchill, Sefa, Jeffrey Korankye Danso and Ellikem Nyatefe, 2015, “Mircrofinance Institution Performance: Does the Macro-Economy Matter?” Leibniz Information Centre for Economics pre-print accessed at http://hdl.handle.net/10419/123724. Ben-Ner, Avner, Fanmin Kong, and Louis Putterman. 2004. “Share and share alike? Gender-pairing, personality, and cognitive ability as determinants of giving.” Journal of Economic Psychology 25: 581-589. Benabou, Roland, and Jean Tirole, 2003, "Intrinsic and extrinsic motivation." The review of economic studies 70 (3): 489-520. Benabou, Roland, and Jean Tirole, 2006, “Incentives and prosocial behavior.” The American economic review 96(5): 1652-1678. Berg, Joyce, John Dickhaut, and Kevin McCabe. 1995. “Trust, Reciprocity and Social History.” Games and Economic Behavior 10: 122-42. Bouckaert, Jan, and Geert Dhaene. 2004. “Inter-ethnic Trust and Reciprocity: Results of an Experiment with Small Businessmen.” European Journal of Political Economy 20 (4): 896-886. Buchan, Nancy R., Rachel T.A. Croson, and Sara Solnick. 2008. “Trust and gender: An examination of behavior and beliefs in the Investment Game.” Journal of Economic Behavior & Organization 68 (3): 466-476. Chen, Roy, Yan Chen, Yang Liu, and Qiaozhu Mei. 2017. “Does team competition increase pro-social lending? Evidence from online microfinance.” Games and Economic Behavior 101: 311–333. Choo, Jaegul, Changhyun Lee, Daniel Lee, Hongyuan Zha, and Haesun Park. 2014. “Understanding and promoting micro-finance activities in Kiva. org.” In Proceedings of the 7th ACM international conference on Web search and data mining, New York, New York, USA, 2014, 583-592. New York, New York, USA: ACM.
33
Chuah, Swee-Hoon, Robert Hoffmann, Martin Jones, and Geoffrey Williams. 2007. “Do cultures clash? Evidence from cross-national ultimatum game experiments.” Journal of Economic Behavior & Organization 64 (1): 35-48. Constant, Amelie F., Simone Schüller and Klaus Zimmermann, 2013, “Ethnic Spatial Dispersion and Immigrant Identity,” IZA Discussion Paper No. 7868. Currarini, Sergio, Matthew O. Jackson, and Paolo Pin. 2009. “An Economic Model of Friendship: Homophily, Minorities, and Segregation.” Econometrica 77 (4): 1003-1045. Deci, Edward L. 1971. “Effects of externally mediated rewards on intrinsic motivation.” Journal of personality and Social Psychology 18 (1): 105-115. DellaVigna, Stefano, John A. List, and Ulrike Malmendier. 2012. “Testing for Altruism and Social Pressure in Charitable Giving.” The Quarterly Journal of Economics 127 (1): 1-56. De Oliveira, Angela, Rachel T.A. Croson, and Catherine Eckel. 2011. “The giving type: Identifying donors.” Journal of Public Economics 95 (5): 428-435. Eckel, Catherine C., and Philip J. Grossman. 1996. “Altruism in anonymous dictator games.” Games and Economic Behavior 16 (2): 181-191. Eckel, Catherine C., Angela De Oliveira, and Philip J. Grossman. 2007. “Is more information always better? An experimental study of charitable giving and Hurricane Katrina.” Southern Economic Journal 74 (2): 388-411. Elfenbein, Daniel W., and Brian McManus. 2010. “A greater price for a greater good? Evidence that consumers pay more for charity-linked products.” American Economic Journal: Economic Policy 2 (2): 28-60. Fershtman, Chaim, and Uri Gneezy. 2001. “Discrimination in a segmented society: An experimental approach.” Quarterly Journal of Economics 116 (1): 351-377. Fisman, Raymond, Sheena S. Iyengar, Emir Kamenica, and Itamar Simonson. 2008. “Racial Preferences in Dating.” Review of Economic Studies 75 (1): 117-132. Fisman, Raymond, Daniel Paravisini and Vikrant Vig, 2017, Cultural Proximity and Loan Outcomes,” American Economic review 107 (2): 457 – 492. Fong, Christina M., and Erzo F.P. Luttmer. 2009. “What determines giving to Hurricane Katrina victims? Experimental evidence on racial group loyalty.” American Economic Journal: Applied Economics 1 (2): 64-87. Frey, Bruno S., and Felix Oberholzer-Gee. 1997. “The cost of price incentives: An empirical analysis of motivation crowding-out.” American Economic Review 87 (4): 746-755. Friesen, Jane, Jasmina Arifovic, Stephen C. Wright, Andreas Ludwig, Lisa Giamo, and Gamze Baray. 2012. “Ethnic identity and discrimination among children.” Journal of Economic Psychology 33 (6): 1156-1169.
34
Glaeser, Edward L., David I. Laibson, Jose A. Scheinkman, and Christine L. Soutter. 2000. “Measuring trust.” Quarterly Journal of Economics 115 (3): 811-846. Gneezy, Uri, and Aldo Rustichini. 2000. “Pay enough or don't pay at all.” Quarterly Journal of Economics 115 (3): 791-810. Gneezy, Uri, Stephan Meier, and Pedro Rey-Biel. 2011. “When and why incentives (don't) work to modify behavior.” The Journal of Economic Perspectives 25 (4): 191-210. Habyarimana, James, Macartan Humphreys, Daniel Posner and Jeremey Weinstien. 2007. “Why Does Ethnic Diversity Undermine Public Goods Provision.” American Political Science Review 101 (4): 709-725. Heller, Lauren R., and Kayla D. Badding. 2012. “For compassion or money? The factors influencing the funding of micro loans.” The Journal of Socio-Economics, 41 (6): 831-835. Hitsch, Gunter J., Ali Hortaçsu, and Dan Ariely. 2010. “Matching and Sorting in Online Dating.” American Economic Review 100 (1): 130-163. Holt, Charles A., and Susan K. Laury. 2002. “Risk aversion and incentive effects.” American Economic Review 92 (5): 1644-1655. Holzer, Harry J., and Keith R. Ihlanfeldt. 1998. “Customer discrimination and employment outcomes for minority workers.” Quarterly Journal of Economics 113 (3): 835-867. Jenq, Christina, Jessica Pan, and Walter Theseira. 2015. “Beauty, weight, and skin color in charitable giving.” Journal of Economic Behavior & Organization 119: 234-253. Johnson, Noel D., and Alexandra A. Mislin. 2011. “Trust games: A meta-analysis.” Journal of Economic Psychology 32 (5): 865-889. Kalmijn, Matthijs. 1998. “Intermarriage and Homogamy: Causes, Patterns, Trends.” Annual Review of Sociology 24: 395-421. Konow, James. 2010. “Mixed feelings: Theories of and evidence on giving.” Journal of Public Economics 94 (3): 279-297. Landry, Craig E., Andreas Lange, John A. List, Michael K. Price, and Nicholas G. Rupp. 2010. “Is a donor in hand better than two in the bush? Evidence from a natural field experiment.” American Economic Review 100 (3): 958-983. Lane, Robert E. 1991. The market experience. Cambridge University Press. List, John A., and Michael K. Price. 2009. “The role of social connections in charitable fundraising: Evidence from a natural field experiment.” Journal of Economic Behavior & Organization 69 (2): 160-169. Liu, Yang, Roy Chen, Yan Chen, Qiaozhu Mei, and Suzy Salib. 2012. “”I loan because...”: Understanding motivations for pro-social lending.” In Proceedings of the fifth ACM
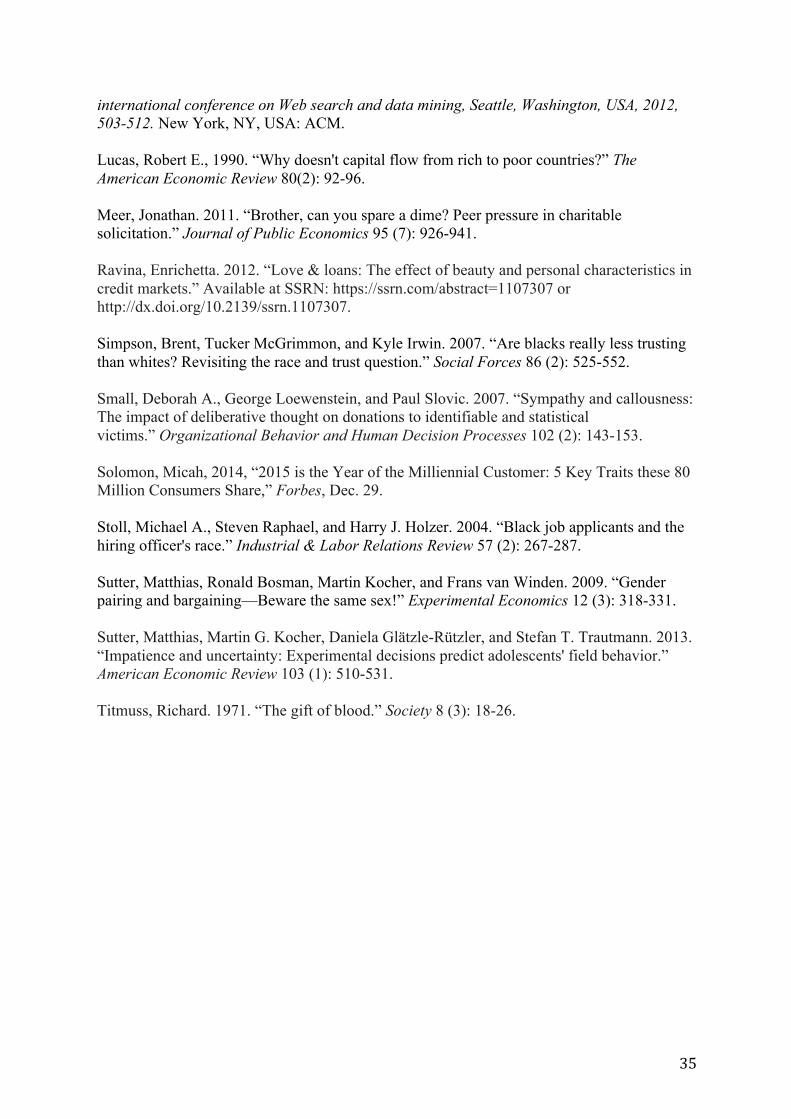
35
international conference on Web search and data mining, Seattle, Washington, USA, 2012, 503-512. New York, NY, USA: ACM. Lucas, Robert E., 1990. “Why doesn't capital flow from rich to poor countries?” The American Economic Review 80(2): 92-96. Meer, Jonathan. 2011. “Brother, can you spare a dime? Peer pressure in charitable solicitation.” Journal of Public Economics 95 (7): 926-941. Ravina, Enrichetta. 2012. “Love & loans: The effect of beauty and personal characteristics in credit markets.” Available at SSRN: https://ssrn.com/abstract=1107307 or http://dx.doi.org/10.2139/ssrn.1107307. Simpson, Brent, Tucker McGrimmon, and Kyle Irwin. 2007. “Are blacks really less trusting than whites? Revisiting the race and trust question.” Social Forces 86 (2): 525-552. Small, Deborah A., George Loewenstein, and Paul Slovic. 2007. “Sympathy and callousness: The impact of deliberative thought on donations to identifiable and statistical victims.” Organizational Behavior and Human Decision Processes 102 (2): 143-153. Solomon, Micah, 2014, “2015 is the Year of the Milliennial Customer: 5 Key Traits these 80 Million Consumers Share,” Forbes, Dec. 29. Stoll, Michael A., Steven Raphael, and Harry J. Holzer. 2004. “Black job applicants and the hiring officer's race.” Industrial & Labor Relations Review 57 (2): 267-287. Sutter, Matthias, Ronald Bosman, Martin Kocher, and Frans van Winden. 2009. “Gender pairing and bargaining—Beware the same sex!” Experimental Economics 12 (3): 318-331. Sutter, Matthias, Martin G. Kocher, Daniela Glätzle-Rützler, and Stefan T. Trautmann. 2013. “Impatience and uncertainty: Experimental decisions predict adolescents' field behavior.” American Economic Review 103 (1): 510-531. Titmuss, Richard. 1971. “The gift of blood.” Society 8 (3): 18-26.
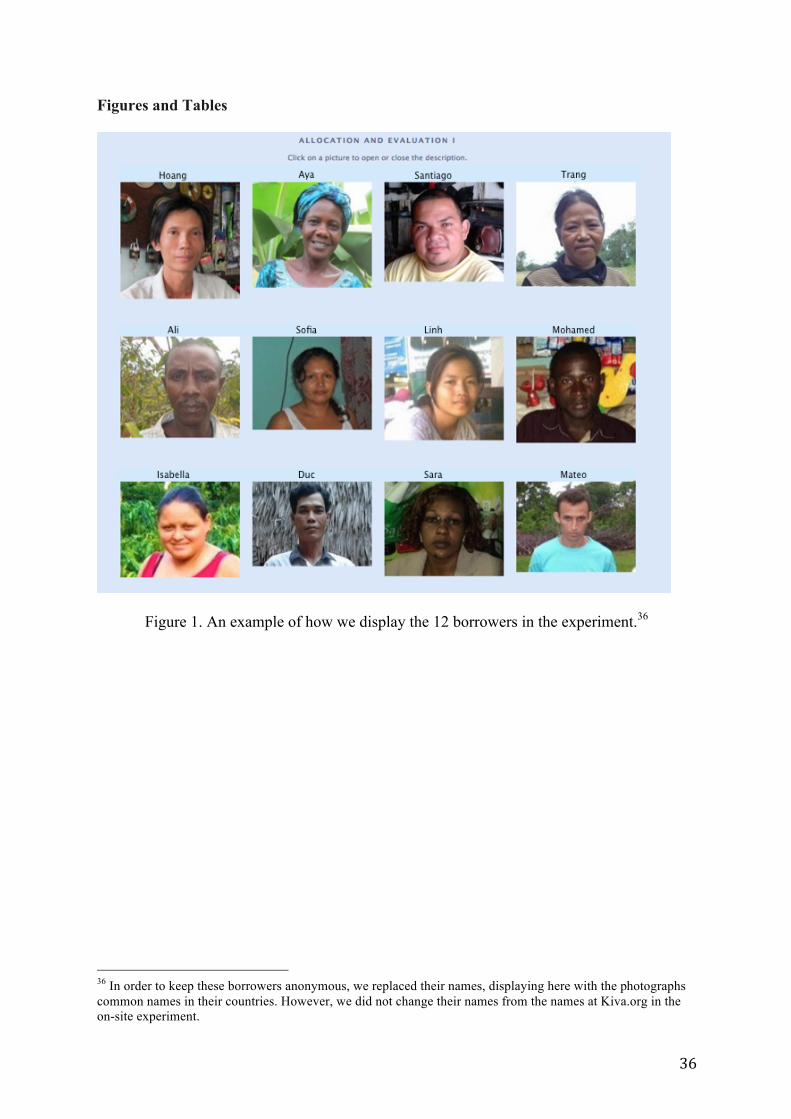
36
Figures and Tables
Figure 1. An example of how we display the 12 borrowers in the experiment.36
36 In order to keep these borrowers anonymous, we replaced their names, displaying here with the photographs common names in their countries. However, we did not change their names from the names at Kiva.org in the on-site experiment.
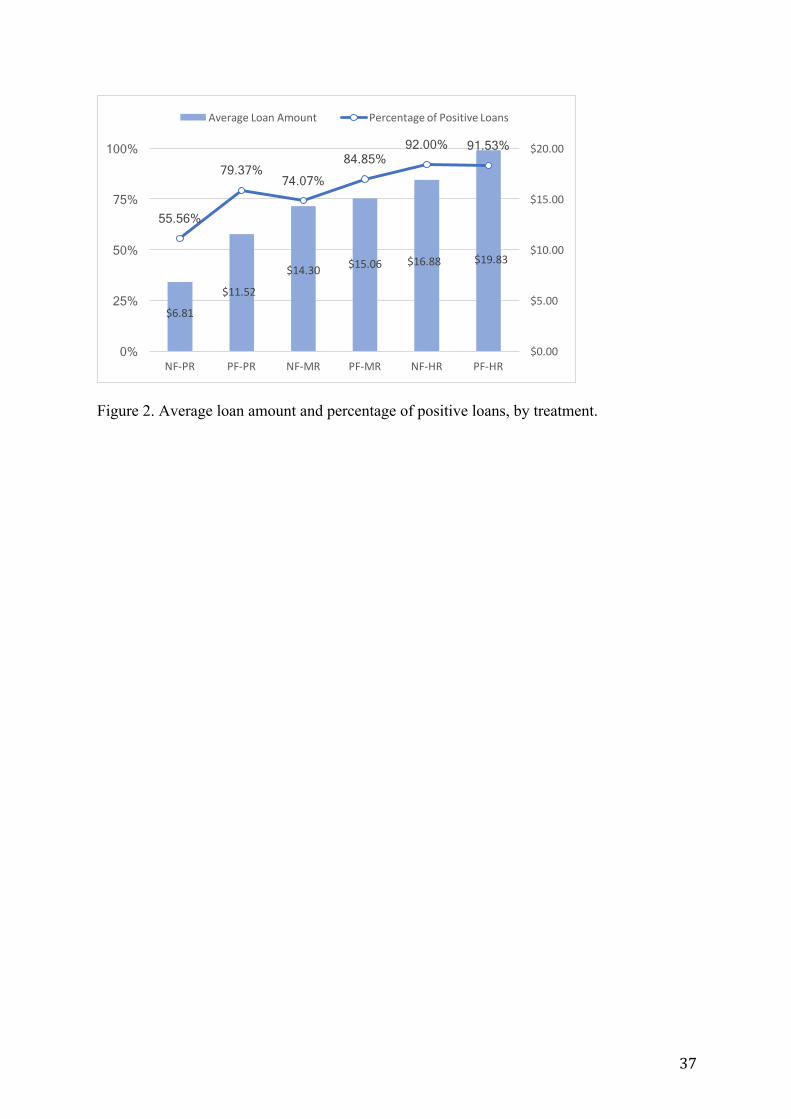
37
Figure 2. Average loan amount and percentage of positive loans, by treatment.
$6.81
$11.52
$14.30 $15.06 $16.88 $19.83
55.56%
79.37% 74.07% 84.85%
92.00% 91.53%
$0.00
$5.00
$10.00
$15.00
$20.00
0%
25%
50%
75%
100%
NF-PR PF-PR NF-MR PF-MR NF-HR PF-HR
AverageLoanAmount PercentageofPositiveLoans
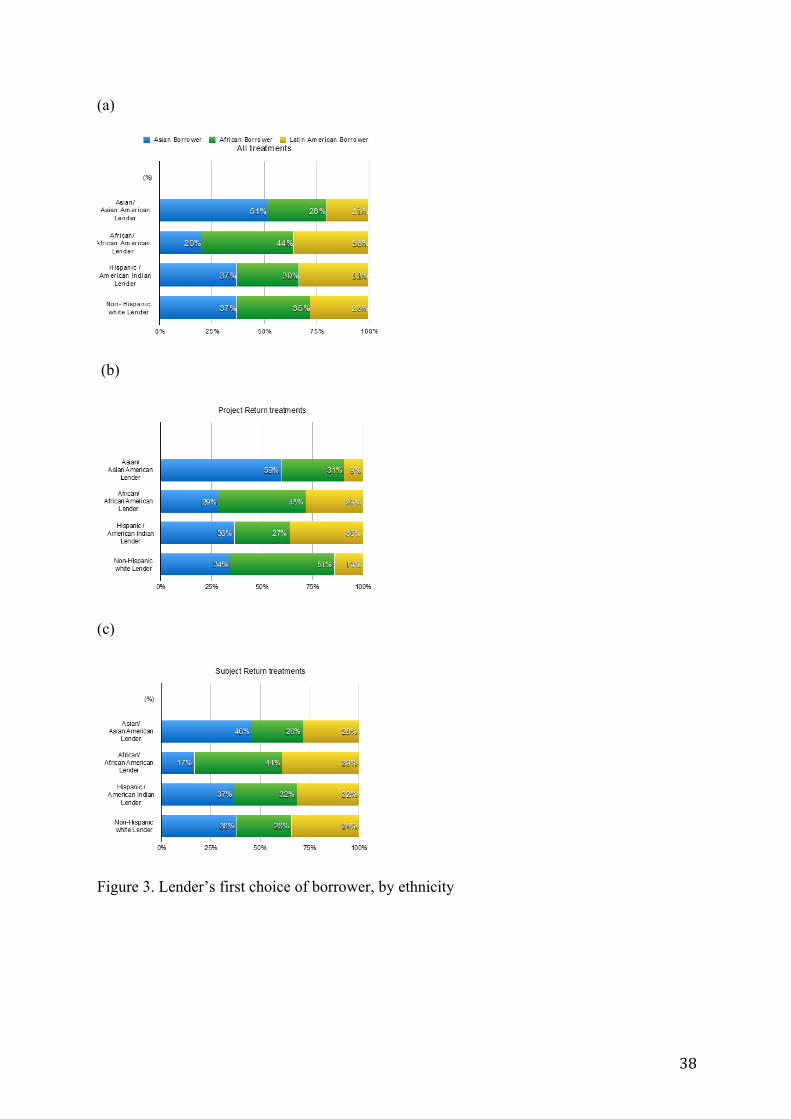
38
(a)
(b)
(c)
Figure 3. Lender’s first choice of borrower, by ethnicity
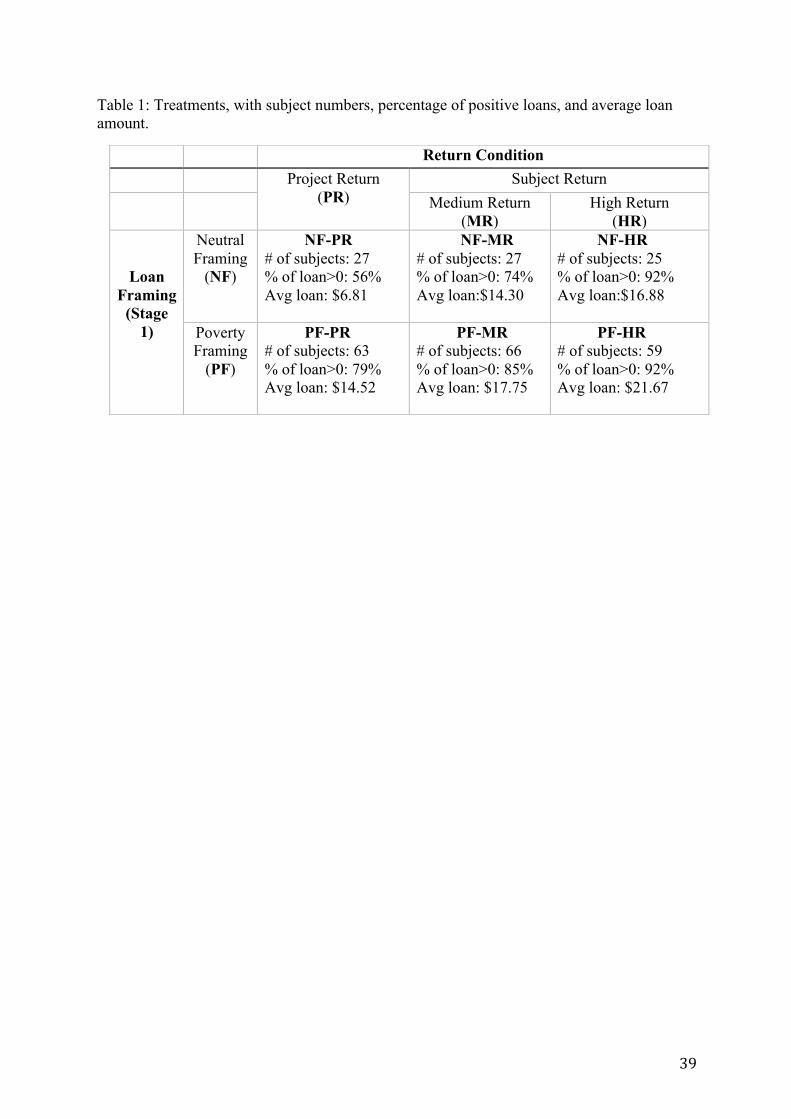
39
Table 1: Treatments, with subject numbers, percentage of positive loans, and average loan amount.
Return Condition Project Return
(PR) Subject Return
Medium Return (MR)
High Return (HR)
Loan Framing
(Stage 1)
Neutral Framing
(NF)
NF-PR # of subjects: 27 % of loan>0: 56% Avg loan: $6.81
NF-MR # of subjects: 27 % of loan>0: 74% Avg loan:$14.30
NF-HR # of subjects: 25 % of loan>0: 92% Avg loan:$16.88
Poverty Framing
(PF)
PF-PR # of subjects: 63 % of loan>0: 79% Avg loan: $14.52
PF-MR # of subjects: 66 % of loan>0: 85% Avg loan: $17.75
PF-HR # of subjects: 59 % of loan>0: 92% Avg loan: $21.67
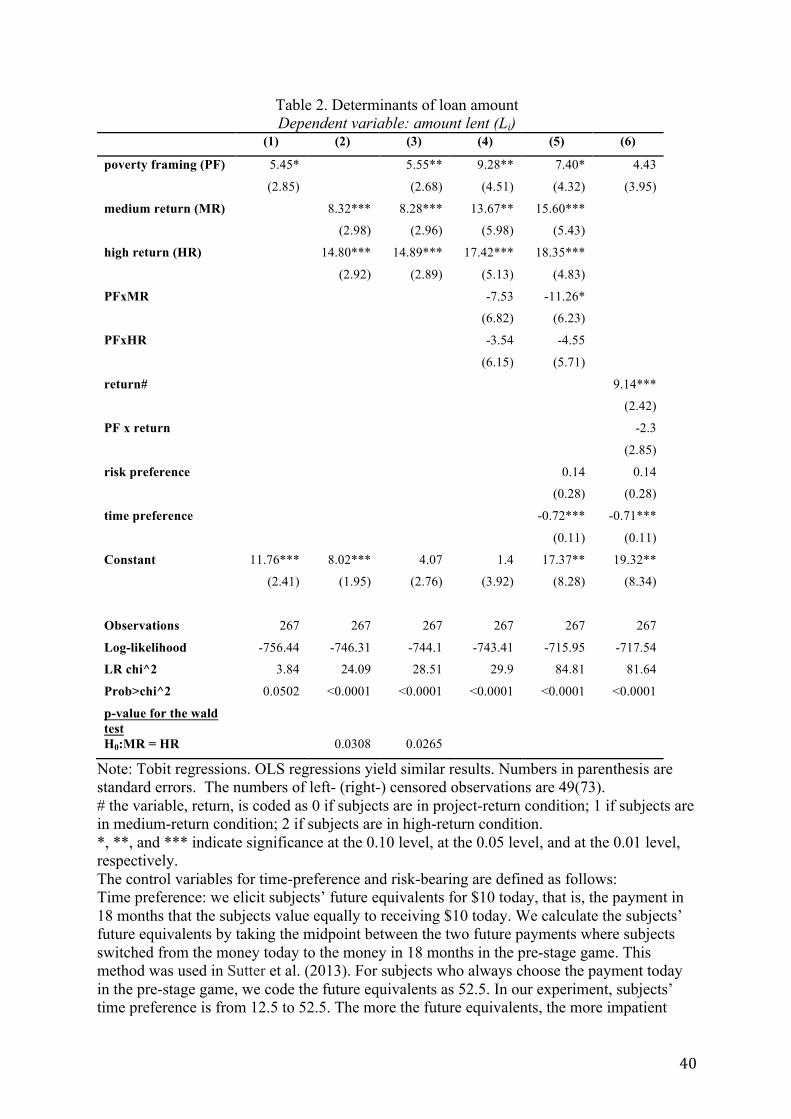
40
Table 2. Determinants of loan amount Dependent variable: amount lent (Li)
(1) (2) (3) (4) (5) (6)
poverty framing (PF) 5.45* 5.55** 9.28** 7.40* 4.43
(2.85) (2.68) (4.51) (4.32) (3.95)
medium return (MR) 8.32*** 8.28*** 13.67** 15.60***
(2.98) (2.96) (5.98) (5.43)
high return (HR) 14.80*** 14.89*** 17.42*** 18.35***
(2.92) (2.89) (5.13) (4.83)
PFxMR -7.53 -11.26*
(6.82) (6.23)
PFxHR -3.54 -4.55
(6.15) (5.71)
return# 9.14***
(2.42)
PF x return -2.3
(2.85)
risk preference 0.14 0.14
(0.28) (0.28)
time preference -0.72*** -0.71***
(0.11) (0.11)
Constant 11.76*** 8.02*** 4.07 1.4 17.37** 19.32**
(2.41) (1.95) (2.76) (3.92) (8.28) (8.34)
Observations 267 267 267 267 267 267
Log-likelihood -756.44 -746.31 -744.1 -743.41 -715.95 -717.54
LR chi^2 3.84 24.09 28.51 29.9 84.81 81.64
Prob>chi^2 0.0502 <0.0001 <0.0001 <0.0001 <0.0001 <0.0001
p-value for the wald test
H0:MR = HR 0.0308 0.0265
Note: Tobit regressions. OLS regressions yield similar results. Numbers in parenthesis are standard errors. The numbers of left- (right-) censored observations are 49(73). # the variable, return, is coded as 0 if subjects are in project-return condition; 1 if subjects are in medium-return condition; 2 if subjects are in high-return condition. *, **, and *** indicate significance at the 0.10 level, at the 0.05 level, and at the 0.01 level, respectively. The control variables for time-preference and risk-bearing are defined as follows: Time preference: we elicit subjects’ future equivalents for $10 today, that is, the payment in 18 months that the subjects value equally to receiving $10 today. We calculate the subjects’ future equivalents by taking the midpoint between the two future payments where subjects switched from the money today to the money in 18 months in the pre-stage game. This method was used in Sutter et al. (2013). For subjects who always choose the payment today in the pre-stage game, we code the future equivalents as 52.5. In our experiment, subjects’ time preference is from 12.5 to 52.5. The more the future equivalents, the more impatient

41
subjects are. Risk preference: we elicit subjects’ cash equivalents for a 90%*$30 lottery, that is, a certain payment that subject value equally as a lottery with 90% chance of receiving $30. We calculated the subject’s certainty equivalents by taking the midpoint between the two certain payments where subjects switched from the uncertain option to the certain option in the pre-stage game. This method was used in Sutter et al. (2013). For subjects who always choose a certain option in the pre-stage game, we coded the certainty equivalents as 8. In our experiment, subjects’ risk preference is from 8 to 29. The more the cash equivalents, the more risk loving subjects are.
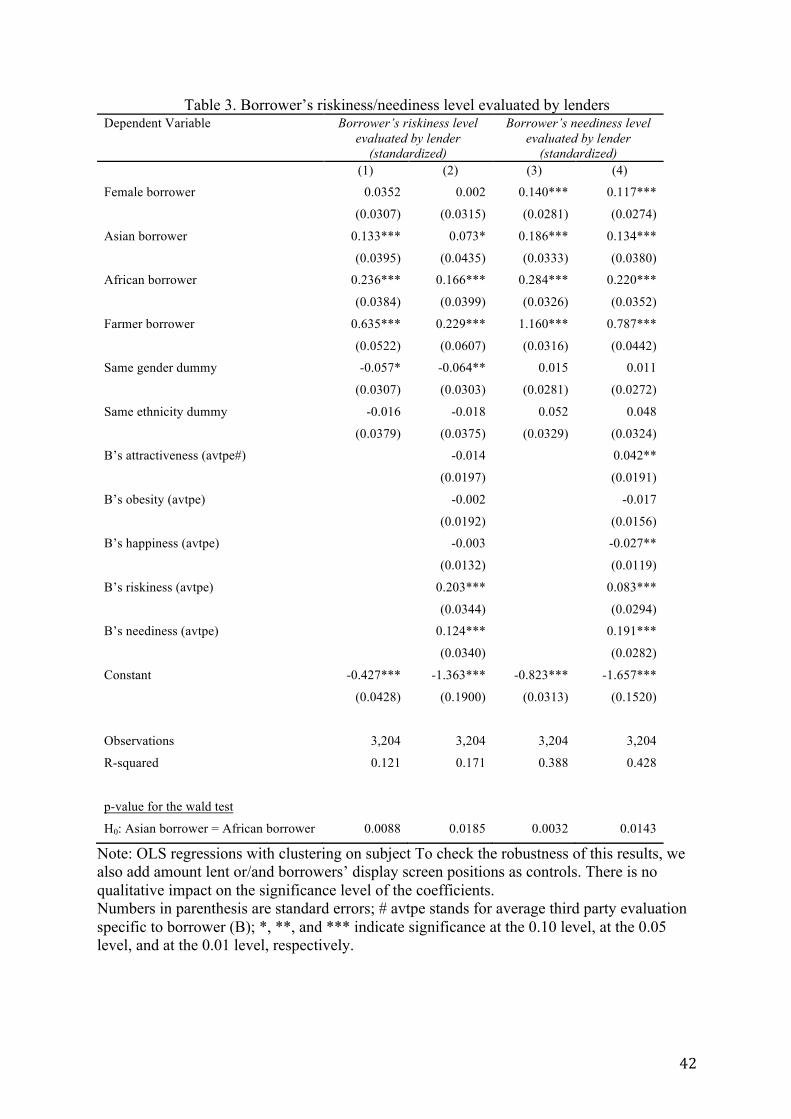
42
Table 3. Borrower’s riskiness/neediness level evaluated by lenders Dependent Variable Borrower’s riskiness level
evaluated by lender (standardized)
Borrower’s neediness level evaluated by lender
(standardized) (1) (2) (3) (4)
Female borrower 0.0352 0.002 0.140*** 0.117***
(0.0307) (0.0315) (0.0281) (0.0274)
Asian borrower 0.133*** 0.073* 0.186*** 0.134***
(0.0395) (0.0435) (0.0333) (0.0380)
African borrower 0.236*** 0.166*** 0.284*** 0.220***
(0.0384) (0.0399) (0.0326) (0.0352)
Farmer borrower 0.635*** 0.229*** 1.160*** 0.787***
(0.0522) (0.0607) (0.0316) (0.0442)
Same gender dummy -0.057* -0.064** 0.015 0.011
(0.0307) (0.0303) (0.0281) (0.0272)
Same ethnicity dummy -0.016 -0.018 0.052 0.048
(0.0379) (0.0375) (0.0329) (0.0324)
B’s attractiveness (avtpe#) -0.014 0.042**
(0.0197) (0.0191)
B’s obesity (avtpe) -0.002 -0.017
(0.0192) (0.0156)
B’s happiness (avtpe) -0.003 -0.027**
(0.0132) (0.0119)
B’s riskiness (avtpe) 0.203*** 0.083***
(0.0344) (0.0294)
B’s neediness (avtpe) 0.124*** 0.191***
(0.0340) (0.0282)
Constant -0.427*** -1.363*** -0.823*** -1.657***
(0.0428) (0.1900) (0.0313) (0.1520)
Observations 3,204 3,204 3,204 3,204
R-squared 0.121 0.171 0.388 0.428
p-value for the wald test
H0: Asian borrower = African borrower 0.0088 0.0185 0.0032 0.0143
Note: OLS regressions with clustering on subject To check the robustness of this results, we also add amount lent or/and borrowers’ display screen positions as controls. There is no qualitative impact on the significance level of the coefficients. Numbers in parenthesis are standard errors; # avtpe stands for average third party evaluation specific to borrower (B); *, **, and *** indicate significance at the 0.10 level, at the 0.05 level, and at the 0.01 level, respectively.
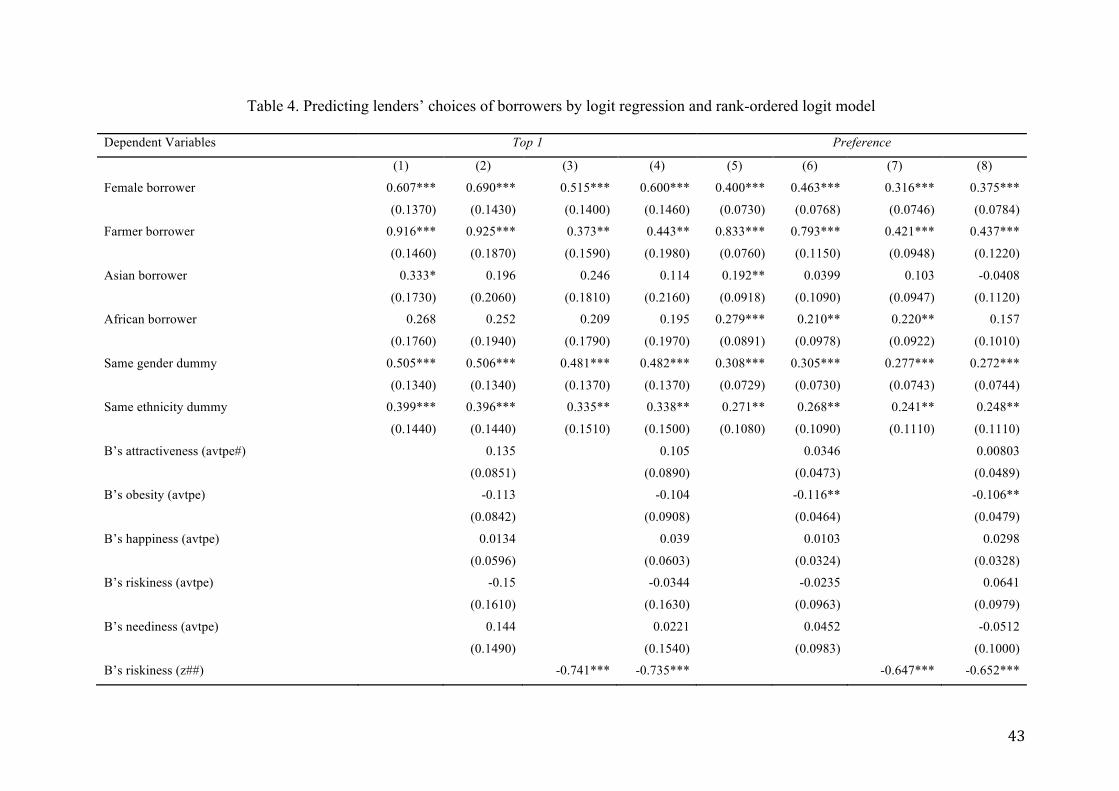
43
Table 4. Predicting lenders’ choices of borrowers by logit regression and rank-ordered logit model
Dependent Variables Top 1 Preference
(1) (2) (3) (4) (5) (6) (7) (8)
Female borrower 0.607*** 0.690*** 0.515*** 0.600*** 0.400*** 0.463*** 0.316*** 0.375***
(0.1370) (0.1430) (0.1400) (0.1460) (0.0730) (0.0768) (0.0746) (0.0784)
Farmer borrower 0.916*** 0.925*** 0.373** 0.443** 0.833*** 0.793*** 0.421*** 0.437***
(0.1460) (0.1870) (0.1590) (0.1980) (0.0760) (0.1150) (0.0948) (0.1220)
Asian borrower 0.333* 0.196 0.246 0.114 0.192** 0.0399 0.103 -0.0408
(0.1730) (0.2060) (0.1810) (0.2160) (0.0918) (0.1090) (0.0947) (0.1120)
African borrower 0.268 0.252 0.209 0.195 0.279*** 0.210** 0.220** 0.157
(0.1760) (0.1940) (0.1790) (0.1970) (0.0891) (0.0978) (0.0922) (0.1010)
Same gender dummy 0.505*** 0.506*** 0.481*** 0.482*** 0.308*** 0.305*** 0.277*** 0.272***
(0.1340) (0.1340) (0.1370) (0.1370) (0.0729) (0.0730) (0.0743) (0.0744)
Same ethnicity dummy 0.399*** 0.396*** 0.335** 0.338** 0.271** 0.268** 0.241** 0.248**
(0.1440) (0.1440) (0.1510) (0.1500) (0.1080) (0.1090) (0.1110) (0.1110)
B’s attractiveness (avtpe#) 0.135 0.105 0.0346 0.00803
(0.0851) (0.0890) (0.0473) (0.0489)
B’s obesity (avtpe) -0.113 -0.104 -0.116** -0.106**
(0.0842) (0.0908) (0.0464) (0.0479)
B’s happiness (avtpe) 0.0134 0.039 0.0103 0.0298
(0.0596) (0.0603) (0.0324) (0.0328)
B’s riskiness (avtpe) -0.15 -0.0344 -0.0235 0.0641
(0.1610) (0.1630) (0.0963) (0.0979)
B’s neediness (avtpe) 0.144 0.0221 0.0452 -0.0512
(0.1490) (0.1540) (0.0983) (0.1000)
B’s riskiness (z##) -0.741*** -0.735*** -0.647*** -0.652***
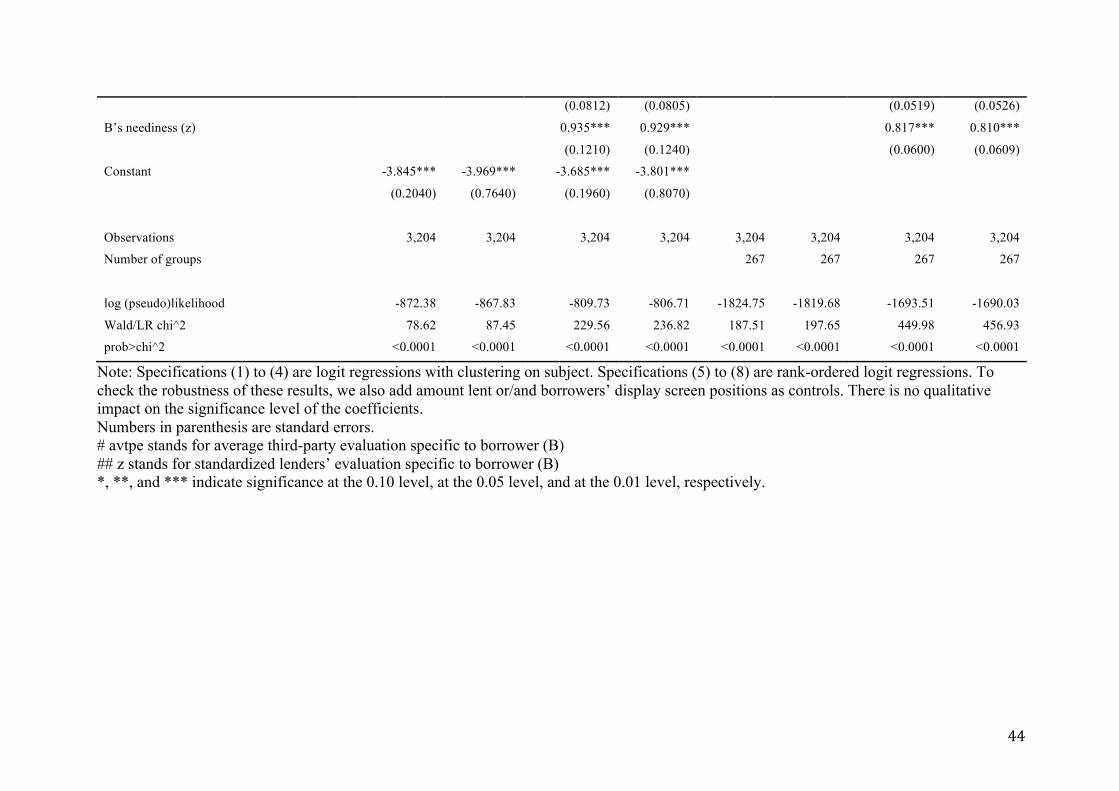
44
(0.0812) (0.0805) (0.0519) (0.0526)
B’s neediness (z) 0.935*** 0.929*** 0.817*** 0.810***
(0.1210) (0.1240) (0.0600) (0.0609)
Constant -3.845*** -3.969*** -3.685*** -3.801***
(0.2040) (0.7640) (0.1960) (0.8070)
Observations 3,204 3,204 3,204 3,204 3,204 3,204 3,204 3,204
Number of groups 267 267 267 267
log (pseudo)likelihood -872.38 -867.83 -809.73 -806.71 -1824.75 -1819.68 -1693.51 -1690.03
Wald/LR chi^2 78.62 87.45 229.56 236.82 187.51 197.65 449.98 456.93
prob>chi^2 <0.0001 <0.0001 <0.0001 <0.0001 <0.0001 <0.0001 <0.0001 <0.0001
Note: Specifications (1) to (4) are logit regressions with clustering on subject. Specifications (5) to (8) are rank-ordered logit regressions. To check the robustness of these results, we also add amount lent or/and borrowers’ display screen positions as controls. There is no qualitative impact on the significance level of the coefficients. Numbers in parenthesis are standard errors. # avtpe stands for average third-party evaluation specific to borrower (B) ## z stands for standardized lenders’ evaluation specific to borrower (B) *, **, and *** indicate significance at the 0.10 level, at the 0.05 level, and at the 0.01 level, respectively.
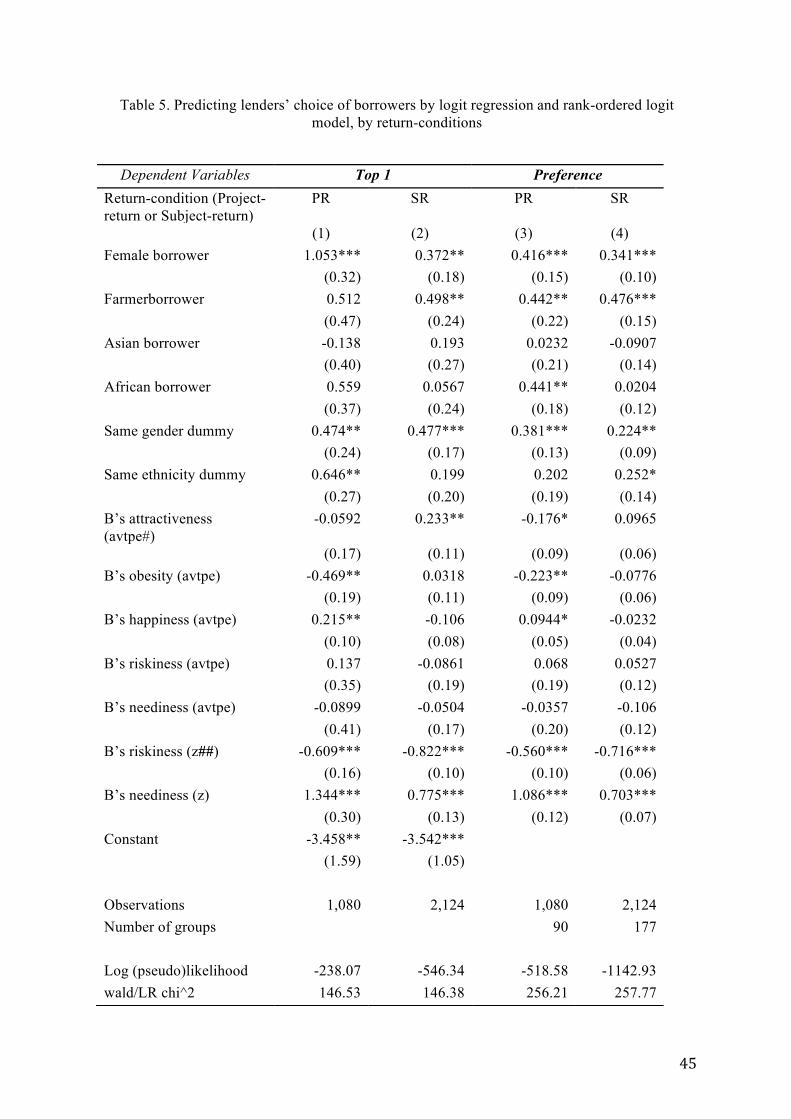
45
Table 5. Predicting lenders’ choice of borrowers by logit regressionand rank-ordered logit model, by return-conditions
Dependent Variables Top 1 Preference Return-condition (Project-return or Subject-return)
PR SR PR SR
(1) (2) (3) (4) Female borrower 1.053*** 0.372** 0.416*** 0.341*** (0.32) (0.18) (0.15) (0.10) Farmerborrower 0.512 0.498** 0.442** 0.476*** (0.47) (0.24) (0.22) (0.15) Asian borrower -0.138 0.193 0.0232 -0.0907 (0.40) (0.27) (0.21) (0.14) African borrower 0.559 0.0567 0.441** 0.0204 (0.37) (0.24) (0.18) (0.12) Same gender dummy 0.474** 0.477*** 0.381*** 0.224** (0.24) (0.17) (0.13) (0.09) Same ethnicity dummy 0.646** 0.199 0.202 0.252* (0.27) (0.20) (0.19) (0.14) B’s attractiveness (avtpe#)
-0.0592 0.233** -0.176* 0.0965
(0.17) (0.11) (0.09) (0.06) B’s obesity (avtpe) -0.469** 0.0318 -0.223** -0.0776 (0.19) (0.11) (0.09) (0.06) B’s happiness (avtpe) 0.215** -0.106 0.0944* -0.0232 (0.10) (0.08) (0.05) (0.04) B’s riskiness (avtpe) 0.137 -0.0861 0.068 0.0527 (0.35) (0.19) (0.19) (0.12) B’s neediness (avtpe) -0.0899 -0.0504 -0.0357 -0.106 (0.41) (0.17) (0.20) (0.12) B’s riskiness (z##) -0.609*** -0.822*** -0.560*** -0.716*** (0.16) (0.10) (0.10) (0.06) B’s neediness (z) 1.344*** 0.775*** 1.086*** 0.703*** (0.30) (0.13) (0.12) (0.07) Constant -3.458** -3.542*** (1.59) (1.05) Observations 1,080 2,124 1,080 2,124 Number of groups 90 177 Log (pseudo)likelihood -238.07 -546.34 -518.58 -1142.93 wald/LR chi^2 146.53 146.38 256.21 257.77

46
Note:Specifications(1)and(2)arelogitregressionswithclusteringonsubject’sid.Specifications(3)to(4)arerank-orderedlogitregressions.Numbersinparenthesisarestandarderrors.#avtpestandsforaveragethirdpartyevaluationspecifictoborrower(B)##zstandsforstandardizedlenders’evaluationspecifictoborrower(B)*,**,and***indicatesignificanceatthe0.10level,atthe0.05level,andatthe0.01level,respectively.
prob>chi^2 <0.0001 <0.0001 <0.0001 <0.0001