Embed Size (px)
Citation preview
IDFC BANK
Q1FY18 FINANCIALS
JULY 27, 2017
3
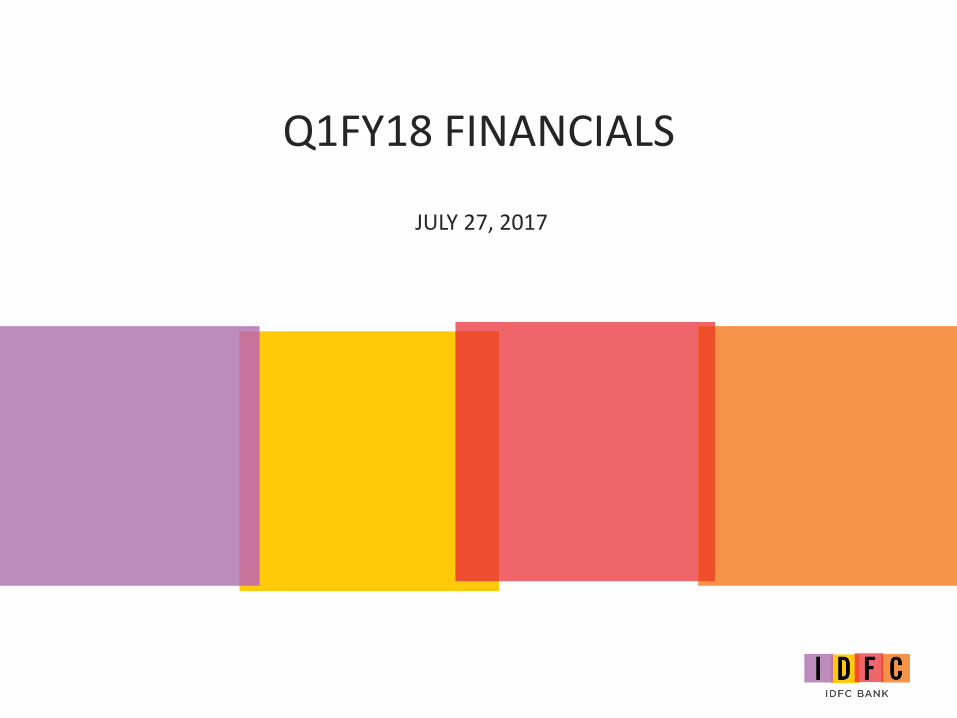
No. of Customers(Total: 16.0 lacs | IBL customers: 10.1 lacs)
Customers acquired in the quarter ended June: 226K (B+: 68K; BB: 110K; IBL; 48K
Network (11,873) CASA/Gross Advances
Non Interest Franchise Income/Total Non Interest Income
23.8% (` 142.7 Cr)
Non Interest Franchise Income/Total Operating Income
13.8%
Retailisation of Funded Book: ` 16,438 Cr
PAT GrowthQ1FY18: ` 438 Cr
60
11291237
1378
1605
Jun-16 Sep-16 Dec-16 Mar-17 Jun-17
10.8%
26.1%
Jun-16 Jun-17
Note: Grama Vidayal is now renamed as IDFC Bharat Limited (IBL)
YoY
65%
1.7%
3.3%
1.8%
4.1%
5.9%
Jun-16 Sep-16 Dec-16 Mar-17 Jun-17
Key Highlights: Q1 FY18
QoQ
(In 000’s)
149%
409 1,1544,275
8,189
11,429335
350
358
74
74
86
Jun
-16
Sep
-16
Dec
-16
Mar
-17
Jun
-17
Branches
Corporate BC
Payment Points
4
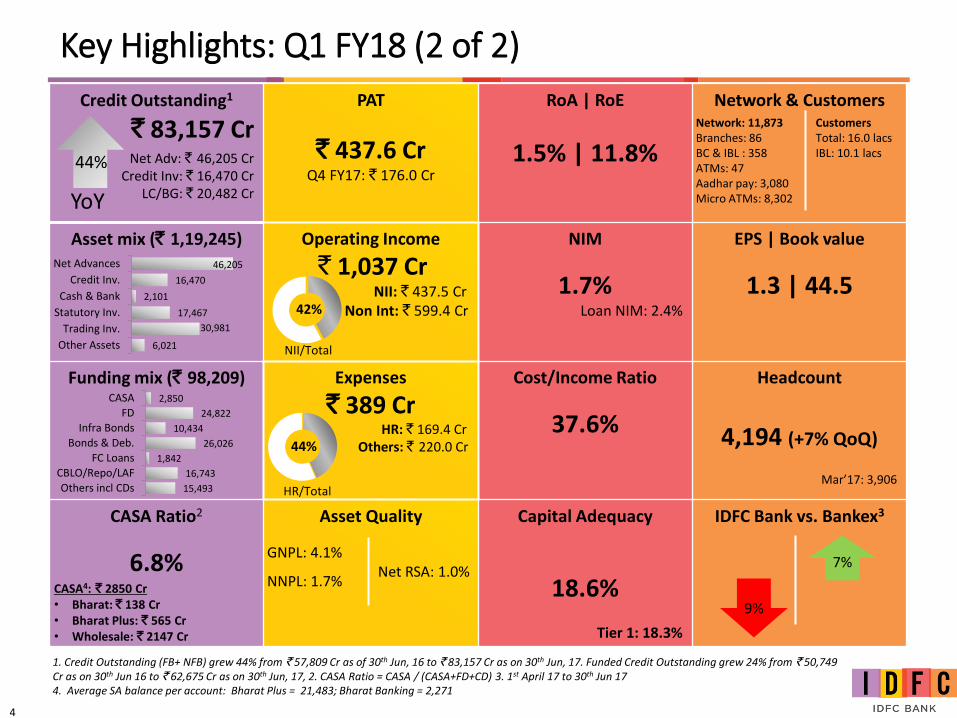
Key Highlights: Q1 FY18 (2 of 2)
Credit Outstanding1
` 83,157 CrNet Adv: ` 46,205 Cr
Credit Inv: ` 16,470 Cr LC/BG: ` 20,482 Cr
PAT
` 437.6 CrQ4 FY17: ` 176.0 Cr
RoA | RoE
1.5% | 11.8%
Network & Customers
Asset mix (` 1,19,245) Operating Income
` 1,037 CrNII: ` 437.5 Cr
Non Int: ` 599.4 Cr
NIM
1.7%Loan NIM: 2.4%
EPS | Book value
1.3 | 44.5
Funding mix (` 98,209) Expenses
` 389 CrHR: ` 169.4 Cr
Others: ` 220.0 Cr
Cost/Income Ratio
37.6%
Headcount
4,194 (+7% QoQ)
Mar’17: 3,906
CASA Ratio2
6.8%
Asset Quality Capital Adequacy
18.6%
Tier 1: 18.3%
IDFC Bank vs. Bankex3
2,850
24,822
10,434
26,026
1,842
16,743
15,493
CASA
FD
Infra Bonds
Bonds & Deb.
FC Loans
CBLO/Repo/LAF
Others incl CDs
42%
44%
GNPL: 4.1%
NNPL: 1.7%Net RSA: 1.0%
46,205
16,470
2,101
17,467
30,981
6,021
Net Advances
Credit Inv.
Cash & Bank
Statutory Inv.
Trading Inv.
Other Assets NII/Total
HR/Total
9%
1. Credit Outstanding (FB+ NFB) grew 44% from ` 57,809 Cr as of 30th Jun, 16 to ` 83,157 Cr as on 30th Jun, 17. Funded Credit Outstanding grew 24% from ` 50,749 Cr as on 30th Jun 16 to ` 62,675 Cr as on 30th Jun, 17, 2. CASA Ratio = CASA / (CASA+FD+CD) 3. 1st April 17 to 30th Jun 174. Average SA balance per account: Bharat Plus = 21,483; Bharat Banking = 2,271
Network: 11,873Branches: 86BC & IBL : 358ATMs: 47Aadhar pay: 3,080Micro ATMs: 8,302
CustomersTotal: 16.0 lacsIBL: 10.1 lacs
7%
44%
YoY
CASA4: ` 2850 Cr • Bharat: ` 138 Cr • Bharat Plus: ` 565 Cr• Wholesale: ` 2147 Cr
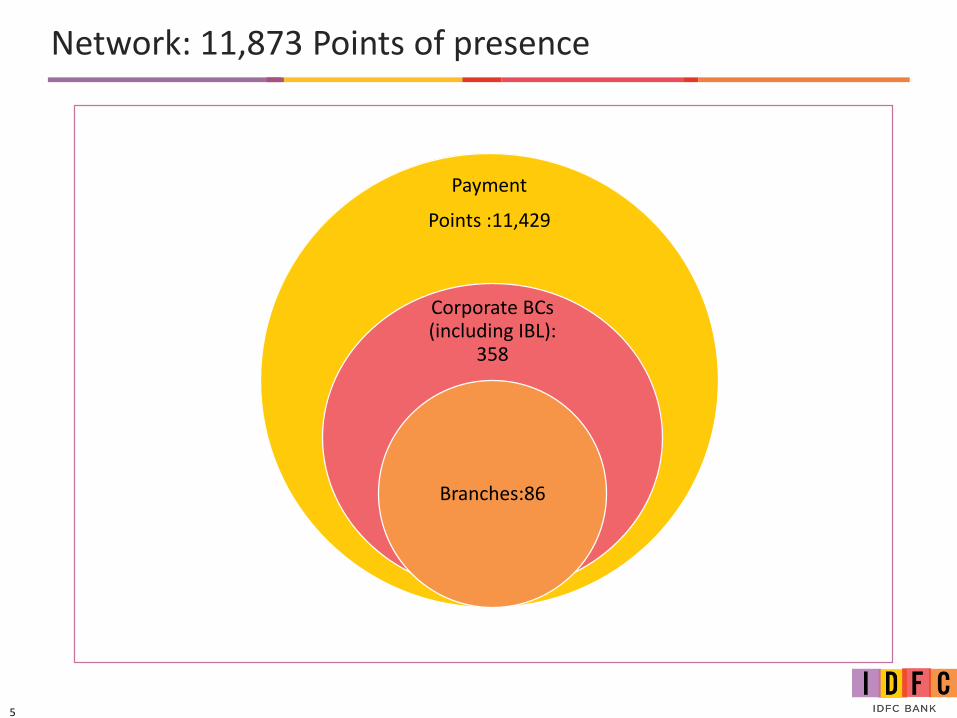
5
Network: 11,873 Points of presence
Payment
Points :11,429
Corporate BCs (including IBL):
358
Branches:86
6
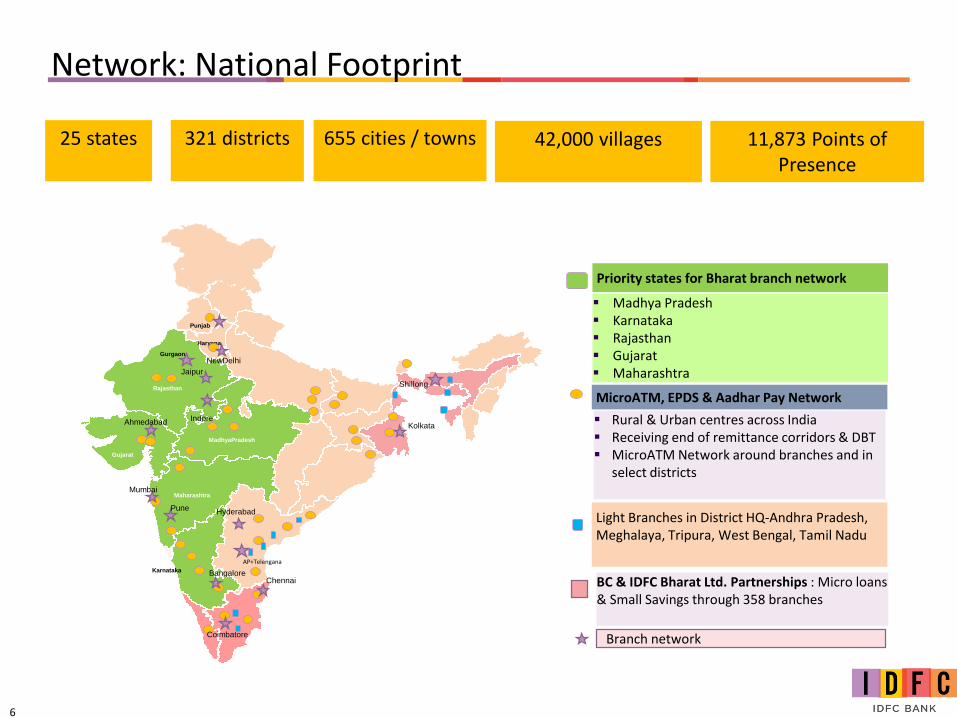
Network: National Footprint
▪ Rural & Urban centres across India▪ Receiving end of remittance corridors & DBT▪ MicroATM Network around branches and in
select districts
BC & IDFC Bharat Ltd. Partnerships : Micro loans & Small Savings through 358 branches
Branch network
Rajasthan
Gujarat
MadhyaPradesh
Maharashtra
Karnataka
Gurgaon
Punjab
Haryana
AP+Telengana
NewDelhi
Mumbai
Pune
Bangalore
Hyderabad
Chennai
KolkataAhmedabad
Jaipur
Indore
Coimbatore
Shillong
25 states 655 cities / towns 42,000 villages 11,873 Points of Presence
321 districts
Priority states for Bharat branch network
▪ Madhya Pradesh▪ Karnataka▪ Rajasthan▪ Gujarat▪ Maharashtra
MicroATM, EPDS & Aadhar Pay Network
Light Branches in District HQ-Andhra Pradesh, Meghalaya, Tripura, West Bengal, Tamil Nadu
7
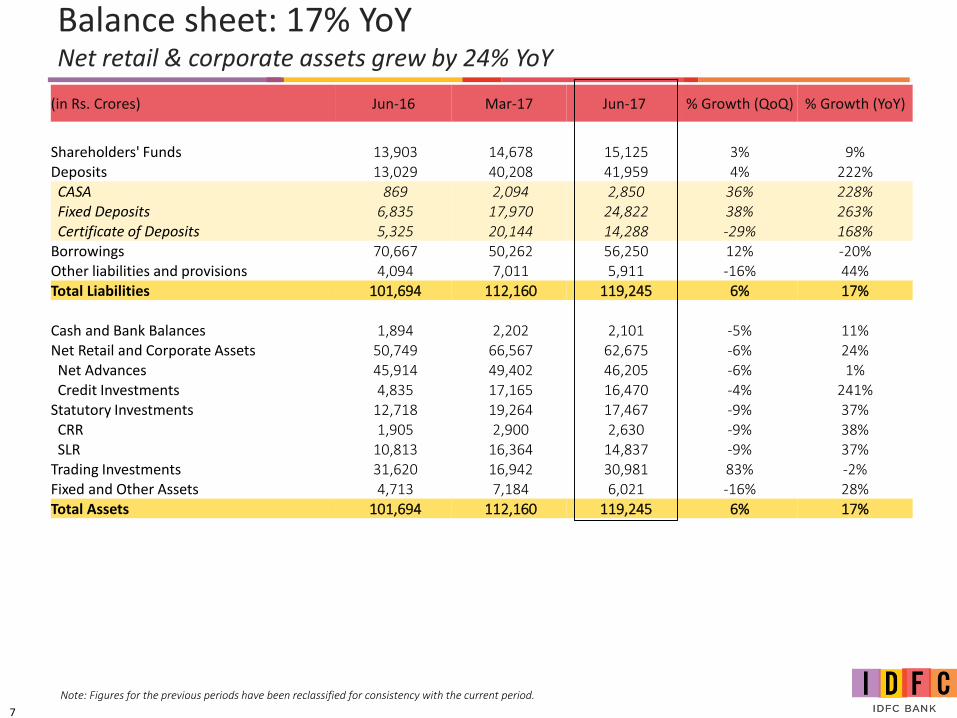
(in Rs. Crores) Jun-16 Mar-17 Jun-17 % Growth (QoQ) % Growth (YoY)
Shareholders' Funds 13,903 14,678 15,125 3% 9%Deposits 13,029 40,208 41,959 4% 222%CASA 869 2,094 2,850 36% 228%Fixed Deposits 6,835 17,970 24,822 38% 263%Certificate of Deposits 5,325 20,144 14,288 -29% 168%
Borrowings 70,667 50,262 56,250 12% -20%Other liabilities and provisions 4,094 7,011 5,911 -16% 44%Total Liabilities 101,694 112,160 119,245 6% 17%
Cash and Bank Balances 1,894 2,202 2,101 -5% 11%Net Retail and Corporate Assets 50,749 66,567 62,675 -6% 24%Net Advances 45,914 49,402 46,205 -6% 1%Credit Investments 4,835 17,165 16,470 -4% 241%
Statutory Investments 12,718 19,264 17,467 -9% 37%CRR 1,905 2,900 2,630 -9% 38%SLR 10,813 16,364 14,837 -9% 37%
Trading Investments 31,620 16,942 30,981 83% -2%Fixed and Other Assets 4,713 7,184 6,021 -16% 28%Total Assets 101,694 112,160 119,245 6% 17%
Note: Figures for the previous periods have been reclassified for consistency with the current period.
Balance sheet: 17% YoYNet retail & corporate assets grew by 24% YoY
8
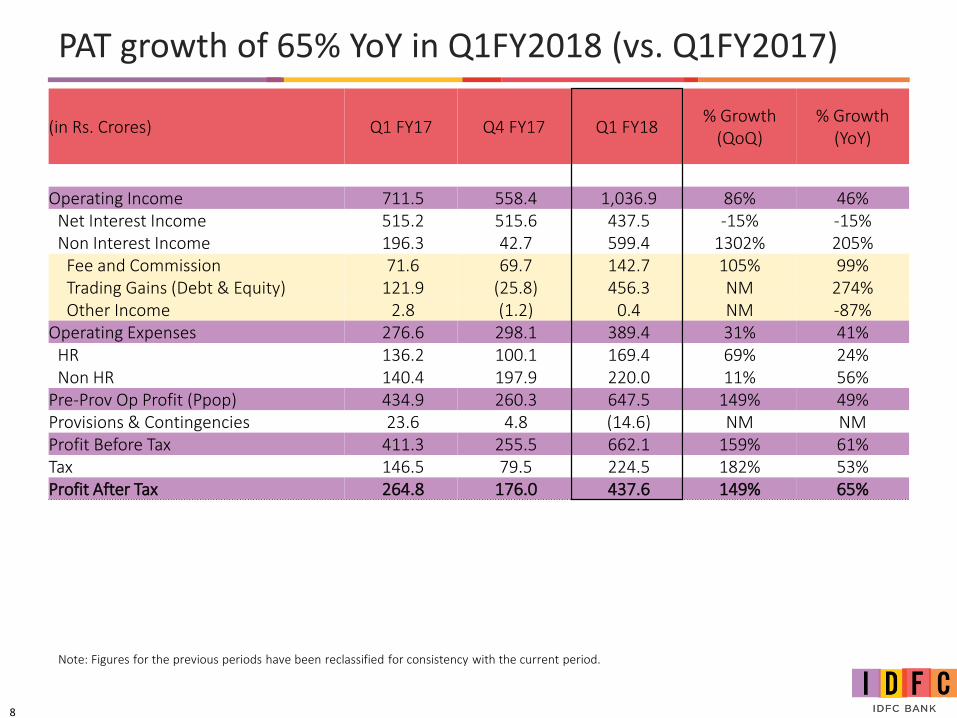
(in Rs. Crores) Q1 FY17 Q4 FY17 Q1 FY18% Growth
(QoQ)% Growth
(YoY)
Operating Income 711.5 558.4 1,036.9 86% 46%Net Interest Income 515.2 515.6 437.5 -15% -15%Non Interest Income 196.3 42.7 599.4 1302% 205%
Fee and Commission 71.6 69.7 142.7 105% 99%Trading Gains (Debt & Equity) 121.9 (25.8) 456.3 NM 274%Other Income 2.8 (1.2) 0.4 NM -87%
Operating Expenses 276.6 298.1 389.4 31% 41%HR 136.2 100.1 169.4 69% 24%Non HR 140.4 197.9 220.0 11% 56%
Pre-Prov Op Profit (Ppop) 434.9 260.3 647.5 149% 49%Provisions & Contingencies 23.6 4.8 (14.6) NM NMProfit Before Tax 411.3 255.5 662.1 159% 61%Tax 146.5 79.5 224.5 182% 53%Profit After Tax 264.8 176.0 437.6 149% 65%
PAT growth of 65% YoY in Q1FY2018 (vs. Q1FY2017)
Note: Figures for the previous periods have been reclassified for consistency with the current period.
9
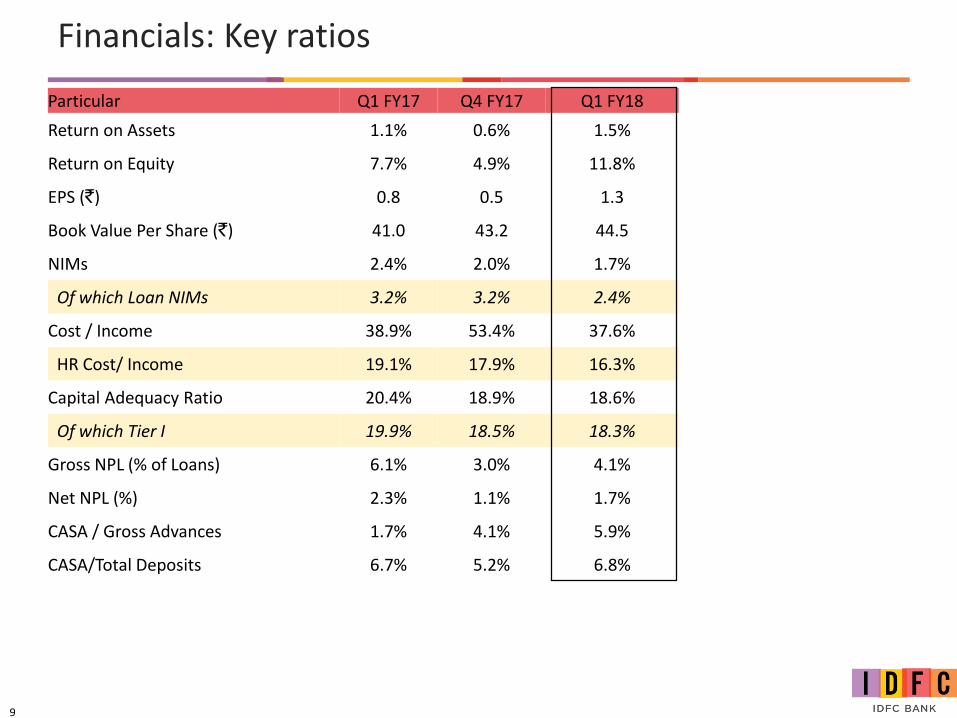
Particular Q1 FY17 Q4 FY17 Q1 FY18
Return on Assets 1.1% 0.6% 1.5%
Return on Equity 7.7% 4.9% 11.8%
EPS (`) 0.8 0.5 1.3
Book Value Per Share (`) 41.0 43.2 44.5
NIMs 2.4% 2.0% 1.7%
Of which Loan NIMs 3.2% 3.2% 2.4%
Cost / Income 38.9% 53.4% 37.6%
HR Cost/ Income 19.1% 17.9% 16.3%
Capital Adequacy Ratio 20.4% 18.9% 18.6%
Of which Tier I 19.9% 18.5% 18.3%
Gross NPL (% of Loans) 6.1% 3.0% 4.1%
Net NPL (%) 2.3% 1.1% 1.7%
CASA / Gross Advances 1.7% 4.1% 5.9%
CASA/Total Deposits 6.7% 5.2% 6.8%
Financials: Key ratios
10
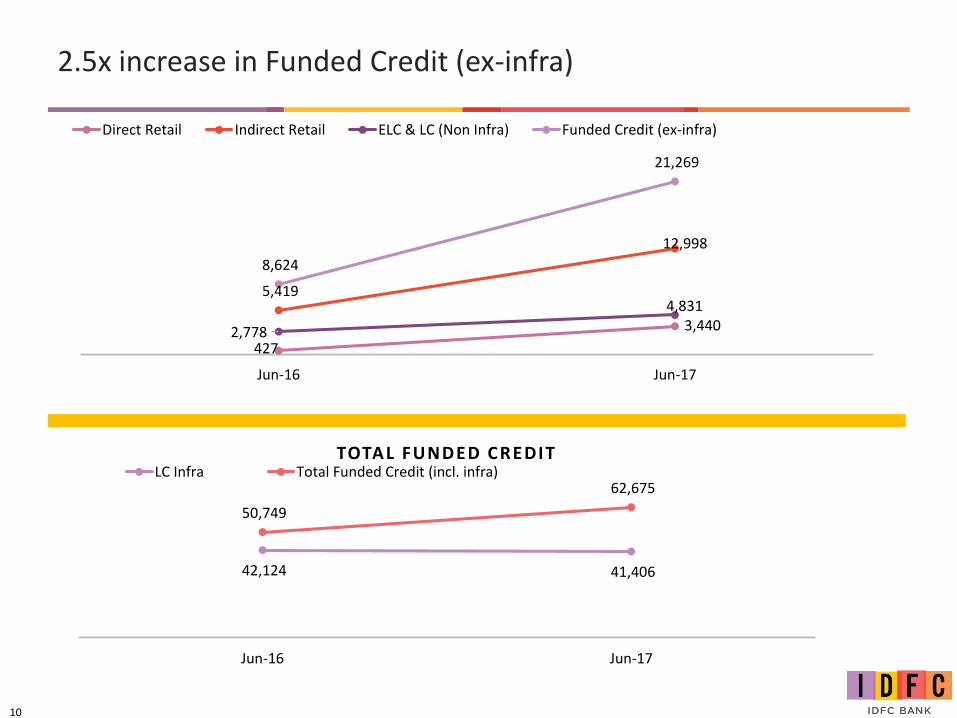
2.5x increase in Funded Credit (ex-infra)
427
3,440
5,419
12,998
2,778
4,831
8,624
21,269
Jun-16 Jun-17
Direct Retail Indirect Retail ELC & LC (Non Infra) Funded Credit (ex-infra)
42,124 41,406
50,749
62,675
Jun-16 Jun-17
TOTAL FUNDED CREDIT LC Infra Total Funded Credit (incl. infra)
11
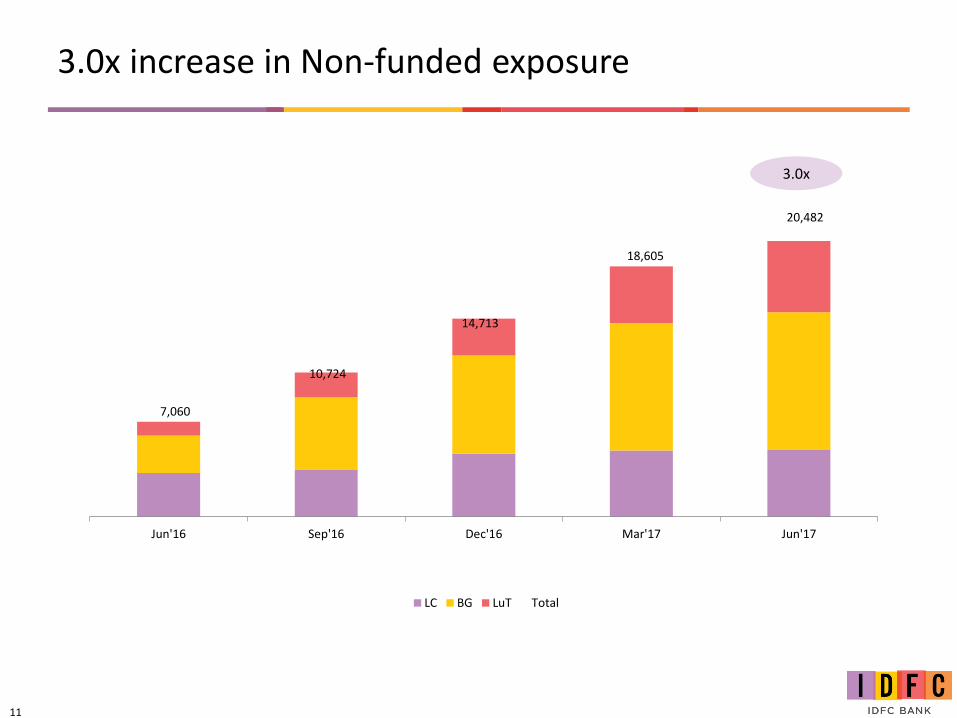
7,060
10,724
14,713
18,605
20,482
Jun'16 Sep'16 Dec'16 Mar'17 Jun'17
LC BG LuT Total
3.0x
3.0x increase in Non-funded exposure
12
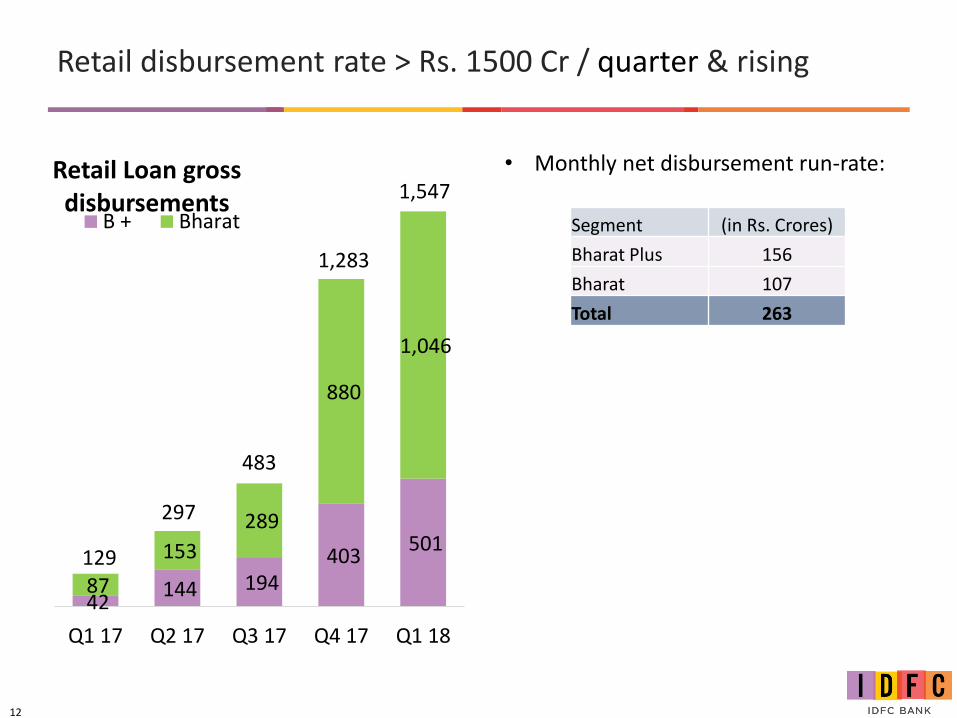
Retail disbursement rate > Rs. 1500 Cr / quarter & rising
Segment (in Rs. Crores)
Bharat Plus 156
Bharat 107
Total 263
• Monthly net disbursement run-rate:
42 144 194
403 501
87
153
289
880
1,046
129
297
483
1,283
1,547
Q1 17 Q2 17 Q3 17 Q4 17 Q1 18
Retail Loan gross disbursements
B + Bharat
13
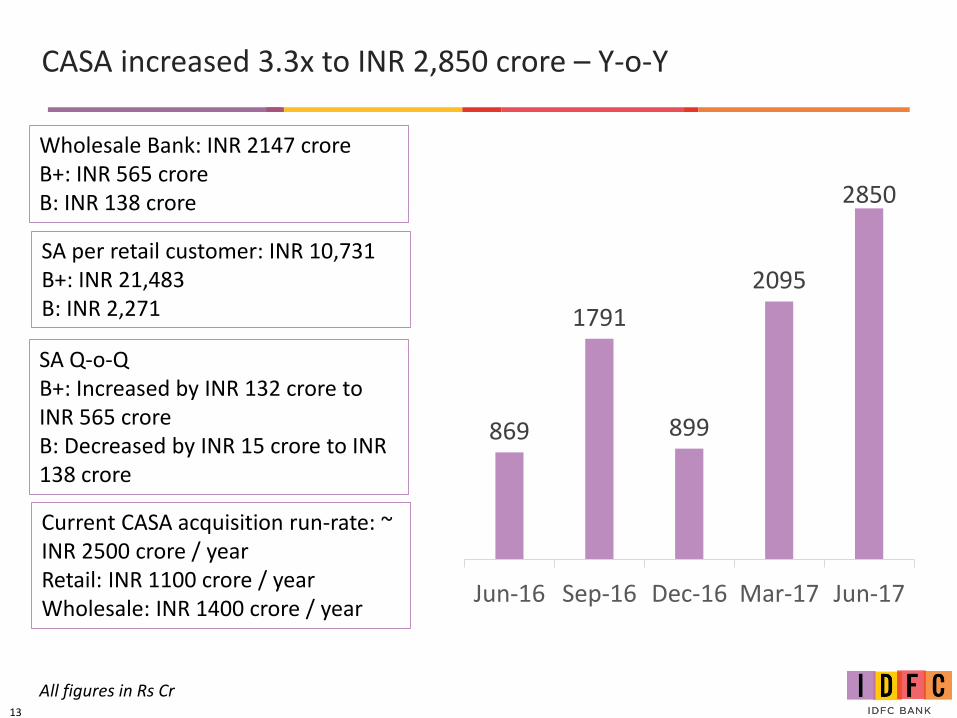
CASA increased 3.3x to INR 2,850 crore – Y-o-Y
All figures in Rs Cr
Wholesale Bank: INR 2147 croreB+: INR 565 croreB: INR 138 crore
SA per retail customer: INR 10,731B+: INR 21,483B: INR 2,271
SA Q-o-QB+: Increased by INR 132 crore to INR 565 croreB: Decreased by INR 15 crore to INR 138 crore
869
1791
899
2095
2850
Jun-16 Sep-16 Dec-16 Mar-17 Jun-17
Current CASA acquisition run-rate: ~ INR 2500 crore / yearRetail: INR 1100 crore / yearWholesale: INR 1400 crore / year
14
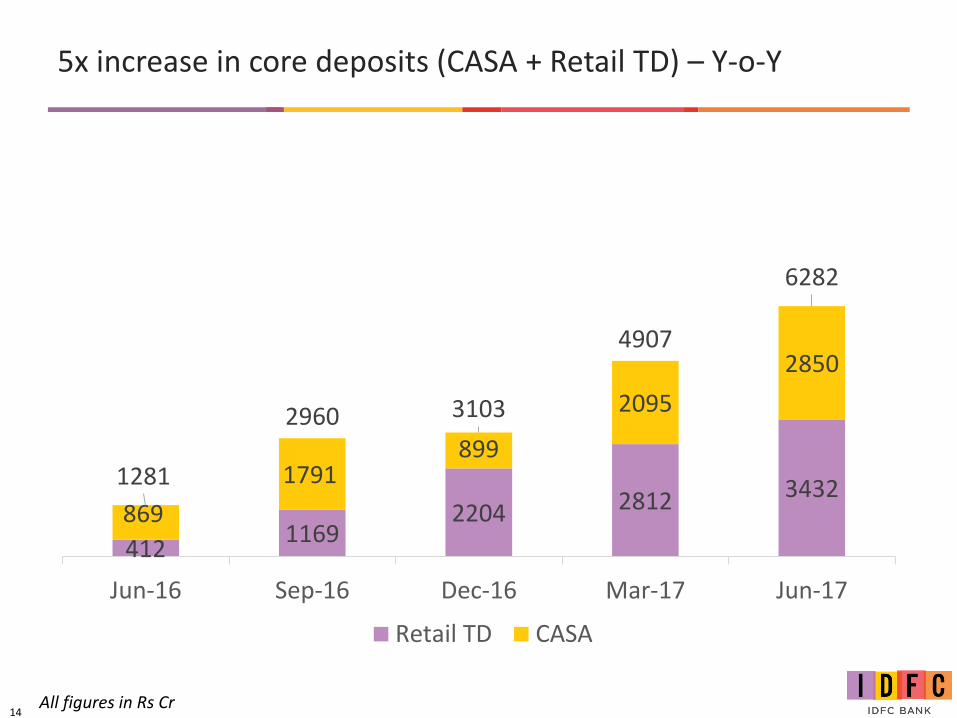
5x increase in core deposits (CASA + Retail TD) – Y-o-Y
All figures in Rs Cr
4121169
2204 2812 3432869
1791899
2095
2850
1281
2960 3103
4907
6282
Jun-16 Sep-16 Dec-16 Mar-17 Jun-17
Retail TD CASA
15
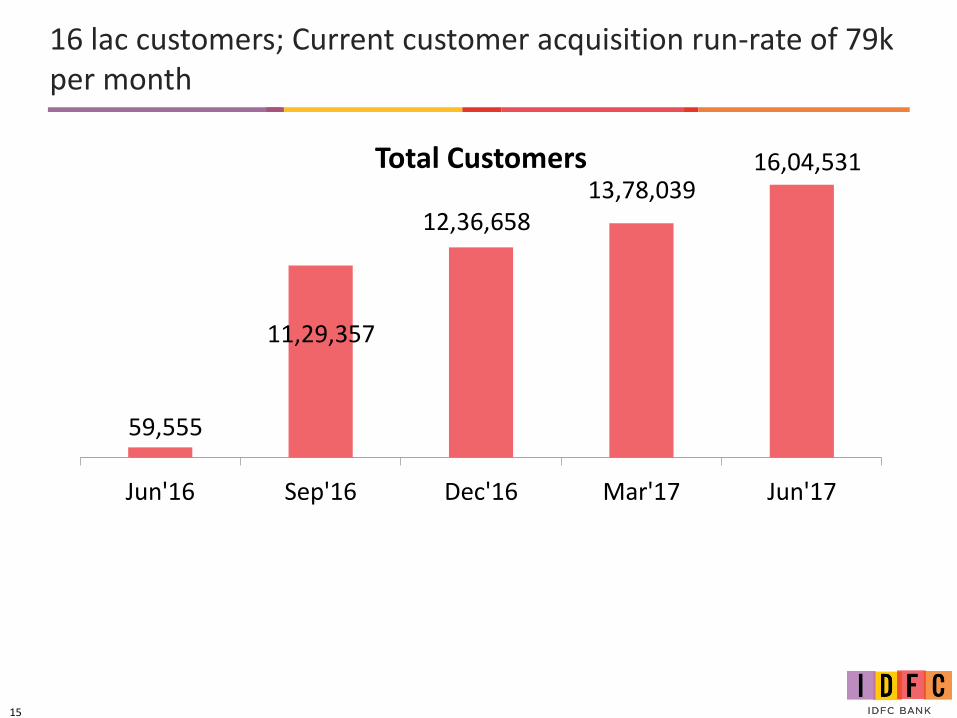
16 lac customers; Current customer acquisition run-rate of 79k per month
59,555
11,29,357
12,36,658 13,78,039
16,04,531
Jun'16 Sep'16 Dec'16 Mar'17 Jun'17
Total Customers
16
BUSINESS HIGHLIGHTS
17
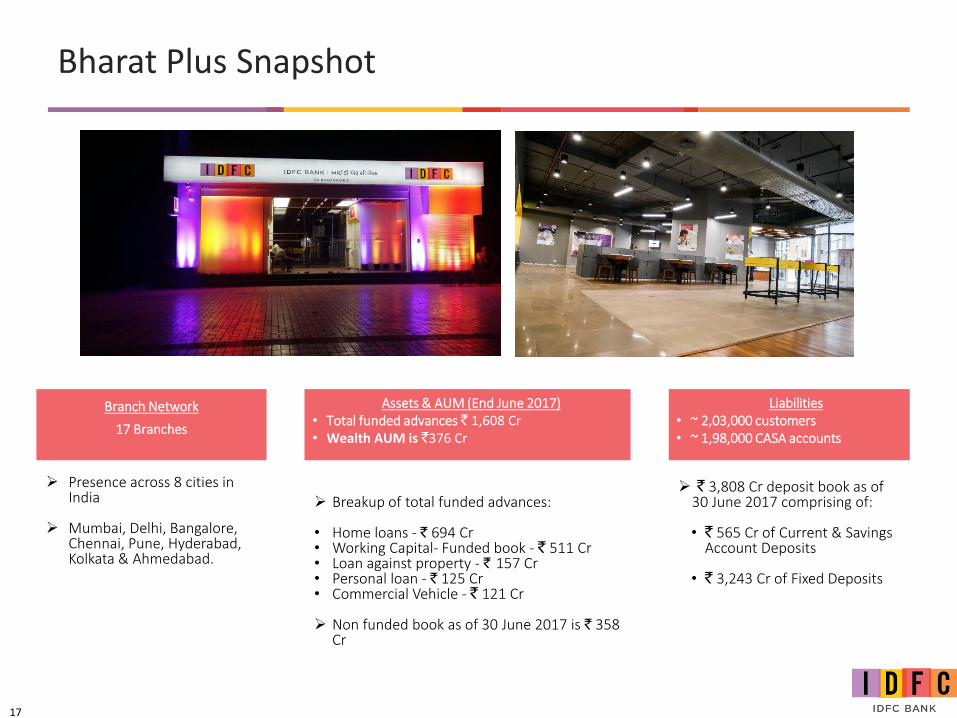
Bharat Plus Snapshot
Branch Network
17 Branches
Liabilities• ~ 2,03,000 customers• ~ 1,98,000 CASA accounts
Assets & AUM (End June 2017)• Total funded advances ` 1,608 Cr• Wealth AUM is `376 Cr
➢ Presence across 8 cities in India
➢ Mumbai, Delhi, Bangalore, Chennai, Pune, Hyderabad, Kolkata & Ahmedabad.
➢ ` 3,808 Cr deposit book as of 30 June 2017 comprising of:
• ` 565 Cr of Current & Savings Account Deposits
• ` 3,243 Cr of Fixed Deposits
➢ Breakup of total funded advances:
• Home loans - ` 694 Cr• Working Capital- Funded book - ` 511 Cr• Loan against property - ` 157 Cr• Personal loan - ` 125 Cr• Commercial Vehicle - ` 121 Cr
➢ Non funded book as of 30 June 2017 is ` 358 Cr
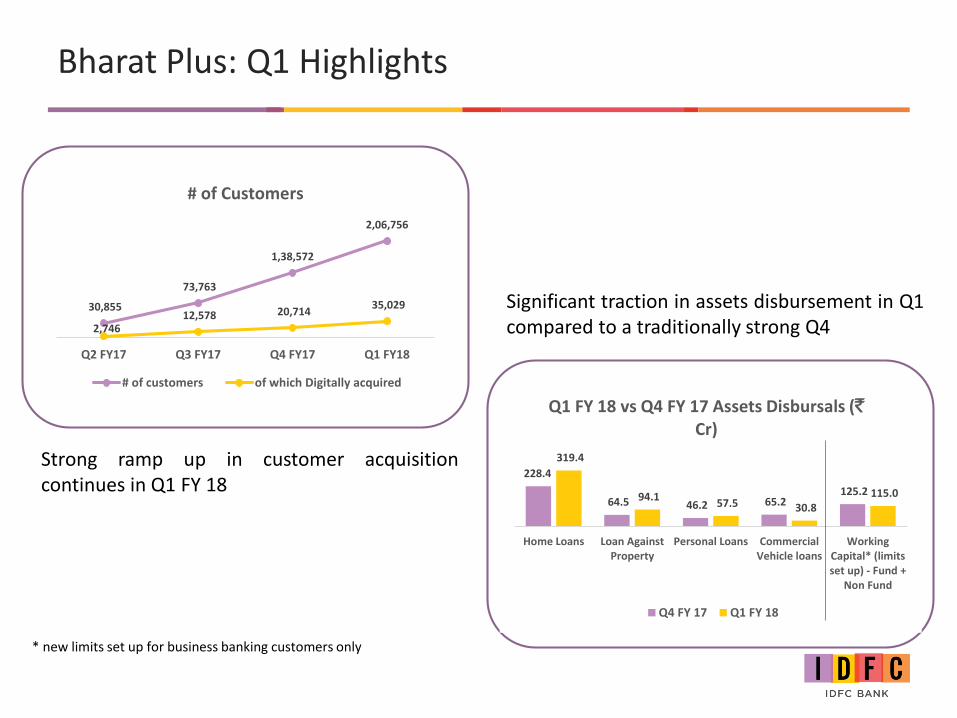
Bharat Plus: Q1 Highlights
Strong ramp up in customer acquisitioncontinues in Q1 FY 18
Significant traction in assets disbursement in Q1compared to a traditionally strong Q4
30,855
73,763
1,38,572
2,06,756
2,746 12,578 20,714
35,029
Q2 FY17 Q3 FY17 Q4 FY17 Q1 FY18
# of Customers
# of customers of which Digitally acquired
228.4
64.5 46.2 65.2 125.2
319.4
94.1 57.5 30.8
115.0
Home Loans Loan AgainstProperty
Personal Loans CommercialVehicle loans
WorkingCapital* (limitsset up) - Fund +
Non Fund
Q1 FY 18 vs Q4 FY 17 Assets Disbursals (`Cr)
Q4 FY 17 Q1 FY 18
* new limits set up for business banking customers only
19
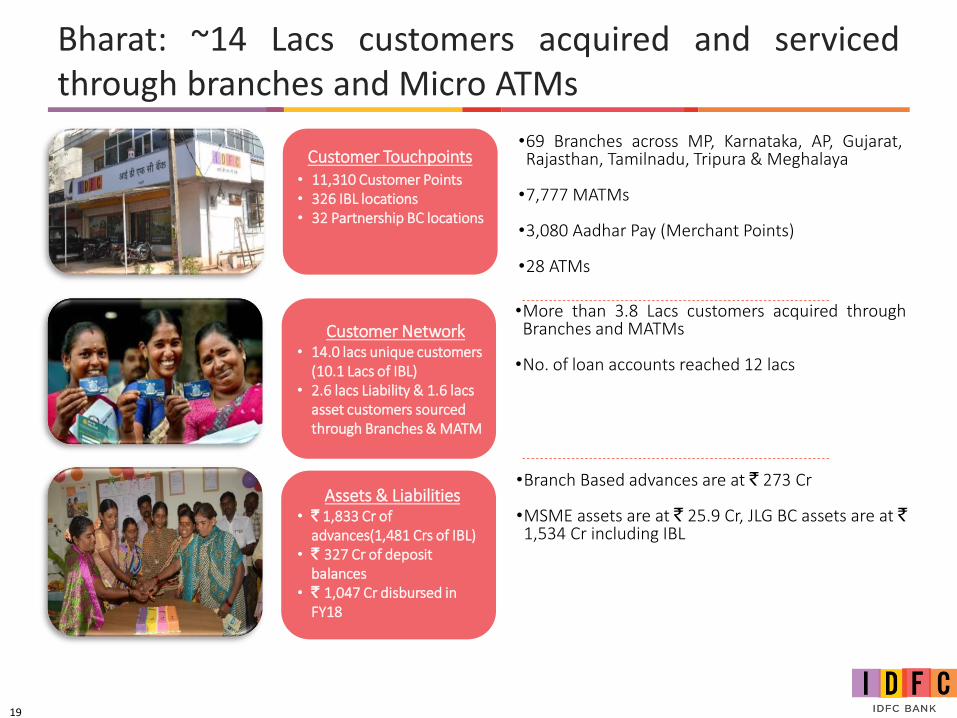
Bharat: ~14 Lacs customers acquired and servicedthrough branches and Micro ATMs
Customer Touchpoints• 11,310 Customer Points• 326 IBL locations• 32 Partnership BC locations
Assets & Liabilities • ` 1,833 Cr of
advances(1,481 Crs of IBL)• ` 327 Cr of deposit
balances• ` 1,047 Cr disbursed in
FY18
•69 Branches across MP, Karnataka, AP, Gujarat,Rajasthan, Tamilnadu, Tripura & Meghalaya
•7,777 MATMs
•3,080 Aadhar Pay (Merchant Points)
•28 ATMs
•More than 3.8 Lacs customers acquired throughBranches and MATMs
•No. of loan accounts reached 12 lacs
•Branch Based advances are at ` 273 Cr
•MSME assets are at ` 25.9 Cr, JLG BC assets are at `1,534 Cr including IBL
Customer Network• 14.0 lacs unique customers
(10.1 Lacs of IBL)• 2.6 lacs Liability & 1.6 lacs
asset customers sourced through Branches & MATM
20
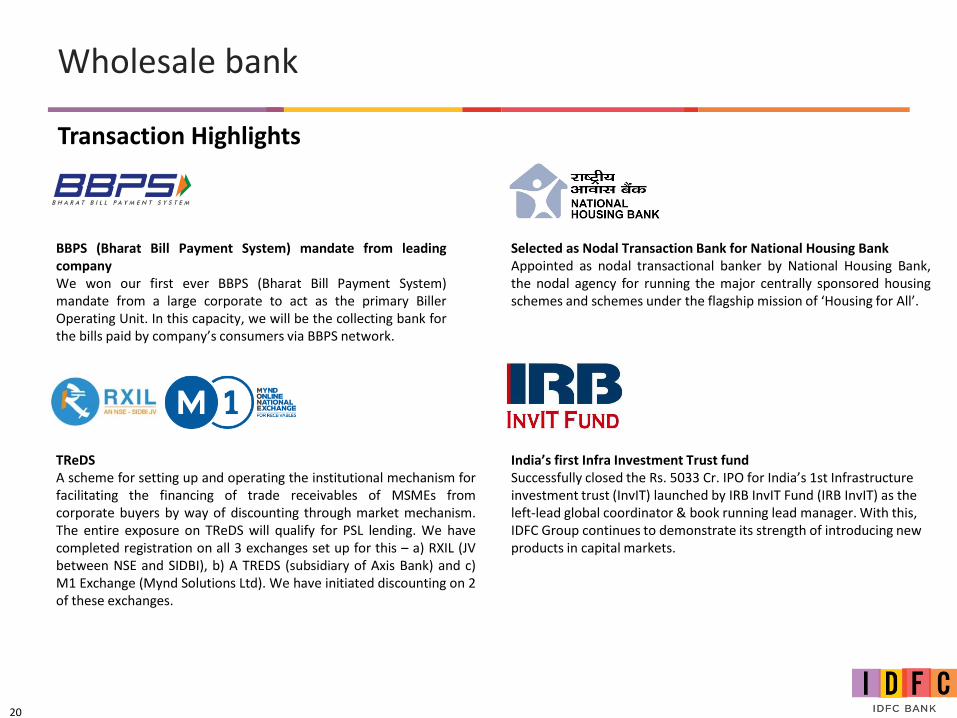
Wholesale bank
Transaction Highlights
BBPS (Bharat Bill Payment System) mandate from leadingcompanyWe won our first ever BBPS (Bharat Bill Payment System)mandate from a large corporate to act as the primary BillerOperating Unit. In this capacity, we will be the collecting bank forthe bills paid by company’s consumers via BBPS network.
Selected as Nodal Transaction Bank for National Housing BankAppointed as nodal transactional banker by National Housing Bank,the nodal agency for running the major centrally sponsored housingschemes and schemes under the flagship mission of ‘Housing for All’.
TReDSA scheme for setting up and operating the institutional mechanism forfacilitating the financing of trade receivables of MSMEs fromcorporate buyers by way of discounting through market mechanism.The entire exposure on TReDS will qualify for PSL lending. We havecompleted registration on all 3 exchanges set up for this – a) RXIL (JVbetween NSE and SIDBI), b) A TREDS (subsidiary of Axis Bank) and c)M1 Exchange (Mynd Solutions Ltd). We have initiated discounting on 2of these exchanges.
India’s first Infra Investment Trust fundSuccessfully closed the Rs. 5033 Cr. IPO for India’s 1st Infrastructure investment trust (InvIT) launched by IRB InvIT Fund (IRB InvIT) as the left-lead global coordinator & book running lead manager. With this, IDFC Group continues to demonstrate its strength of introducing new products in capital markets.
21
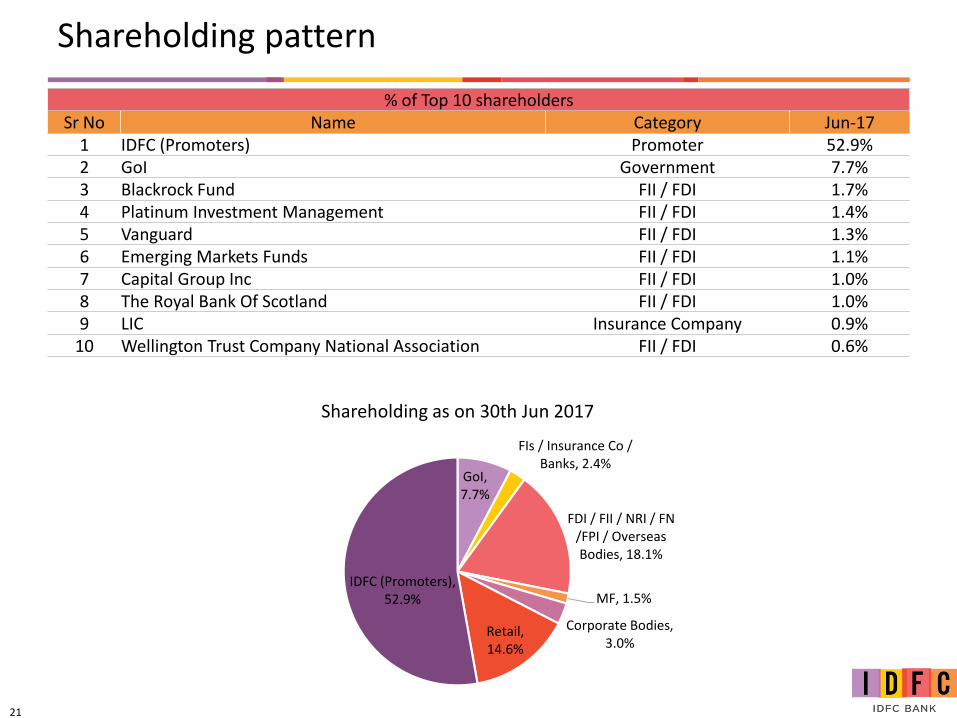
Shareholding pattern
GoI, 7.7%
FIs / Insurance Co / Banks, 2.4%
FDI / FII / NRI / FN /FPI / Overseas Bodies, 18.1%
MF, 1.5%
Corporate Bodies, 3.0%
Retail, 14.6%
IDFC (Promoters), 52.9%
Shareholding as on 30th Jun 2017
% of Top 10 shareholdersSr No Name Category Jun-17
1 IDFC (Promoters) Promoter 52.9%2 GoI Government 7.7%3 Blackrock Fund FII / FDI 1.7%4 Platinum Investment Management FII / FDI 1.4%5 Vanguard FII / FDI 1.3%6 Emerging Markets Funds FII / FDI 1.1%7 Capital Group Inc FII / FDI 1.0%8 The Royal Bank Of Scotland FII / FDI 1.0%9 LIC Insurance Company 0.9%
10 Wellington Trust Company National Association FII / FDI 0.6%
THANK YOU