Embed Size (px)
Citation preview
Idle-Reduction Technologies
A White Paper To Discuss The Opportunity and the Challenges
Robert Hupfer, July 15, 2009
Agenda
1. The Market Requirements
2. The Product Portfolio Today
3. The Future View
4. Q&A
The targets of this presentation:
Provide information to support decision process for Idle-Reduction Technologies
Provide forum, to discuss customer and industry requirements
Share our technical knowledge and R&D results
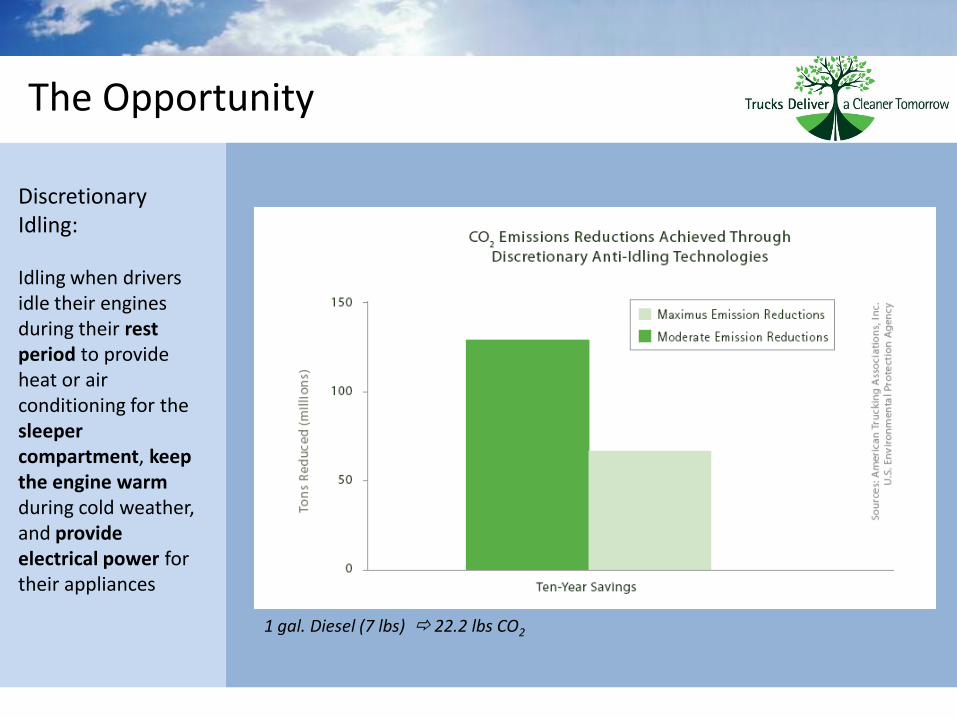
The Opportunity
Discretionary Idling:
Idling when drivers idle their engines during their rest period to provide heat or air conditioning for the sleeper compartment, keep the engine warm during cold weather, and provide electrical power for their appliances
1 gal. Diesel (7 lbs) 22.2 lbs CO2

The Challenge
Driver
OEMFleet
1. Comfort2. High Performance3. Reliability4. Low Maintenance
1. Cost competitive2. High Quality3. Modular
1. Comfort @ fast ROI2. Reliability3. Low Maintenance4. Easy Installation
Customer checklist:
Is the product / system providing the target comfort and performance ?
Is the product reliable ?
What are the lifetime maintenance cost ?
What are the installation methods and cost ?
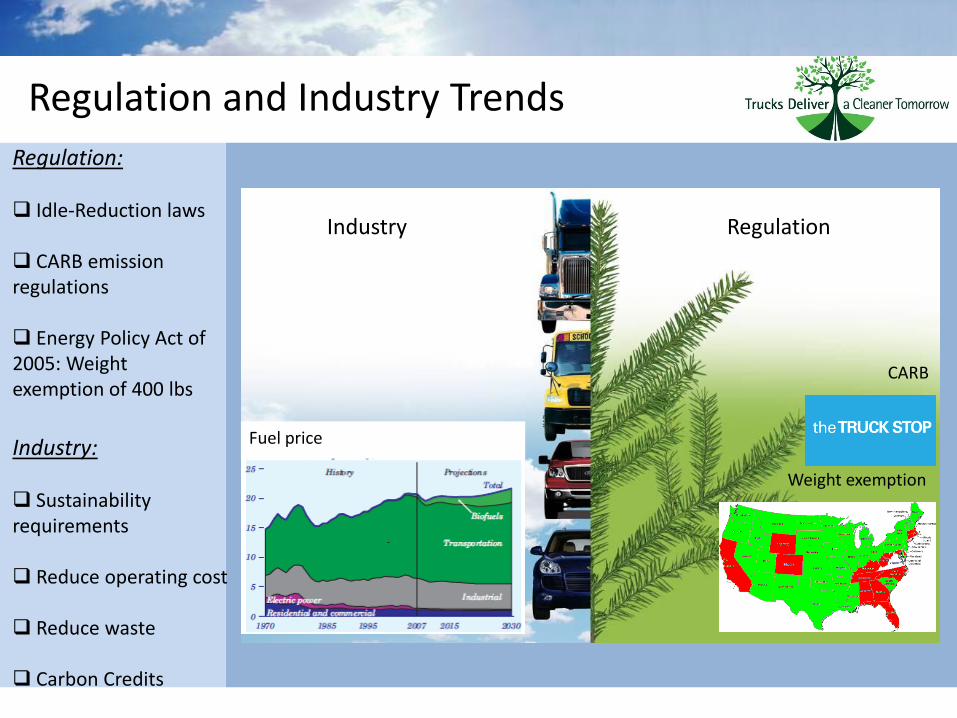
Regulation and Industry Trends
Regulation:
Idle-Reduction laws
CARB emission regulations
Energy Policy Act of 2005: Weight exemption of 400 lbs
Industry:
Sustainability requirements
Reduce operating cost
Reduce waste
Carbon Credits
Industry Regulation
CARB
Weight exemption
Fuel price
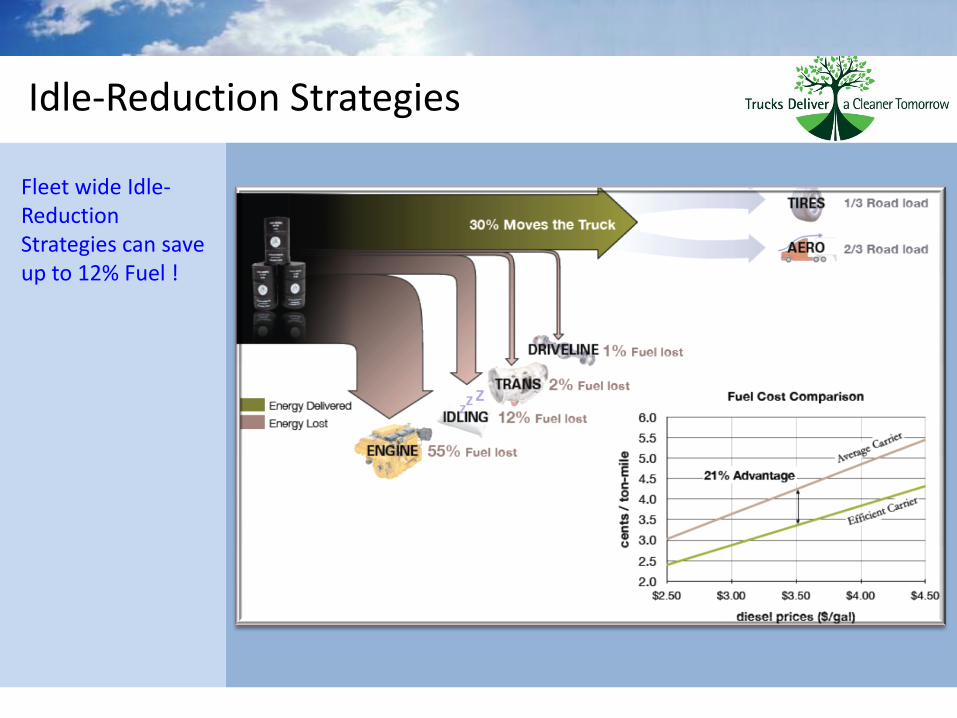
Idle-Reduction Strategies
Fleet wide Idle-Reduction Strategies can save up to 12% Fuel !
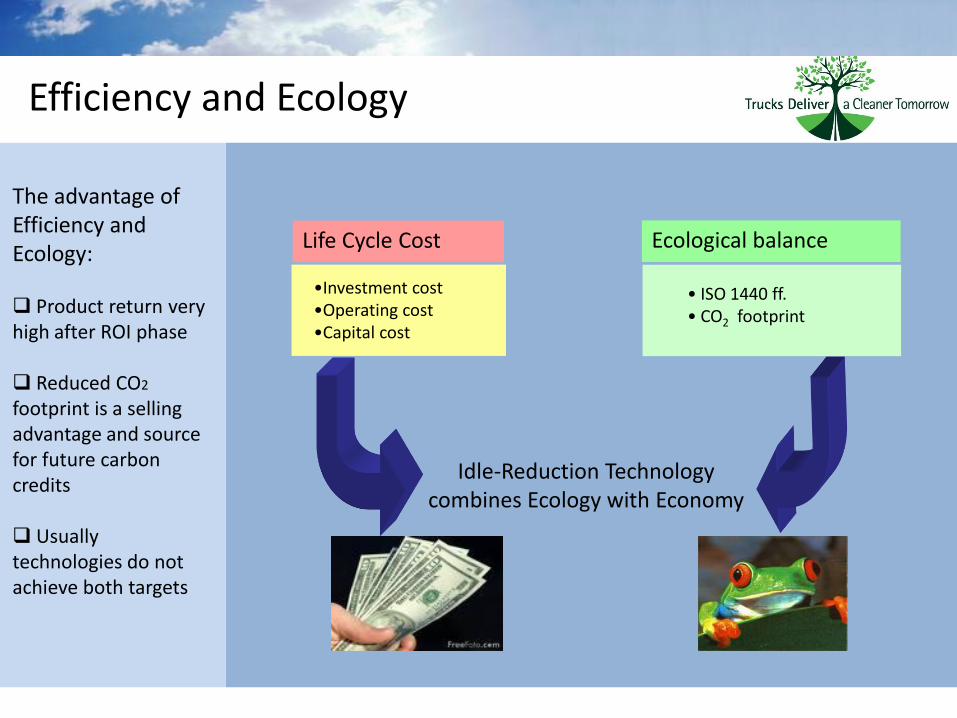
Efficiency and Ecology
Life Cycle Cost
•Investment cost•Operating cost•Capital cost
Ecological balance
• ISO 1440 ff.• CO2 footprint
Idle-Reduction Technology combines Ecology with Economy
The advantage of Efficiency and Ecology:
Product return very high after ROI phase
Reduced CO2
footprint is a selling advantage and source for future carbon credits
Usually technologies do not achieve both targets
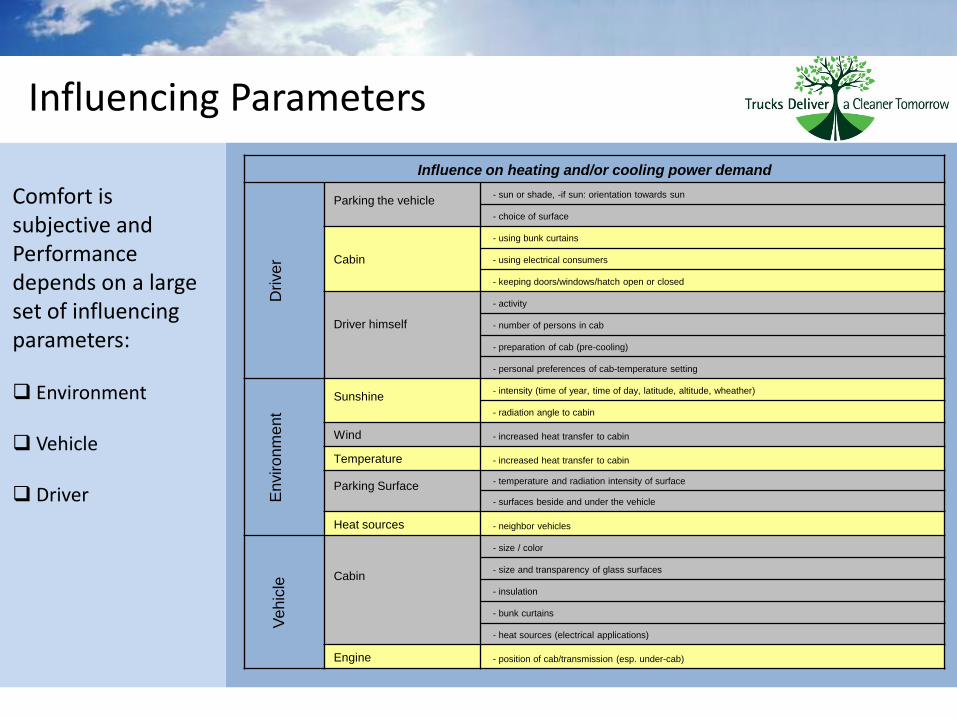
Influencing Parameters
Influence on heating and/or cooling power demand
Drive
r
Parking the vehicle- sun or shade, -if sun: orientation towards sun
- choice of surface
Cabin
- using bunk curtains
- using electrical consumers
- keeping doors/windows/hatch open or closed
Driver himself
- activity
- number of persons in cab
- preparation of cab (pre-cooling)
- personal preferences of cab-temperature setting
En
viro
nm
ent
Sunshine- intensity (time of year, time of day, latitude, altitude, wheather)
- radiation angle to cabin
Wind - increased heat transfer to cabin
Temperature - increased heat transfer to cabin
Parking Surface- temperature and radiation intensity of surface
- surfaces beside and under the vehicle
Heat sources - neighbor vehicles
Ve
hic
le
Cabin
- size / color
- size and transparency of glass surfaces
- insulation
- bunk curtains
- heat sources (electrical applications)
Engine - position of cab/transmission (esp. under-cab)
Comfort is subjective and Performance depends on a large set of influencing parameters:
Environment
Vehicle
Driver

Agenda
1. The Market Requirements
2. The Product Portfolio Today
3. The Future View
4. Q&A
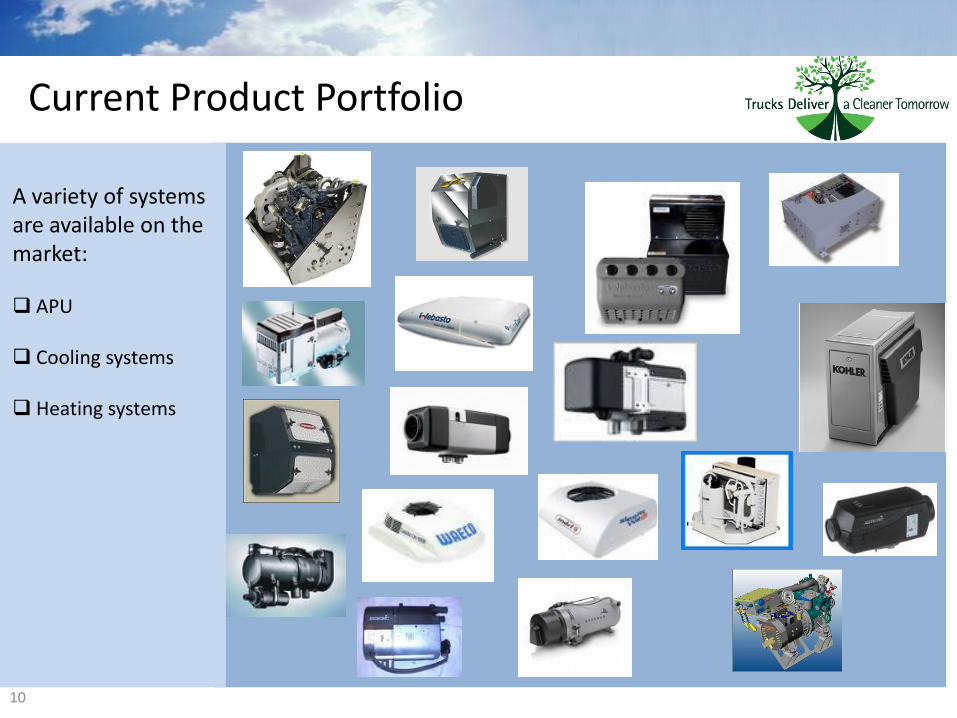
Current Product Portfolio
10
A variety of systems are available on the market:
APU
Cooling systems
Heating systems
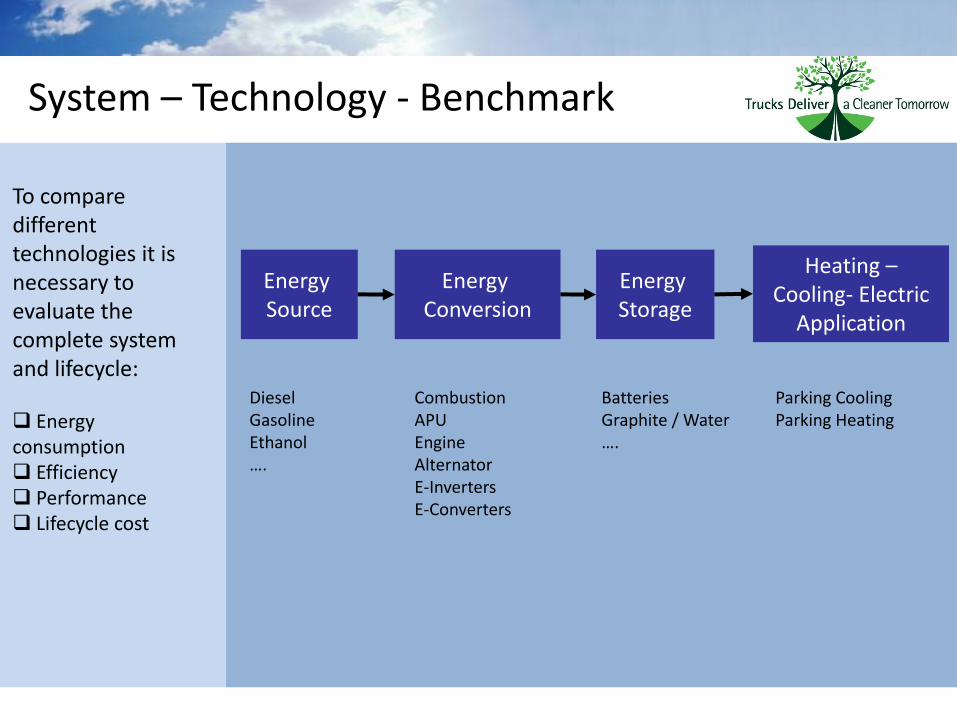
System – Technology - Benchmark
Energy Source
Energy Conversion
Energy Storage
Heating –Cooling- Electric
Application
DieselGasolineEthanol….
CombustionAPUEngineAlternatorE-InvertersE-Converters
BatteriesGraphite / Water….
Parking CoolingParking Heating
To compare different technologies it is necessary to evaluate the complete system and lifecycle:
Energy consumption Efficiency Performance Lifecycle cost
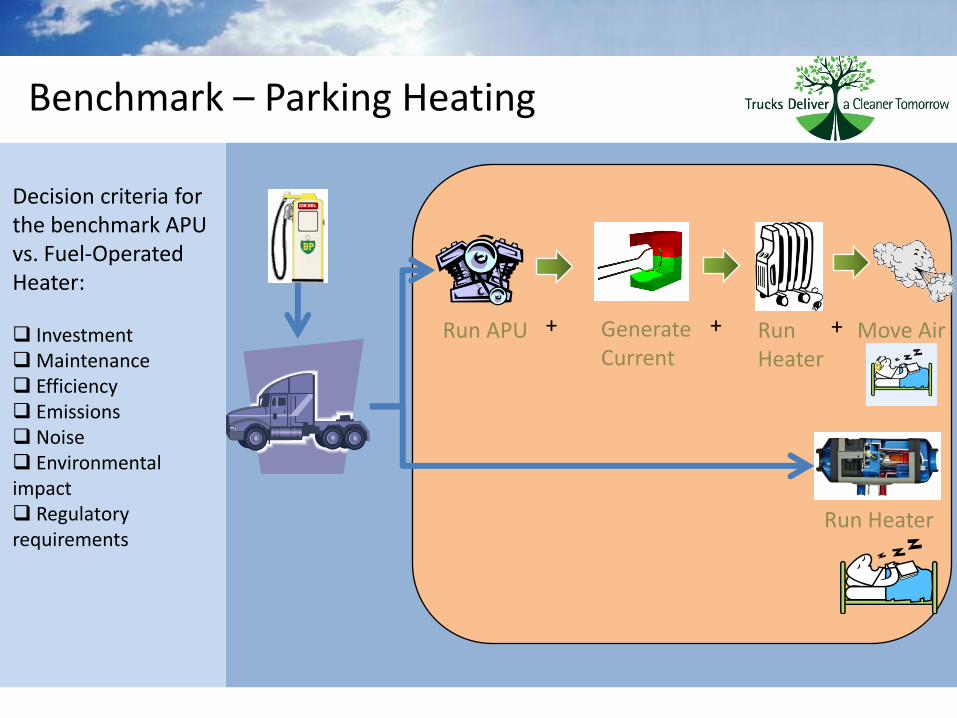
Benchmark – Parking Heating
Run APU Run Heater
Move Air+ +
Run Heater
Generate Current
+
Decision criteria for the benchmark APU vs. Fuel-Operated Heater:
InvestmentMaintenance Efficiency Emissions Noise Environmental impact Regulatory requirements
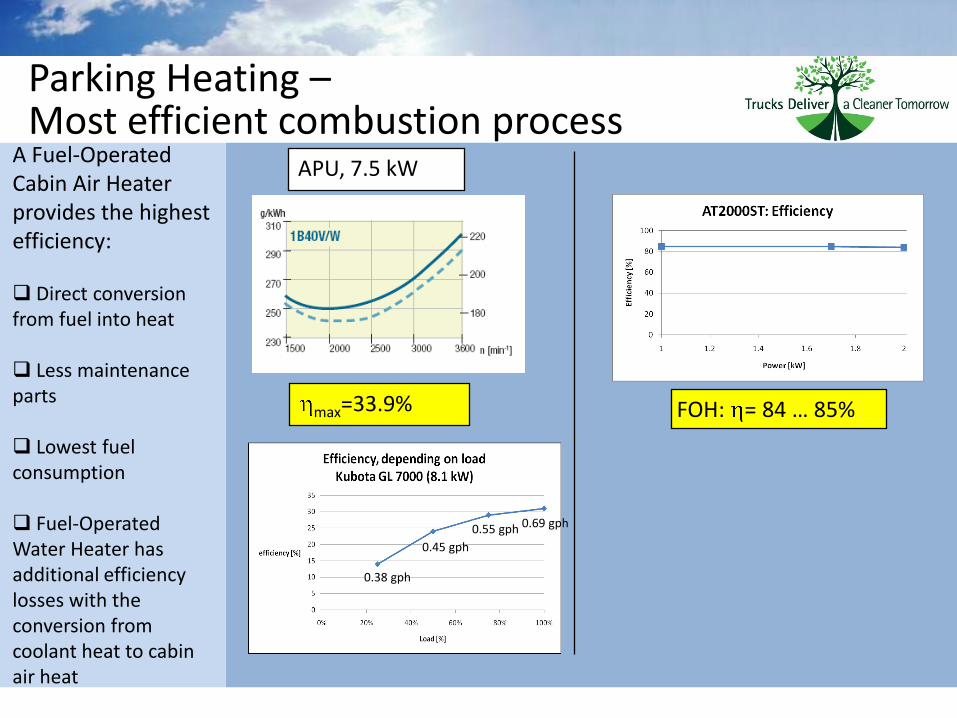
Parking Heating –Most efficient combustion process
FOH: = 84 … 85%
APU, 7.5 kW
max=33.9%
0.69 gph0.55 gph
0.45 gph
0.38 gph
A Fuel-Operated Cabin Air Heater provides the highest efficiency:
Direct conversion from fuel into heat
Less maintenance parts
Lowest fuel consumption
Fuel-Operated Water Heater has additional efficiency losses with the conversion from coolant heat to cabin air heat
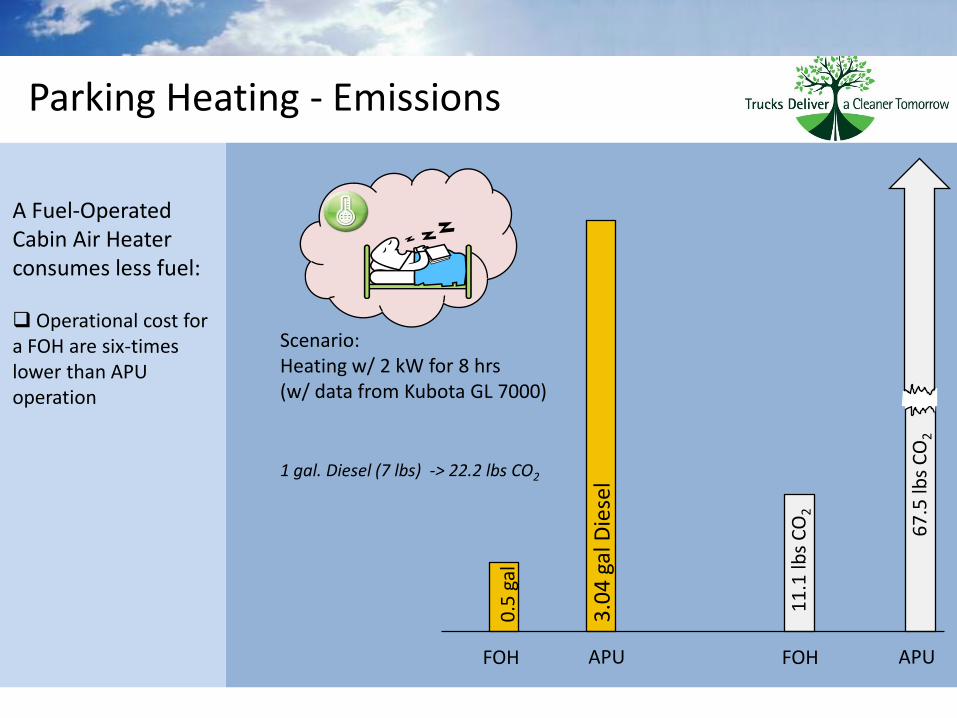
Parking Heating - Emissions
3.0
4 g
al D
iese
l
0.5
gal
67
.5 lb
s C
O2
11
.1 lb
s C
O2
APUFOH APUFOH
Scenario:Heating w/ 2 kW for 8 hrs(w/ data from Kubota GL 7000)
1 gal. Diesel (7 lbs) -> 22.2 lbs CO2
A Fuel-Operated Cabin Air Heater consumes less fuel:
Operational cost for a FOH are six-times lower than APU operation
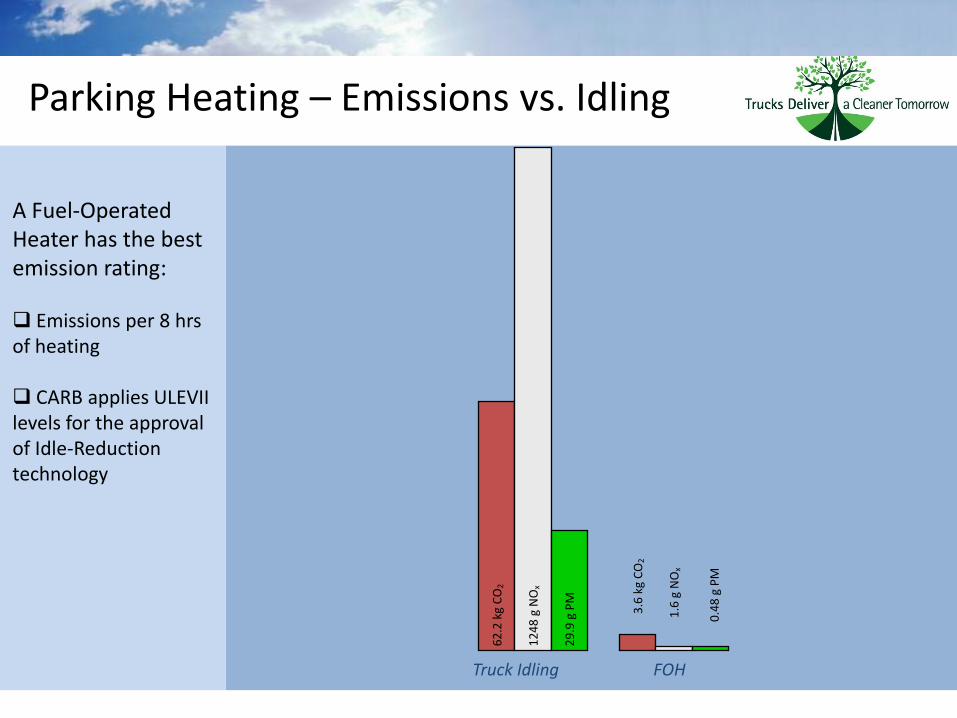
Parking Heating – Emissions vs. Idling
Truck Idling FOH
62
.2 k
g C
O2
12
48
g N
Ox
29
.9 g
PM
3.6
kg
CO
2
1.6
g N
Ox
0.4
8 g
PM
A Fuel-Operated Heater has the best emission rating:
Emissions per 8 hrs of heating
CARB applies ULEVII levels for the approval of Idle-Reduction technology
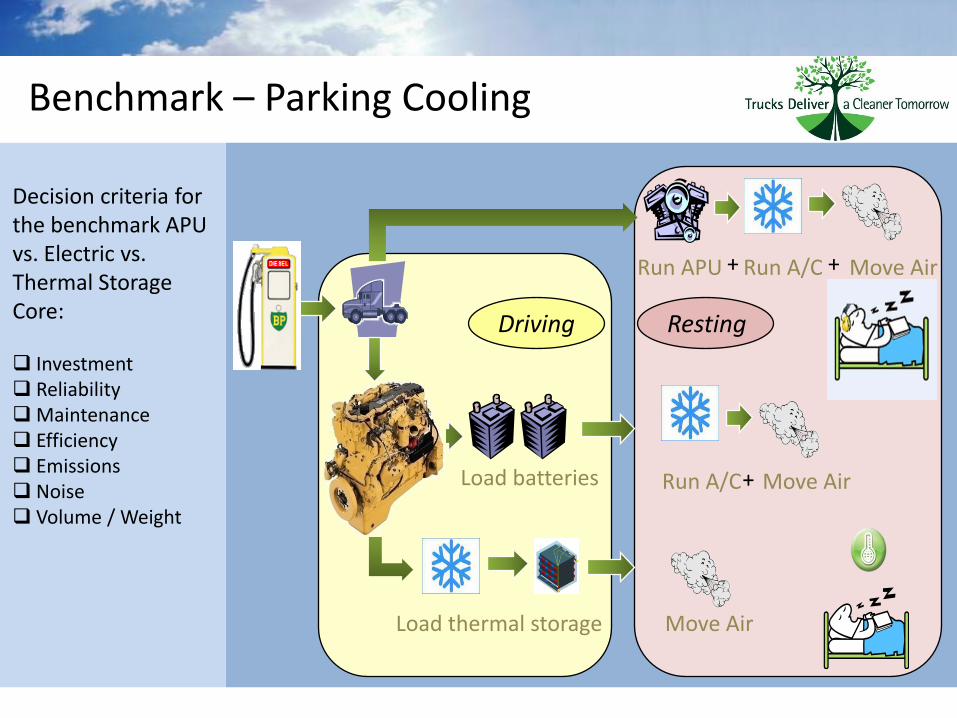
Benchmark – Parking Cooling
Load batteries
Load thermal storage
Run APU Run A/C Move Air
Run A/C Move Air
Move Air
+
+ +
Driving Resting
Decision criteria for the benchmark APU vs. Electric vs. Thermal Storage Core:
Investment ReliabilityMaintenance Efficiency Emissions Noise Volume / Weight
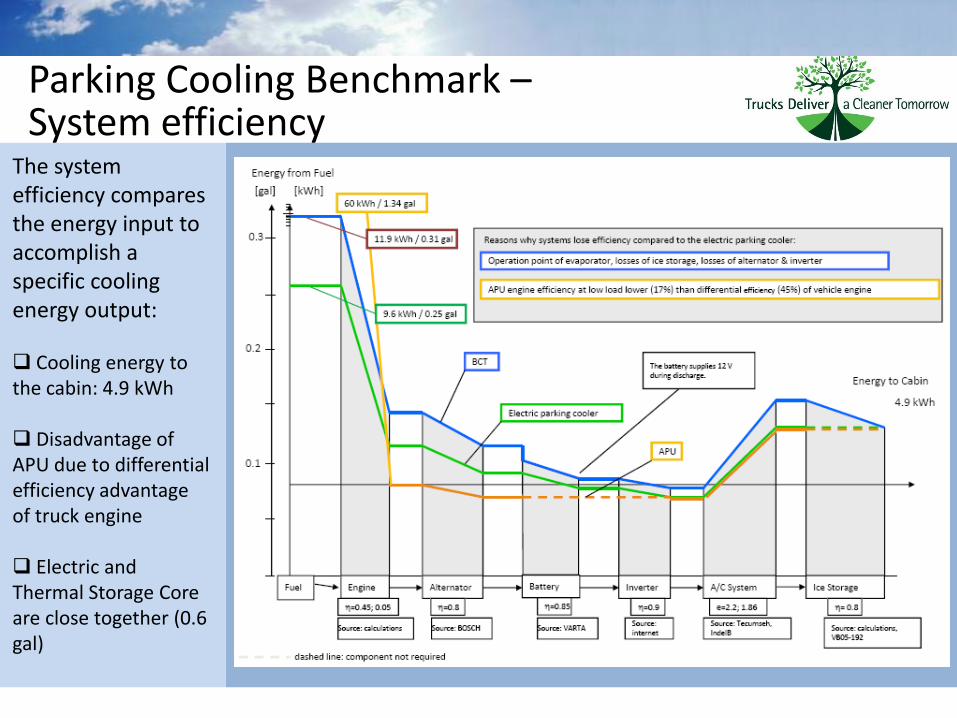
Parking Cooling Benchmark –System efficiency
The system efficiency compares the energy input to accomplish a specific cooling energy output:
Cooling energy to the cabin: 4.9 kWh
Disadvantage of APU due to differential efficiency advantage of truck engine
Electric and Thermal Storage Core are close together (0.6 gal)
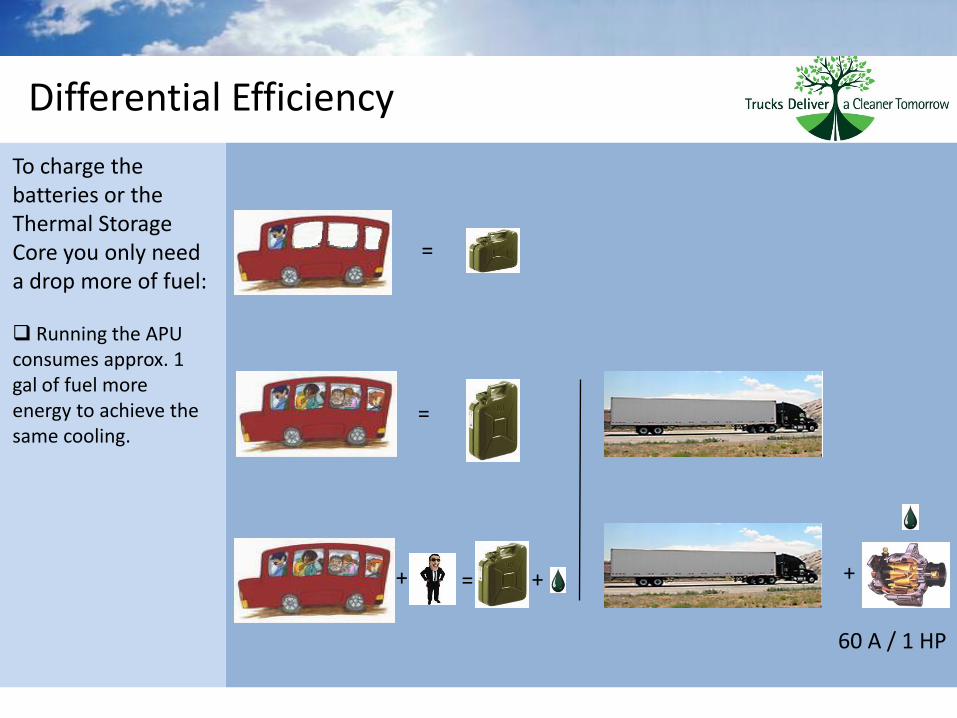
Differential Efficiency
=
=
+ = + +
60 A / 1 HP
To charge the batteries or the Thermal Storage Core you only need a drop more of fuel:
Running the APU consumes approx. 1 gal of fuel more energy to achieve the same cooling.
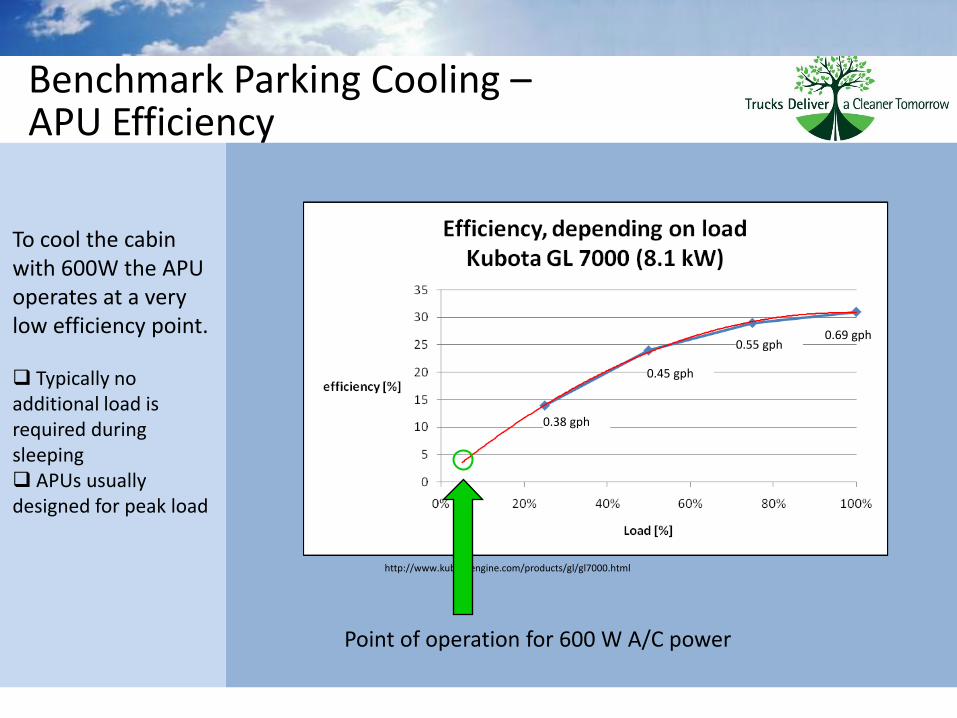
Benchmark Parking Cooling –APU Efficiency
0.69 gph0.55 gph
0.45 gph
0.38 gph
http://www.kubotaengine.com/products/gl/gl7000.html
Point of operation for 600 W A/C power
To cool the cabin with 600W the APU operates at a very low efficiency point.
Typically no additional load is required during sleeping APUs usually designed for peak load
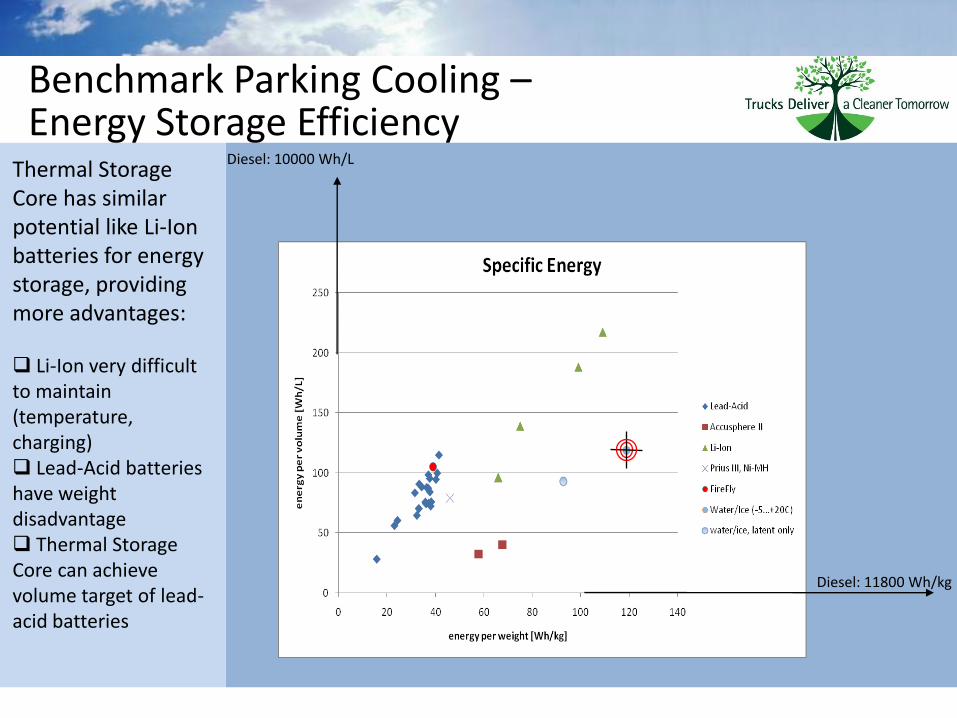
Benchmark Parking Cooling –Energy Storage Efficiency
Diesel: 11800 Wh/kg
Diesel: 10000 Wh/LThermal Storage Core has similar potential like Li-Ion batteries for energy storage, providing more advantages:
Li-Ion very difficult to maintain (temperature, charging) Lead-Acid batteries have weight disadvantage Thermal Storage Core can achieve volume target of lead-acid batteries
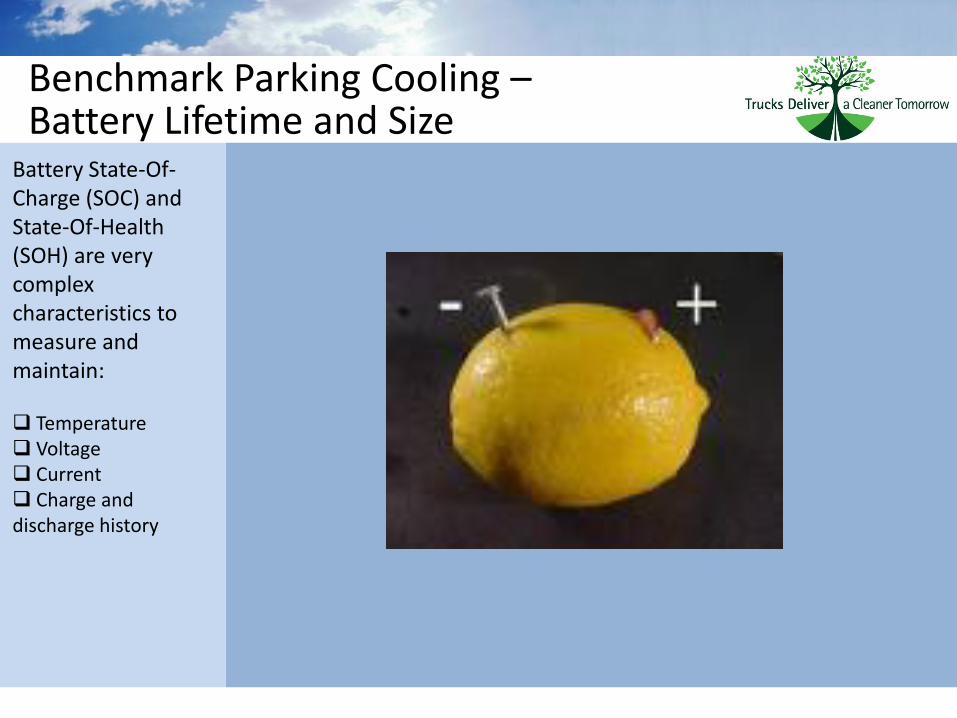
Benchmark Parking Cooling –Battery Lifetime and Size
Battery State-Of-Charge (SOC) and State-Of-Health (SOH) are very complex characteristics to measure and maintain:
Temperature Voltage Current Charge and discharge history
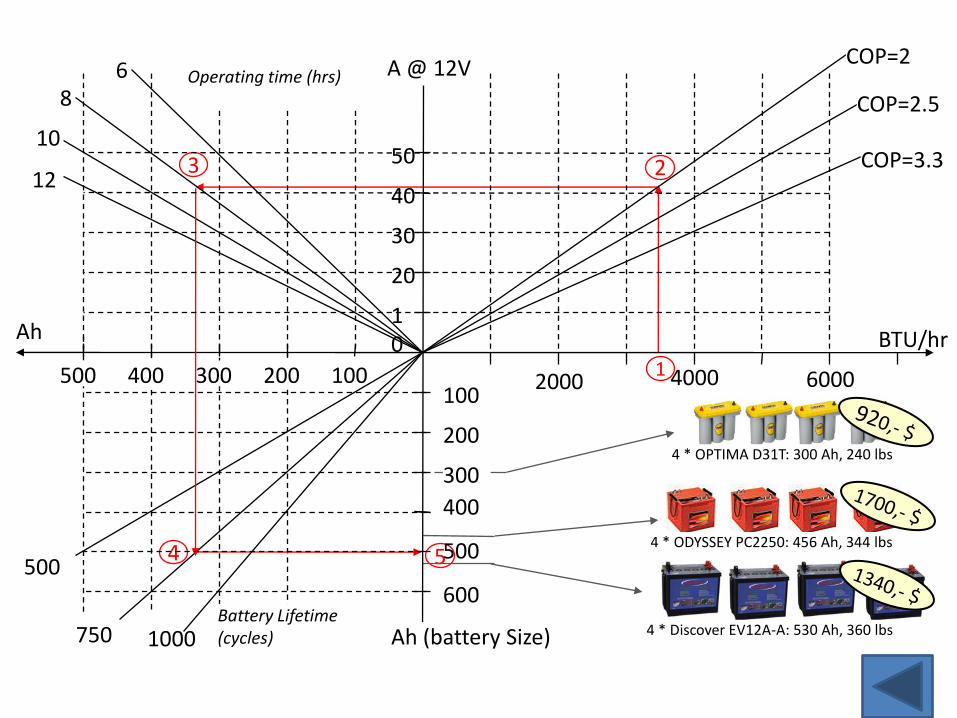
22
1
2
54 * ODYSSEY PC2250: 456 Ah, 344 lbs
4 * Discover EV12A-A: 530 Ah, 360 lbs
10
20
30
40
60002000 4000
BTU/hr
A @ 12V
50
Ah
100200
10
86
12
Operating time (hrs)COP=2
COP=2.5
COP=3.3
100
200
400
500
600500
Battery Lifetime (cycles) Ah (battery Size)
300400500
750
3
4
4 * OPTIMA D31T: 300 Ah, 240 lbs
300
1000
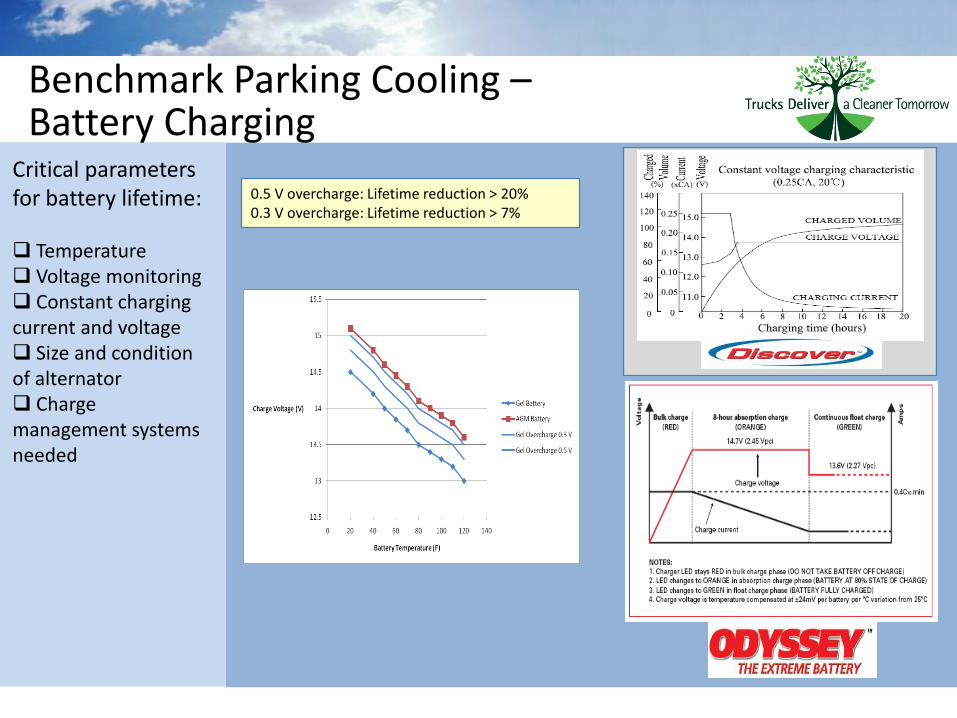
Benchmark Parking Cooling –Battery Charging
0.5 V overcharge: Lifetime reduction > 20% 0.3 V overcharge: Lifetime reduction > 7%
Critical parameters for battery lifetime:
Temperature Voltage monitoring Constant charging current and voltage Size and condition of alternator Charge management systems needed
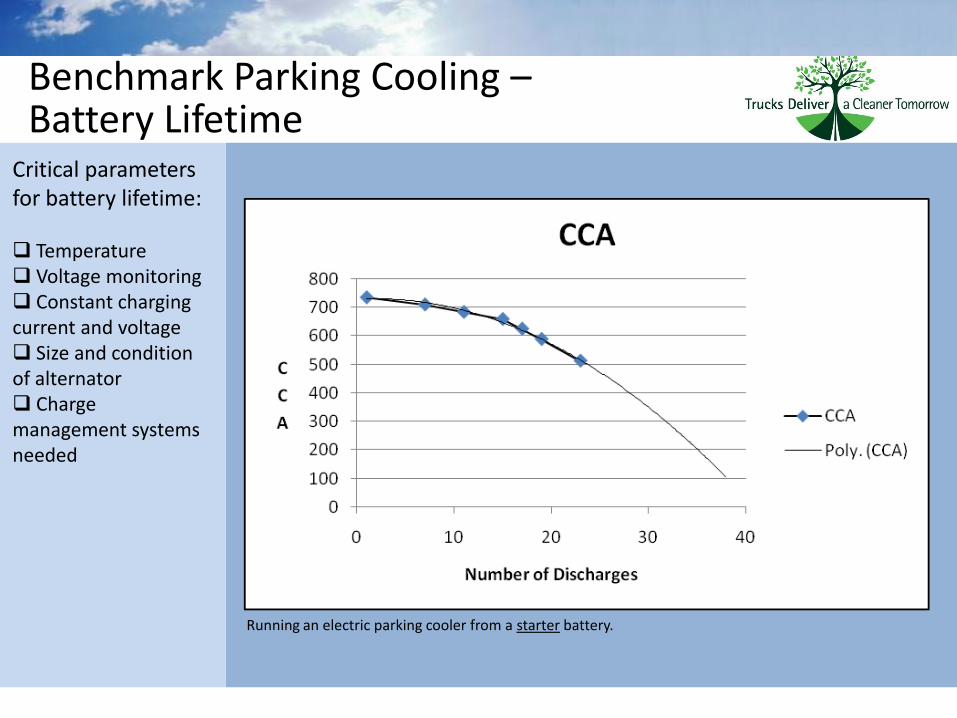
Benchmark Parking Cooling –Battery Lifetime
Running an electric parking cooler from a starter battery.
Critical parameters for battery lifetime:
Temperature Voltage monitoring Constant charging current and voltage Size and condition of alternator Charge management systems needed
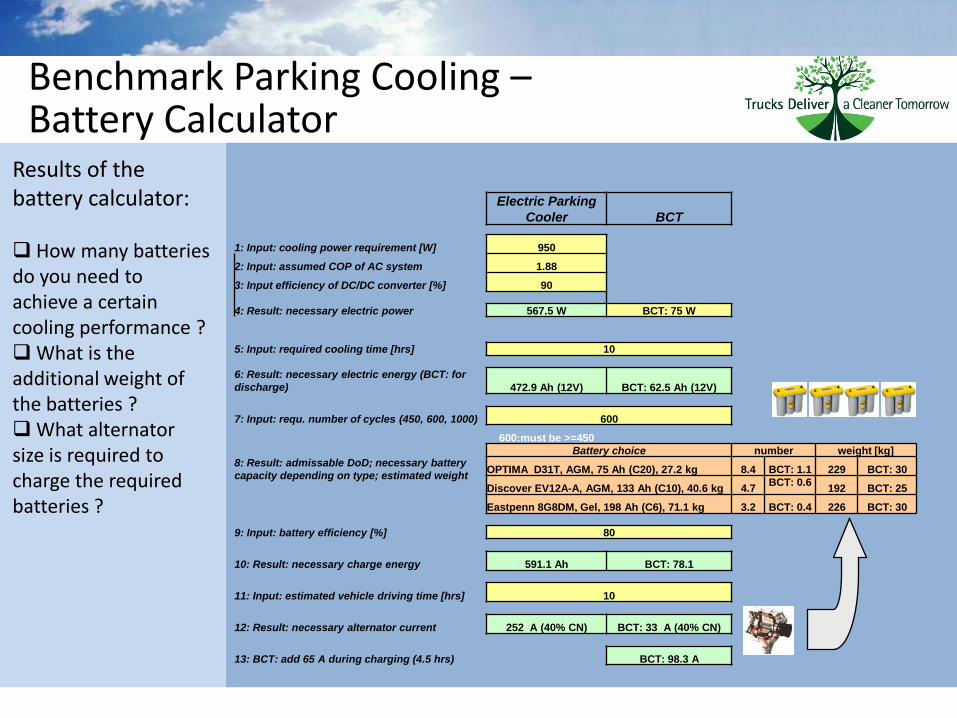
Benchmark Parking Cooling –Battery Calculator
Electric Parking
Cooler BCT
1: Input: cooling power requirement [W] 950
2: Input: assumed COP of AC system 1.88
3: Input efficiency of DC/DC converter [%] 90
4: Result: necessary electric power 567.5 W BCT: 75 W
5: Input: required cooling time [hrs] 10
6: Result: necessary electric energy (BCT: for
discharge) 472.9 Ah (12V) BCT: 62.5 Ah (12V)
7: Input: requ. number of cycles (450, 600, 1000) 600
600:must be >=450
8: Result: admissable DoD; necessary battery
capacity depending on type; estimated weight
Battery choice number weight [kg]
OPTIMA D31T, AGM, 75 Ah (C20), 27.2 kg 8.4 BCT: 1.1 229 BCT: 30
Discover EV12A-A, AGM, 133 Ah (C10), 40.6 kg 4.7BCT: 0.6
192 BCT: 25
Eastpenn 8G8DM, Gel, 198 Ah (C6), 71.1 kg 3.2 BCT: 0.4 226 BCT: 30
9: Input: battery efficiency [%] 80
10: Result: necessary charge energy 591.1 Ah BCT: 78.1
11: Input: estimated vehicle driving time [hrs] 10
12: Result: necessary alternator current 252 A (40% CN) BCT: 33 A (40% CN)
13: BCT: add 65 A during charging (4.5 hrs) BCT: 98.3 A
Results of the battery calculator:
How many batteries do you need to achieve a certain cooling performance ?What is the additional weight of the batteries ?What alternator size is required to charge the required batteries ?
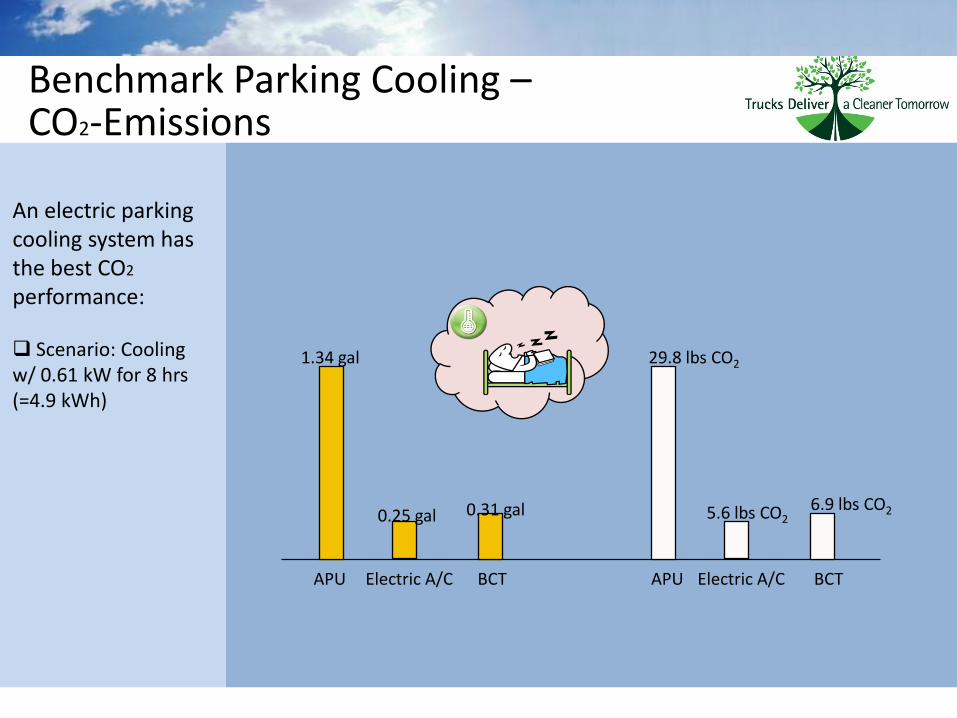
Benchmark Parking Cooling –CO2-Emissions
1.34 gal
0.25 gal
APU Electric A/C APU Electric A/C
0.31 gal
BCTBCT
29.8 lbs CO2
6.9 lbs CO25.6 lbs CO2
An electric parking cooling system has the best CO2
performance:
Scenario: Cooling w/ 0.61 kW for 8 hrs (=4.9 kWh)
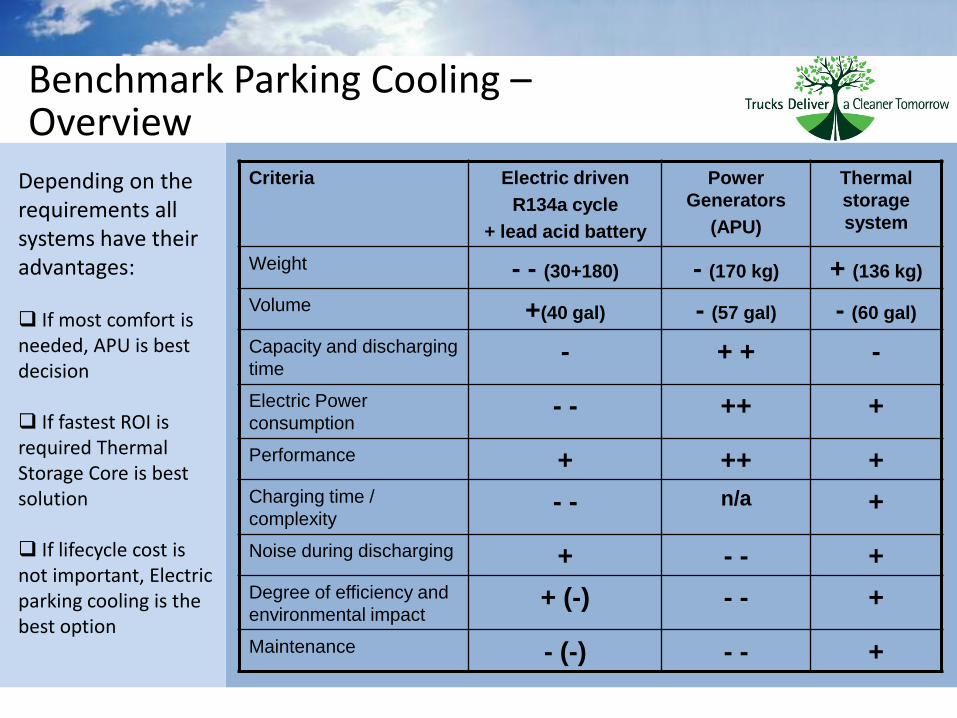
Benchmark Parking Cooling –Overview
Criteria Electric driven
R134a cycle
+ lead acid battery
Power
Generators
(APU)
Thermal
storage
system
Weight - - (30+180) - (170 kg) + (136 kg)
Volume +(40 gal) - (57 gal) - (60 gal)
Capacity and discharging
time- + + -
Electric Power
consumption- - ++ +
Performance + ++ +
Charging time /
complexity- - n/a +
Noise during discharging + - - +
Degree of efficiency and
environmental impact+ (-) - - +
Maintenance - (-) - - +
Depending on the requirements all systems have their advantages:
If most comfort is needed, APU is best decision
If fastest ROI is required Thermal Storage Core is best solution
If lifecycle cost is not important, Electric parking cooling is the best option

Agenda
1. The Market Requirements
2. The Product Portfolio Today
3. The Future View
4. Q&A
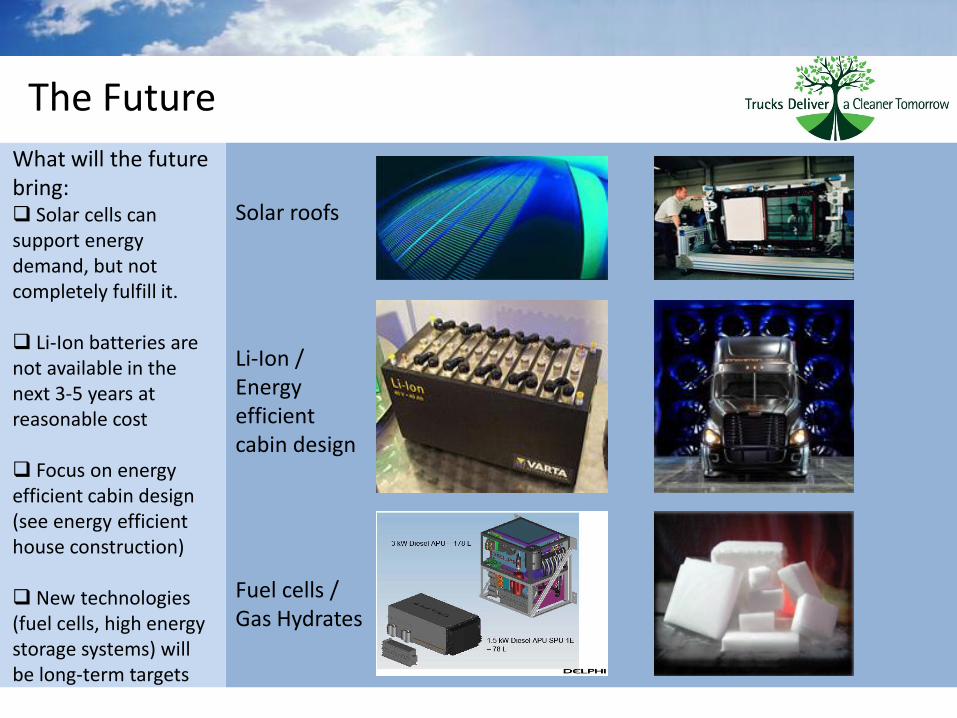
The Future
What will the future bring: Solar cells can support energy demand, but not completely fulfill it.
Li-Ion batteries are not available in the next 3-5 years at reasonable cost
Focus on energy efficient cabin design (see energy efficient house construction)
New technologies (fuel cells, high energy storage systems) will be long-term targets
Solar roofs
Li-Ion / Energy efficient cabin design
Fuel cells / Gas Hydrates
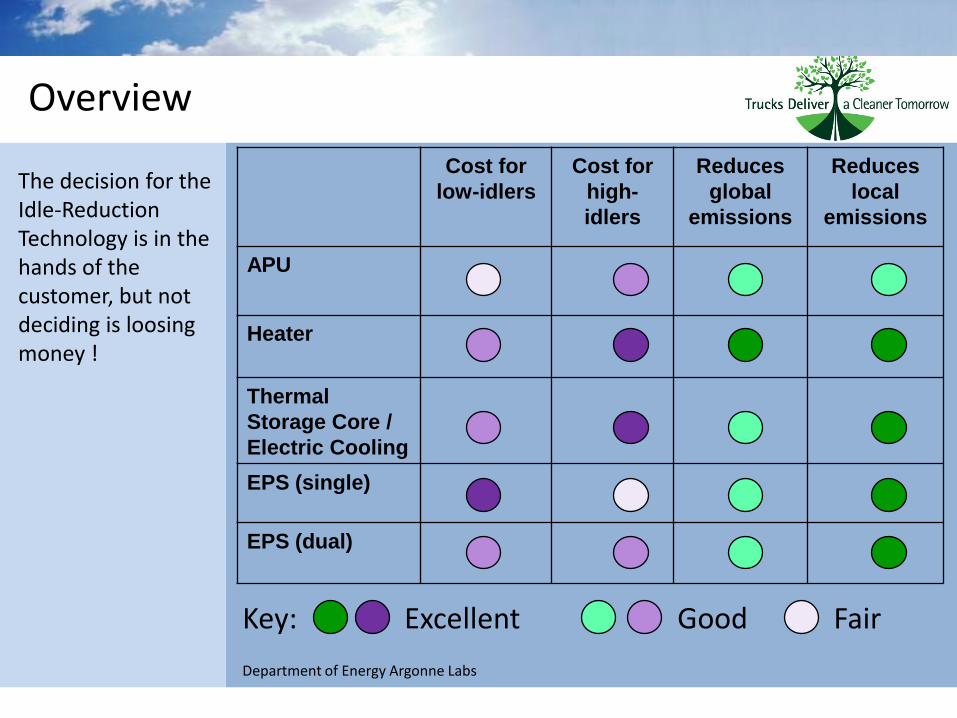
Overview
Cost for
low-idlers
Cost for
high-
idlers
Reduces
global
emissions
Reduces
local
emissions
APU
Heater
Thermal
Storage Core /
Electric Cooling
EPS (single)
EPS (dual)
Key: Excellent Good Fair
Department of Energy Argonne Labs
The decision for the Idle-Reduction Technology is in the hands of the customer, but not deciding is loosing money !
The Idle-Reduction Fleet Checklist
With emission reduction to
improved fuel efficiency
Cost effective way to contribute to corporate sustainability and manage emissions from mobile sources (Carbon Credits)
Fast ROILow acquisition and lifecycle / operating costTruck Blue Book residual values after 4 years: e.g. $100 on FOHGlobal OE approved technology and OE experienced engineering
and technical support (tailored solutions for specific fleet requirements)
SmartWay (EPA) and CARB approved technology
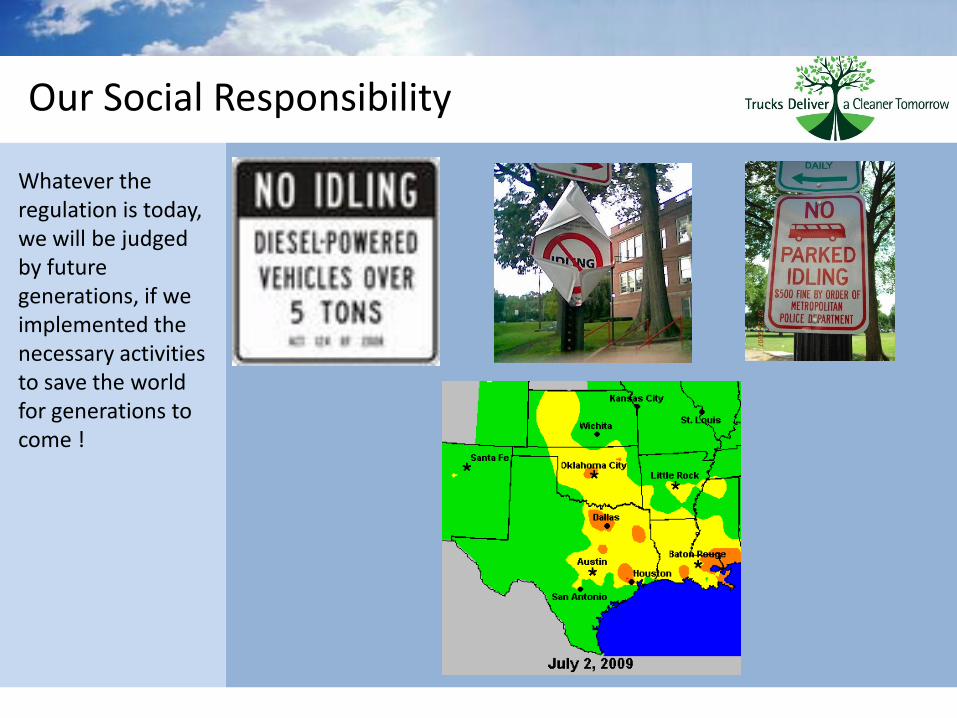
Our Social Responsibility
Whatever the regulation is today, we will be judged by future generations, if we implemented the necessary activities to save the world for generations to come !

www.makealeap.org
Robert HupferDirector R&D
Webasto Product North America Inc.
Phone: 810-593 6280Mobile: 810-441 6004
Thank You !

Robert HupferDirector R&D
Webasto Product North America Inc.
Phone: 810-593 6280Mobile: 810-441 6004
Backup Slides
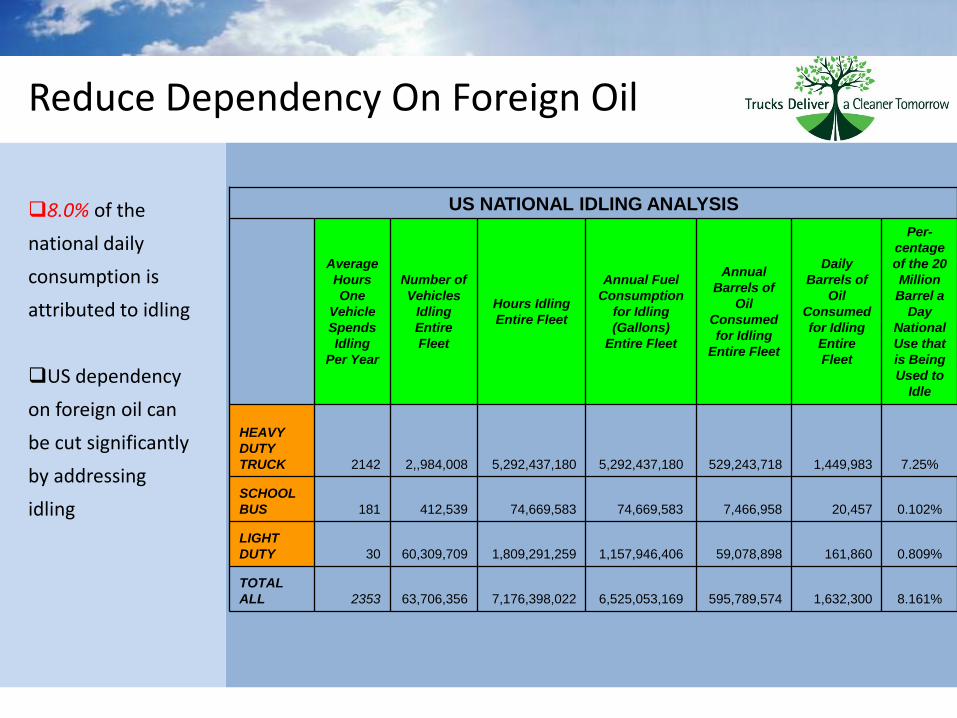
Reduce Dependency On Foreign Oil
US NATIONAL IDLING ANALYSIS
Average
Hours
One
Vehicle
Spends
Idling
Per Year
Number of
Vehicles
Idling
Entire
Fleet
Hours Idling
Entire Fleet
Annual Fuel
Consumption
for Idling
(Gallons)
Entire Fleet
Annual
Barrels of
Oil
Consumed
for Idling
Entire Fleet
Daily
Barrels of
Oil
Consumed
for Idling
Entire
Fleet
Per-
centage
of the 20
Million
Barrel a
Day
National
Use that
is Being
Used to
Idle
HEAVY
DUTY
TRUCK 2142 2,,984,008 5,292,437,180 5,292,437,180 529,243,718 1,449,983 7.25%
SCHOOL
BUS 181 412,539 74,669,583 74,669,583 7,466,958 20,457 0.102%
LIGHT
DUTY 30 60,309,709 1,809,291,259 1,157,946,406 59,078,898 161,860 0.809%
TOTAL
ALL 2353 63,706,356 7,176,398,022 6,525,053,169 595,789,574 1,632,300 8.161%
8.0% of the
national daily
consumption is
attributed to idling
US dependency
on foreign oil can
be cut significantly
by addressing
idling