Embed Size (px)
Citation preview
GE Confidential
1@#GECON&*
IEA Gas and Oil Technologies Collaboration Initiative, GOTCIExperiences after 2 years
Jostein Dahl Karlsen, styreformann GOT/OED
GE Confidential
2@#GECON&*
IEA Gas and Oil Technologies Initiative, GOT
Points
1) GOT background
2) Membership & Focus
3) Activities
GE Confidential
3@#GECON&*
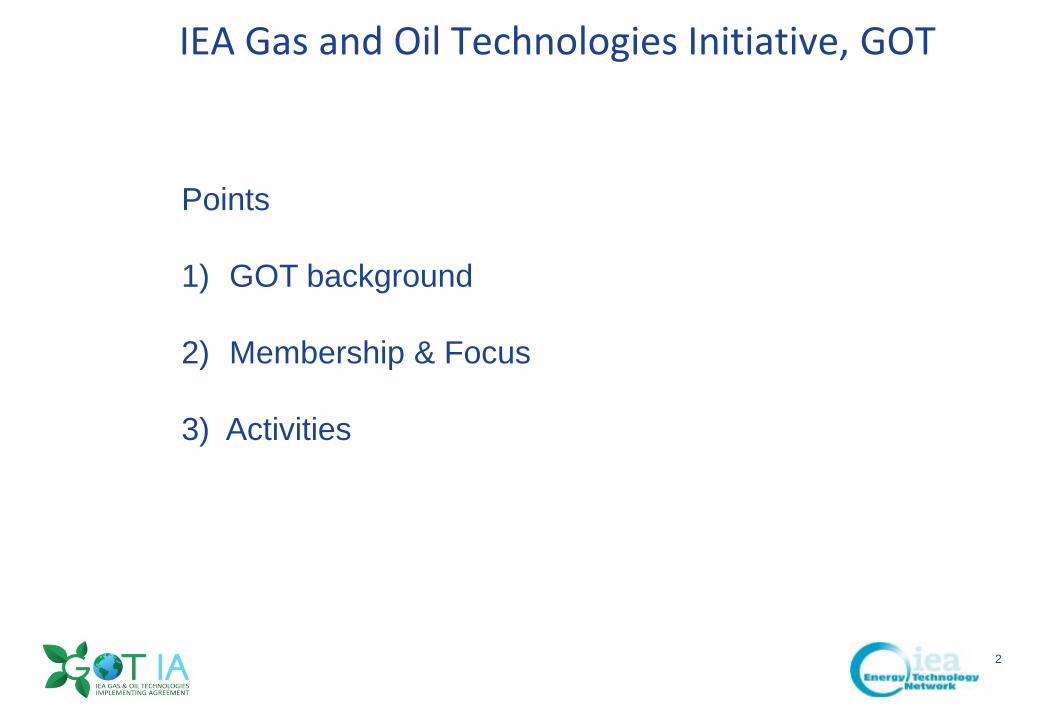
IEA Olje- og gassteknologi:
• 2013: IEA GOT
GE Confidential
4@#GECON&*
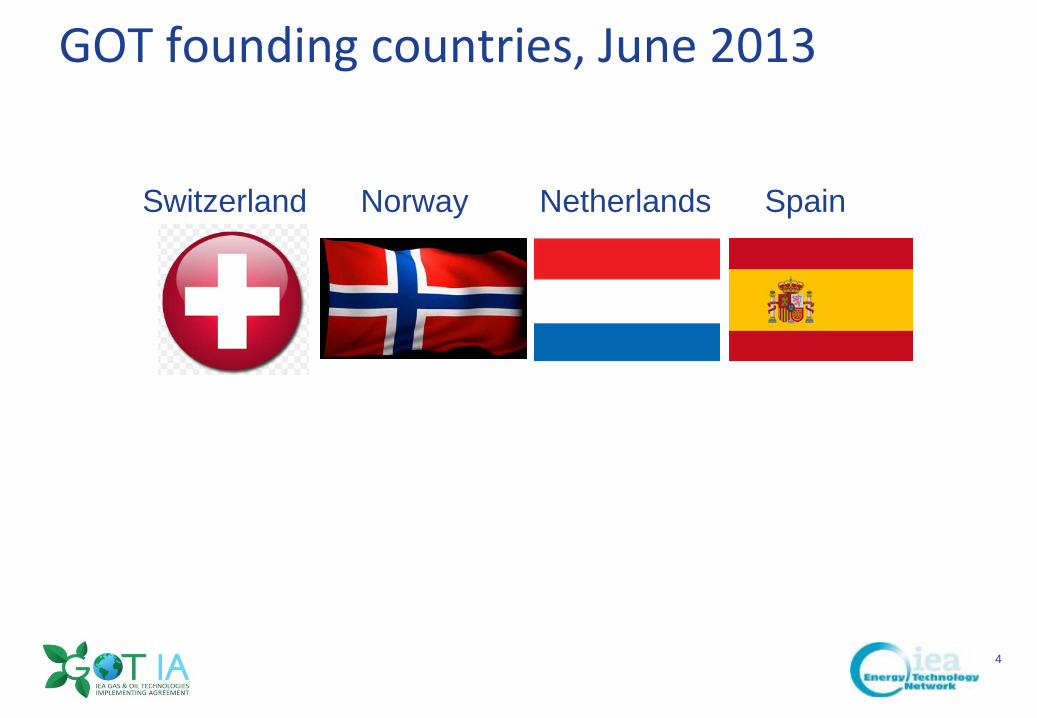
GOT founding countries, June 2013
Switzerland Norway Netherlands Spain
GE Confidential
5@#GECON&*
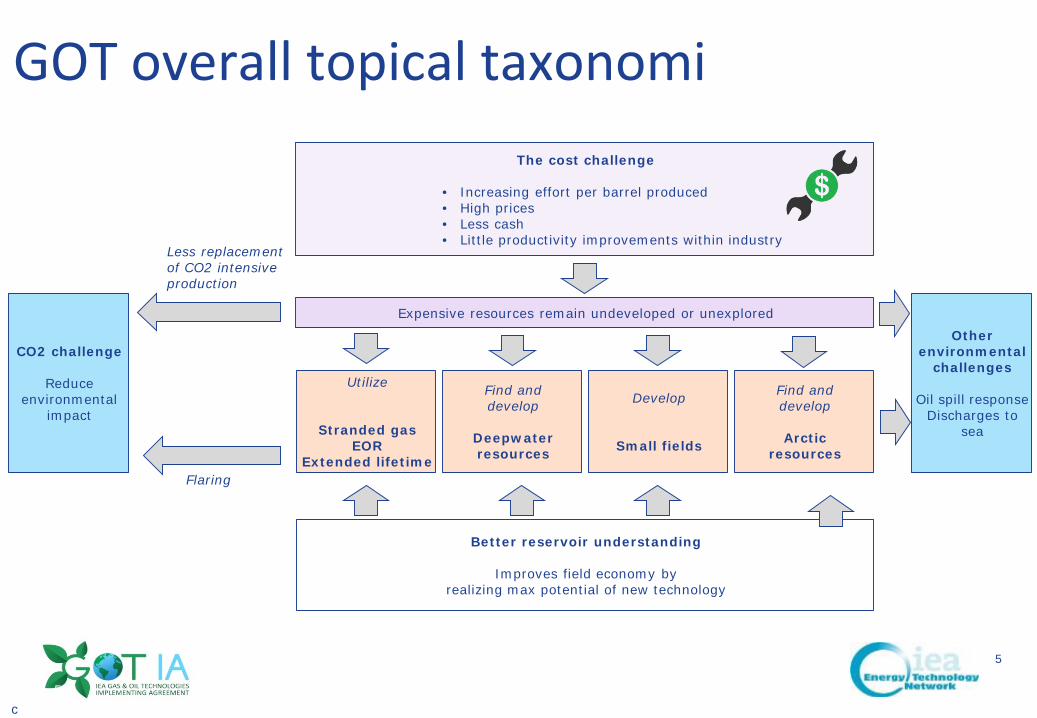
GOT overall topical taxonomi
c
The cost challenge
• Increasing effort per barrel produced• High prices• Less cash• Little productivity improvements within industry
Expensive resources remain undeveloped or unexplored
Find and develop
Deepwaterresources
Develop
Small fields
Utilize
Stranded gasEOR
Extended lifetime
Find and develop
Arcticresources
Better reservoir understanding
Improves field economy byrealizing max potential of new technology
Less replacement of CO2 intensive production
Flaring
CO2 challenge
Reduce environmental
impact
Other environmental
challenges
Oil spill responseDischarges to
sea
5
GE Confidential
6@#GECON&*
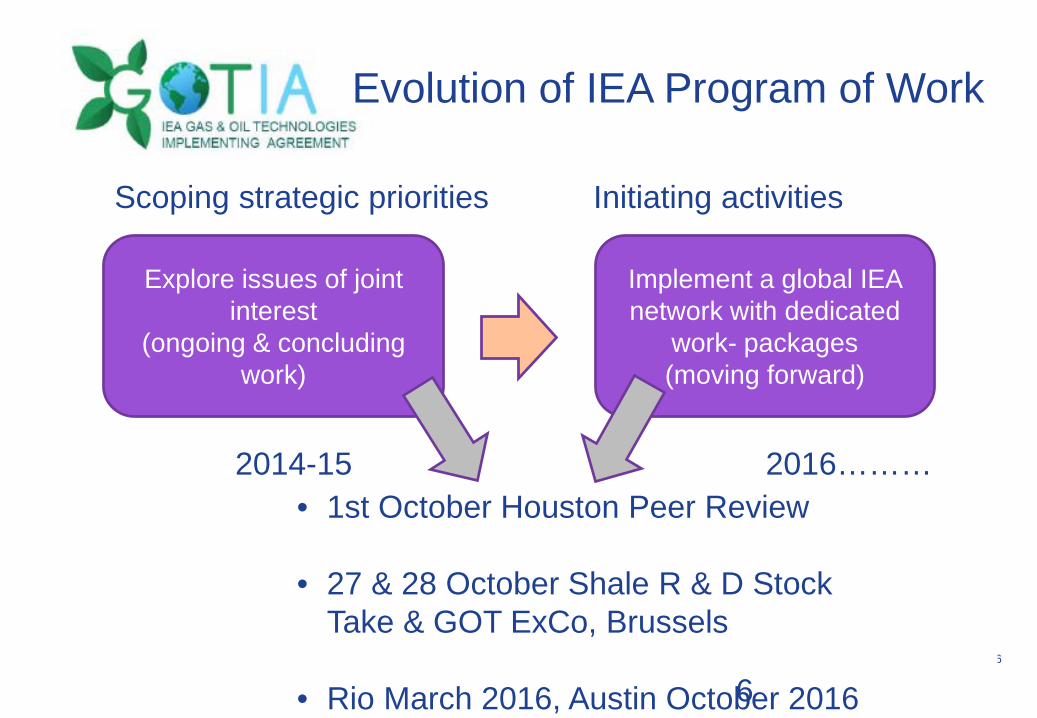
Explore issues of joint interest
(ongoing & concludingwork)
Implement a global IEA network with dedicated
work- packages(moving forward)
Scoping strategic priorities Initiating activities
Evolution of IEA Program of Work
2014-15 2016………• 1st October Houston Peer Review
• 27 & 28 October Shale R & D Stock Take & GOT ExCo, Brussels
• Rio March 2016, Austin October 20166
GE Confidential
7@#GECON&*
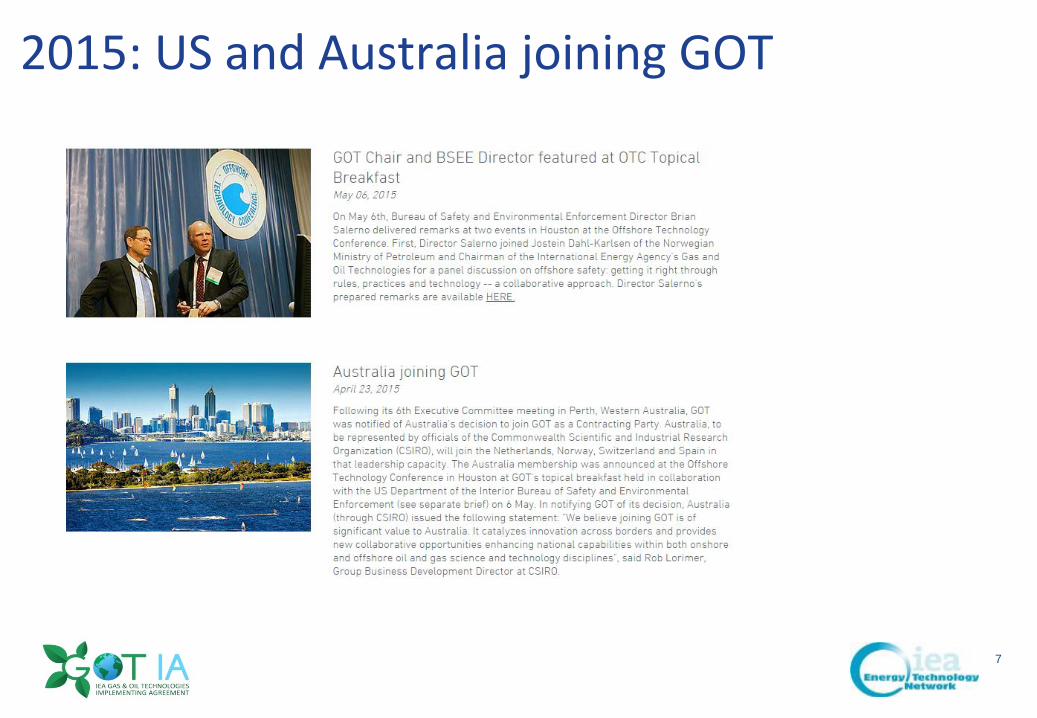
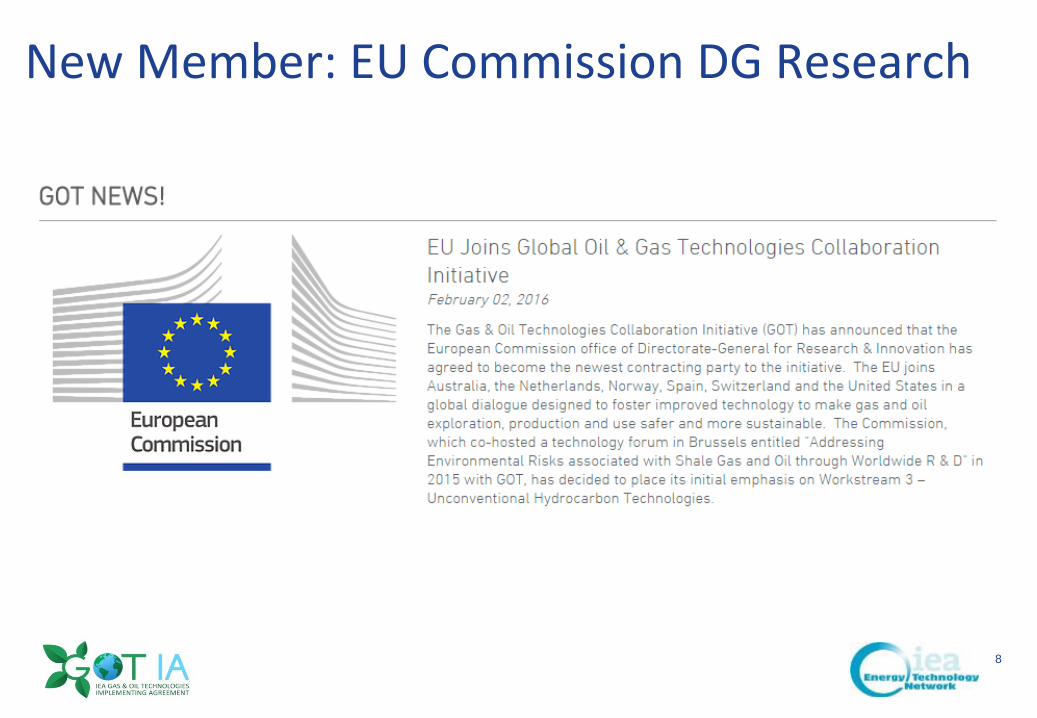
2015: US and Australia joining GOT
GE Confidential
8@#GECON&*
New Member: EU Commission DG Research
GE Confidential
9@#GECON&*
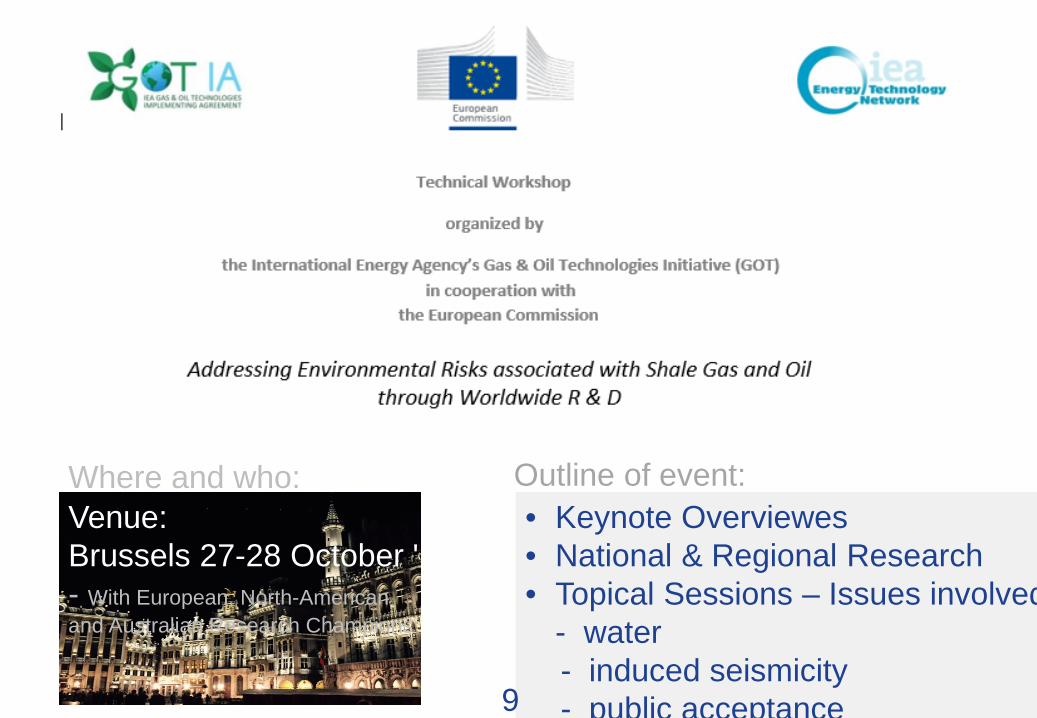
• Keynote Overviewes• National & Regional Research• Topical Sessions – Issues involved
- water- induced seismicity- public acceptance
Outline of event:Venue:Brussels 27-28 October '15- With European, North-American and Australian Research Champions
Where and who:
9
GE Confidential
10@#GECON&*
Overall observations:
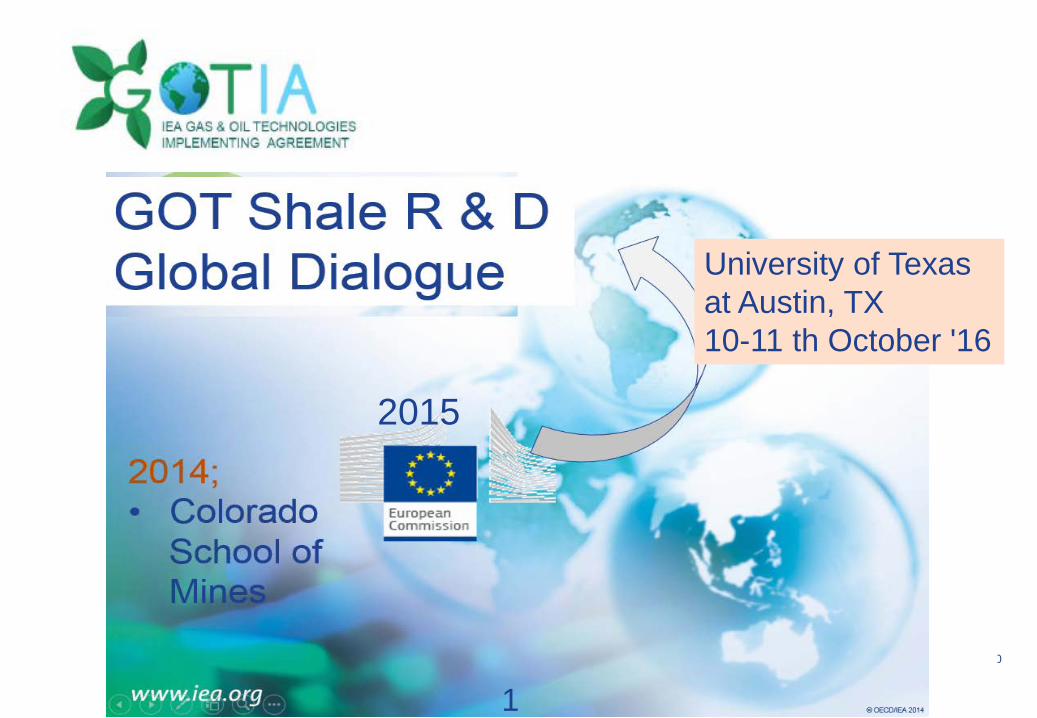
2015
University of Texasat Austin, TX10-11 th October '16
1
GE Confidential
11@#GECON&*
11
GE Confidential
12@#GECON&*
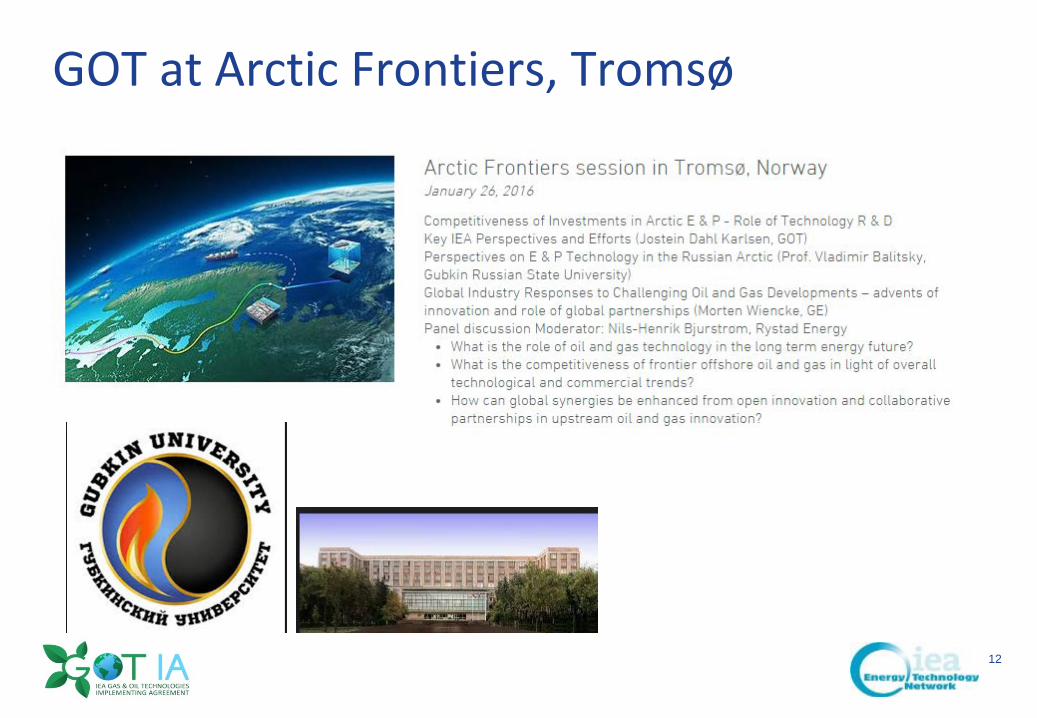
GOT at Arctic Frontiers, Tromsø

GE Confidential
13@#GECON&*
GOT Executive Committee
Next meeting:London, 14 June 2016
1
GE Confidential
14@#GECON&*
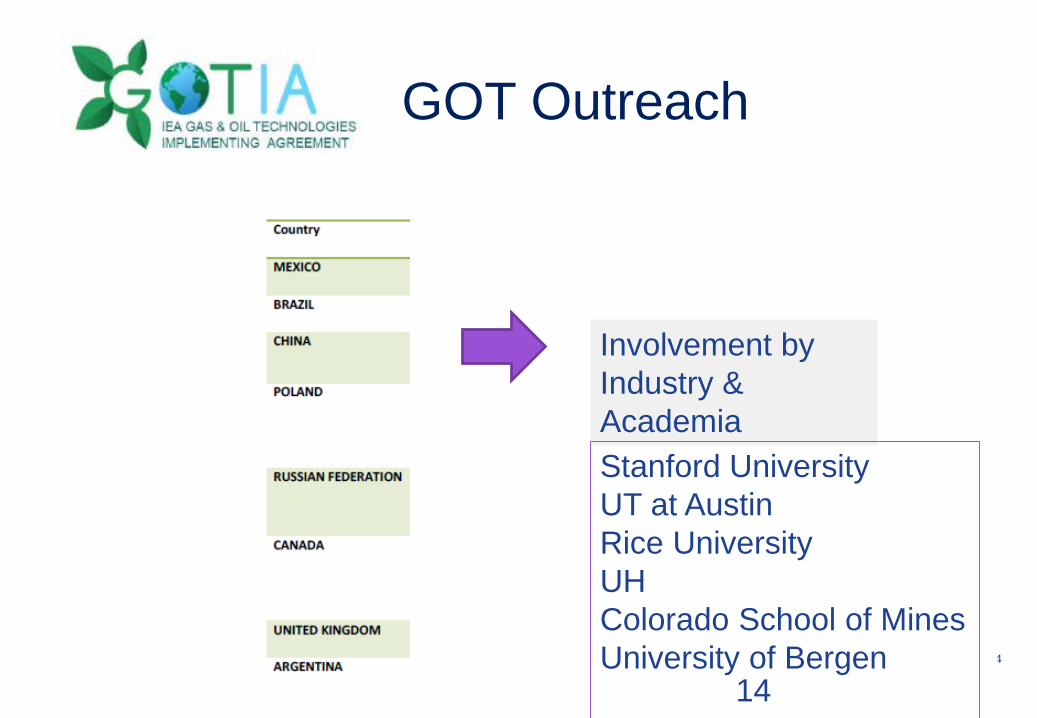
Involvement by Industry & Academia
GOT Outreach
Stanford UniversityUT at AustinRice UniversityUHColorado School of MinesUniversity of Bergen
14
GE Confidential
15@#GECON&*
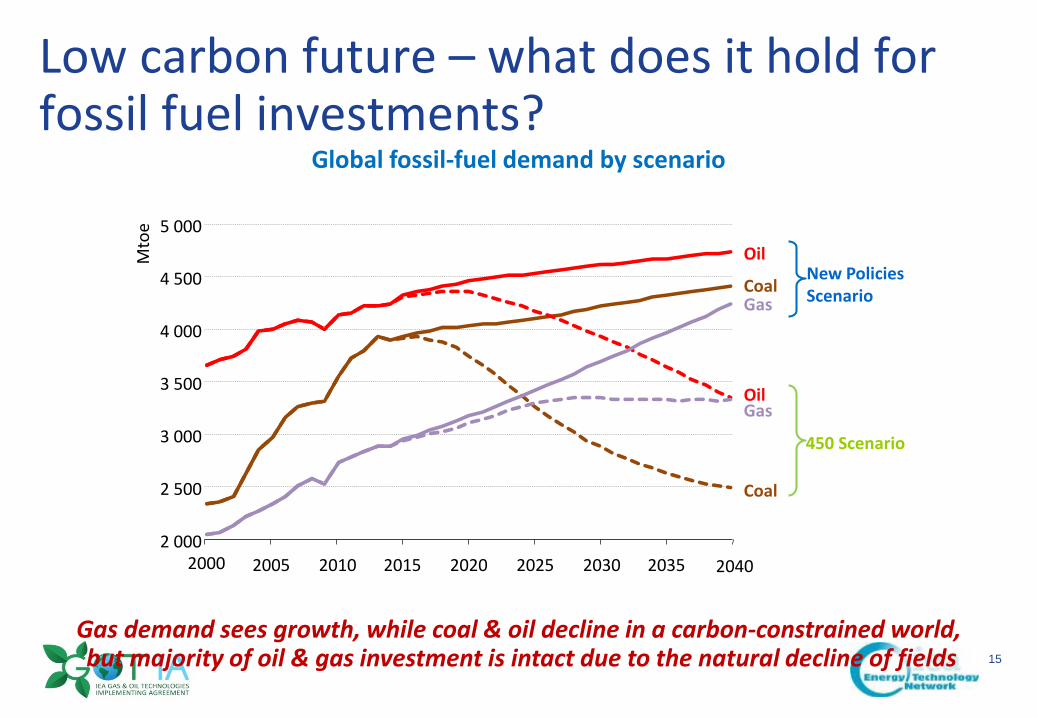
Low carbon future – what does it hold for fossil fuel investments?
Global fossil-fuel demand by scenario
Gas demand sees growth, while coal & oil decline in a carbon-constrained world,but majority of oil & gas investment is intact due to the natural decline of fields
2 000
2 500
3 000
3 500
4 000
4 500
5 000
2000 2005 2010 2015 2020 2025 2030 2035 2040
Mto
e
Oil
CoalGas
New PoliciesScenario
Oil
Coal
Gas
450 Scenario
GE Confidential
16@#GECON&*
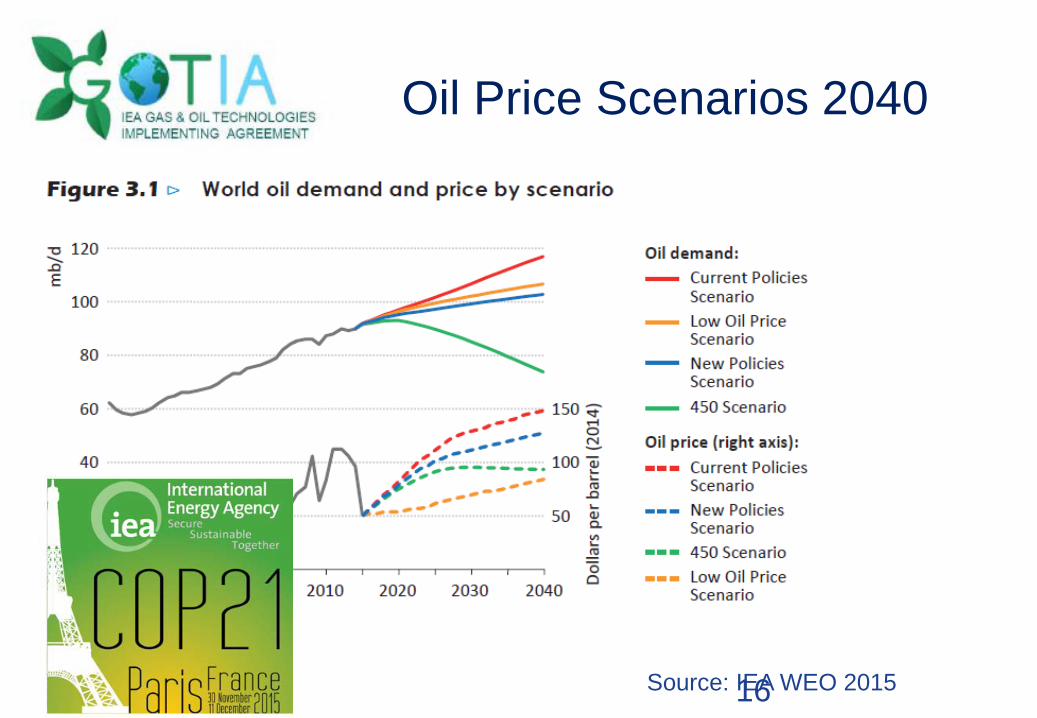
Oil Price Scenarios 2040
Source: IEA WEO 201516

GE Confidential
17@#GECON&*
Lower oil prices affect the competitiveness of fuels
Change in global primary energy demand by fuel in the Low Oil Price Scenario relative to the New Policies Scenario
As well as increases in oil, natural gas benefits (for a while), particularly in regions where import prices are indexed to oil: with coal pushed out in the power sector
-400
-300
-200
-100
0
100
200
300
2015 2020 2025 2030 2035 2040
Mto
e OilGasCoalRenewable
Source: IEA WEO 2015
GE Confidential
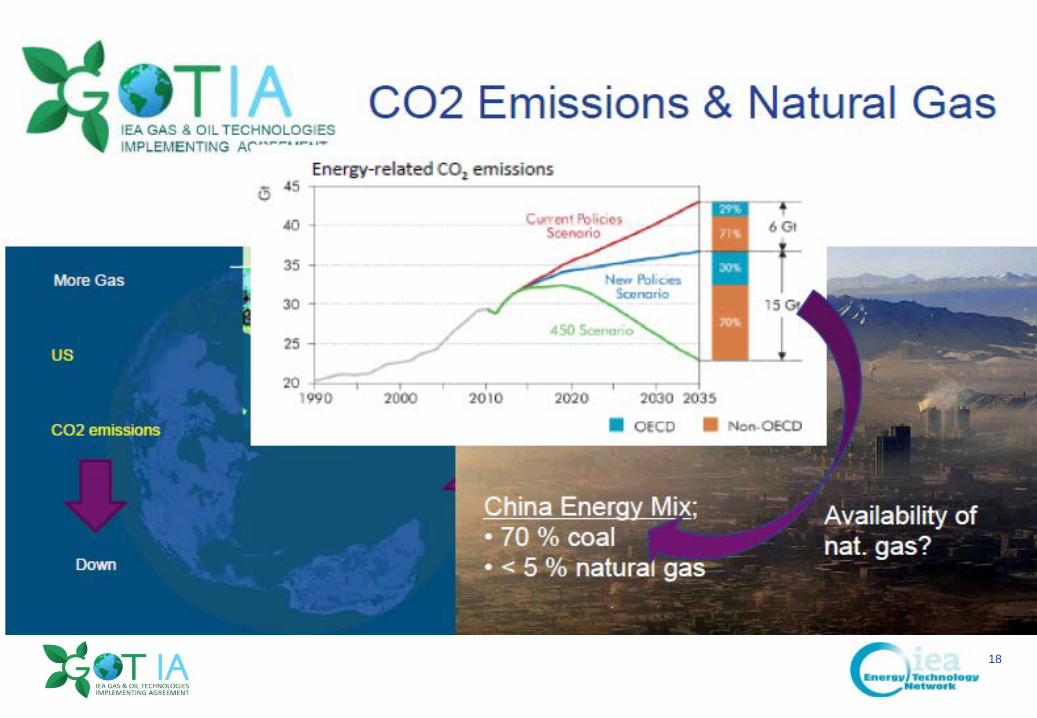
18@#GECON&*

GE Confidential
19@#GECON&*
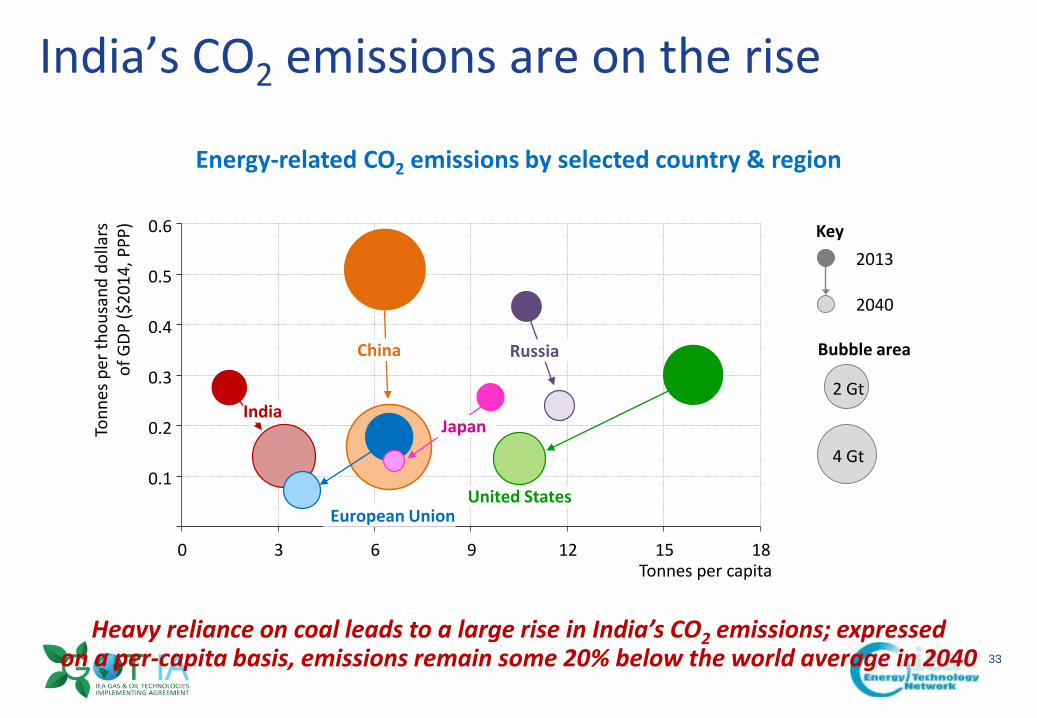
India’s CO2 emissions are on the rise
Energy-related CO2 emissions by selected country & region
Heavy reliance on coal leads to a large rise in India’s CO2 emissions; expressedon a per-capita basis, emissions remain some 20% below the world average in 2040
0.1
0.2
0.3
0.4
0.5
0.6
0 3 6 9 12 15 18Tonnes per capita
Tonn
espe
r tho
usan
d do
llars
of
GDP
($20
14, P
PP)
Bubble area
2 Gt
4 Gt
Russia
European Union
China
IndiaJapan
United States
Key2013
2040
GE Confidential
20@#GECON&*
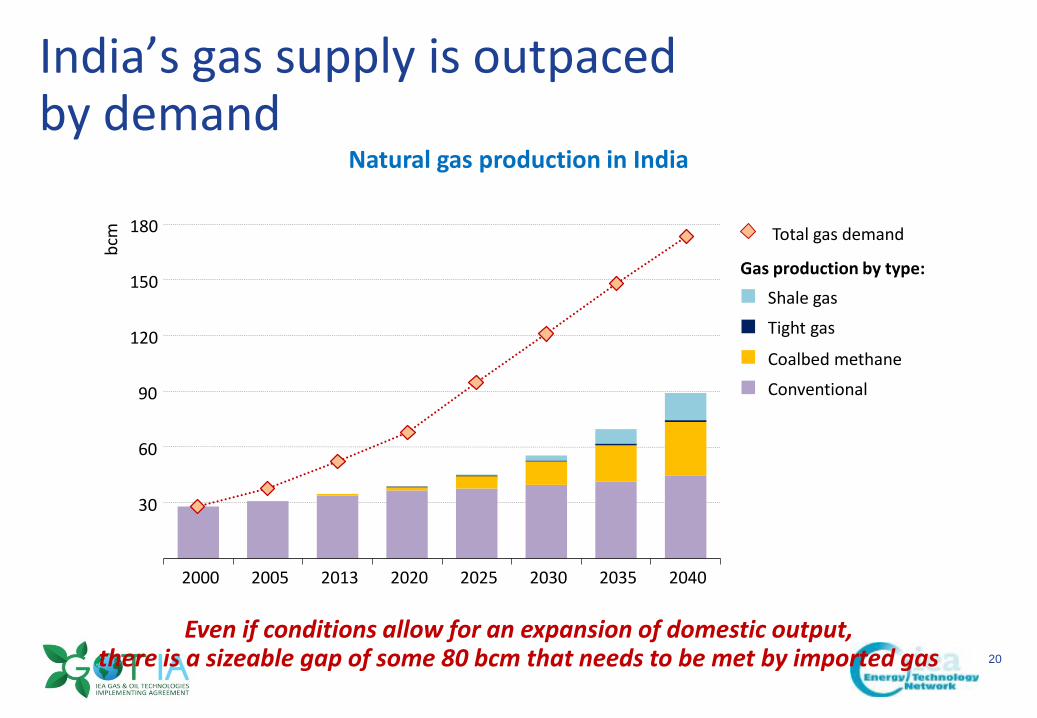
India’s gas supply is outpacedby demand
Natural gas production in India
Even if conditions allow for an expansion of domestic output,there is a sizeable gap of some 80 bcm that needs to be met by imported gas
30
60
90
120
150
180
2000 2005 2013 2020 2025 2030 2035 2040
bcm
Shale gas
Tight gas
Coalbed methane
Conventional
Gas production by type:
Total gas demand
GE Confidential
21@#GECON&*
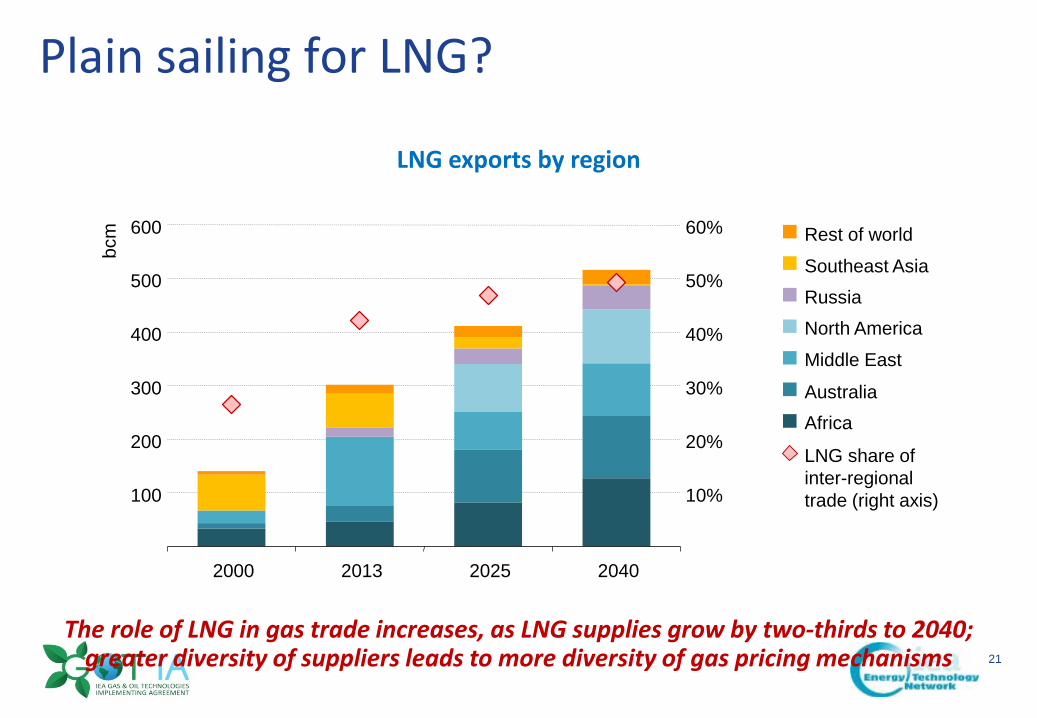
Plain sailing for LNG?
LNG exports by region
The role of LNG in gas trade increases, as LNG supplies grow by two-thirds to 2040;greater diversity of suppliers leads to more diversity of gas pricing mechanisms
100
200
300
400
500
600
2000 2013 2025 2040
bcm
10%
20%
30%
40%
50%
60% Rest of worldSoutheast AsiaRussiaNorth AmericaMiddle East
AustraliaAfrica
LNG share ofinter-regionaltrade (right axis)
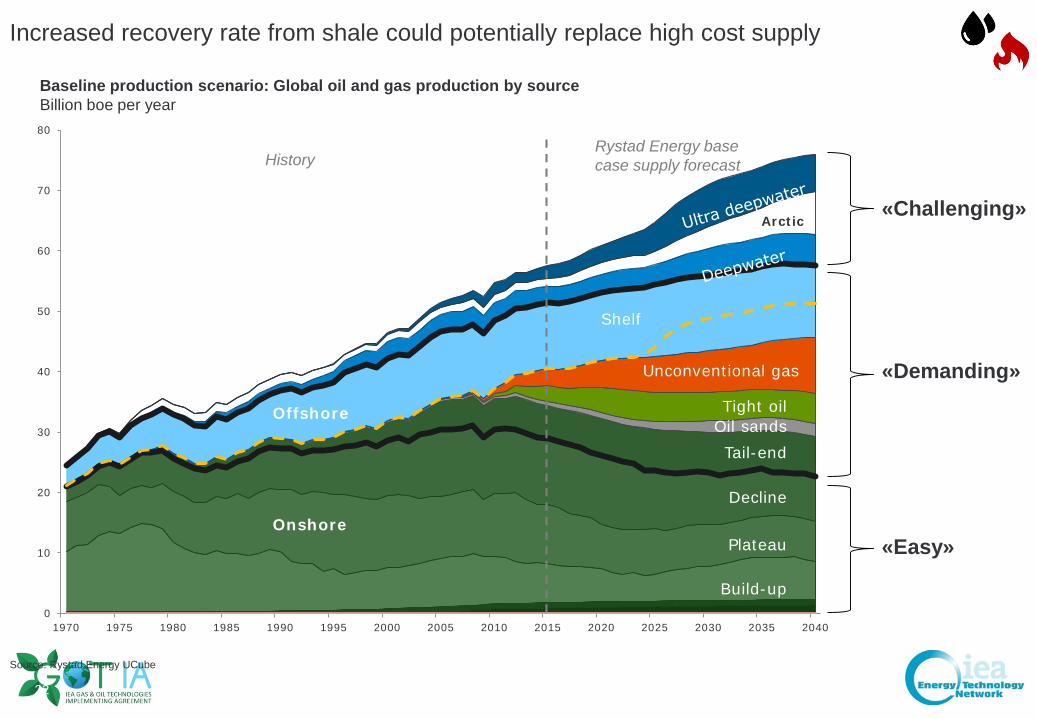
Increased recovery rate from shale could potentially replace high cost supply
Source: Rystad Energy UCube
0
10
20
30
40
50
60
70
80
1970 1975 1980 1985 1990 1995 2000 2005 2010 2015 2020 2025 2030 2035 2040
Onshore
Build-up
Plateau
Decline
Tail-endOil sandsTight oil
Unconventional gas
Shelf
Offshore
Arctic
Baseline production scenario: Global oil and gas production by source Billion boe per year
HistoryRystad Energy base case supply forecast
«Easy»
«Demanding»
«Challenging»
22
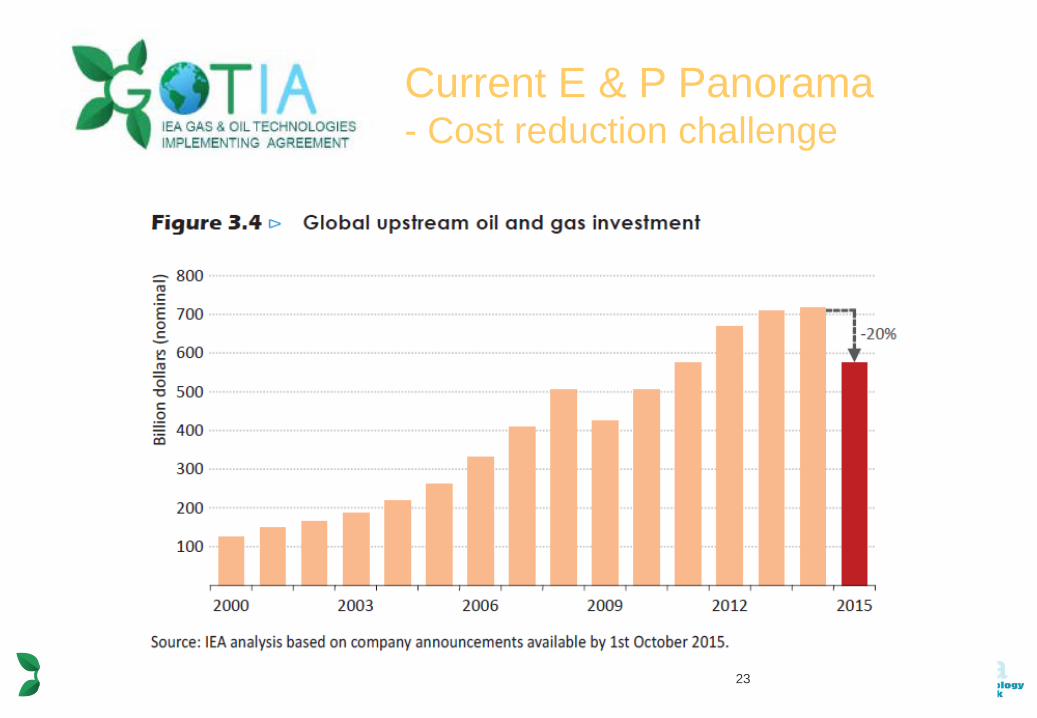
Current E & P Panorama- Cost reduction challenge
23
GE Confidential
24@#GECON&*
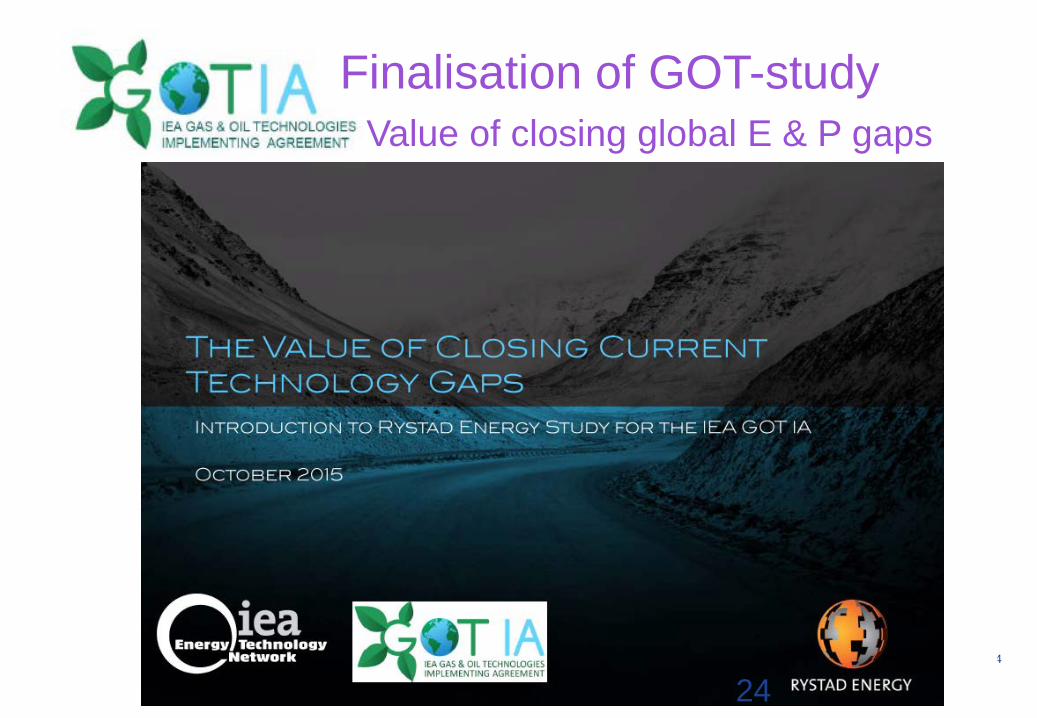
Finalisation of GOT-studyValue of closing global E & P gaps
24
GE Confidential
25@#GECON&*
.
Overall observations:
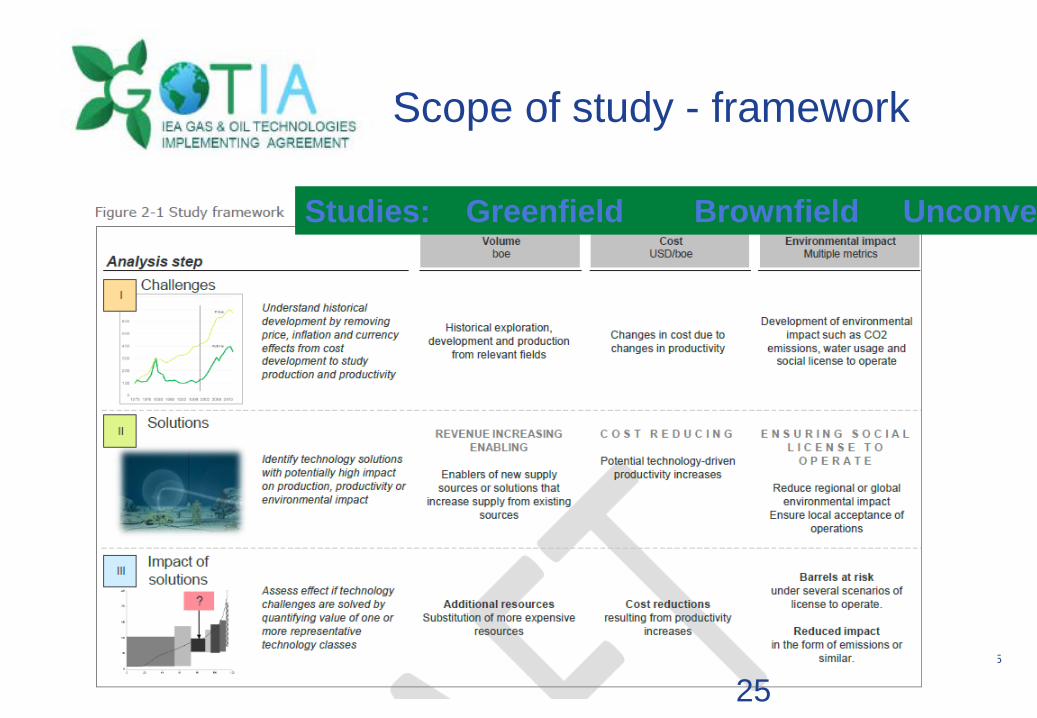
Scope of study - framework
Studies: Greenfield Brownfield Unconve
25
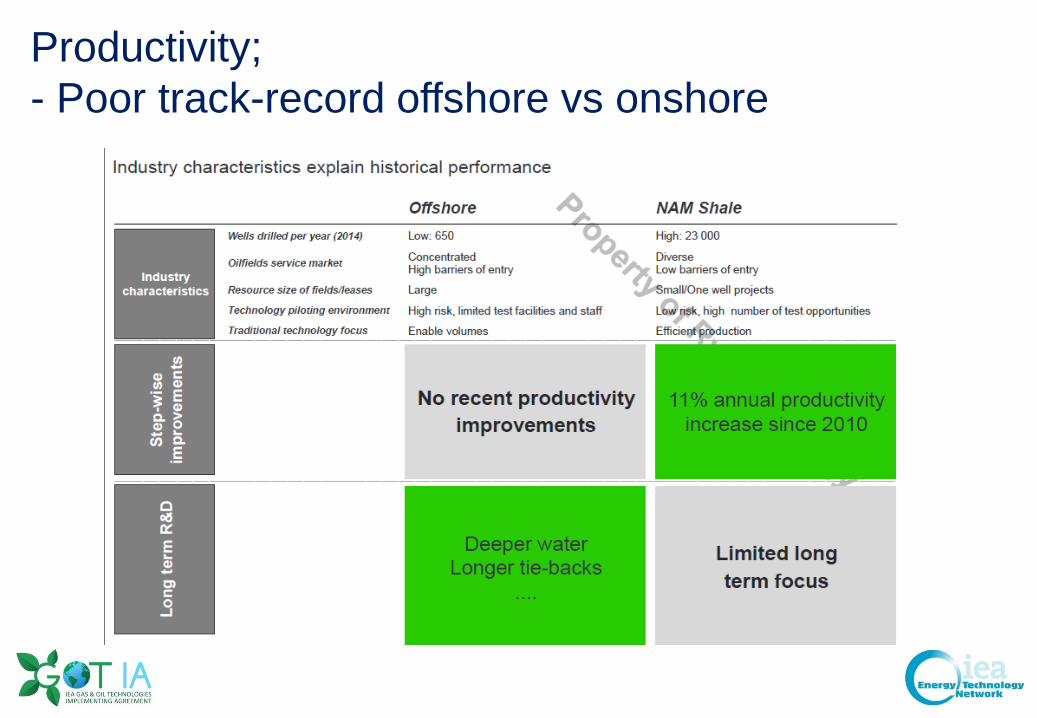
Productivity;- Poor track-record offshore vs onshore
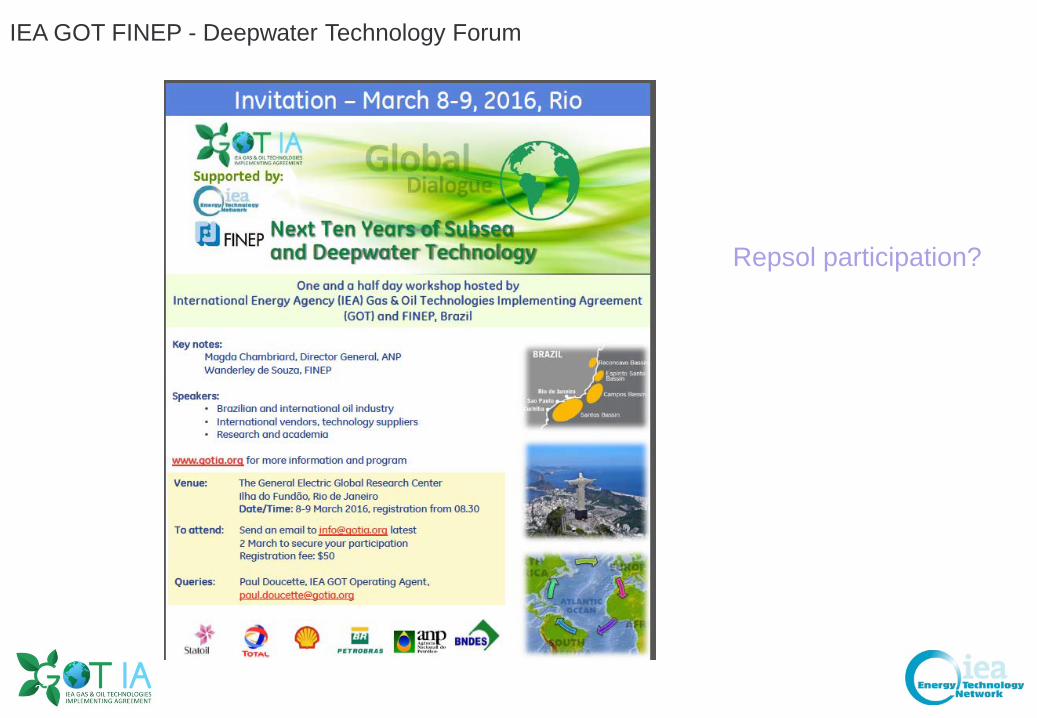
IEA GOT FINEP - Deepwater Technology Forum
Repsol participation?
27
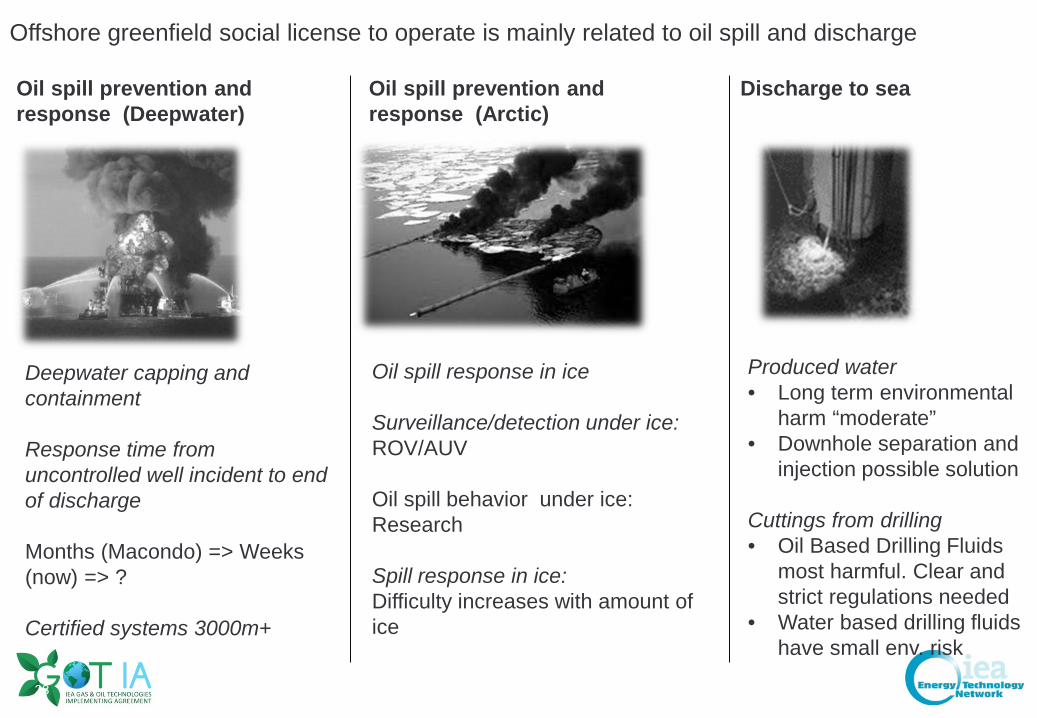
Offshore greenfield social license to operate is mainly related to oil spill and discharge
Oil spill prevention and response (Deepwater)
Deepwater capping and containment
Response time from uncontrolled well incident to end of discharge
Months (Macondo) => Weeks (now) => ?
Certified systems 3000m+
Oil spill prevention and response (Arctic)
Oil spill response in ice
Surveillance/detection under ice: ROV/AUV
Oil spill behavior under ice: Research
Spill response in ice: Difficulty increases with amount of ice
Discharge to sea
Produced water• Long term environmental
harm “moderate”• Downhole separation and
injection possible solution
Cuttings from drilling• Oil Based Drilling Fluids
most harmful. Clear and strict regulations needed
• Water based drilling fluids have small env. risk
28

Thank you
29
GE Confidential
30@#GECON&*
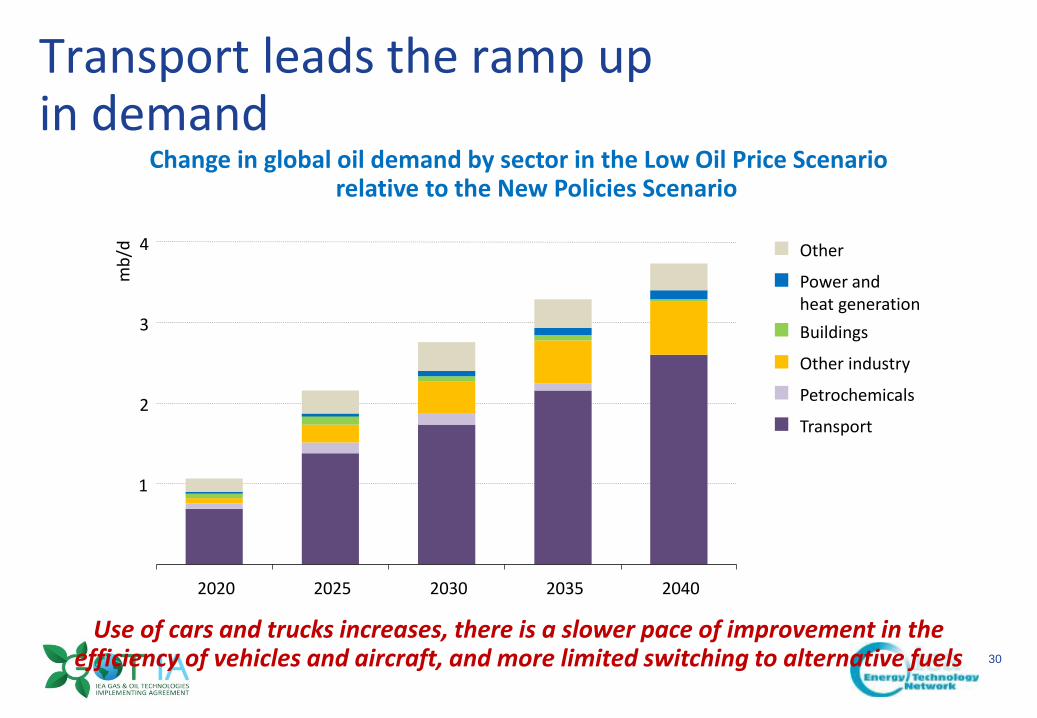
Transport leads the ramp upin demand
Change in global oil demand by sector in the Low Oil Price Scenariorelative to the New Policies Scenario
Use of cars and trucks increases, there is a slower pace of improvement in the efficiency of vehicles and aircraft, and more limited switching to alternative fuels
1
2
3
4
2020 2025 2030 2035 2040
mb/
d Other
Power andheat generationBuildings
Other industry
Petrochemicals
Transport
GE Confidential
31@#GECON&*
Mtoe
-300
0
300
600
900
1 200
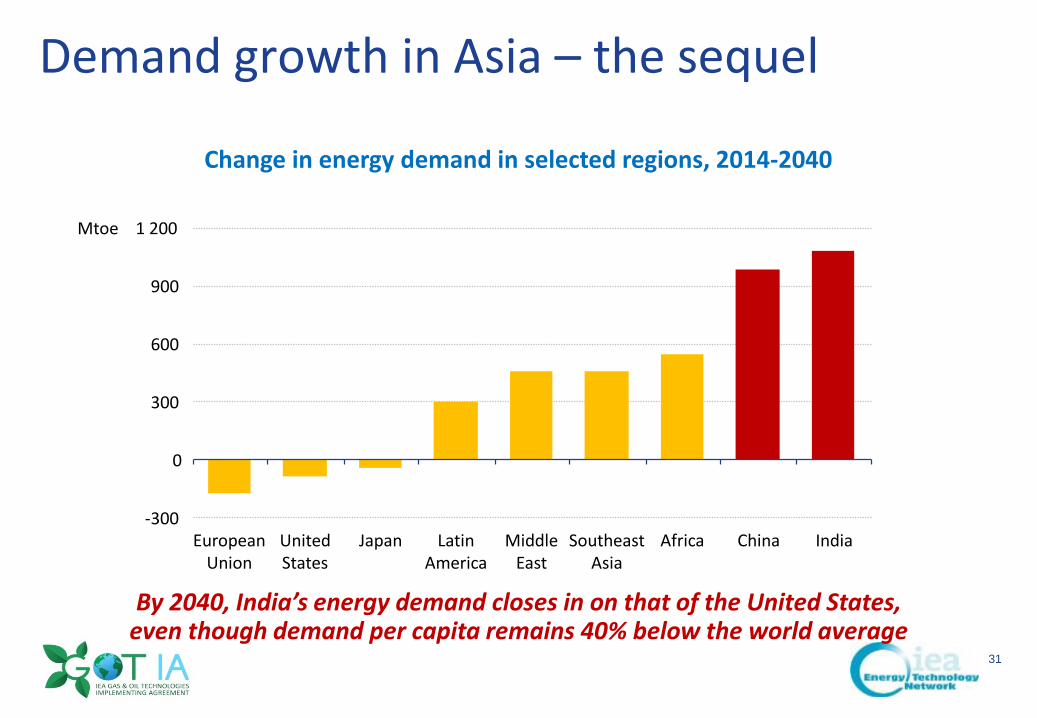
Demand growth in Asia – the sequel
By 2040, India’s energy demand closes in on that of the United States, even though demand per capita remains 40% below the world average
EuropeanUnion
UnitedStates
Japan LatinAmerica
MiddleEast
SoutheastAsia
Africa China India
Change in energy demand in selected regions, 2014-2040
GE Confidential
32@#GECON&*
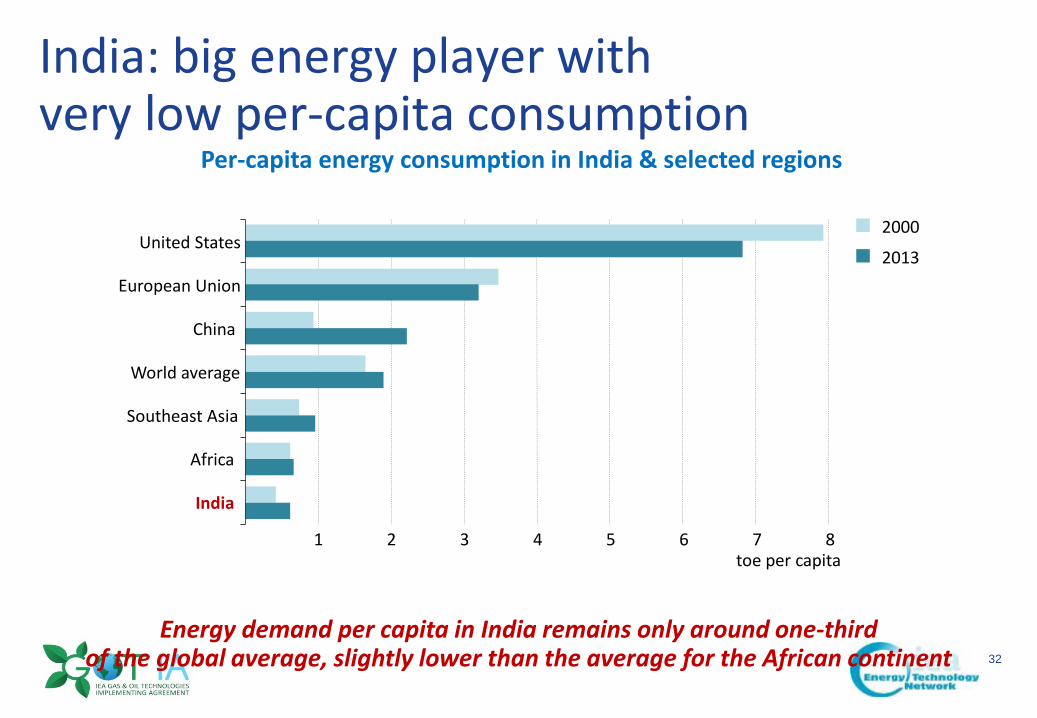
India: big energy player withvery low per-capita consumption
Per-capita energy consumption in India & selected regions
Energy demand per capita in India remains only around one-thirdof the global average, slightly lower than the average for the African continent
1 2 3 4 5 6 7 8
United States
European Union
China
World average
Southeast Asia
Africa
toe per capita
2000
2013
India
GE Confidential
33@#GECON&*
India’s CO2 emissions are on the rise
Energy-related CO2 emissions by selected country & region
Heavy reliance on coal leads to a large rise in India’s CO2 emissions; expressedon a per-capita basis, emissions remain some 20% below the world average in 2040
0.1
0.2
0.3
0.4
0.5
0.6
0 3 6 9 12 15 18Tonnes per capita
Tonn
espe
r tho
usan
d do
llars
of
GDP
($20
14, P
PP)
Bubble area
2 Gt
4 Gt
Russia
European Union
China
IndiaJapan
United States
Key2013
2040
GE Confidential
34@#GECON&*
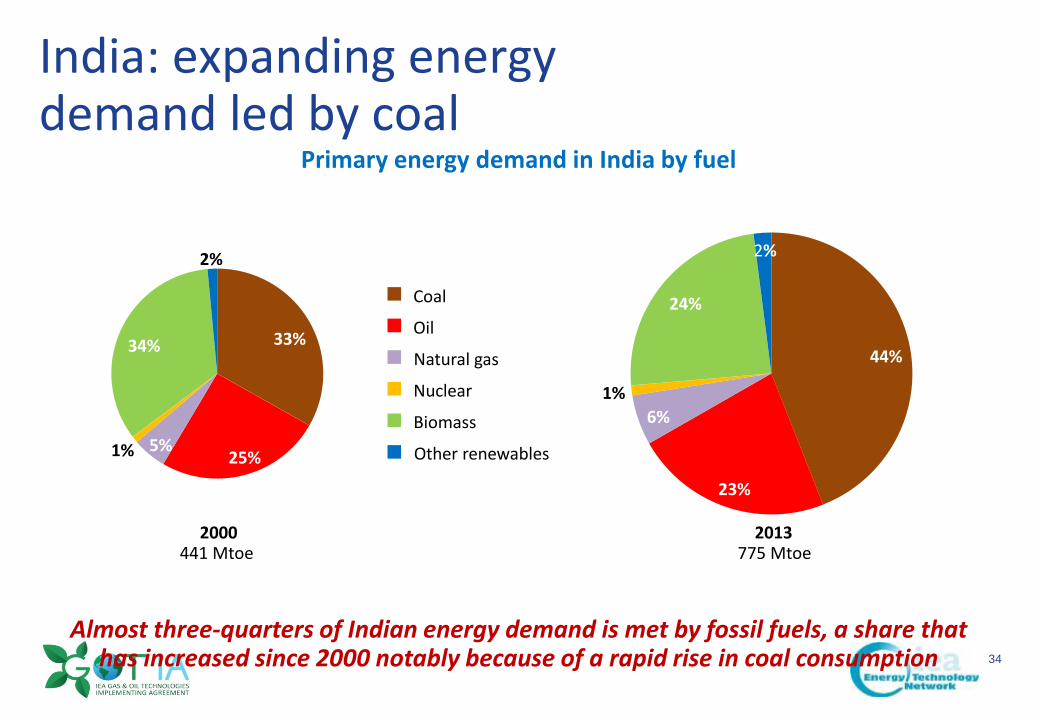
India: expanding energydemand led by coal
Primary energy demand in India by fuel
Almost three-quarters of Indian energy demand is met by fossil fuels, a share that has increased since 2000 notably because of a rapid rise in coal consumption
33%
25%5%1%
34%
2%
2000441 Mtoe
Coal
Oil
Natural gas
Nuclear
Biomass
Other renewables
44%
23%
6%1%
24%
2%
2013775 Mtoe
GE Confidential
35@#GECON&*
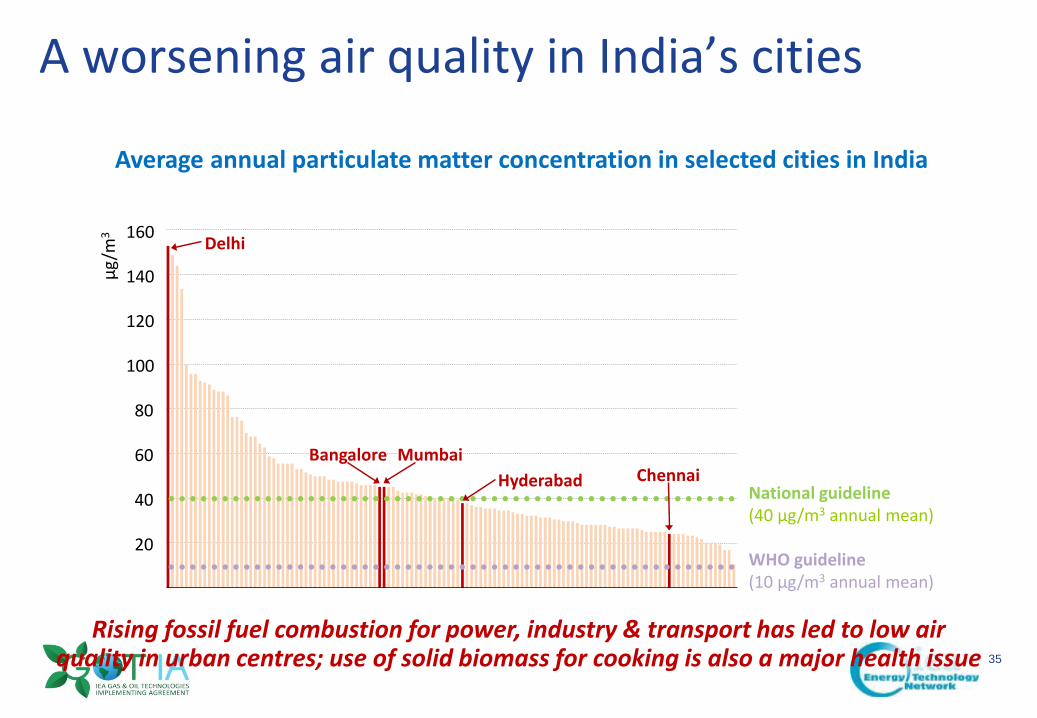
A worsening air quality in India’s cities
Average annual particulate matter concentration in selected cities in India
Rising fossil fuel combustion for power, industry & transport has led to low air quality in urban centres; use of solid biomass for cooking is also a major health issue
20
40
60
80
100
120
140
160
μg/m
3
HyderabadMumbai
ChennaiBangalore
National guideline(40 μg/m3 annual mean)
Delhi
WHO guideline(10 μg/m3 annual mean)
GE Confidential
36@#GECON&*
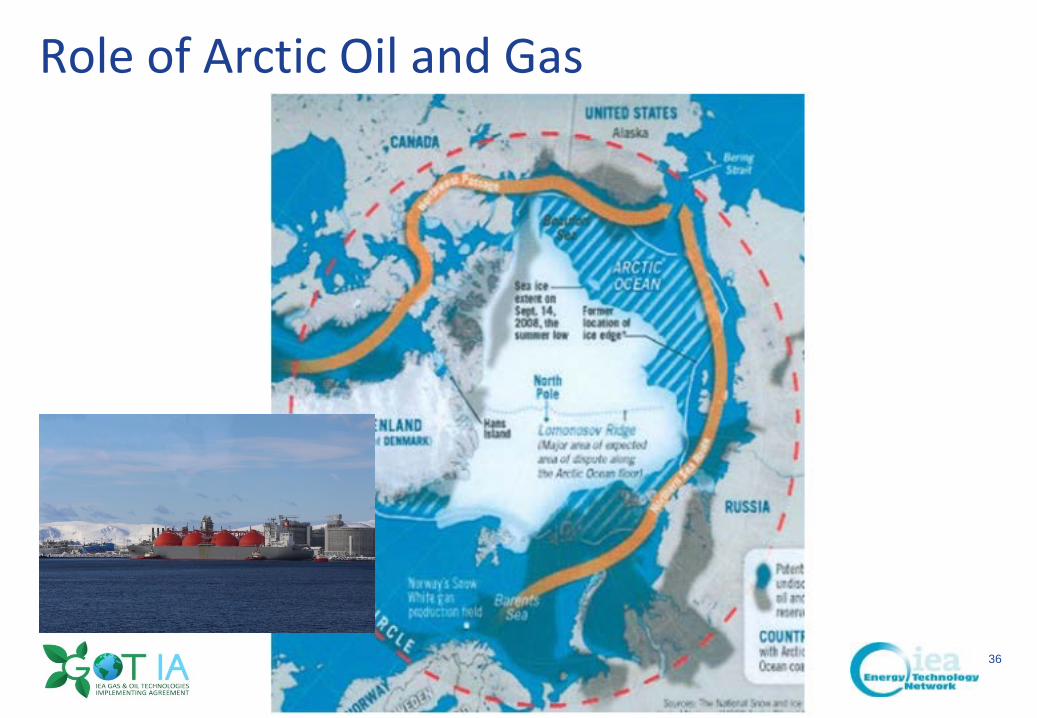
Role of Arctic Oil and Gas
GE Confidential
37@#GECON&*
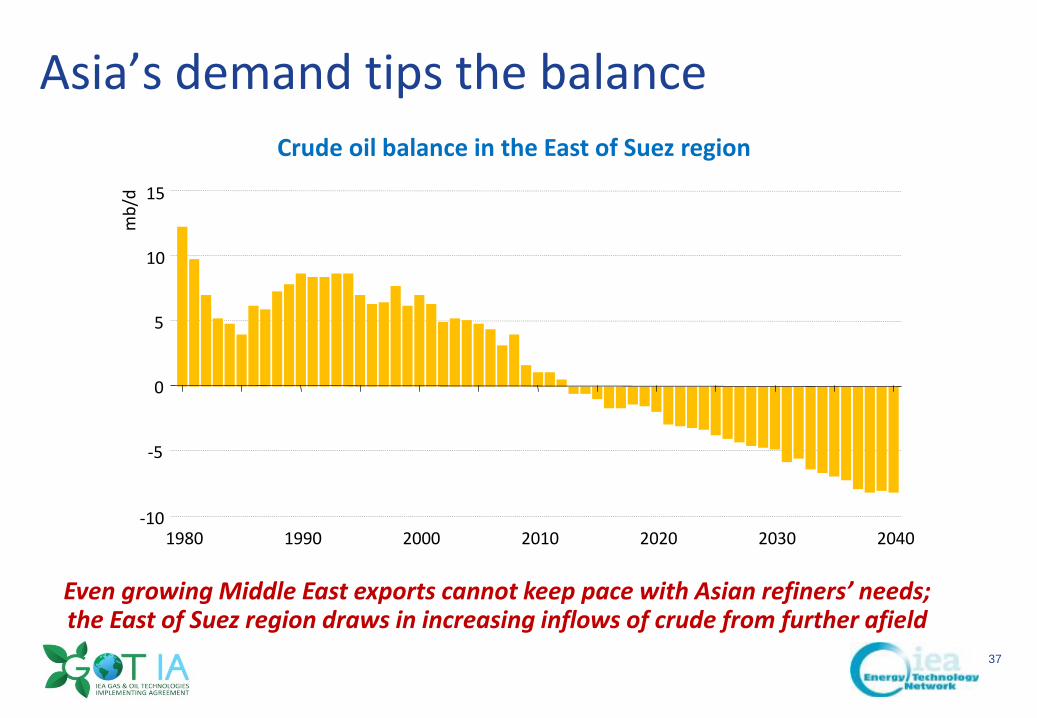
Asia’s demand tips the balanceCrude oil balance in the East of Suez region
Even growing Middle East exports cannot keep pace with Asian refiners’ needs; the East of Suez region draws in increasing inflows of crude from further afield
-10
-5
0
5
10
15
1980 1990 2000 2010 2020 2030 2040
mb/
d
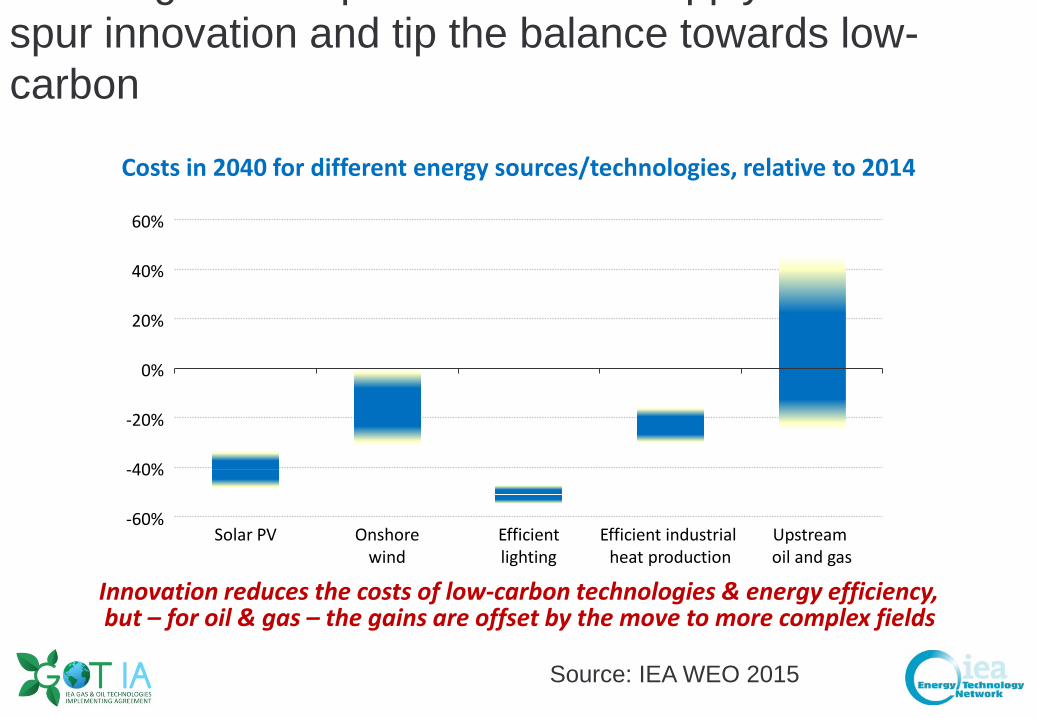
but – for oil & gas – the gains are offset by the move to more complex fields
g p pp y spur innovation and tip the balance towards low-carbon
Costs in 2040 for different energy sources/technologies, relative to 2014
-60%
-40%
-20%
0%
20%
40%
60%
Solar PV Onshorewind
Efficient industrial heat production
Efficientlighting
Upstream oil and gas
Innovation reduces the costs of low-carbon technologies & energy efficiency,
Source: IEA WEO 2015
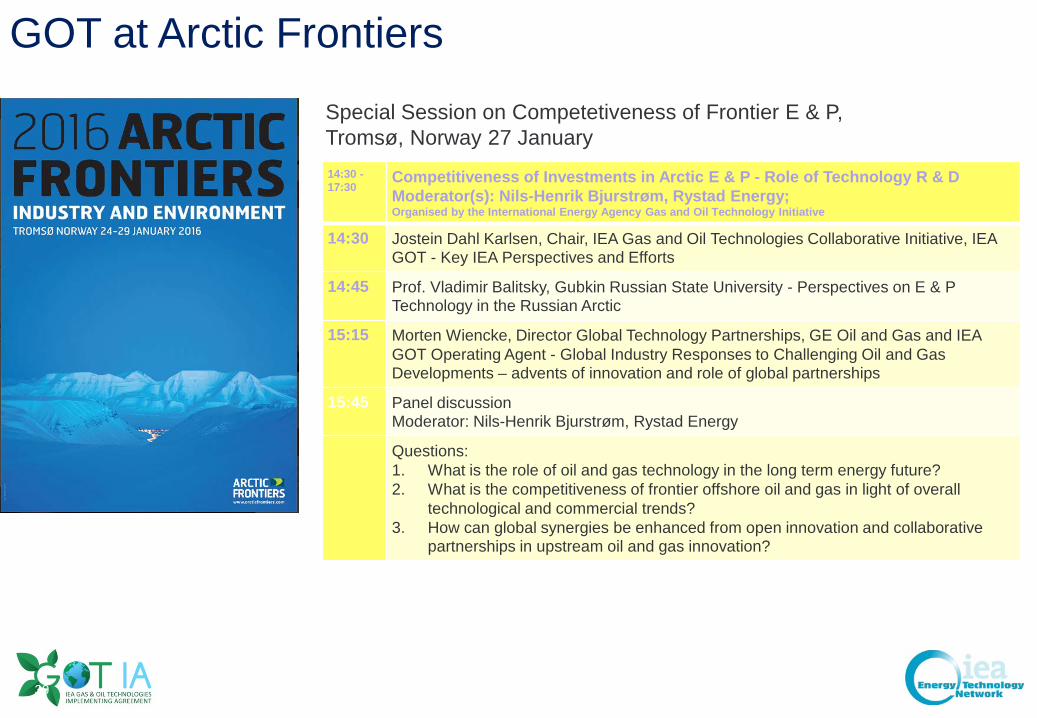
GOT at Arctic Frontiers
14:30 -17:30
Competitiveness of Investments in Arctic E & P - Role of Technology R & DModerator(s): Nils-Henrik Bjurstrøm, Rystad Energy;Organised by the International Energy Agency Gas and Oil Technology Initiative
14:30 Jostein Dahl Karlsen, Chair, IEA Gas and Oil Technologies Collaborative Initiative, IEA GOT - Key IEA Perspectives and Efforts
14:45 Prof. Vladimir Balitsky, Gubkin Russian State University - Perspectives on E & P Technology in the Russian Arctic
15:15 Morten Wiencke, Director Global Technology Partnerships, GE Oil and Gas and IEA GOT Operating Agent - Global Industry Responses to Challenging Oil and Gas Developments – advents of innovation and role of global partnerships
15:45 Panel discussionModerator: Nils-Henrik Bjurstrøm, Rystad Energy
Questions:1. What is the role of oil and gas technology in the long term energy future?2. What is the competitiveness of frontier offshore oil and gas in light of overall
technological and commercial trends?3. How can global synergies be enhanced from open innovation and collaborative
partnerships in upstream oil and gas innovation?
Special Session on Competetiveness of Frontier E & P, Tromsø, Norway 27 January
39
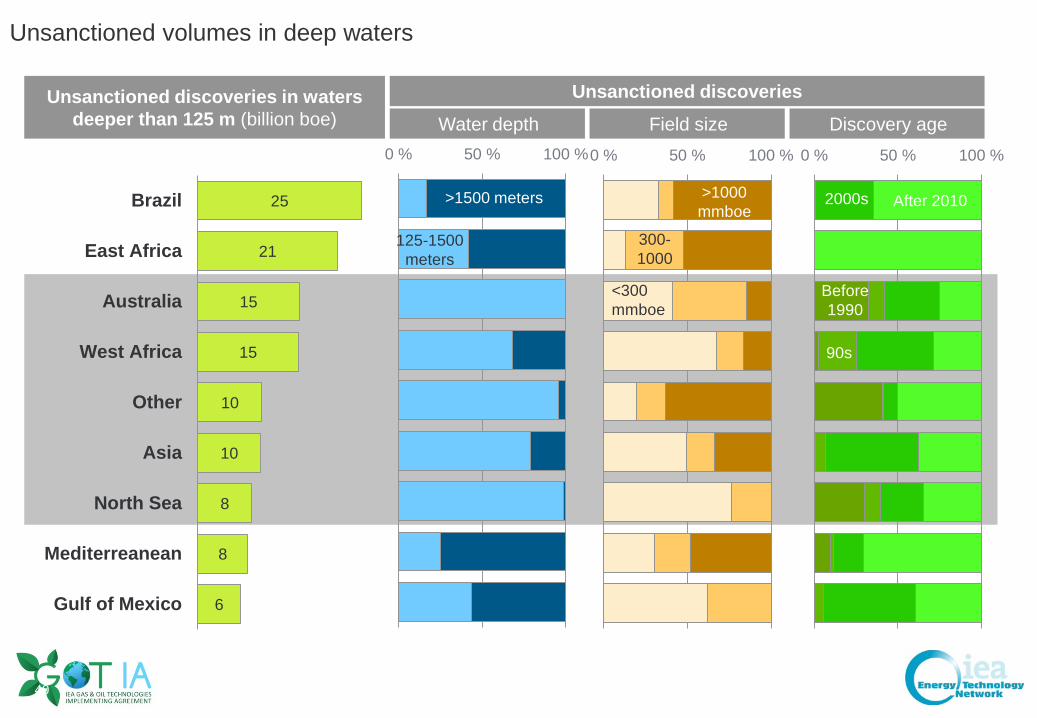
Unsanctioned volumes in deep waters
25
21
15
15
10
10
8
8
6
Brazil
East Africa
Australia
West Africa
Other
Asia
North Sea
Mediterreanean
Gulf of Mexico
Unsanctioned discoveries in waters deeper than 125 m (billion boe) Water depth
0 % 50 % 100 %0 % 50 % 100 % 0 % 50 % 100 %
Unsanctioned discoveriesField size Discovery age
>1500 meters
<300 mmboe
300-1000
>1000 mmboe
125-1500 meters
Before 1990
90s
2000s After 2010
40
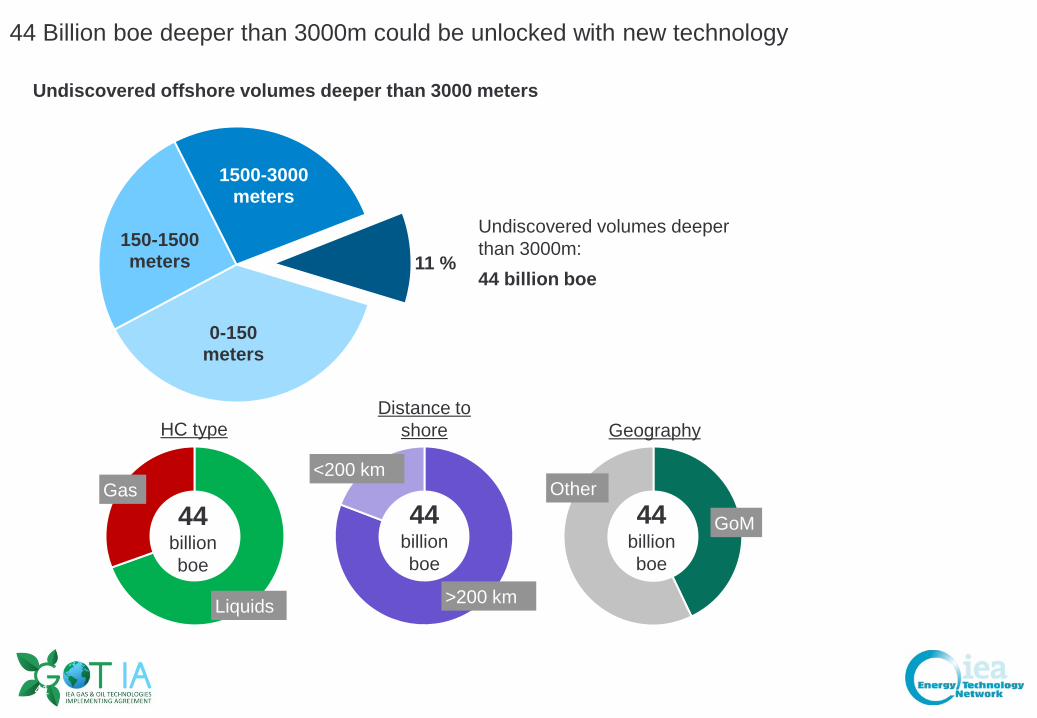
44 Billion boe deeper than 3000m could be unlocked with new technology
Undiscovered offshore volumes deeper than 3000 meters
0-150 meters
150-1500 meters
1500-3000 meters
11 %
Undiscovered volumes deeper than 3000m:44 billion boe
Liquids
Gas44
billion boe
>200 km
44billion boe
GoM
Other44
billion boe
HC typeDistance to
shore
<200 km
Geography
41
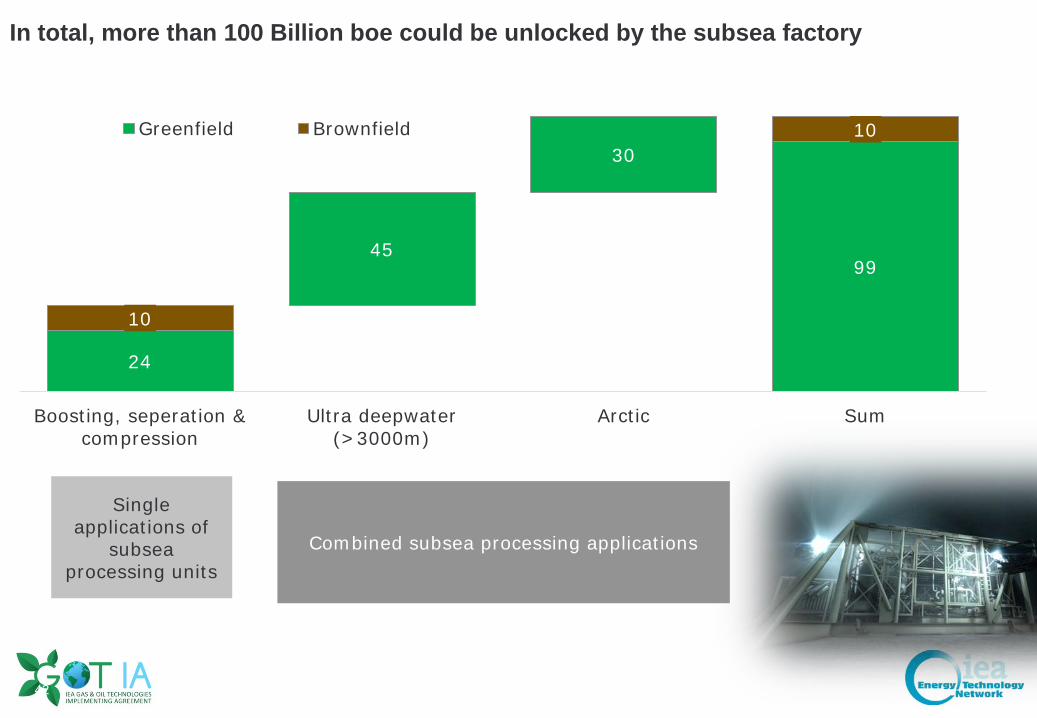
In total, more than 100 Billion boe could be unlocked by the subsea factory
24
45
30
99
10
10
Boosting, seperation &compression
Ultra deepwater(>3000m)
Arctic Sum
Greenfield Brownfield
Combined subsea processing applications
Single applications of
subsea processing units
42
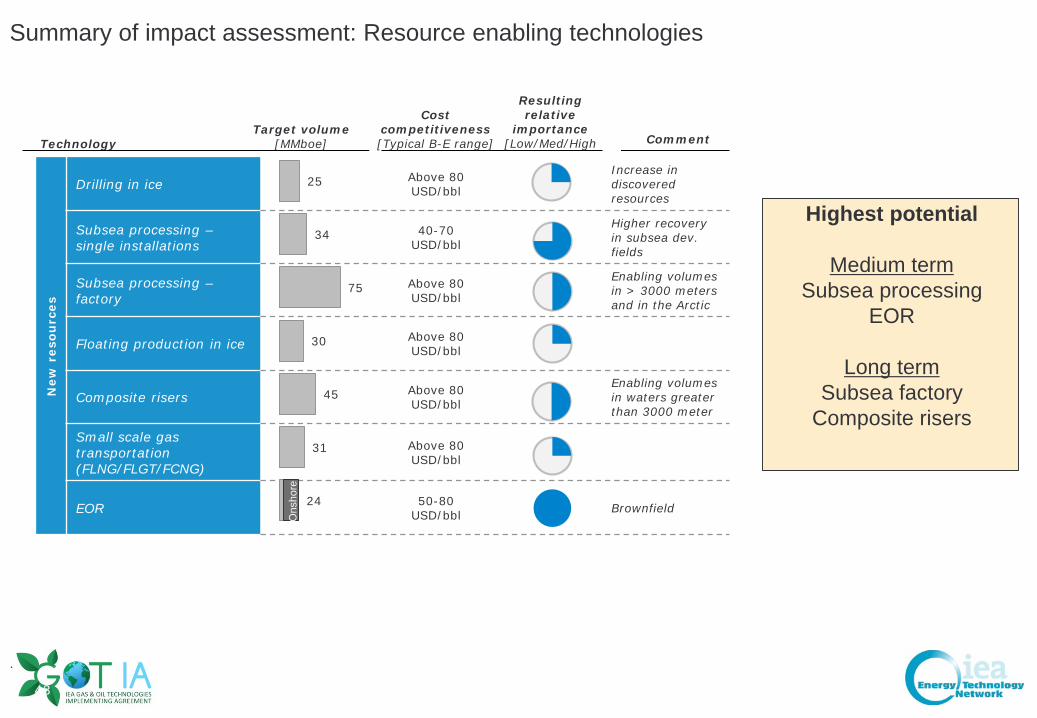
Summary of impact assessment: Resource enabling technologies
.
New
res
ourc
es
Drilling in ice Above 80 USD/bbl
Increase in discoveredresources
Subsea processing –single installations
40-70USD/bbl
Higher recovery in subsea dev. fields
Subsea processing –factory
Above 80 USD/bbl
Enabling volumes in > 3000 meters and in the Arctic
Floating production in ice Above 80 USD/bbl
Composite risers Above 80 USD/bbl
Enabling volumes in waters greater than 3000 meter
Small scale gas transportation (FLNG/FLGT/FCNG)
Above 80 USD/bbl
EOR 50-80USD/bbl Brownfield
25
34
75
30
45
31
24
TechnologyTarget volume
[MMboe]
Cost competitiveness[Typical B-E range]
Resulting relative
importance[Low/Med/High Comment
Ons
hore
Highest potential
Medium termSubsea processing
EOR
Long termSubsea factory
Composite risers
43

Back-up
44
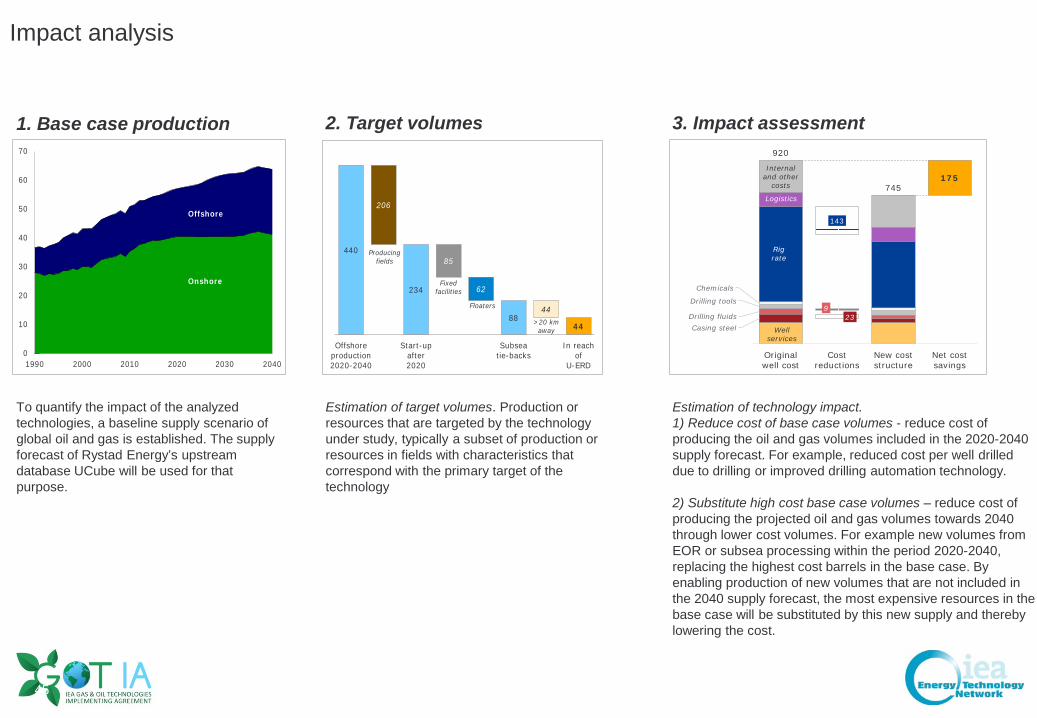
Impact analysis
0
10
20
30
40
50
60
70
1990 2000 2010 2020 2030 2040
Offshore
Onshore
1. Base case production
440
234
8844
206
85
62
44
Offshoreproduction2020-2040
Start-upafter2020
Subseatie-backs
In reachof
U-ERD
Fixedfacilities
>20 km away
Floaters
Producingfields
2. Target volumes
Estimation of target volumes. Production or resources that are targeted by the technology under study, typically a subset of production or resources in fields with characteristics that correspond with the primary target of the technology
Estimation of technology impact.1) Reduce cost of base case volumes - reduce cost of producing the oil and gas volumes included in the 2020-2040 supply forecast. For example, reduced cost per well drilled due to drilling or improved drilling automation technology.
2) Substitute high cost base case volumes – reduce cost of producing the projected oil and gas volumes towards 2040 through lower cost volumes. For example new volumes from EOR or subsea processing within the period 2020-2040, replacing the highest cost barrels in the base case. By enabling production of new volumes that are not included in the 2040 supply forecast, the most expensive resources in the base case will be substituted by this new supply and thereby lowering the cost.
Casing steel23Drilling fluids
9Drilling tools
Chemicals
143
175
920
745
Originalwell cost
Costreductions
New coststructure
Net costsavings
Well services
Rig rate
Logistics
Internaland other
costs
3. Impact assessment
To quantify the impact of the analyzed technologies, a baseline supply scenario of global oil and gas is established. The supply forecast of Rystad Energy’s upstream database UCube will be used for that purpose.
45
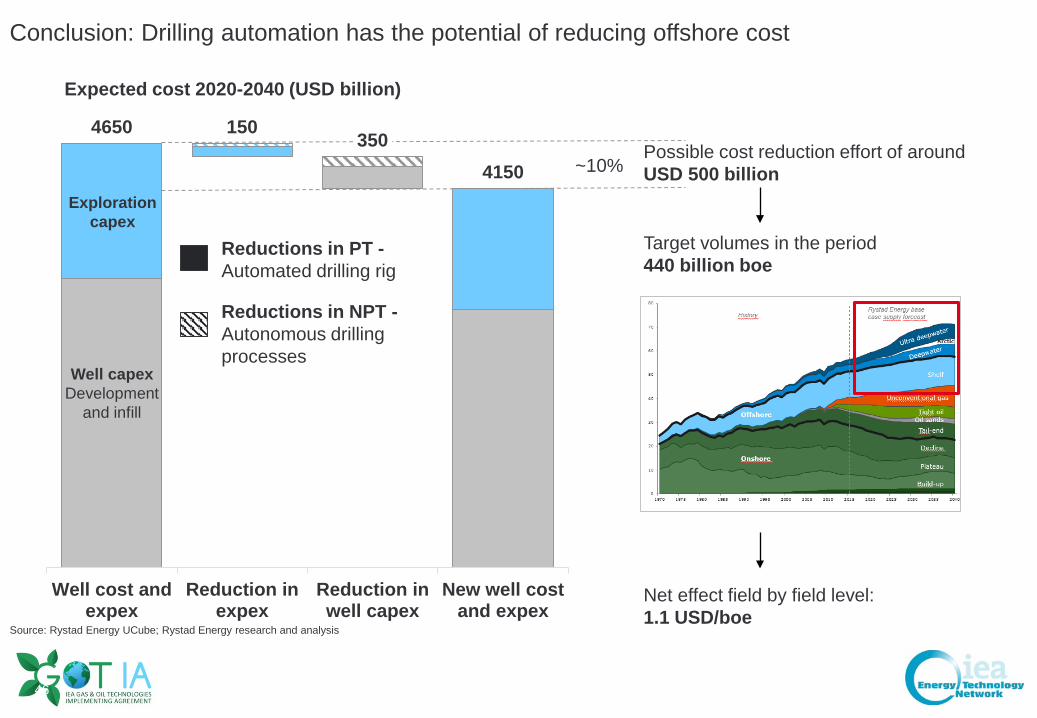
Conclusion: Drilling automation has the potential of reducing offshore cost
4650 150 3504150
Well cost andexpex
Reduction inexpex
Reduction inwell capex
New well costand expex
Source: Rystad Energy UCube; Rystad Energy research and analysis
Exploration capex
Well capexDevelopment
and infill
Possible cost reduction effort of around USD 500 billion
Target volumes in the period440 billion boe
Net effect field by field level: 1.1 USD/boe
Reductions in PT -Automated drilling rig
Reductions in NPT -Autonomous drilling processes
Expected cost 2020-2040 (USD billion)
~10%
46
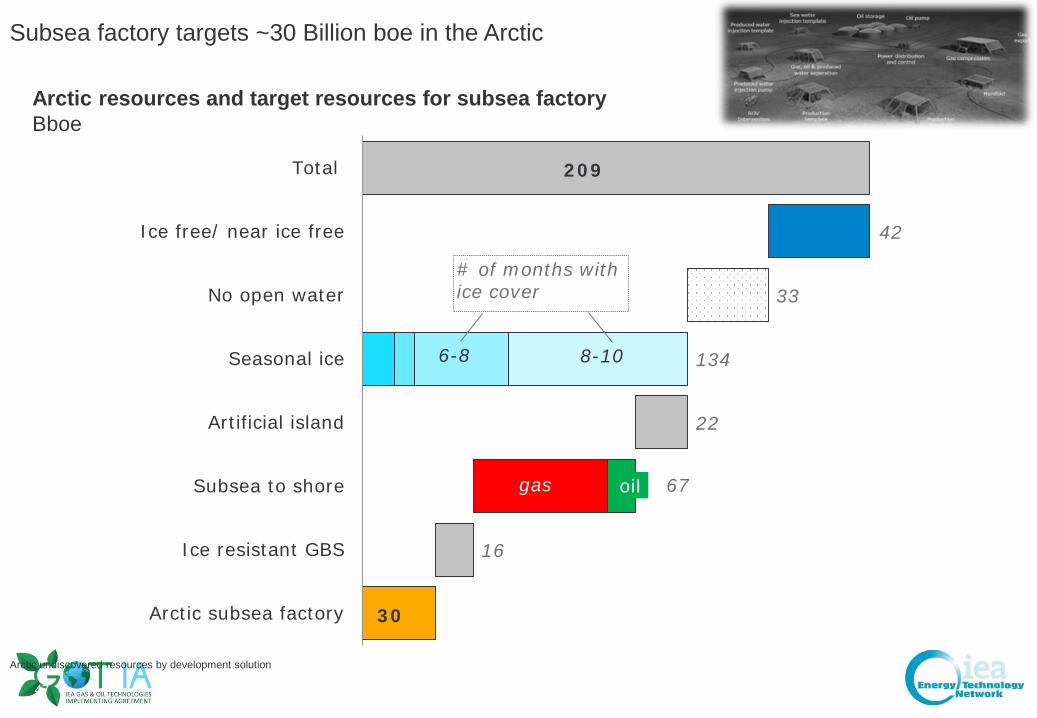
Subsea factory targets ~30 Billion boe in the Arctic
Arctic undiscovered resources by development solution
30
16
67
22
134
33
42
209
Arctic subsea factory
Ice resistant GBS
Subsea to shore
Artificial island
Seasonal ice
No open water
Ice free/ near ice free
Total
# of months with ice cover
8-106-8
gas oil
Arctic resources and target resources for subsea factoryBboe
47
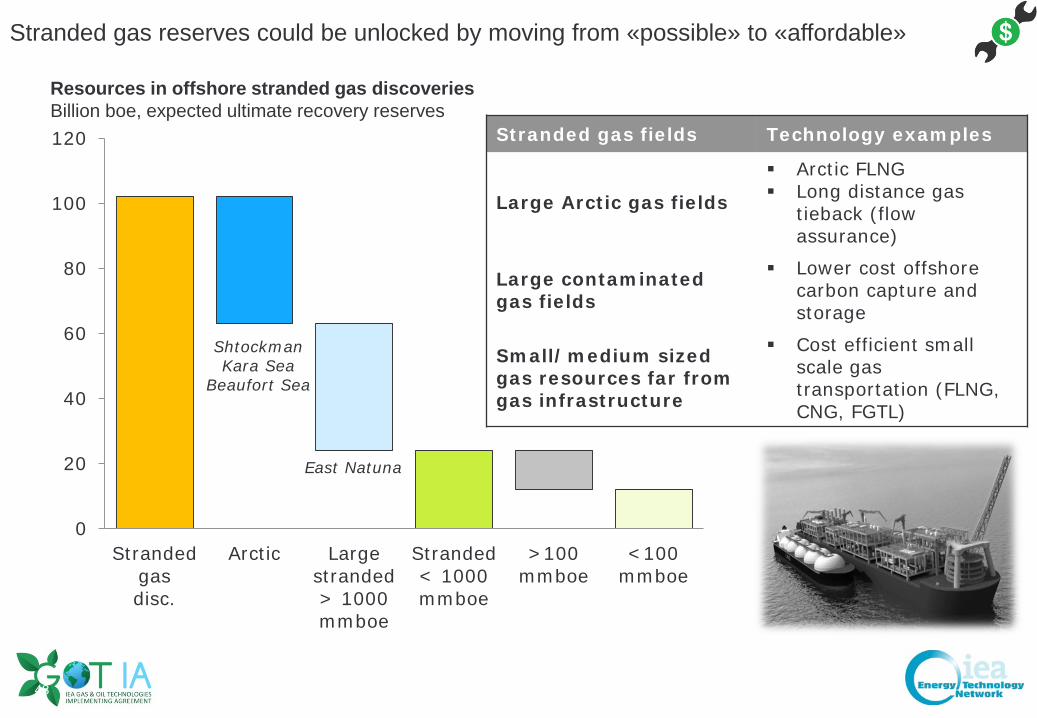
Stranded gas reserves could be unlocked by moving from «possible» to «affordable»
0
20
40
60
80
100
120
Strandedgasdisc.
Arctic Largestranded> 1000mmboe
Stranded< 1000mmboe
>100mmboe
<100mmboe
ShtockmanKara Sea
Beaufort Sea
Resources in offshore stranded gas discoveries Billion boe, expected ultimate recovery reserves
East Natuna
Stranded gas fields Technology examples
Large Arctic gas fields
Arctic FLNG Long distance gas
tieback (flow assurance)
Large contaminated gas fields
Lower cost offshore carbon capture and storage
Small/medium sized gas resources far from gas infrastructure
Cost efficient small scale gas transportation (FLNG, CNG, FGTL)
48
Back-up
49
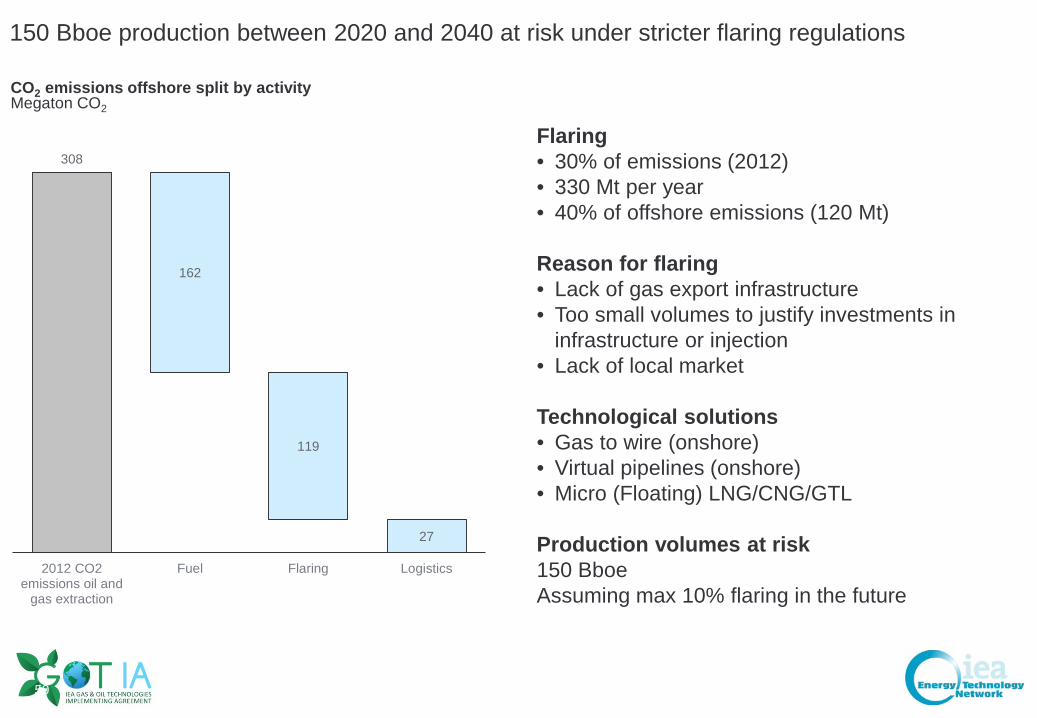
150 Bboe production between 2020 and 2040 at risk under stricter flaring regulations
CO2 emissions offshore split by activityMegaton CO2
162
119
27
308
2012 CO2emissions oil and
gas extraction
Fuel Flaring Logistics
Flaring• 30% of emissions (2012)• 330 Mt per year• 40% of offshore emissions (120 Mt)
Reason for flaring• Lack of gas export infrastructure• Too small volumes to justify investments in
infrastructure or injection• Lack of local market
Technological solutions• Gas to wire (onshore)• Virtual pipelines (onshore)• Micro (Floating) LNG/CNG/GTL
Production volumes at risk150 BboeAssuming max 10% flaring in the future
50
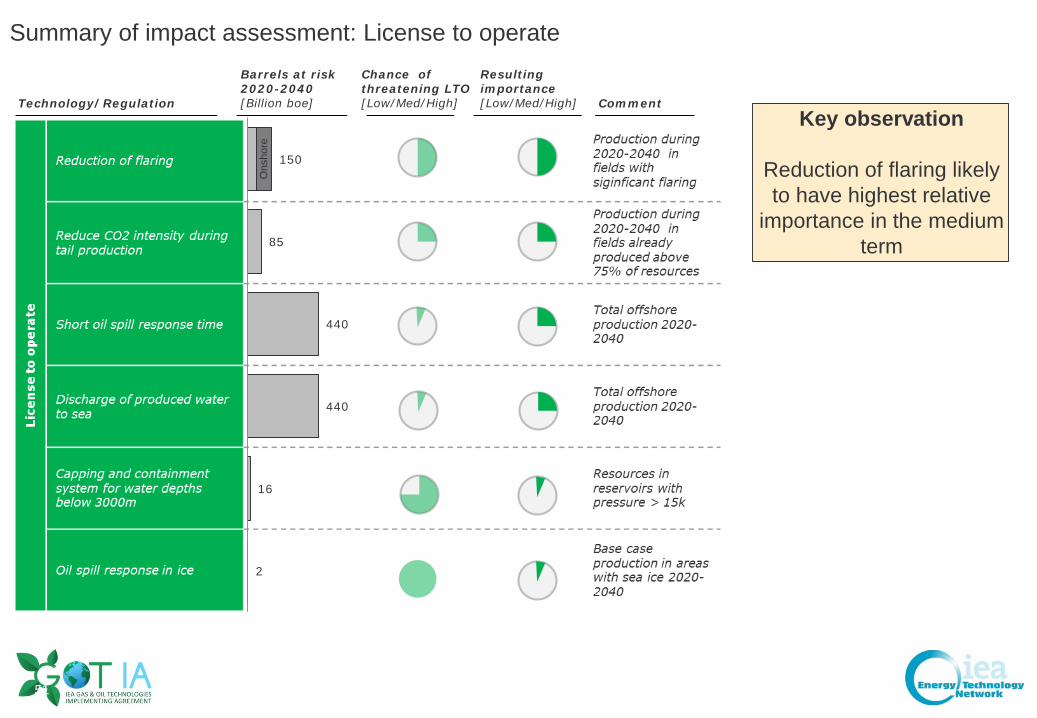
Summary of impact assessment: License to operate
Technology/Regulation
Barrels at risk 2020-2040[Billion boe]
Chance of threatening LTO[Low/Med/High]
Resultingimportance[Low/Med/High] Comment
150
85
440
440
16
2
Ons
hore
Key observation
Reduction of flaring likely to have highest relative
importance in the medium term
51