Embed Size (px)
Citation preview

IECRE OD-551-15 Edition 1.01 20182019-1107-0109
IECRE OPERATIONAL DOCUMENT
Assessment of RETLs for Wind turbines – Acoustic noise measurement techniques, IEC 61400-11:2012+AMD1:2018 CSV Consolidated version
IEC
RE
OD
-551
-15:
2019
8
IEC System for Certification to Standards relating to Equipment for use in Renewable Energy applications (IECRE System)
THIS PUBLICATION IS COPYRIGHT PROTECTED Copyright © 2018 2019 IEC, Geneva, Switzerland All rights reserved. Unless otherwise specified, no part of this publication may be reproduced or utilized in any form or by any means, electronic or mechanical, including photocopying and microfilm, without permission in writing from either IEC or IEC's member National Committee in the country of the requester. If you have any questions about IEC copyright or have an enquiry about obtaining additional rights to this publication, please contact the address below or your local IEC member National Committee for further information.
IEC Central Office Tel.: +41 22 919 02 11 3, rue de Varembé Fax: +41 22 919 03 00 CH-1211 Geneva 20 [email protected] Switzerland www.iec.ch
About the IEC The International Electrotechnical Commission (IEC) is the leading global organization that prepares and publishes International Standards for all electrical, electronic and related technologies.
About IEC publications The technical content of IEC publications is kept under constant review by the IEC. Please make sure that you have the latest edition, a corrigenda or an amendment might have been published. Useful links: IEC publications search - www.iec.ch/searchpub The advanced search enables you to find IEC publications by a variety of criteria (reference number, text, technical committee,…). It also gives information on projects, replaced and withdrawn publications. IEC Just Published - webstore.iec.ch/justpublished Stay up to date on all new IEC publications. Just Published details all new publications released. Available on-line and also once a month by email. Electropedia - www.electropedia.org
The world's leading online dictionary of electronic and electrical terms containing more than 30 000 terms and definitions in English and French, with equivalent terms in additional languages. Also known as the International Electrotechnical Vocabulary (IEV) on-line. Customer Service Centre - webstore.iec.ch/csc If you wish to give us your feedback on this publication or need further assistance, please contact the Customer Service Centre: [email protected].

IECRE OD-551-15 Edition 1.01 20182019-1107-0109
IECRE OPERATIONAL DOCUMENT
Assessment of RETLs for Wind turbines – Acoustic noise measurement techniques, IEC 61400-11:2012+AMD1:2018 CSV Consolidated version
INTERNATIONAL ELECTROTECHNICAL COMMISSION ZZ PRICE CODE
IEC System for Certification to Standards relating to Equipment for use in Renewable Energy applications (IECRE System)
– 2 –IECRE OD-551-15:2018 2019 © IEC 20182019
CONTENTS
CONTENTS ............................................................................................................................ 2 1 Introduction ..................................................................................................................... 3 2 Normative references ...................................................................................................... 3 3 Review of reports issued ................................................................................................. 3 4 Proficiency testing ........................................................................................................... 3
4.1 Topics of proficiency test ........................................................................................ 3 5 Review of internal procedures ......................................................................................... 3
5.1 Identification of key procedures .............................................................................. 3 6 Inspection of field test ..................................................................................................... 4 Annex A – Checklist ................................................................................................................ 5
IECRE OD-551-15:2018 2019 © IEC 20182019– 3 –
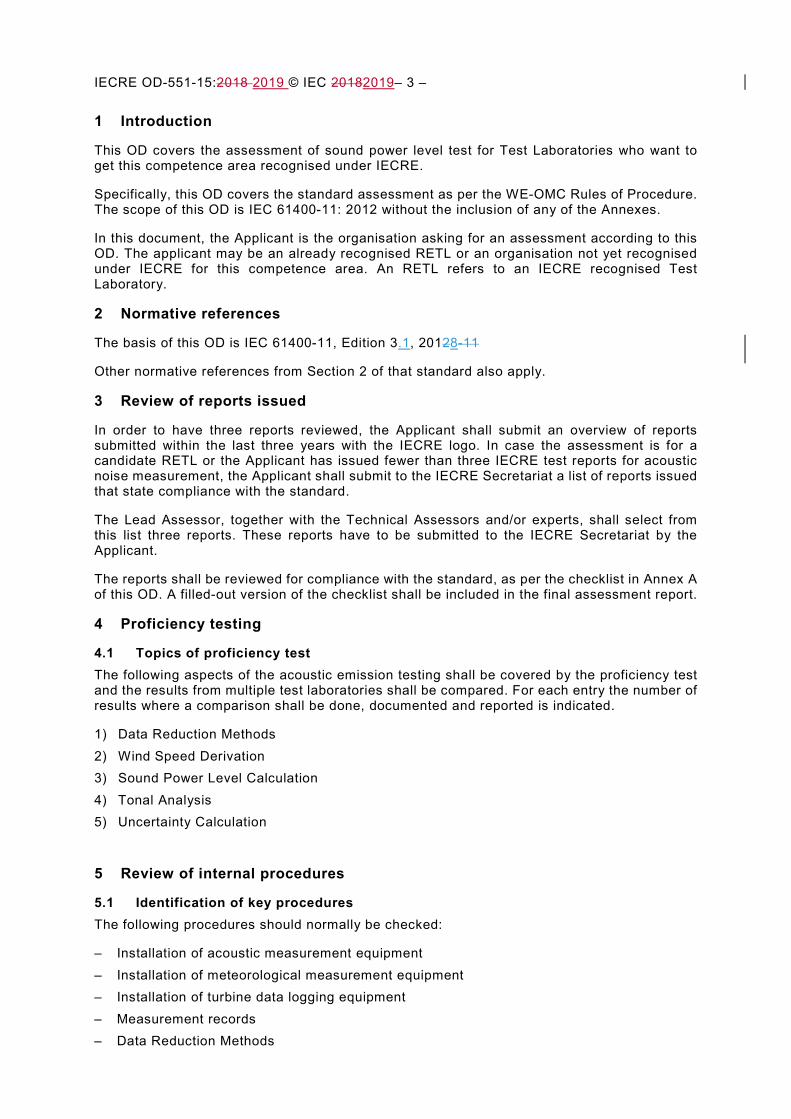
1 Introduction
This OD covers the assessment of sound power level test for Test Laboratories who want to get this competence area recognised under IECRE.
Specifically, this OD covers the standard assessment as per the WE-OMC Rules of Procedure. The scope of this OD is IEC 61400-11: 2012 without the inclusion of any of the Annexes.
In this document, the Applicant is the organisation asking for an assessment according to this OD. The applicant may be an already recognised RETL or an organisation not yet recognised under IECRE for this competence area. An RETL refers to an IECRE recognised Test Laboratory.
2 Normative references
The basis of this OD is IEC 61400-11, Edition 3.1, 20128-11
Other normative references from Section 2 of that standard also apply.
3 Review of reports issued
In order to have three reports reviewed, the Applicant shall submit an overview of reports submitted within the last three years with the IECRE logo. In case the assessment is for a candidate RETL or the Applicant has issued fewer than three IECRE test reports for acoustic noise measurement, the Applicant shall submit to the IECRE Secretariat a list of reports issued that state compliance with the standard.
The Lead Assessor, together with the Technical Assessors and/or experts, shall select from this list three reports. These reports have to be submitted to the IECRE Secretariat by the Applicant.
The reports shall be reviewed for compliance with the standard, as per the checklist in Annex A of this OD. A filled-out version of the checklist shall be included in the final assessment report.
4 Proficiency testing
4.1 Topics of proficiency test The following aspects of the acoustic emission testing shall be covered by the proficiency test and the results from multiple test laboratories shall be compared. For each entry the number of results where a comparison shall be done, documented and reported is indicated.
1) Data Reduction Methods 2) Wind Speed Derivation 3) Sound Power Level Calculation 4) Tonal Analysis 5) Uncertainty Calculation
5 Review of internal procedures
5.1 Identification of key procedures The following procedures should normally be checked:
– Installation of acoustic measurement equipment – Installation of meteorological measurement equipment – Installation of turbine data logging equipment – Measurement records – Data Reduction Methods

– 4 –IECRE OD-551-15:2018 2019 © IEC 20182019
– Wind Speed Derivation – Sound Power Level Calculation – Tonal Analysis – Uncertainty Calculation – Version control for analysis tools and software A review of the facilities where the equipment is prepared for outside use shall be part of the assessment.
6 Inspection of field test
As part of the assessment the assessment team shall inspect one test in the field (possibly a field near the office, which may be simulation i.e. without a turbine) to establish:
1) Compliance with the standard 2) Compliance with the key internal procedures as defined under section 5 of this OD 3) Identify further process or technical issues that could affect the result of the test

IECRE OD-551-15:2018 2019 © IEC 20182019 – 5 –
Annex A– Checklist
Please note that this checklist is used for reviewing reports as well as the applicant's internal procedures and may be used as well for the on-site inspection
# Reference to section in standard Requirement from standard Reported /
Inspected Finding
1 5: Outline of method The specific test conditions related to the measurement, analysis and reporting of acoustic emissions of the wind turbine shall be well-defined and documented in the test report, as detailed in clause 9.
2 6: Instrumentation 6.1.2: Is the sound level meter (or equivalent) Class 1?
3 6.1.2: Is the microphone diaphragm no greater than 13 mm?
4
6.1.3/6.1.4: Does the sound level meter (or equivalent) have a constant frequency response over at least the frequency range encompassed by the 20 Hz to 10 kHz octave bands? Do these filter meet the requirements of IEC 61260 for class 1 filters? Does the sound level meter (or equivalent) fulfil the relevant requirements for IEC 61672 series class 1 instrumentation in 20 Hz to 11 200 Hz frequency range?
5 6.1.3: Were the equivalent A-weighted continuous sound pressure levels in 1/3-octave bands with centre frequencies from 20 Hz to 10 kHz been determine simultaneously?
6
6.1.5: Was the microphone mounted at the centre of a flat hard board with the diaphragm of the microphone in a plane normal to the board and with the axis of the microphone pointing towards the wind turbine, as in Figure 1 and Figure 2 of the Standard? Was the measurement board circular with a diameter of at least 1,0 m and made from material that is acoustically hard, such as plywood or hard chip-board with a thickness of at least 12,0 mm or metal with a thickness of at least 2,5 mm? If the board is split (i.e. not in one piece); are the pieces level within the same plane, is the gap less than 1 mm, and is the split off the centre line and parallel with the microphone axis as shown in Figure 1a of the Standard?
7
6.1.5: Is the primary windscreen one half of an open cell foam sphere with a diameter of approximately 90 mm, which is centred around the diaphragm of the microphone, as in Figure 2 of the Standard? If a secondary windscreen has been used, has the influence of the secondary windscreen on the frequency response been documented and corrected for in 1/3-octave bands? Has the secondary windscreen been calibrated as per the procedure found in Annex E of the Standard? Does the secondary windscreen comply with the suggestions for design and demands on the insertion loss found in Annex E of the Standard?
8
6.1.6: Was the complete sound measurement system, including any recording, data logging or computing systems, calibrated immediately before and after the measurement session at one or more frequencies using an acoustical calibrator on the microphone? Does the calibrator used fulfil the requirements of IEC 60942:2003 class 1, and was it used within its specified environmental conditions?
9 6.1.7: Was a data recording/playback system included as part of the measurement instrumentation? If used for analysis (other than re-listening), does the entire chain of measurement instruments fulfil the relevant requirements of IEC 61672 series, for class 1 instrumentation?
10
6.2.2: Does the mast mounted anemometer and its signal processing equipment have a maximum deviation from the calibration value of ±0,2 m/s in the wind speed range from 4 m/s to 12 m/s? Is the mast mounted anemometer system capable of measuring the average wind speed over time intervals synchronized with the acoustic measurements?
11 6.2.2: Has the mast mounted anemometer been used for background noise measurements (and not the nacelle anemometer)?
12
6.2.3: If used, does the electric power transducer, including current and voltage transformers, meet the accuracy requirements of IEC 60688 class 1? If a calibrated system was not used for the power signal, has an additional uncertainty of the electrical power been included?

– 6 – IECRE OD-551-15:2018 2019 © IEC 20182019
# Reference to section in standard Requirement from standard Reported /
Inspected Finding
If the power signal has be supplied by the manufacturer, has the uncertainty of the measurement chain been documented by a detailed description of the entire power measurement chain and the corresponding uncertainty components?
13 6.2.4: Was the temperature measured with an accuracy of at least ±1 °C? Was the atmospheric pressure measured with an accuracy of at least ±1 kPa?
14
6.3: Was the following equipment calibrated with traceability to a national or primary standards laboratory within the specified period below? • acoustic calibrator (12 months); • microphone (24 months); • integrating sound level meter (24 months); • spectrum analyzer (36 months); • data recording/playback system (24 months), if used for analysis; • anemometer (24 months); • electric power transducer (24 months), if used; • temperature transducer (24 months) – an internal verification is sufficient if only used to give general information about meteorological conditions during the measurement; • atmospheric pressure transducer (24 months) – an internal verification is sufficient if only used to give general information about meteorological conditions during the measurement. N.B. An instrument shall always be recalibrated if it has been repaired or is suspected of fault or damage.
15 7: Acoustic measurements and measurement procedures
7.1: Were the reference measurement position(s) used in the prevailing downwind direction (+/- 15 degrees) from the turbine during the measurements? (wind direction from yaw position if available)
16
7.1: If the turbine under test is a horizontal axis wind turbine, has R0 been calculated correctly as; rotor centre height above ground (H) + 0.5 * diameter of rotor (D)? – See Figure 4a If the turbine under test is a vertical axis wind turbine, has R0 been calculated correctly as; rotor equatorial plane height above ground (H) + equatorial diameter of rotor (D)? – See Figure 4b Were the reference measurement position(s) as close to R0 as possible and within 20%? Was the reference measurement position distance to the tower centre line measured with an accuracy of 2% or greater?
17 7.1: Have any edges or gaps under the ground board been levelled out using soil or similar? Is the inclination angle (as shown in Figure 4) between 25 and 40 degrees?
18 7.1: Have influences from screen or reflections from obstructions or terrain been minimized? Is the calculated influence from any reflecting structures, such as buildings or walls, less than 0.2 dB?
19 7.2.2: Has the complete measurement chain been calibrated at least at one frequency before and after the measurements and before/after any microphone dis- and reconnection during the measurements?
20 7.2.2: Have all acoustical signals been recorded and stored for later inspection? 7.2.2: Have periods with intruding intermittent background noise (as from aircraft) been omitted?
21 7.2.2: Has the wind speed range been related to the specific wind turbine? Has a minimum hub height wind speed range from 0.8 to 1.3 times the wind speed at 85% of maximum power rounded to wind speed bin centres been measured?
22
7.2.2: With the wind turbine stopped, and using the same measurement set-up, has the background noise been measured immediately before or after each measurement series of wind turbine noise and during similar wind conditions? When measuring background noise, has every effort been made to ensure that the background sound measurements are representative of the background noise that occurred during the wind turbine noise emission measurements?
IECRE OD-551-15:2018 2019 © IEC 20182019 – 7 –
# Reference to section in standard Requirement from standard Reported /
Inspected Finding
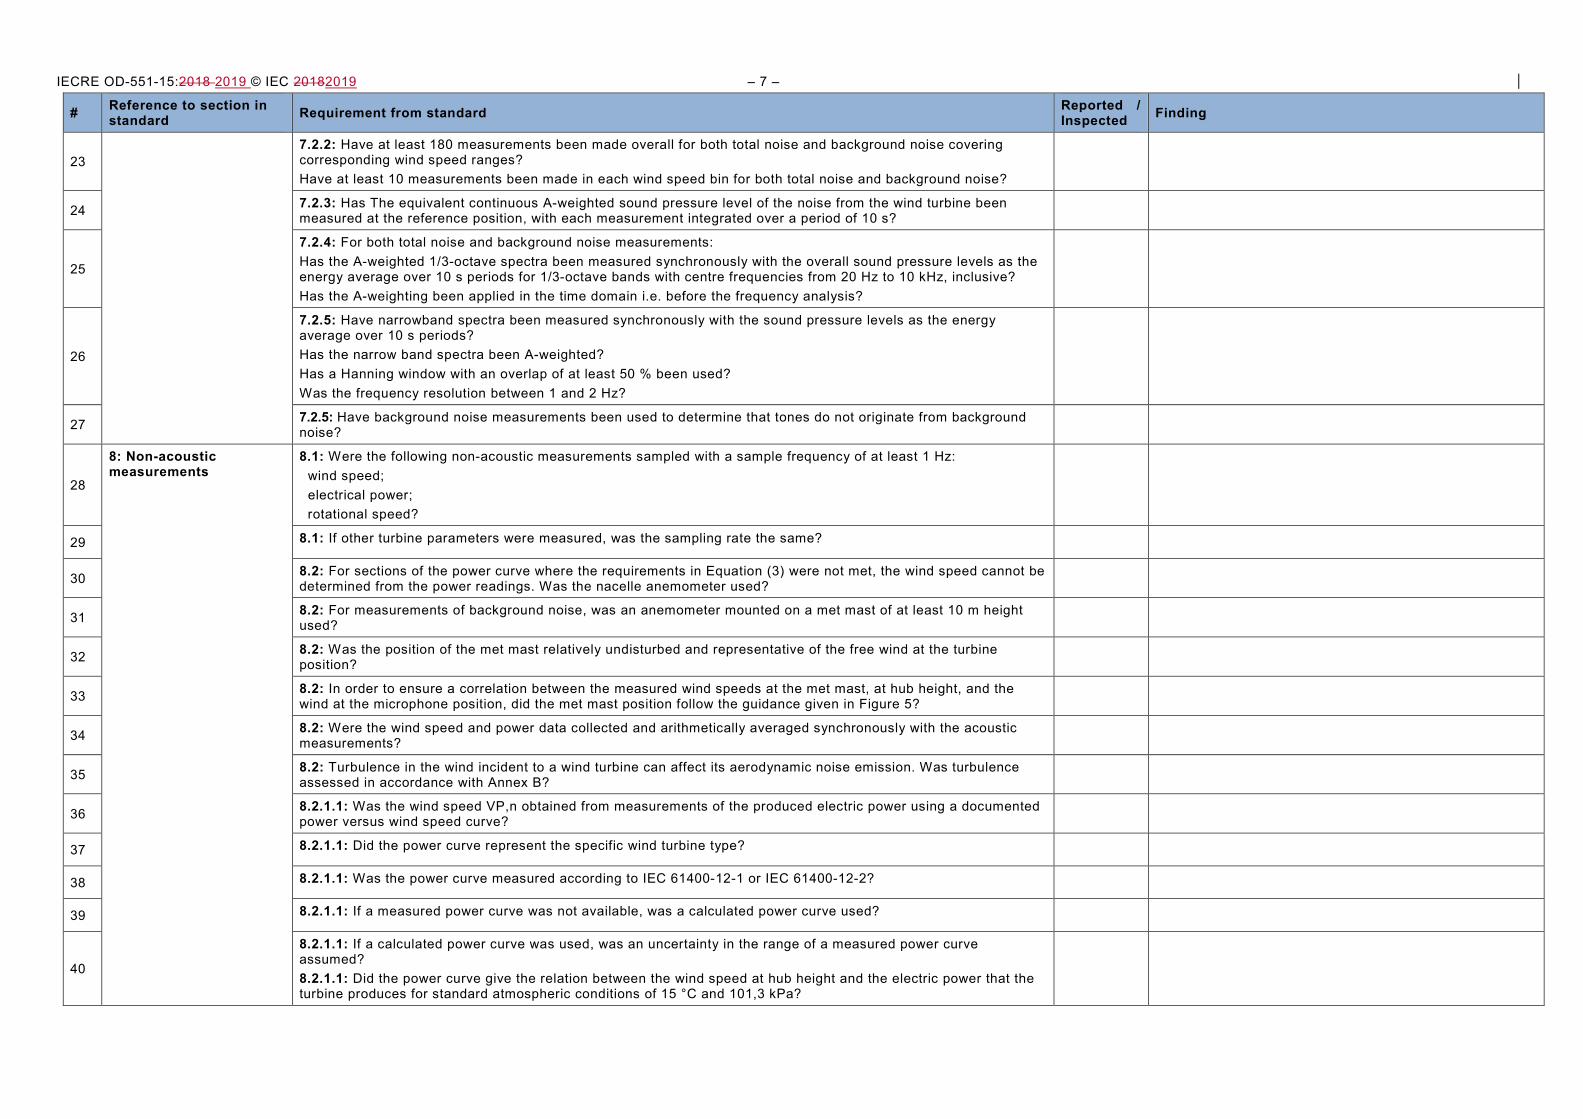
23 7.2.2: Have at least 180 measurements been made overall for both total noise and background noise covering corresponding wind speed ranges? Have at least 10 measurements been made in each wind speed bin for both total noise and background noise?
24 7.2.3: Has The equivalent continuous A-weighted sound pressure level of the noise from the wind turbine been measured at the reference position, with each measurement integrated over a period of 10 s?
25
7.2.4: For both total noise and background noise measurements: Has the A-weighted 1/3-octave spectra been measured synchronously with the overall sound pressure levels as the energy average over 10 s periods for 1/3-octave bands with centre frequencies from 20 Hz to 10 kHz, inclusive? Has the A-weighting been applied in the time domain i.e. before the frequency analysis?
26
7.2.5: Have narrowband spectra been measured synchronously with the sound pressure levels as the energy average over 10 s periods? Has the narrow band spectra been A-weighted? Has a Hanning window with an overlap of at least 50 % been used? Was the frequency resolution between 1 and 2 Hz?
27 7.2.5: Have background noise measurements been used to determine that tones do not originate from background noise?
28
8: Non-acoustic measurements
8.1: Were the following non-acoustic measurements sampled with a sample frequency of at least 1 Hz: wind speed; electrical power; rotational speed?
29 8.1: If other turbine parameters were measured, was the sampling rate the same?
30 8.2: For sections of the power curve where the requirements in Equation (3) were not met, the wind speed cannot be determined from the power readings. Was the nacelle anemometer used?
31 8.2: For measurements of background noise, was an anemometer mounted on a met mast of at least 10 m height used?
32 8.2: Was the position of the met mast relatively undisturbed and representative of the free wind at the turbine position?
33 8.2: In order to ensure a correlation between the measured wind speeds at the met mast, at hub height, and the wind at the microphone position, did the met mast position follow the guidance given in Figure 5?
34 8.2: Were the wind speed and power data collected and arithmetically averaged synchronously with the acoustic measurements?
35 8.2: Turbulence in the wind incident to a wind turbine can affect its aerodynamic noise emission. Was turbulence assessed in accordance with Annex B?
36 8.2.1.1: Was the wind speed VP,n obtained from measurements of the produced electric power using a documented power versus wind speed curve?
37 8.2.1.1: Did the power curve represent the specific wind turbine type?
38 8.2.1.1: Was the power curve measured according to IEC 61400-12-1 or IEC 61400-12-2?
39 8.2.1.1: If a measured power curve was not available, was a calculated power curve used?
40
8.2.1.1: If a calculated power curve was used, was an uncertainty in the range of a measured power curve assumed? 8.2.1.1: Did the power curve give the relation between the wind speed at hub height and the electric power that the turbine produces for standard atmospheric conditions of 15 °C and 101,3 kPa?

– 8 – IECRE OD-551-15:2018 2019 © IEC 20182019
# Reference to section in standard Requirement from standard Reported /
Inspected Finding
41
8.2.1.1: Were the intervals on the power curve that were used all intervals where no duplicated values exist and the slope of the power curve including the uncertainty was positive? The demand on the slope of the power curve is satisfied for any interval on the power curve where the following is fulfilled: (Pk+1 − Ptol ) − (Pk + Ptol ) > 0
42 8.2.1.1: Within power curve intervals meeting this demand, the allowed range of the power curve, was VH,n set equal to VP,n? VH,n is the normalised hub height wind speed.
43 8.2.1.2: For all data points with power levels from the allowed range of the power curve, was the average value of the ratio of the wind speed derived from the power curve VP,n and the measured nacelle wind speed Vnac,m, κnac, derived?
44
8.2.1.2: Was this value then applied to the measured nacelle wind speed for the data points with power levels outside the allowed range of the power curve to derive the normalised wind speed using Equation (4)? Vnac,n = κnacVnac,m (4) where Vnac,m is the wind speed measured with the nacelle anemometer; Vnac,n is the normalised wind speed from the nacelle anemometer, corrected to hub height.
45 8.2.1.2: If Vnac,n took on values in the allowed range of the power curve, was the data point omitted from the analysis?
46 8.2.1.2: Outside the allowed range of the power curve, was VH,n assumed equal to Vnac,n?
47 8.2.2: For background noise measurements, was the wind speed measured with a met mast mounted anemometer at a height of at least 10 m?
48 8.2.2: For in-situ calibration purposes was the wind speed from the met mast measured during the entire measurement?
49 8.2.2: For all data points with power levels from the allowed range of the power curve, was the average value of ratio of the wind speed derived from the power curve VP,n and the measured wind speed VZ,m, κz, derived?
50
8.2.2: Was this ratio then applied to the measured wind speed of the data points achieved during background noise measurements to derive the normalized wind speed using Equation (5)? VB,n = κZ VZ,m (5) where VZ,m is the wind speed measured with an anemometer at height Z of at least 10 m; VB,n is the normalised wind speed at hub height.
51 8.2.2: During background noise measurements was VH,n defined as equal to VB,n?
52 8.3: Was the nacelle position with respect to the measurement board position observed to ensure that only data were used for the analysis, where the measurement board or microphone position was within ±15° of the downwind direction derived from the nacelle position?
53 8.3 (recommended): Was the yaw position from the turbine controller measured simultaneously with the other turbine controller signals?
54 8.4: Were air temperature and pressure measured and recorded at least every 2 h at a height of at least 1,5 m?
55 8.5: Was rotor speed obtained from the wind turbine controller and collected and arithmetically averaged synchronously with the acoustic measurements?
56 8.5 (recommended): Was pitch angle obtained from the wind turbine controller and collected and arithmetically averaged synchronously with the acoustic measurements?
IECRE OD-551-15:2018 2019 © IEC 20182019 – 9 –
# Reference to section in standard Requirement from standard Reported /
Inspected Finding
57 9 Data reduction procedures
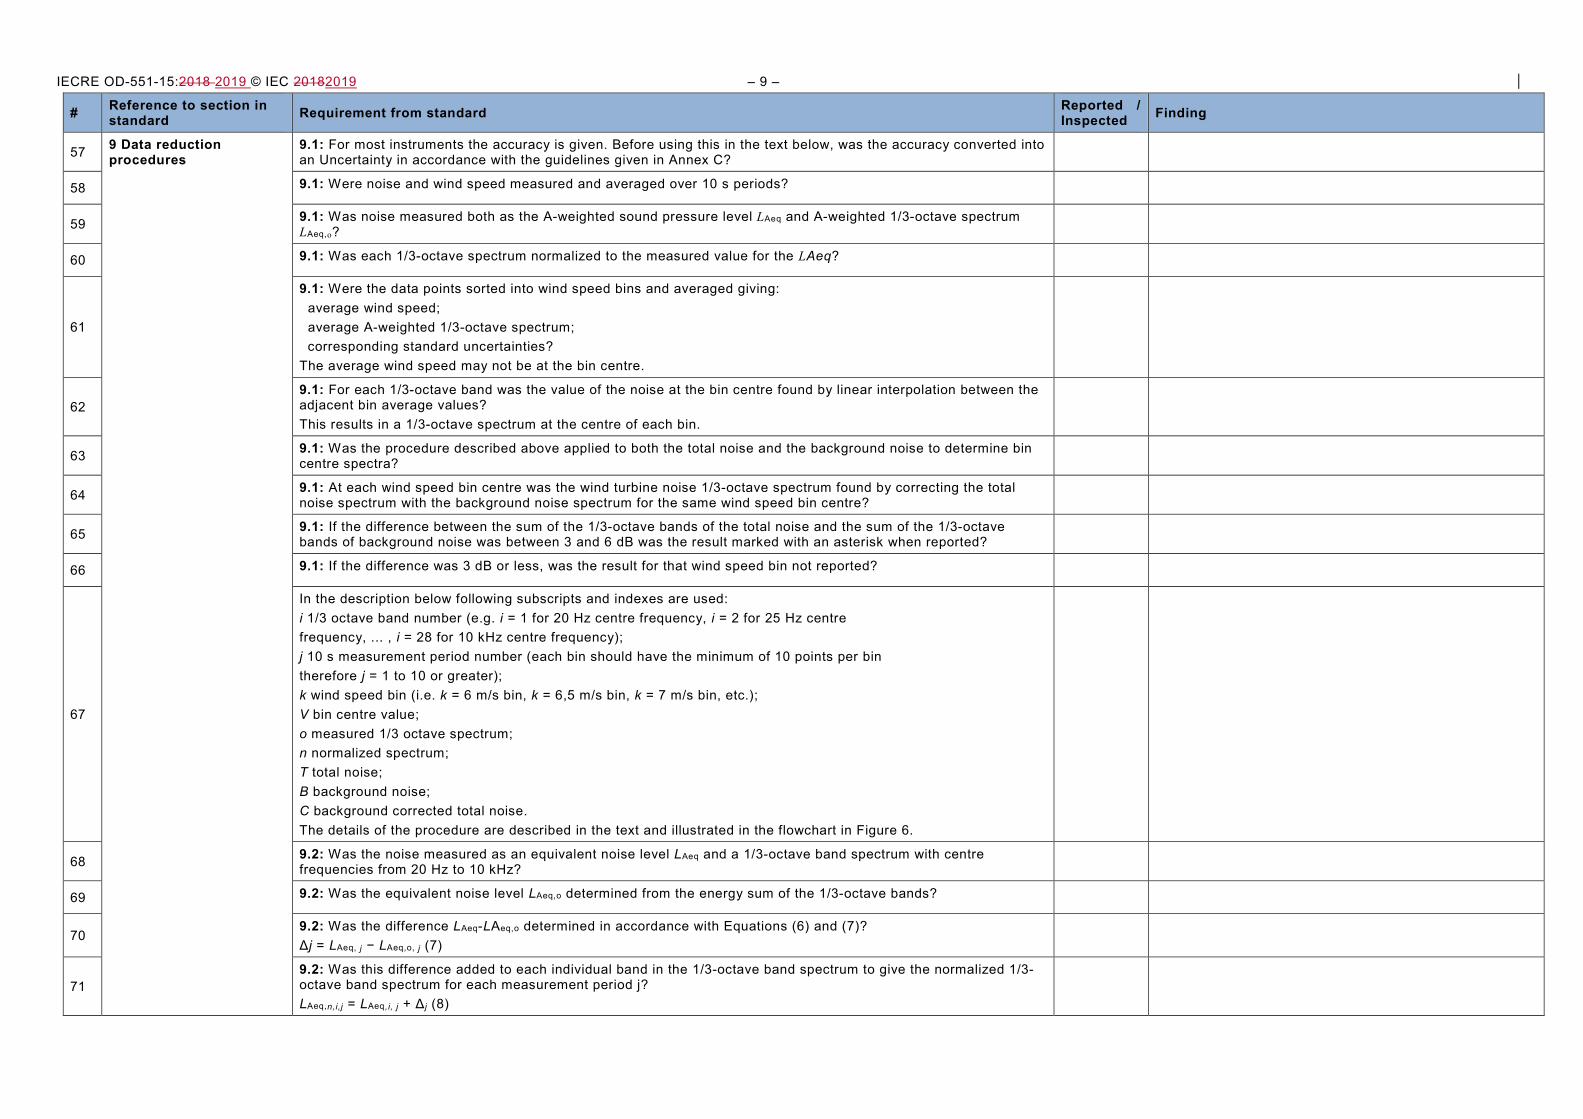
9.1: For most instruments the accuracy is given. Before using this in the text below, was the accuracy converted into an Uncertainty in accordance with the guidelines given in Annex C?
58 9.1: Were noise and wind speed measured and averaged over 10 s periods?
59 9.1: Was noise measured both as the A-weighted sound pressure level LAeq and A-weighted 1/3-octave spectrum LAeq,o?
60 9.1: Was each 1/3-octave spectrum normalized to the measured value for the LAeq?
61
9.1: Were the data points sorted into wind speed bins and averaged giving: average wind speed; average A-weighted 1/3-octave spectrum; corresponding standard uncertainties? The average wind speed may not be at the bin centre.
62 9.1: For each 1/3-octave band was the value of the noise at the bin centre found by linear interpolation between the adjacent bin average values? This results in a 1/3-octave spectrum at the centre of each bin.
63 9.1: Was the procedure described above applied to both the total noise and the background noise to determine bin centre spectra?
64 9.1: At each wind speed bin centre was the wind turbine noise 1/3-octave spectrum found by correcting the total noise spectrum with the background noise spectrum for the same wind speed bin centre?
65 9.1: If the difference between the sum of the 1/3-octave bands of the total noise and the sum of the 1/3-octave bands of background noise was between 3 and 6 dB was the result marked with an asterisk when reported?
66 9.1: If the difference was 3 dB or less, was the result for that wind speed bin not reported?
67
In the description below following subscripts and indexes are used: i 1/3 octave band number (e.g. i = 1 for 20 Hz centre frequency, i = 2 for 25 Hz centre frequency, ... , i = 28 for 10 kHz centre frequency); j 10 s measurement period number (each bin should have the minimum of 10 points per bin therefore j = 1 to 10 or greater); k wind speed bin (i.e. k = 6 m/s bin, k = 6,5 m/s bin, k = 7 m/s bin, etc.); V bin centre value; o measured 1/3 octave spectrum; n normalized spectrum; T total noise; B background noise; C background corrected total noise. The details of the procedure are described in the text and illustrated in the flowchart in Figure 6.
68 9.2: Was the noise measured as an equivalent noise level LAeq and a 1/3-octave band spectrum with centre frequencies from 20 Hz to 10 kHz?
69 9.2: Was the equivalent noise level LAeq,o determined from the energy sum of the 1/3-octave bands?
70 9.2: Was the difference LAeq-LAeq,o determined in accordance with Equations (6) and (7)? Δj = LAeq, j − LAeq,o, j (7)
71 9.2: Was this difference added to each individual band in the 1/3-octave band spectrum to give the normalized 1/3-octave band spectrum for each measurement period j? LAeq,n,i,j = LAeq,i, j + Δj (8)
– 10 – IECRE OD-551-15:2018 2019 © IEC 20182019
# Reference to section in standard Requirement from standard Reported /
Inspected Finding
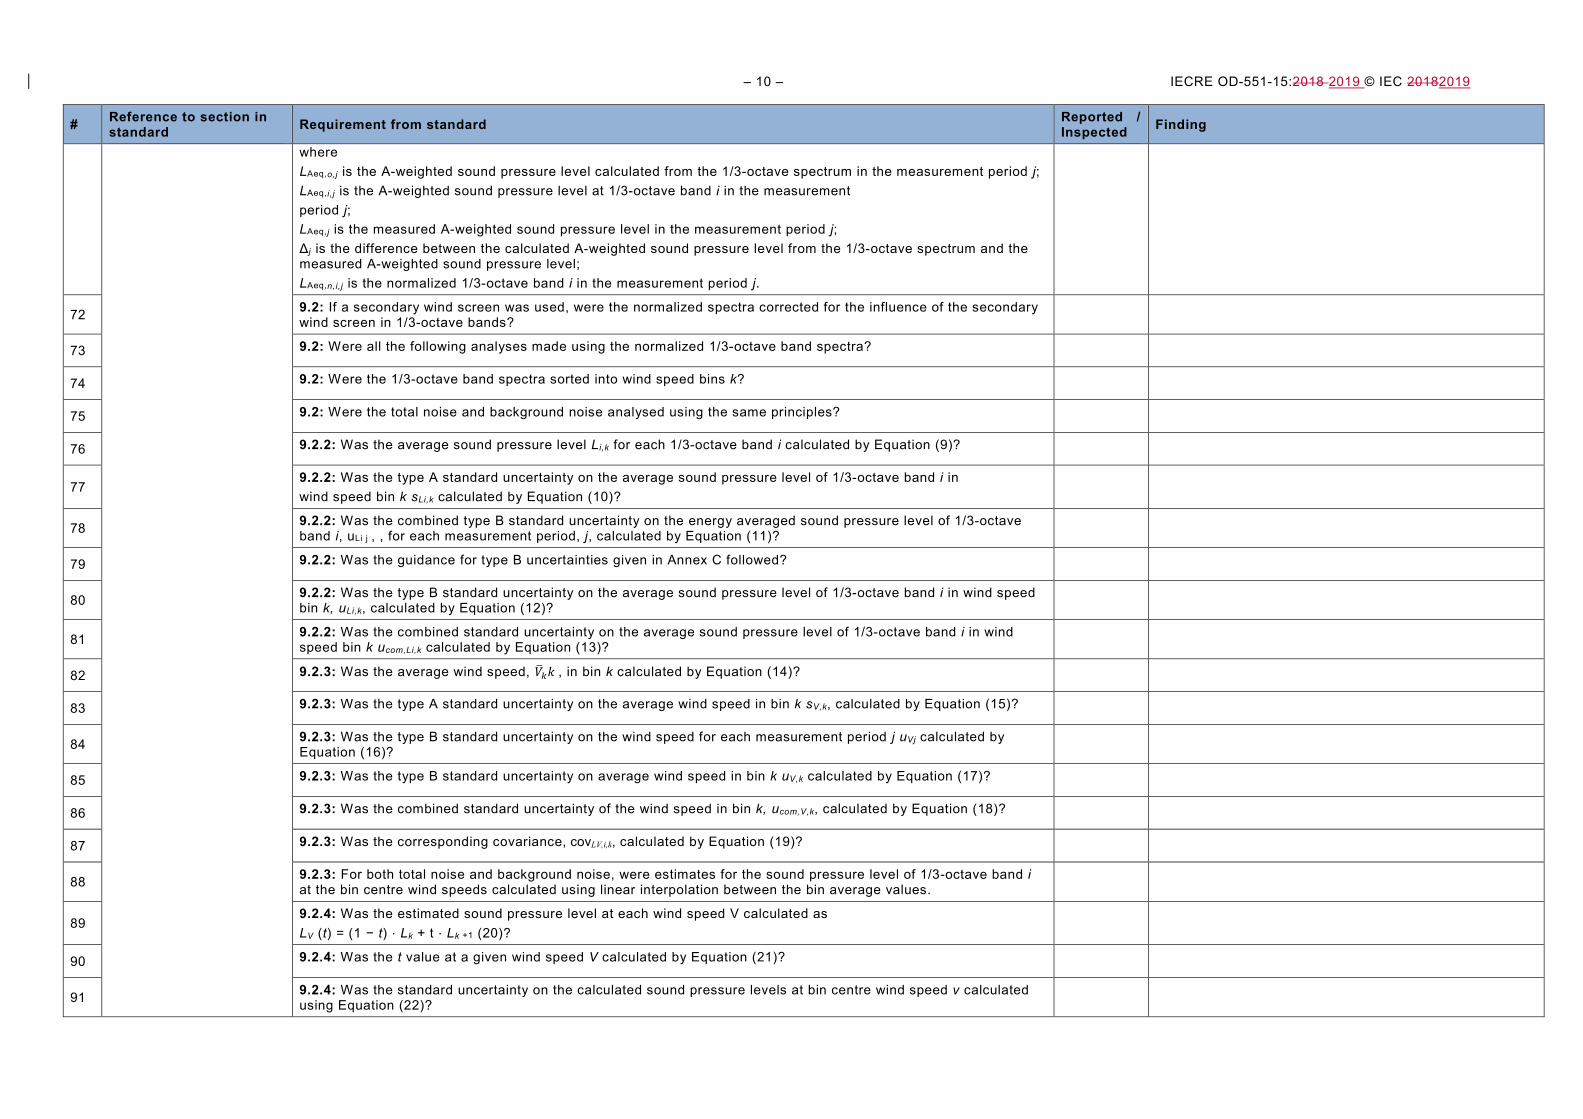
where LAeq,o,j is the A-weighted sound pressure level calculated from the 1/3-octave spectrum in the measurement period j; LAeq, i, j is the A-weighted sound pressure level at 1/3-octave band i in the measurement period j; LAeq, j is the measured A-weighted sound pressure level in the measurement period j; Δj is the difference between the calculated A-weighted sound pressure level from the 1/3-octave spectrum and the measured A-weighted sound pressure level; LAeq,n,i,j is the normalized 1/3-octave band i in the measurement period j.
72 9.2: If a secondary wind screen was used, were the normalized spectra corrected for the influence of the secondary wind screen in 1/3-octave bands?
73 9.2: Were all the following analyses made using the normalized 1/3-octave band spectra?
74 9.2: Were the 1/3-octave band spectra sorted into wind speed bins k?
75 9.2: Were the total noise and background noise analysed using the same principles?
76 9.2.2: Was the average sound pressure level Li,k for each 1/3-octave band i calculated by Equation (9)?
77 9.2.2: Was the type A standard uncertainty on the average sound pressure level of 1/3-octave band i in wind speed bin k sLi,k calculated by Equation (10)?
78 9.2.2: Was the combined type B standard uncertainty on the energy averaged sound pressure level of 1/3-octave band i, uLi j , , for each measurement period, j, calculated by Equation (11)?
79 9.2.2: Was the guidance for type B uncertainties given in Annex C followed?
80 9.2.2: Was the type B standard uncertainty on the average sound pressure level of 1/3-octave band i in wind speed bin k, uLi,k, calculated by Equation (12)?
81 9.2.2: Was the combined standard uncertainty on the average sound pressure level of 1/3-octave band i in wind speed bin k ucom,Li,k calculated by Equation (13)?
82 9.2.3: Was the average wind speed, 𝑉𝑉�𝑘𝑘𝑘𝑘 , in bin k calculated by Equation (14)?
83 9.2.3: Was the type A standard uncertainty on the average wind speed in bin k sV,k, calculated by Equation (15)?
84 9.2.3: Was the type B standard uncertainty on the wind speed for each measurement period j uVj calculated by Equation (16)?
85 9.2.3: Was the type B standard uncertainty on average wind speed in bin k uV,k calculated by Equation (17)?
86 9.2.3: Was the combined standard uncertainty of the wind speed in bin k, ucom,V,k, calculated by Equation (18)?
87 9.2.3: Was the corresponding covariance, covLV,i,k, calculated by Equation (19)?
88 9.2.3: For both total noise and background noise, were estimates for the sound pressure level of 1/3-octave band i at the bin centre wind speeds calculated using linear interpolation between the bin average values.
89 9.2.4: Was the estimated sound pressure level at each wind speed V calculated as LV (t) = (1 − t) ⋅ Lk + t ⋅ Lk +1 (20)?
90 9.2.4: Was the t value at a given wind speed V calculated by Equation (21)?
91 9.2.4: Was the standard uncertainty on the calculated sound pressure levels at bin centre wind speed v calculated using Equation (22)?
IECRE OD-551-15:2018 2019 © IEC 20182019 – 11 –
# Reference to section in standard Requirement from standard Reported /
Inspected Finding
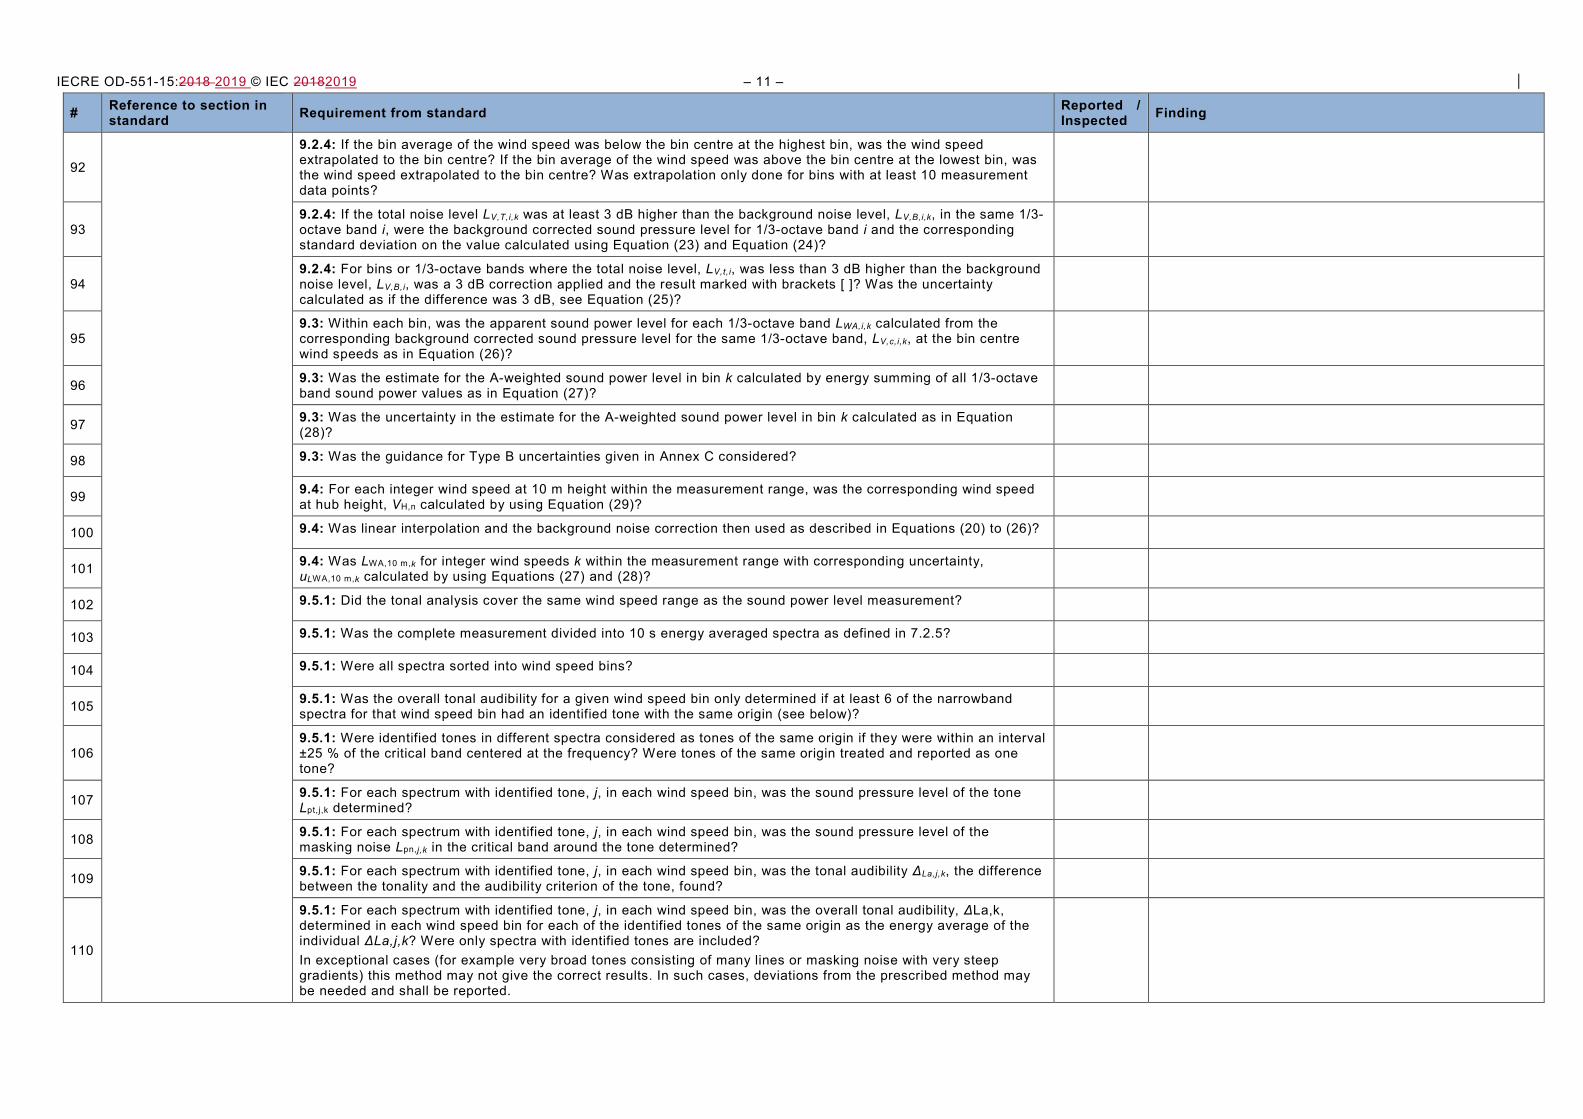
92
9.2.4: If the bin average of the wind speed was below the bin centre at the highest bin, was the wind speed extrapolated to the bin centre? If the bin average of the wind speed was above the bin centre at the lowest bin, was the wind speed extrapolated to the bin centre? Was extrapolation only done for bins with at least 10 measurement data points?
93 9.2.4: If the total noise level LV,T,i,k was at least 3 dB higher than the background noise level, LV,B,i,k, in the same 1/3-octave band i, were the background corrected sound pressure level for 1/3-octave band i and the corresponding standard deviation on the value calculated using Equation (23) and Equation (24)?
94 9.2.4: For bins or 1/3-octave bands where the total noise level, LV,t,i, was less than 3 dB higher than the background noise level, LV,B,i, was a 3 dB correction applied and the result marked with brackets [ ]? Was the uncertainty calculated as if the difference was 3 dB, see Equation (25)?
95 9.3: Within each bin, was the apparent sound power level for each 1/3-octave band LWA,i,k calculated from the corresponding background corrected sound pressure level for the same 1/3-octave band, LV,c,i,k, at the bin centre wind speeds as in Equation (26)?
96 9.3: Was the estimate for the A-weighted sound power level in bin k calculated by energy summing of all 1/3-octave band sound power values as in Equation (27)?
97 9.3: Was the uncertainty in the estimate for the A-weighted sound power level in bin k calculated as in Equation (28)?
98 9.3: Was the guidance for Type B uncertainties given in Annex C considered?
99 9.4: For each integer wind speed at 10 m height within the measurement range, was the corresponding wind speed at hub height, VH,n calculated by using Equation (29)?
100 9.4: Was linear interpolation and the background noise correction then used as described in Equations (20) to (26)?
101 9.4: Was LWA,10 m,k for integer wind speeds k within the measurement range with corresponding uncertainty, uLWA,10 m,k calculated by using Equations (27) and (28)?
102 9.5.1: Did the tonal analysis cover the same wind speed range as the sound power level measurement?
103 9.5.1: Was the complete measurement divided into 10 s energy averaged spectra as defined in 7.2.5?
104 9.5.1: Were all spectra sorted into wind speed bins?
105 9.5.1: Was the overall tonal audibility for a given wind speed bin only determined if at least 6 of the narrowband spectra for that wind speed bin had an identified tone with the same origin (see below)?
106 9.5.1: Were identified tones in different spectra considered as tones of the same origin if they were within an interval ±25 % of the critical band centered at the frequency? Were tones of the same origin treated and reported as one tone?
107 9.5.1: For each spectrum with identified tone, j, in each wind speed bin, was the sound pressure level of the tone Lpt,j,k determined?
108 9.5.1: For each spectrum with identified tone, j, in each wind speed bin, was the sound pressure level of the masking noise Lpn,j,k in the critical band around the tone determined?
109 9.5.1: For each spectrum with identified tone, j, in each wind speed bin, was the tonal audibility ΔLa,j,k, the difference between the tonality and the audibility criterion of the tone, found?
110
9.5.1: For each spectrum with identified tone, j, in each wind speed bin, was the overall tonal audibility, ΔLa,k, determined in each wind speed bin for each of the identified tones of the same origin as the energy average of the individual ΔLa,j,k? Were only spectra with identified tones are included? In exceptional cases (for example very broad tones consisting of many lines or masking noise with very steep gradients) this method may not give the correct results. In such cases, deviations from the prescribed method may be needed and shall be reported.
– 12 – IECRE OD-551-15:2018 2019 © IEC 20182019
# Reference to section in standard Requirement from standard Reported /
Inspected Finding
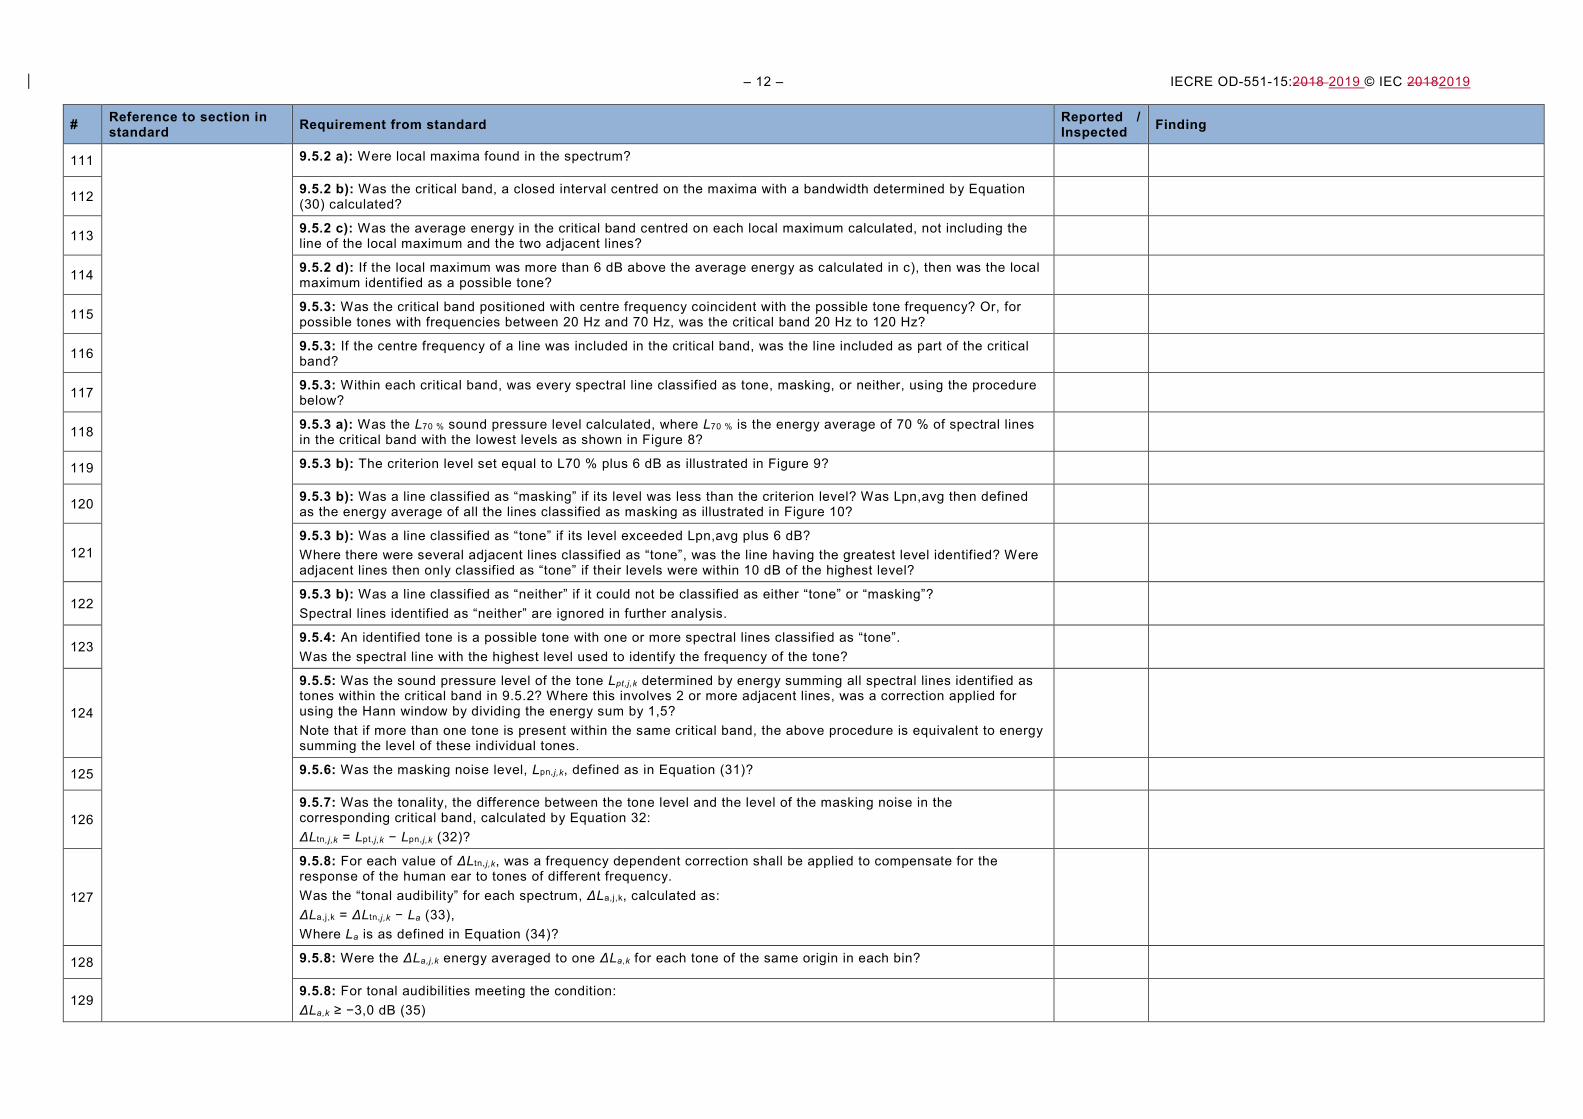
111 9.5.2 a): Were local maxima found in the spectrum?
112 9.5.2 b): Was the critical band, a closed interval centred on the maxima with a bandwidth determined by Equation (30) calculated?
113 9.5.2 c): Was the average energy in the critical band centred on each local maximum calculated, not including the line of the local maximum and the two adjacent lines?
114 9.5.2 d): If the local maximum was more than 6 dB above the average energy as calculated in c), then was the local maximum identified as a possible tone?
115 9.5.3: Was the critical band positioned with centre frequency coincident with the possible tone frequency? Or, for possible tones with frequencies between 20 Hz and 70 Hz, was the critical band 20 Hz to 120 Hz?
116 9.5.3: If the centre frequency of a line was included in the critical band, was the line included as part of the critical band?
117 9.5.3: Within each critical band, was every spectral line classified as tone, masking, or neither, using the procedure below?
118 9.5.3 a): Was the L70 % sound pressure level calculated, where L70 % is the energy average of 70 % of spectral lines in the critical band with the lowest levels as shown in Figure 8?
119 9.5.3 b): The criterion level set equal to L70 % plus 6 dB as illustrated in Figure 9?
120 9.5.3 b): Was a line classified as “masking” if its level was less than the criterion level? Was Lpn,avg then defined as the energy average of all the lines classified as masking as illustrated in Figure 10?
121 9.5.3 b): Was a line classified as “tone” if its level exceeded Lpn,avg plus 6 dB? Where there were several adjacent lines classified as “tone”, was the line having the greatest level identified? Were adjacent lines then only classified as “tone” if their levels were within 10 dB of the highest level?
122 9.5.3 b): Was a line classified as “neither” if it could not be classified as either “tone” or “masking”? Spectral lines identified as “neither” are ignored in further analysis.
123 9.5.4: An identified tone is a possible tone with one or more spectral lines classified as “tone”. Was the spectral line with the highest level used to identify the frequency of the tone?
124
9.5.5: Was the sound pressure level of the tone Lpt,j,k determined by energy summing all spectral lines identified as tones within the critical band in 9.5.2? Where this involves 2 or more adjacent lines, was a correction applied for using the Hann window by dividing the energy sum by 1,5? Note that if more than one tone is present within the same critical band, the above procedure is equivalent to energy summing the level of these individual tones.
125 9.5.6: Was the masking noise level, Lpn, j,k, defined as in Equation (31)?
126 9.5.7: Was the tonality, the difference between the tone level and the level of the masking noise in the corresponding critical band, calculated by Equation 32: ΔLtn,j,k = Lpt, j,k − Lpn, j,k (32)?
127
9.5.8: For each value of ΔLtn, j,k, was a frequency dependent correction shall be applied to compensate for the response of the human ear to tones of different frequency. Was the “tonal audibility” for each spectrum, ΔLa,j,k, calculated as: ΔLa,j,k = ΔLtn,j,k − La (33), Where La is as defined in Equation (34)?
128 9.5.8: Were the ΔLa,j,k energy averaged to one ΔLa,k for each tone of the same origin in each bin?
129 9.5.8: For tonal audibilities meeting the condition: ΔLa,k ≥ −3,0 dB (35)
IECRE OD-551-15:2018 2019 © IEC 20182019 – 13 –
# Reference to section in standard Requirement from standard Reported /
Inspected Finding
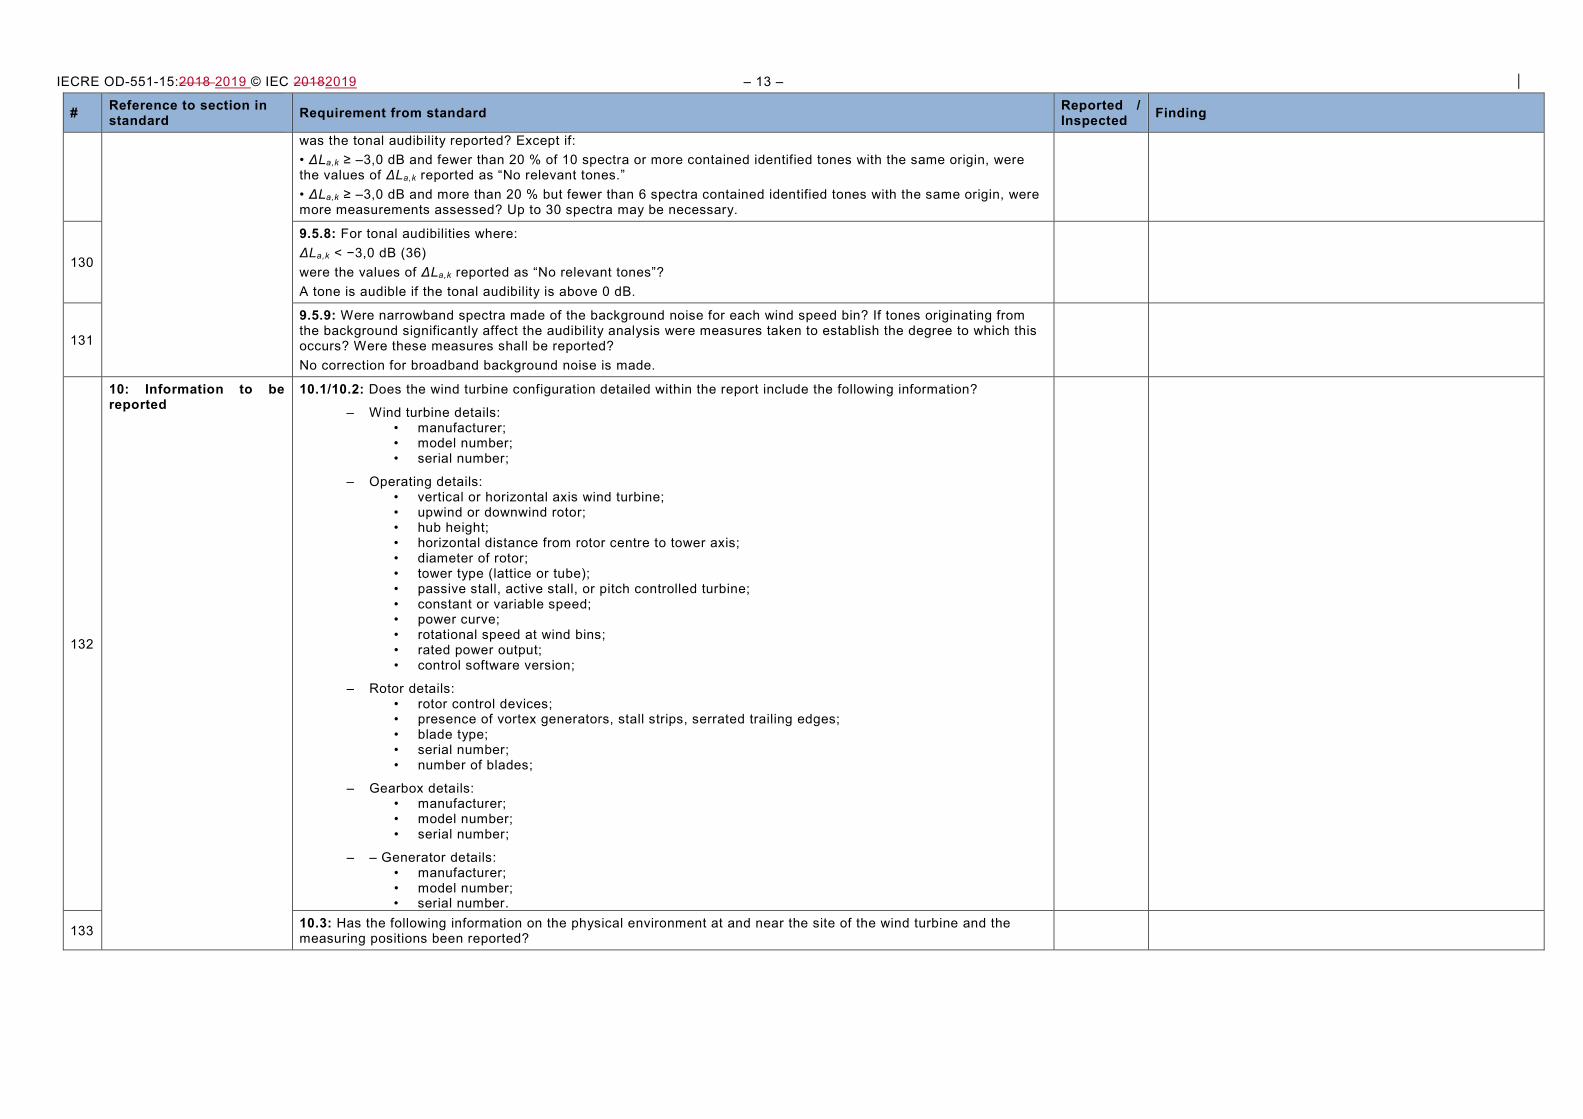
was the tonal audibility reported? Except if: • ΔLa,k ≥ –3,0 dB and fewer than 20 % of 10 spectra or more contained identified tones with the same origin, were the values of ΔLa,k reported as “No relevant tones.” • ΔLa,k ≥ –3,0 dB and more than 20 % but fewer than 6 spectra contained identified tones with the same origin, were more measurements assessed? Up to 30 spectra may be necessary.
130
9.5.8: For tonal audibilities where: ΔLa,k < −3,0 dB (36) were the values of ΔLa,k reported as “No relevant tones”? A tone is audible if the tonal audibility is above 0 dB.
131
9.5.9: Were narrowband spectra made of the background noise for each wind speed bin? If tones originating from the background significantly affect the audibility analysis were measures taken to establish the degree to which this occurs? Were these measures shall be reported? No correction for broadband background noise is made.
132
10: Information to be reported
10.1/10.2: Does the wind turbine configuration detailed within the report include the following information?
– Wind turbine details: • manufacturer; • model number; • serial number;
– Operating details: • vertical or horizontal axis wind turbine; • upwind or downwind rotor; • hub height; • horizontal distance from rotor centre to tower axis; • diameter of rotor; • tower type (lattice or tube); • passive stall, active stall, or pitch controlled turbine; • constant or variable speed; • power curve; • rotational speed at wind bins; • rated power output; • control software version;
– Rotor details: • rotor control devices; • presence of vortex generators, stall strips, serrated trailing edges; • blade type; • serial number; • number of blades;
– Gearbox details: • manufacturer; • model number; • serial number;
– – Generator details: • manufacturer; • model number; • serial number.
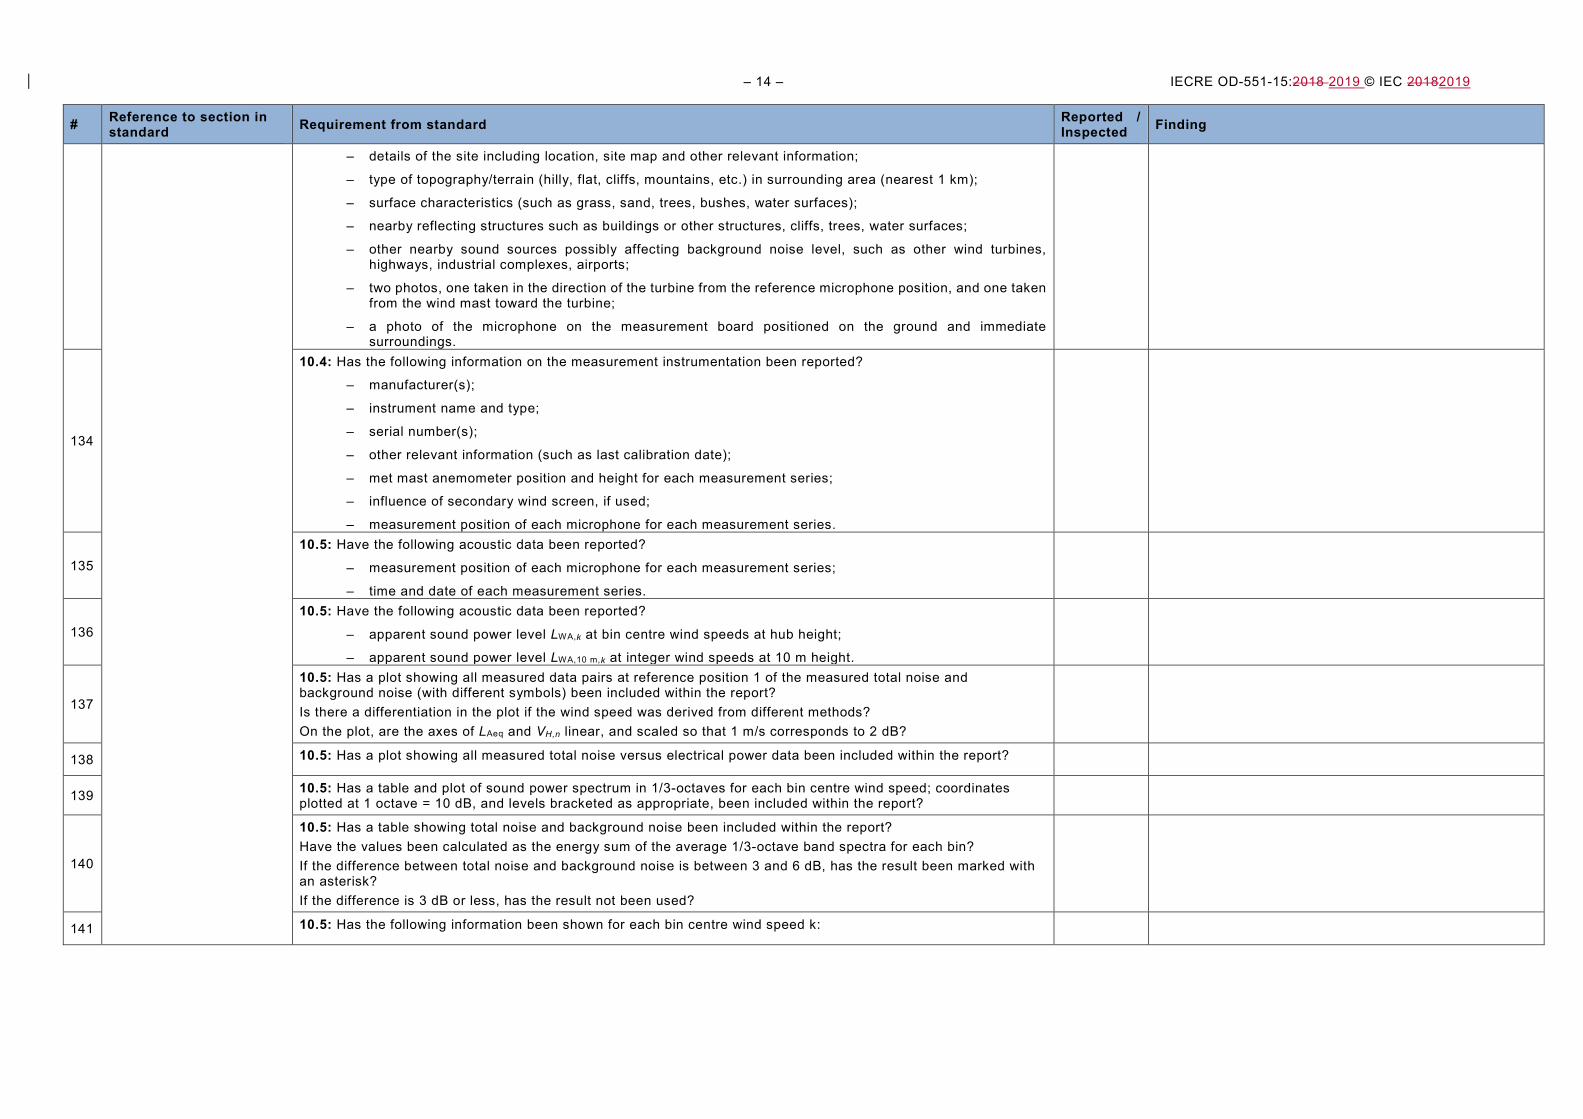
133 10.3: Has the following information on the physical environment at and near the site of the wind turbine and the measuring positions been reported?
– 14 – IECRE OD-551-15:2018 2019 © IEC 20182019
# Reference to section in standard Requirement from standard Reported /
Inspected Finding
– details of the site including location, site map and other relevant information;
– type of topography/terrain (hilly, flat, cliffs, mountains, etc.) in surrounding area (nearest 1 km);
– surface characteristics (such as grass, sand, trees, bushes, water surfaces);
– nearby reflecting structures such as buildings or other structures, cliffs, trees, water surfaces;
– other nearby sound sources possibly affecting background noise level, such as other wind turbines, highways, industrial complexes, airports;
– two photos, one taken in the direction of the turbine from the reference microphone position, and one taken from the wind mast toward the turbine;
– a photo of the microphone on the measurement board positioned on the ground and immediate surroundings.
134
10.4: Has the following information on the measurement instrumentation been reported?
– manufacturer(s);
– instrument name and type;
– serial number(s);
– other relevant information (such as last calibration date);
– met mast anemometer position and height for each measurement series;
– influence of secondary wind screen, if used;
– measurement position of each microphone for each measurement series.
135 10.5: Have the following acoustic data been reported?
– measurement position of each microphone for each measurement series;
– time and date of each measurement series.
136 10.5: Have the following acoustic data been reported?
– apparent sound power level LWA,k at bin centre wind speeds at hub height;
– apparent sound power level LWA,10 m,k at integer wind speeds at 10 m height.
137
10.5: Has a plot showing all measured data pairs at reference position 1 of the measured total noise and background noise (with different symbols) been included within the report? Is there a differentiation in the plot if the wind speed was derived from different methods? On the plot, are the axes of LAeq and VH,n linear, and scaled so that 1 m/s corresponds to 2 dB?
138 10.5: Has a plot showing all measured total noise versus electrical power data been included within the report?
139 10.5: Has a table and plot of sound power spectrum in 1/3-octaves for each bin centre wind speed; coordinates plotted at 1 octave = 10 dB, and levels bracketed as appropriate, been included within the report?
140
10.5: Has a table showing total noise and background noise been included within the report? Have the values been calculated as the energy sum of the average 1/3-octave band spectra for each bin? If the difference between total noise and background noise is between 3 and 6 dB, has the result been marked with an asterisk? If the difference is 3 dB or less, has the result not been used?
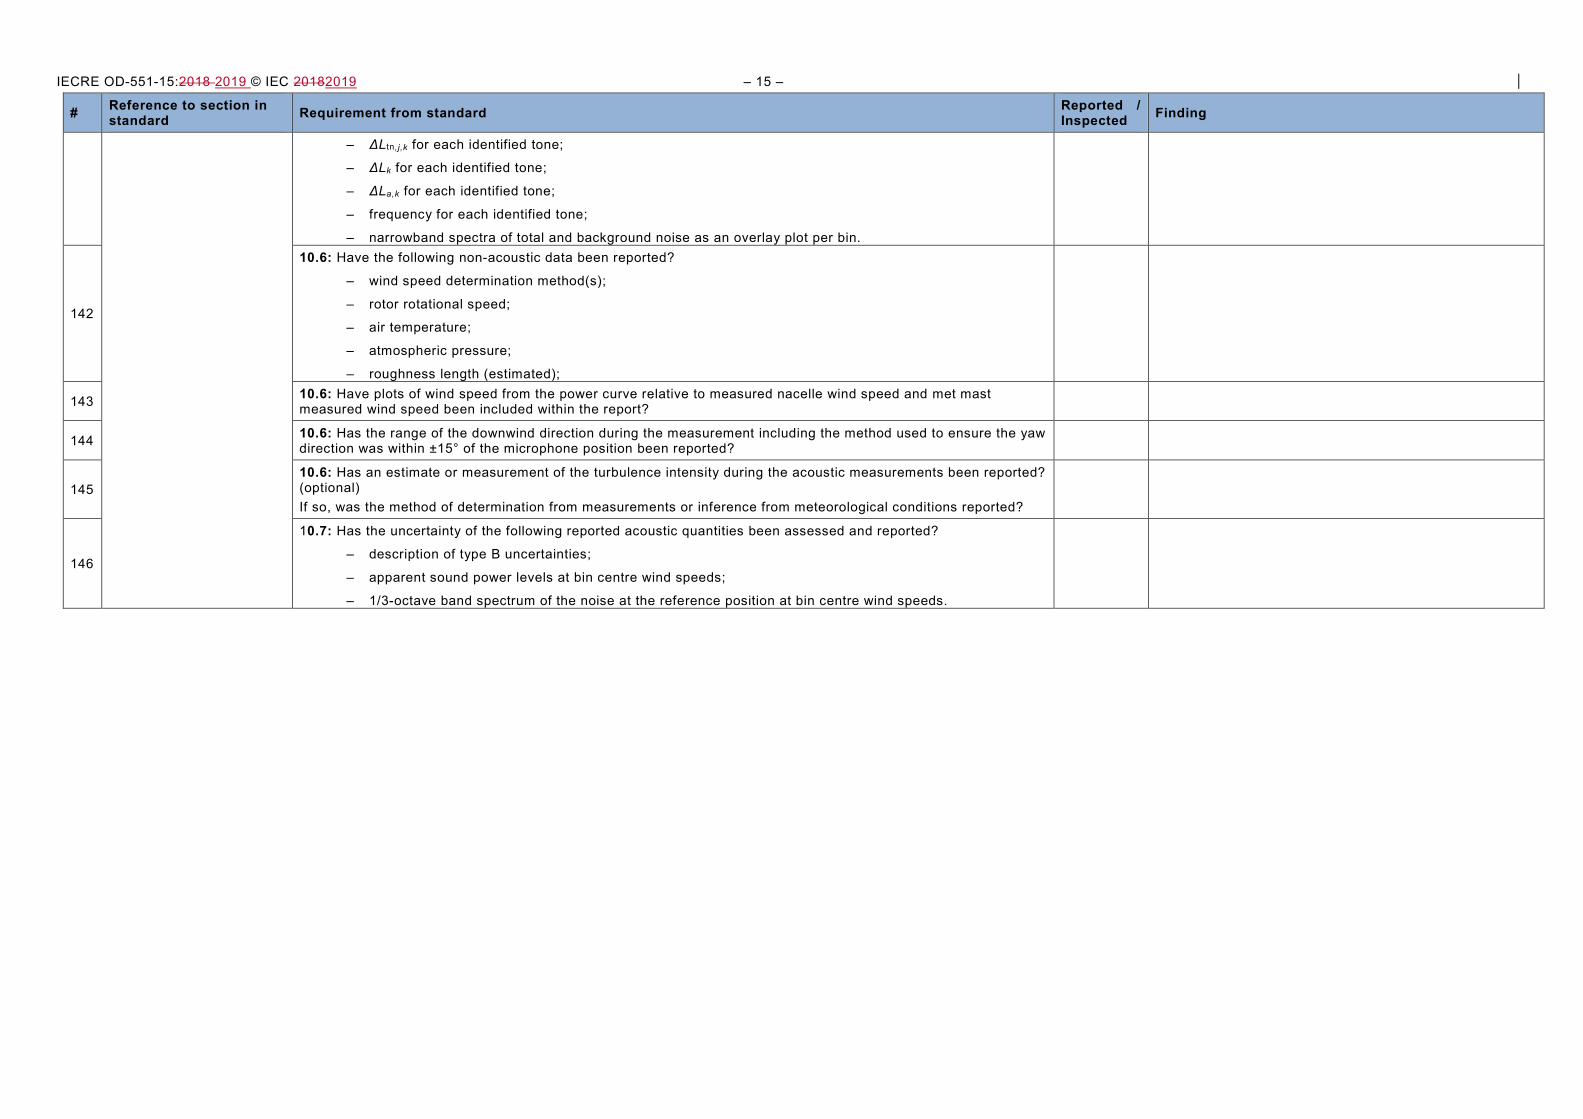
141 10.5: Has the following information been shown for each bin centre wind speed k:
IECRE OD-551-15:2018 2019 © IEC 20182019 – 15 –
# Reference to section in standard Requirement from standard Reported /
Inspected Finding
– ΔLtn,j,k for each identified tone;
– ΔLk for each identified tone;
– ΔLa,k for each identified tone;
– frequency for each identified tone;
– narrowband spectra of total and background noise as an overlay plot per bin.
142
10.6: Have the following non-acoustic data been reported?
– wind speed determination method(s);
– rotor rotational speed;
– air temperature;
– atmospheric pressure;
– roughness length (estimated);
143 10.6: Have plots of wind speed from the power curve relative to measured nacelle wind speed and met mast measured wind speed been included within the report?
144 10.6: Has the range of the downwind direction during the measurement including the method used to ensure the yaw direction was within ±15° of the microphone position been reported?
145 10.6: Has an estimate or measurement of the turbulence intensity during the acoustic measurements been reported? (optional) If so, was the method of determination from measurements or inference from meteorological conditions reported?
146
10.7: Has the uncertainty of the following reported acoustic quantities been assessed and reported?
– description of type B uncertainties;
– apparent sound power levels at bin centre wind speeds;
– 1/3-octave band spectrum of the noise at the reference position at bin centre wind speeds.

INTERNATIONAL IEC SYSTEM FOR CERTIFICATION TO STANDARDS ELECTROTECHNICAL RELATING TO EQUIPMENT FOR USE IN RENEWABLE COMMISSION ENERGY APPLICATIONS (IECRE SYSTEM) IECRE Secretariat c/o IEC 3, rue de Varembé 3, rue de Varembé PO Box 131 PO Box 131 CH-1211 Geneva 20 CH-1211 Geneva 20 Switzerland Switzerland Tel: + 41 22 919 02 11 Tel: + 41 22 919 02 11 [email protected] [email protected] www.iec.ch www.iecre.org