Embed Size (px)
Citation preview
1
IEEE PES Task Force on Benchmark Systems for Stability Controls
Report on the Benchmark System #2 7-bus, 5-machine Equivalent Brazilian System
Version 3 – July 6st, 2015
Leonardo Lima Dinemayer Silva Senior Member Member Kestrel Power Engineering Siemens PTI [email protected] [email protected]
IEEE PES Task Force on Benchmark Systems for Stability Controls PSS/E Report on Benchmark #2
2 0BIntroduction
1. Introduction ........................................................................................................................... 2
2. Power Flow ........................................................................................................................... 2
3. Dynamic Simulation Models ................................................................................................. 6
3.1 Synchronous Machines ................................................................................................. 6
3.2 Excitation Systems ........................................................................................................ 8
3.3 Power System Stabilizers .............................................................................................. 8
4. Simulation Results ............................................................................................................... 10
4.1 50 Mvar Reactor at Ivaiporã Bus ................................................................................ 11
4.2 Step at Itaipu Voltage Reference ................................................................................. 16
4.3 Modal Analysis ........................................................................................................... 21
4.3.1 No PSS .................................................................................................................... 21
4.3.2 PSS at Itaipu ............................................................................................................ 23
4.3.3 PSS at All Machines ................................................................................................ 24
5. References ........................................................................................................................... 25
1. Introduction This report presents the data setup and nonlinear stability study carried over with the 5-
generators equivalent system of the Itaipu 60 Hz transmission system proposed in [1] using the Siemens PTI’s PSS®E software [2]. The main objectives of this report are to document the data setup and to provide some validation of such data, comparing (to the extent possible) the results obtained with a time-domain nonlinear simulation with the eigenvalue analysis shown in [1].
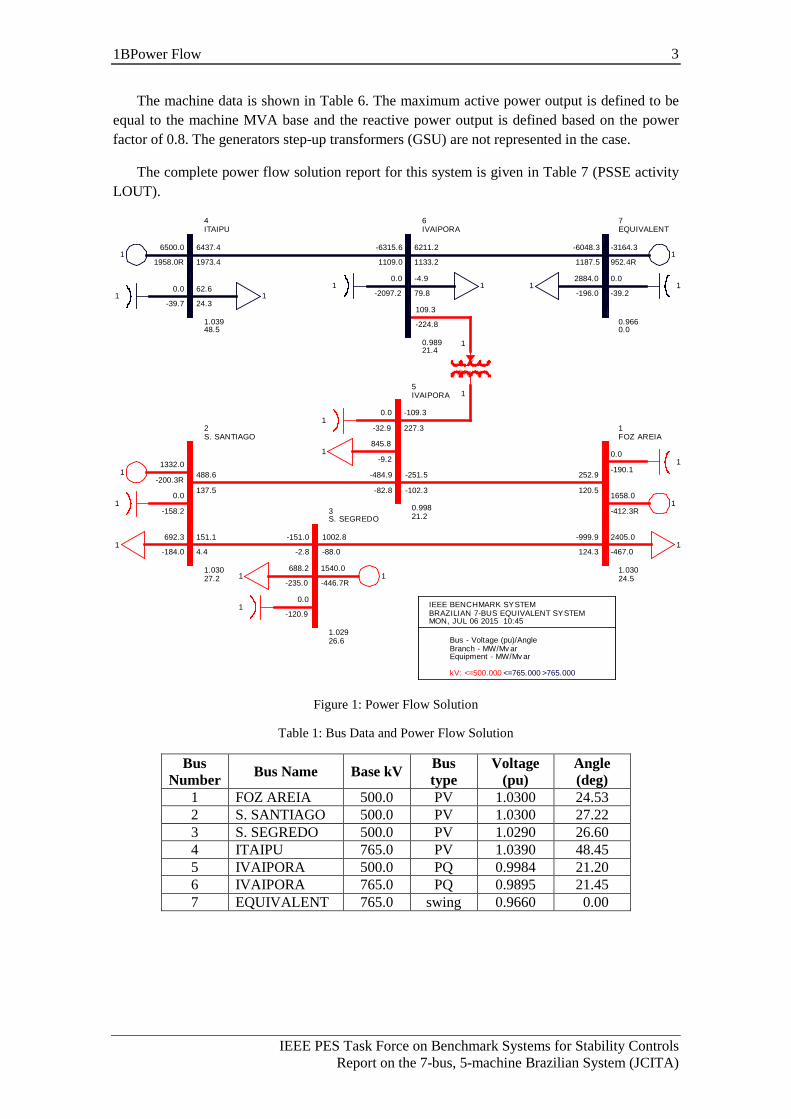
2. Power Flow The power flow solution is shown in the one line diagram in Figure 1. The bus data,
including the power flow solution, are shown in Table 1.
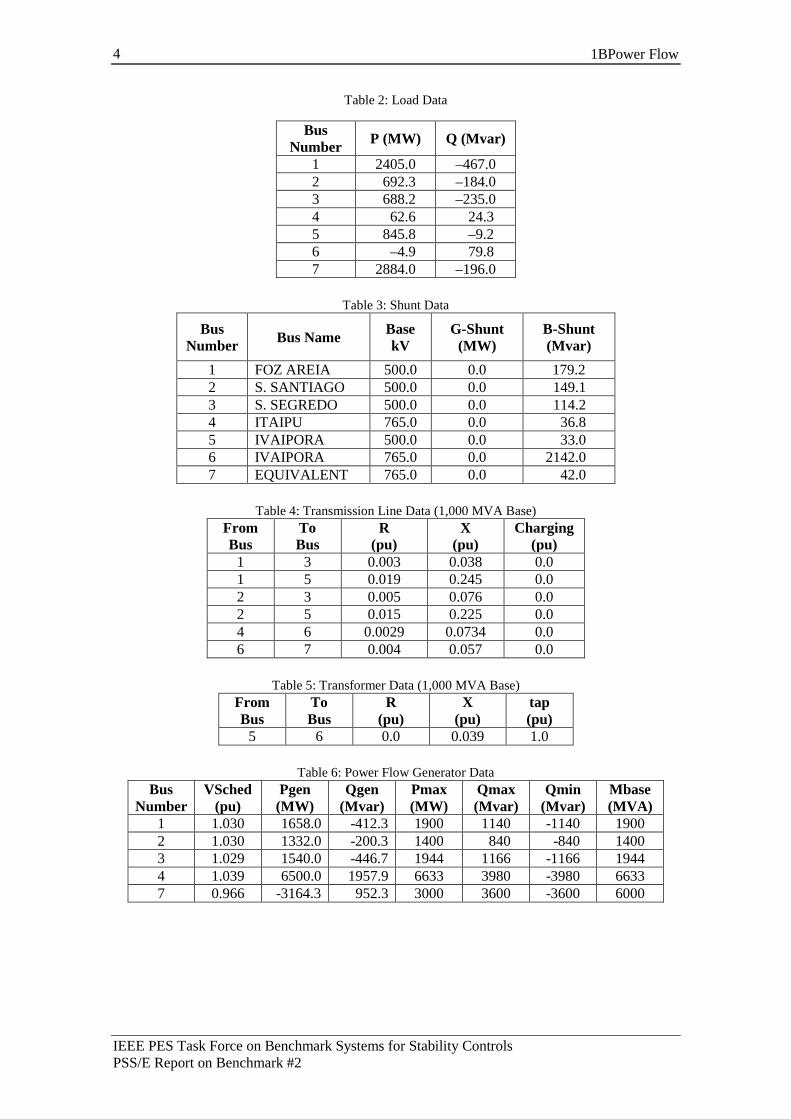
The load data is given in Table 2 and negative loads (active or reactive parts) imply current being injected into the grid. These loads are represented, in the dynamic simulation, with a constant current characteristic for the active power and a constant admittance characteristic for the reactive power (100%I, 100%Z for P and Q, respectively).
The shunt data is shown in Table 3. The values for these capacitors are shown at nominal voltage (1.0 pu voltage).
The transmission line data is shown in Table 4. The data is provided in per unit considering a system MVA base of 1,000 MVA. The lines are represented by series (RL) impedances. The capacitive chargings of the lines have been equivalenced with line and bus reactors and are accounted for in the shunt data shown in Table 3.
The transformer data is given in per unit on system MVA base (1,000 MVA) in Table 5.
IEEE PES Task Force on Benchmark Systems for Stability Controls Report on the 7-bus, 5-machine Brazilian System (JCITA)
3 1BPower Flow
The machine data is shown in Table 6. The maximum active power output is defined to be equal to the machine MVA base and the reactive power output is defined based on the power factor of 0.8. The generators step-up transformers (GSU) are not represented in the case.
The complete power flow solution report for this system is given in Table 7 (PSSE activity LOUT).
Figure 1: Power Flow Solution
Table 1: Bus Data and Power Flow Solution
Bus Number Bus Name Base kV Bus
type Voltage
(pu) Angle (deg)
1 FOZ AREIA 500.0 PV 1.0300 24.53 2 S. SANTIAGO 500.0 PV 1.0300 27.22 3 S. SEGREDO 500.0 PV 1.0290 26.60 4 ITAIPU 765.0 PV 1.0390 48.45 5 IVAIPORA 500.0 PQ 0.9984 21.20 6 IVAIPORA 765.0 PQ 0.9895 21.45 7 EQUIVALENT 765.0 swing 0.9660 0.00
4ITAIPU
1.03948.5
162.6
24.3
6500.0
1958.0R
10.0
-39.7
6IVAIPORA
0.98921.4
-4.9
79.81
0.0
-2097.2
6437.4
1973.4
-6315.6
1109.0
1
5IVAIPORA
0.99821.2
845.8
-9.2
10.0
-32.9
1
1
109.3
-224.8
7EQUIVALENT
0.9660.0
12884.0
-196.0
1-3164.3
952.4R
10.0
-39.2
6211.2
1133.2
-6048.3
1187.51
227.3
1
1FOZ AREIA
1.03024.5
2405.0
-467.0
11658.0
-412.3R
10.0
-190.1252.9
120.5
-251.5
-102.3
2S. SANTIAGO
1.03027.2
1692.3
-184.0
11332.0
-200.3R
10.0
488.6
137.5
-484.9
-82.8
3S. SEGREDO
1.02926.6
688.2
-235.01
1540.0
-446.7R
10.0
-120.9
151.1
4.4
-151.0
-2.8
-999.9
124.3
1002.8
-88.0
-158.2
1
1
-109.3
IEEE BENCHMARK SYSTEMBRAZILIAN 7-BUS EQUIVALENT SYSTEMMON, JUL 06 2015 10:45
Bus - Voltage (pu)/AngleBranch - MW/Mv arEquipment - MW/Mv ar
kV: <=500.000 <=765.000 >765.000
IEEE PES Task Force on Benchmark Systems for Stability Controls PSS/E Report on Benchmark #2
4 1BPower Flow
Table 2: Load Data
Bus Number P (MW) Q (Mvar)
1 2405.0 –467.0 2 692.3 –184.0 3 688.2 –235.0 4 62.6 24.3 5 845.8 –9.2 6 –4.9 79.8 7 2884.0 –196.0
Table 3: Shunt Data
Bus Number Bus Name Base
kV G-Shunt
(MW) B-Shunt (Mvar)
1 FOZ AREIA 500.0 0.0 179.2 2 S. SANTIAGO 500.0 0.0 149.1 3 S. SEGREDO 500.0 0.0 114.2 4 ITAIPU 765.0 0.0 36.8 5 IVAIPORA 500.0 0.0 33.0 6 IVAIPORA 765.0 0.0 2142.0 7 EQUIVALENT 765.0 0.0 42.0
Table 4: Transmission Line Data (1,000 MVA Base)
From Bus
To Bus
R (pu)
X (pu)
Charging (pu)
1 3 0.003 0.038 0.0 1 5 0.019 0.245 0.0 2 3 0.005 0.076 0.0 2 5 0.015 0.225 0.0 4 6 0.0029 0.0734 0.0 6 7 0.004 0.057 0.0
Table 5: Transformer Data (1,000 MVA Base)
From Bus
To Bus
R (pu)
X (pu)
tap (pu)
5 6 0.0 0.039 1.0
Table 6: Power Flow Generator Data Bus
Number VSched
(pu) Pgen (MW)
Qgen (Mvar)
Pmax (MW)
Qmax (Mvar)
Qmin (Mvar)
Mbase (MVA)
1 1.030 1658.0 -412.3 1900 1140 -1140 1900 2 1.030 1332.0 -200.3 1400 840 -840 1400 3 1.029 1540.0 -446.7 1944 1166 -1166 1944 4 1.039 6500.0 1957.9 6633 3980 -3980 6633 7 0.966 -3164.3 952.3 3000 3600 -3600 6000
IEEE PES Task Force on Benchmark Systems for Stability Controls Report on the 7-bus, 5-machine Brazilian System (JCITA)
5 1BPower Flow
Table 7: PSS®E Power Flow Results
PTI INTERACTIVE POWER SYSTEM SIMULATOR--PSS(R)E WED, OCT 02 2013 10:17
PTI INTERACTIVE POWER SYSTEM SIMULATOR--PSS(R)E SUN, OCT 06 2013 16:48
IEEE BENCHMARK SYSTEM %MVA FOR TRANSFORMERS
BRAZILIAN 7-BUS EQUIVALENT SYSTEM %MVA FOR NON-TRANSFORMER BRANCHES
X------- FROM BUS ------X AREA VOLT GEN LOAD SHUNT X---------- TO BUS ----------X TRANSFORMER
BUS# X-- NAME --X BASKV ZONE PU/KV ANGLE MW/MVAR MW/MVAR MW/MVAR BUS# X-- NAME --X BASKV AREA CKT MW MVAR RATIO ANGLE
1 FOZ AREIA 500.00 1 1.0300 24.5 1658.0 2405.0 0.0 ------------------------------------------------------------------
1 515.00 -412.3R -467.0 -190.1 3 S. SEGREDO 500.00 1 1 -999.9 124.3
5 IVAIPORA 500.00 1 1 252.9 120.5
2 S. SANTIAGO 500.00 1 1.0300 27.2 1332.0 692.3 0.0 ------------------------------------------------------------------
1 515.00 -200.3R -184.0 -158.2 3 S. SEGREDO 500.00 1 1 151.1 4.4
5 IVAIPORA 500.00 1 1 488.6 137.5
3 S. SEGREDO 500.00 1 1.0290 26.6 1540.0 688.2 0.0 ------------------------------------------------------------------
1 514.50 -446.7R -235.0 -120.9 1 FOZ AREIA 500.00 1 1 1002.8 -88.0
2 S. SANTIAGO 500.00 1 1 -151.0 -2.8
4 ITAIPU 765.00 2 1.0390 48.5 6500.0 62.6 0.0 ------------------------------------------------------------------
1 794.84 1958.0R 24.3 -39.7 6 IVAIPORA 765.00 2 1 6437.4 1973.4
5 IVAIPORA 500.00 1 0.9984 21.2 0.0 845.8 0.0 ------------------------------------------------------------------
1 499.18 0.0 -9.2 -32.9 1 FOZ AREIA 500.00 1 1 -251.5 -102.3
2 S. SANTIAGO 500.00 1 1 -484.9 -82.8
6 IVAIPORA 765.00 2 1 -109.3 227.3 1.000UN
6 IVAIPORA 765.00 2 0.9895 21.4 0.0 -4.9 0.0 ------------------------------------------------------------------
1 756.96 0.0 79.8 -2097.2 4 ITAIPU 765.00 2 1 -6315.6 1109.0
5 IVAIPORA 500.00 1 1 109.3 -224.8 1.000LK
7 EQUIVALENT 765.00 3 1 6211.2 1133.2
7 EQUIVALENT 765.00 3 0.9660 0.0 -3164.3 2884.0 0.0 ------------------------------------------------------------------
1 738.99 952.4R -196.0 -39.2 6 IVAIPORA 765.00 2 1 -6048.3 1187.5
IEEE PES Task Force on Benchmark Systems for Stability Controls PSS/E Report on Benchmark #2
6 2BDynamic Simulation Models
3. Dynamic Simulation Models The models and associated parameters for the dynamic simulation models used in this
PSS®E setup are described in this Section. All generation units are represented by the salient-pole generator model GENSAE (5th order model). The excitation systems are represented by the simplified model SEXS, and the power system stabilizers are modeled by the speed-based single-input model IEEEST.
3.1 Synchronous Machines The generator model to represent the salient pole units is the PSS®E model GENSAE,
shown in the block diagram in Figure 2. Details about the implementation of the model are available in the software documentation [2]. This is a 5th order dynamic model with the saturation function represented as a geometric (exponential) function.
The details associated with the representation of the saturation of the generators should not dramatically interfere with the results of a small-signal (linearized) analysis of the system performance. On the other hand, the proper representation of saturation is extremely important for transient stability and the determination of rated and ceiling conditions (minimum and maximum generator field current and generator field voltage) for the excitation system. The saturation factors S(1.0) and S(1.2) shown in Table 8 essentially neglect saturation effects.
The parameters for the model are presented in Table 8. Speed damping D is set to zero for all generators, as should be the case when using sub-transient generator models. Table 8 also presents the calculated rated field current (considering 0.80 rated power factor). This calculation comprises the initialization of the generators models at full (rated) power output, considering their rated power factor. It should be noted that in PSS®E models, due to the choice of base values for generator field voltage and generator field current, these variables are numerically the same, in steady state, when expressed in per unit (pu).
Table 8: Dynamic Model Data for Salient Pole Units (PSS®E Model GENSAE)
Parameters Buses Description Symbol Unit 1
FOZ AREIA 2
S. SANTIAGO Rated apparent power MBASE MVA 1900 1400 d-axis open circuit transient time constant T'do s 5.0 5.0 d-axis open circuit sub-transient time constant T''do s 0.053 0.053 q-axis open circuit sub-transient time constant T''qo s 0.123 0.123 Inertia H MW.s/MVA 4.5 4.5 Speed damping D pu 0.0 0.0 d-axis synchronous reactance Xd pu 0.85 0.85 q-axis synchronous reactance Xq pu 0.7 0.7 d-axis transient reactance X'd pu 0.3 0.3 sub-transient reactance X''d = X''q pu 0.2 0.2 Leakage reactance Xℓ pu 0.15 0.15 Saturation factor at 1.0 pu voltage S(1.0) – 0.001 0.001 Saturation factor at 1.2 pu voltage S(1.2) – 0.01 0.01 Rated field current IFDrated pu 1.66 1.66
IEEE PES Task Force on Benchmark Systems for Stability Controls Report on the 7-bus, 5-machine Brazilian System (JCITA)
7 2BDynamic Simulation Models
Table 8 (cont.): Dynamic Model Data for Salient Pole Units (PSS®E Model GENSAE)
Parameters Buses
Symbol Unit 3 S. SEGREDO
4 ITAIPU
7 EQUIVALENT
MBASE MVA 1944 6633 6000 T'do s 5.0 7.6 8.0 T''do s 0.06 0.09 0.09 T''qo s 0.09 0.19 0.2 H MW.s/MVA 4.5 5.07 5.0 D pu 0.0 0.0 0.0 Xd pu 0.88 0.9 1.0 Xq pu 0.69 0.68 0.7 X'd pu 0.3 0.3 0.3
X''d = X''q pu 0.2 0.24 0.25 Xℓ pu 0.15 0.18 0.18
S(1.0) – 0.001 0.001 0.001 S(1.2) – 0.01 0.01 0.01 IFDrated pu 1.68 1.70 1.79
Figure 2: Block Diagram for the Salient Pole Generator (PSS®E Model GENSAE)
IEEE PES Task Force on Benchmark Systems for Stability Controls PSS/E Report on Benchmark #2
8 2BDynamic Simulation Models
3.2 Excitation Systems All excitation systems are considered identical and will be represented by the same dynamic
model and parameters. The PSS®E simplified excitation system model SEXS [2], shown in Figure 3, is used. The parameters for the model are presented in Table 9. The limits Emax and Emin are set to reasonably large values, so they should not interfere and affect small-signal stability results.
Figure 3: Block Diagram for the PSS®E Model SEXS
Table 9: Dynamic Model Data for the Simple Excitation System (PSS®E Model SEXS)
Parameters Description Symbol Value Unit
TGR block 1 transient gain TA/TB 1 – TGR block 1 denominator time constant TB 1 s Exciter gain K 30 pu Exciter time constant TE 0.05 s Max. AVR output Emin –4 pu Min. AVR output Emax 5 pu
3.3 Power System Stabilizers This Benchmark system considers power system stabilizers (PSS) in all machines except the
machine connected to bus #7 (EQUIVALENT). All PSSs are derived from rotor speed deviation and have the same structure, two lead-lag blocks, one wash-out block, and a gain.
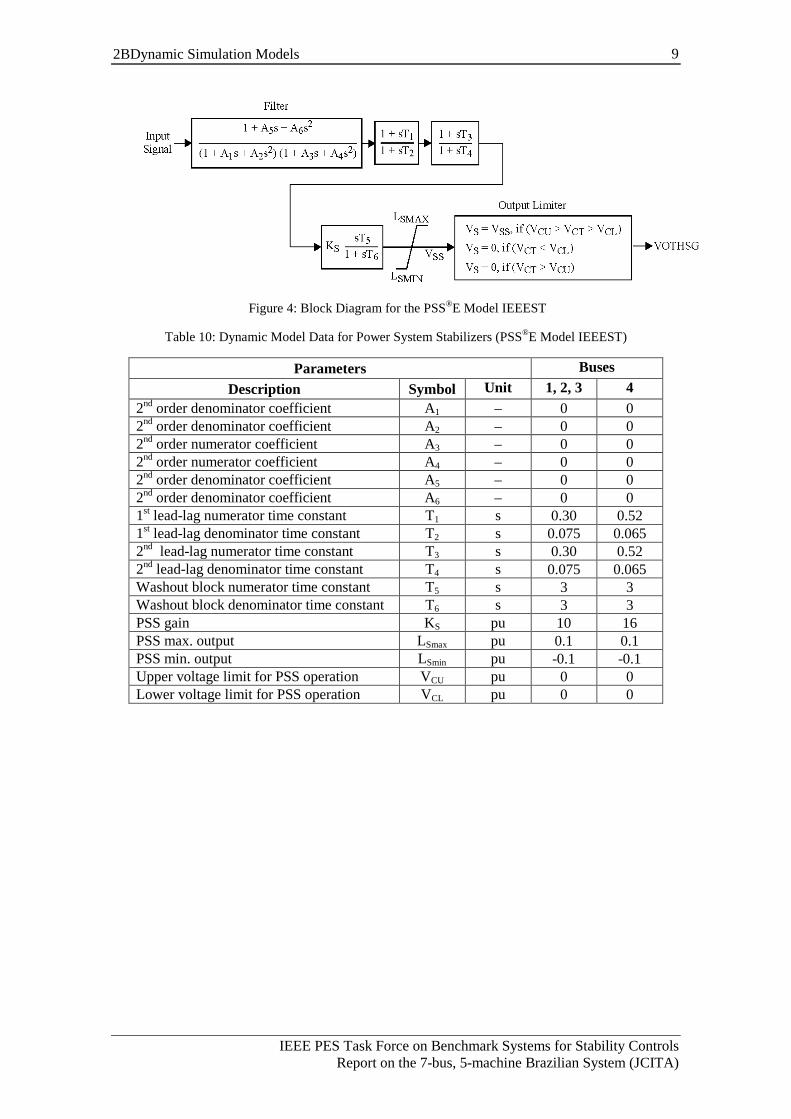
The IEEE Std. 421.5(2005) model PSS1A [5] will be used to represent the power system stabilizers. This model can be represented in PSS®E by the IEEEST model [2]. The block diagram of the IEEEST model is shown in Figure 4 and the parameters are given in Table 10. It should be noted that the parameters A1 to A6 are set in a way that leads to the whole filter block to be bypassed.
The output limits were set to +/– 10%, while the logic to switch off the PSS for voltages outside a normal operation range has been ignored (parameters VCU and VCL set to zero). The input signal is rotor speed deviation.
IEEE PES Task Force on Benchmark Systems for Stability Controls Report on the 7-bus, 5-machine Brazilian System (JCITA)
9 2BDynamic Simulation Models
Figure 4: Block Diagram for the PSS®E Model IEEEST
Table 10: Dynamic Model Data for Power System Stabilizers (PSS®E Model IEEEST)
Parameters Buses Description Symbol Unit 1, 2, 3 4
2nd order denominator coefficient A1 – 0 0 2nd order denominator coefficient A2 – 0 0 2nd order numerator coefficient A3 – 0 0 2nd order numerator coefficient A4 – 0 0 2nd order denominator coefficient A5 – 0 0 2nd order denominator coefficient A6 – 0 0 1st lead-lag numerator time constant T1 s 0.30 0.52 1st lead-lag denominator time constant T2 s 0.075 0.065 2nd lead-lag numerator time constant T3 s 0.30 0.52 2nd lead-lag denominator time constant T4 s 0.075 0.065 Washout block numerator time constant T5 s 3 3 Washout block denominator time constant T6 s 3 3 PSS gain KS pu 10 16 PSS max. output LSmax pu 0.1 0.1 PSS min. output LSmin pu -0.1 -0.1 Upper voltage limit for PSS operation VCU pu 0 0 Lower voltage limit for PSS operation VCL pu 0 0
IEEE PES Task Force on Benchmark Systems for Stability Controls PSS/E Report on Benchmark #2
10 3BSimulation Results
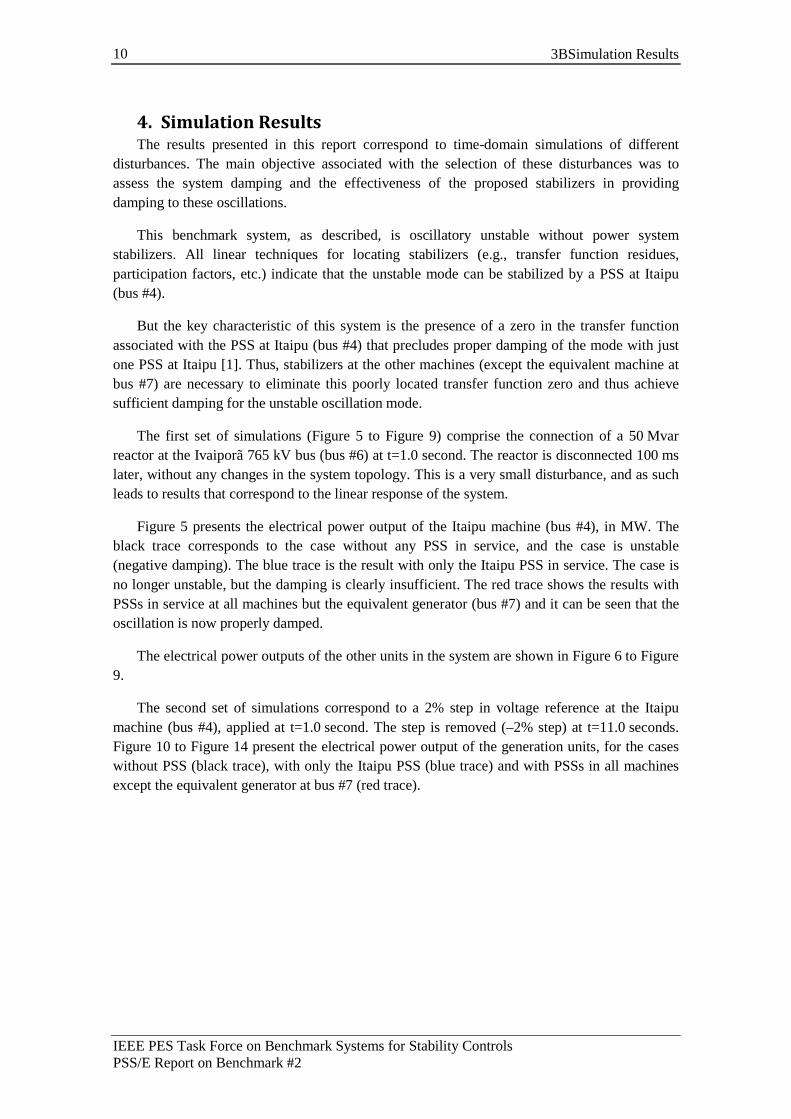
4. Simulation Results The results presented in this report correspond to time-domain simulations of different
disturbances. The main objective associated with the selection of these disturbances was to assess the system damping and the effectiveness of the proposed stabilizers in providing damping to these oscillations.
This benchmark system, as described, is oscillatory unstable without power system stabilizers. All linear techniques for locating stabilizers (e.g., transfer function residues, participation factors, etc.) indicate that the unstable mode can be stabilized by a PSS at Itaipu (bus #4).
But the key characteristic of this system is the presence of a zero in the transfer function associated with the PSS at Itaipu (bus #4) that precludes proper damping of the mode with just one PSS at Itaipu [1]. Thus, stabilizers at the other machines (except the equivalent machine at bus #7) are necessary to eliminate this poorly located transfer function zero and thus achieve sufficient damping for the unstable oscillation mode.
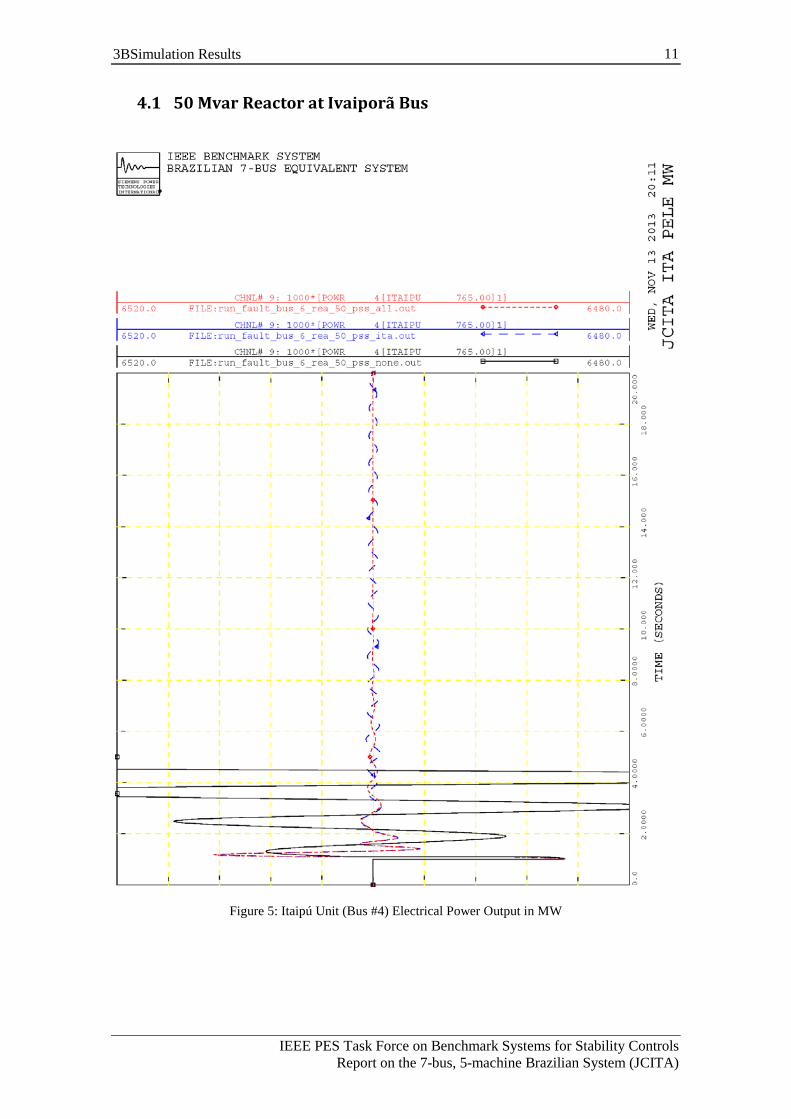
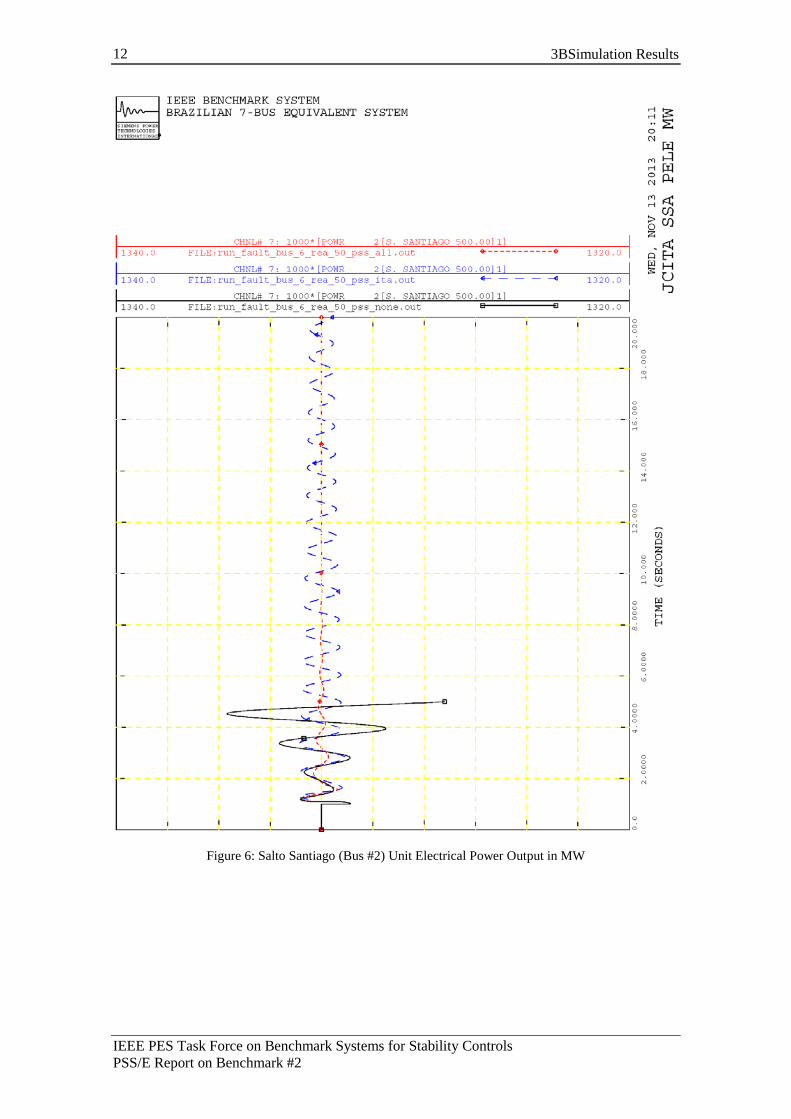
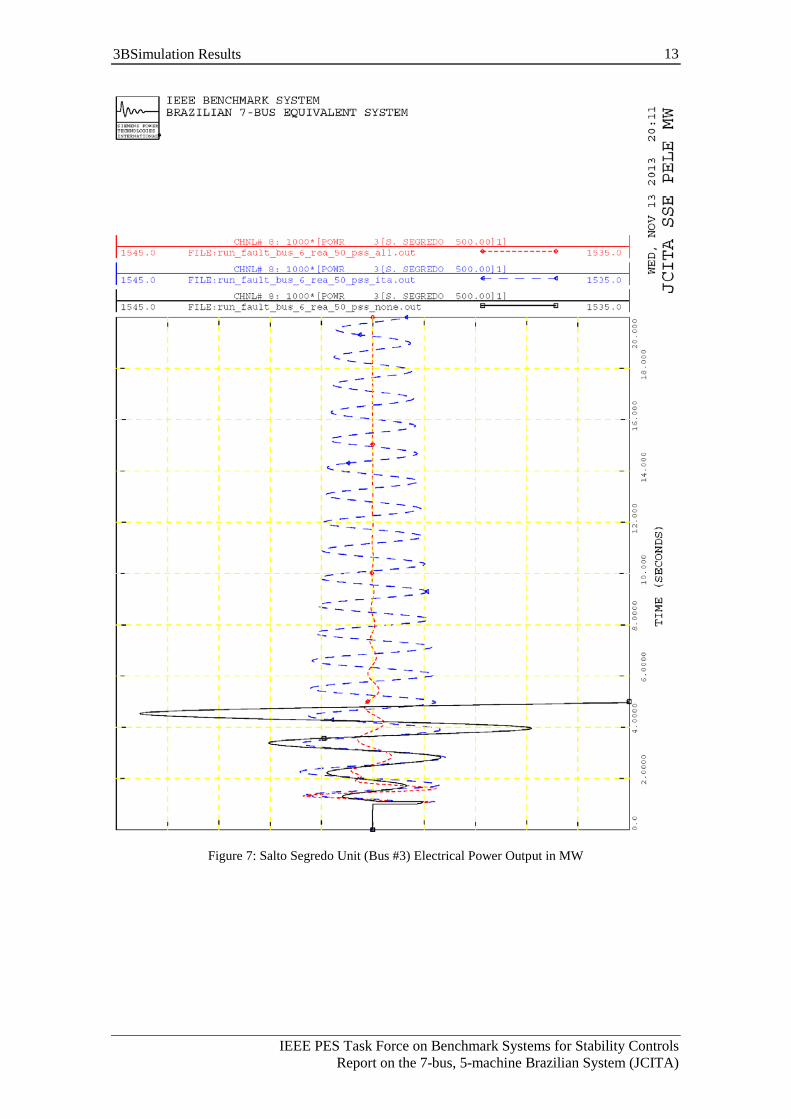
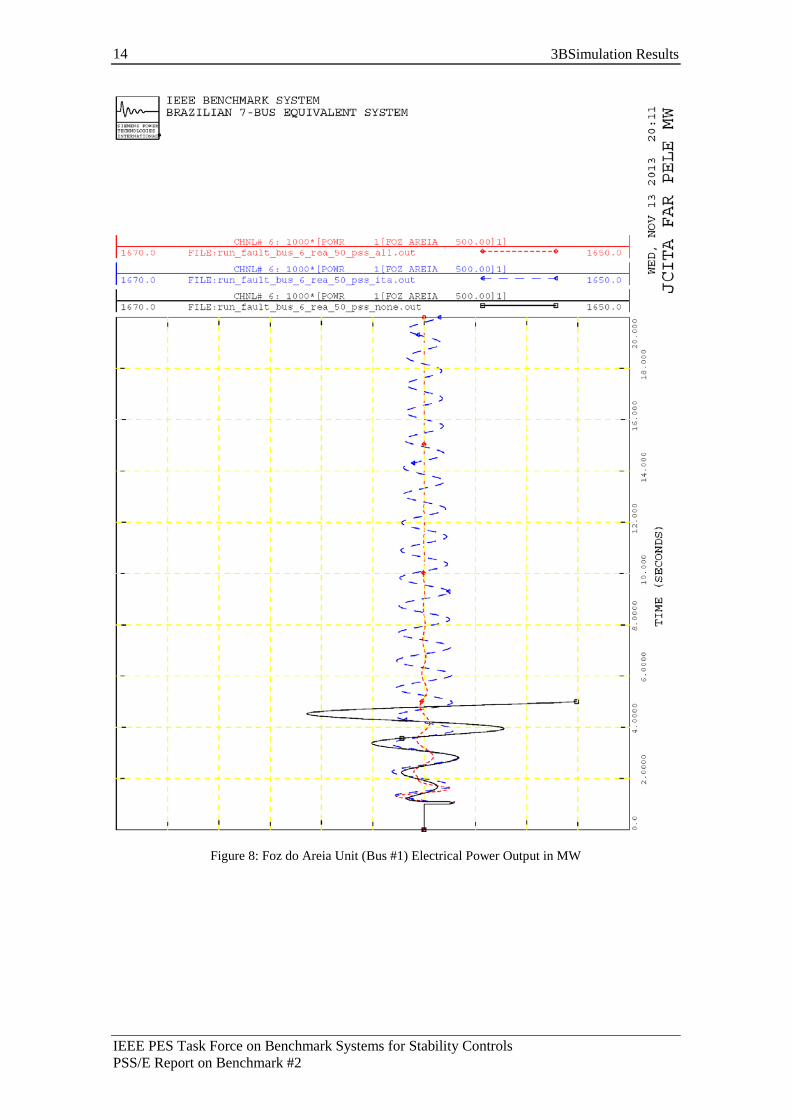
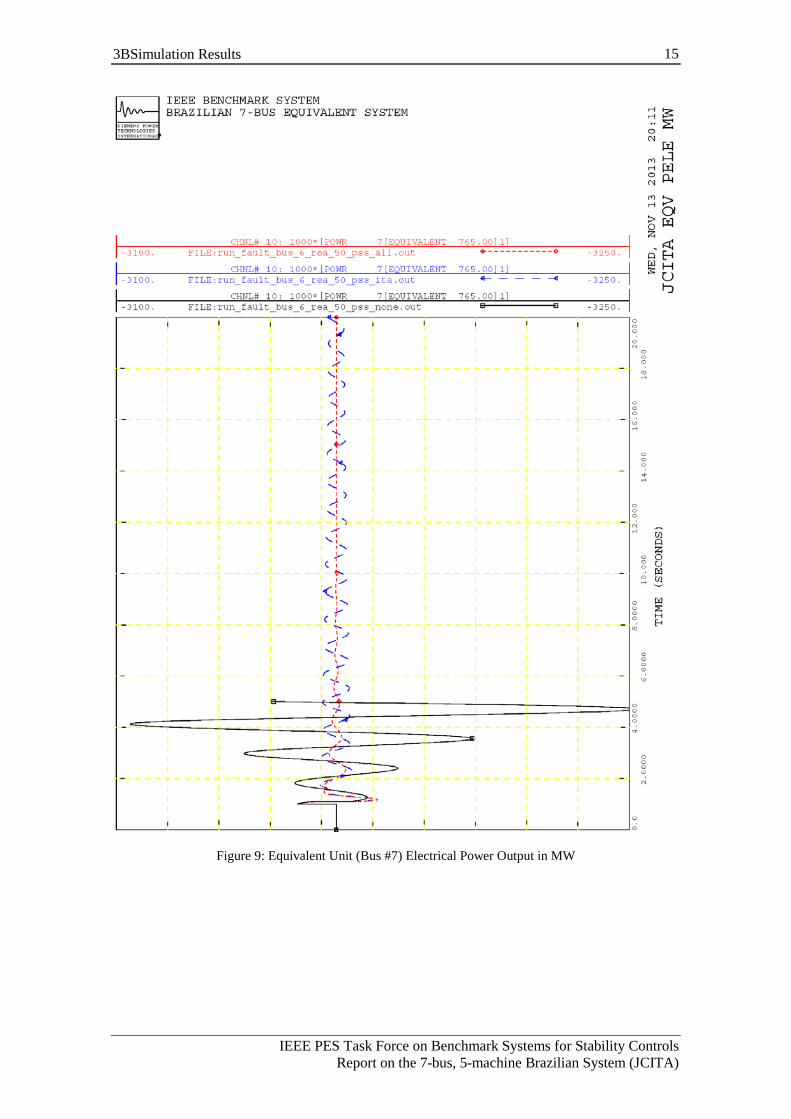
The first set of simulations (Figure 5 to Figure 9) comprise the connection of a 50 Mvar reactor at the Ivaiporã 765 kV bus (bus #6) at t=1.0 second. The reactor is disconnected 100 ms later, without any changes in the system topology. This is a very small disturbance, and as such leads to results that correspond to the linear response of the system.
Figure 5 presents the electrical power output of the Itaipu machine (bus #4), in MW. The black trace corresponds to the case without any PSS in service, and the case is unstable (negative damping). The blue trace is the result with only the Itaipu PSS in service. The case is no longer unstable, but the damping is clearly insufficient. The red trace shows the results with PSSs in service at all machines but the equivalent generator (bus #7) and it can be seen that the oscillation is now properly damped.
The electrical power outputs of the other units in the system are shown in Figure 6 to Figure 9.
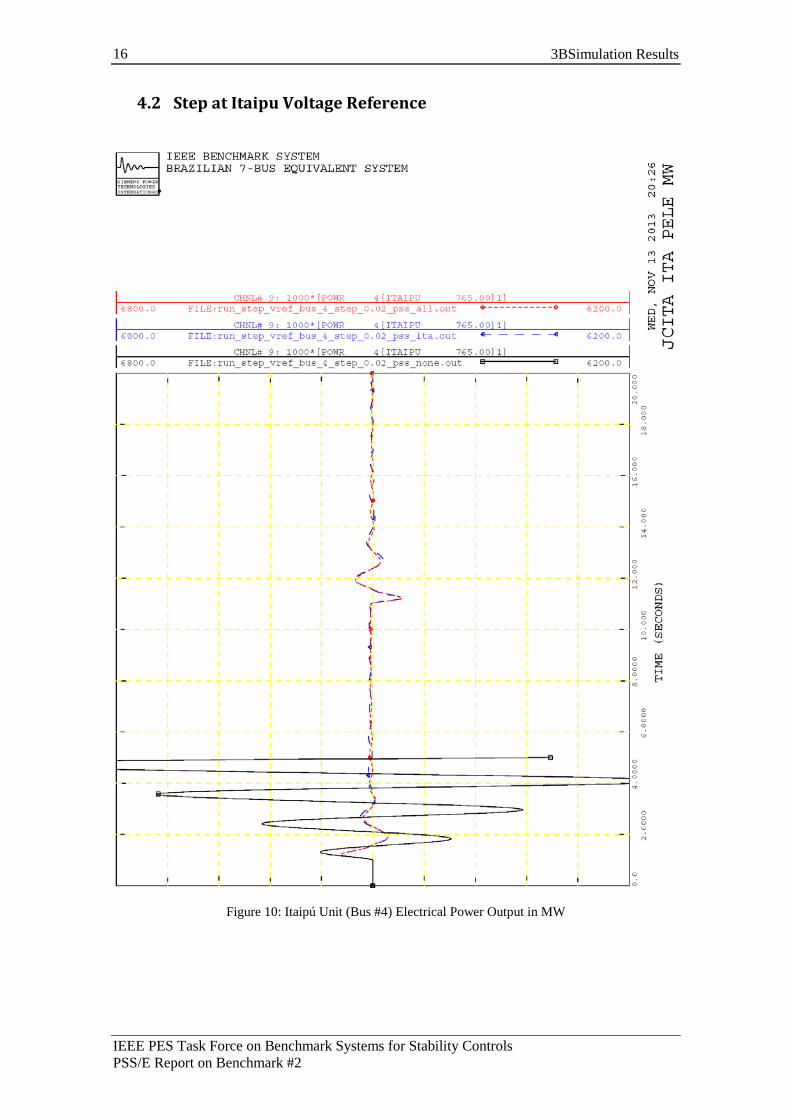
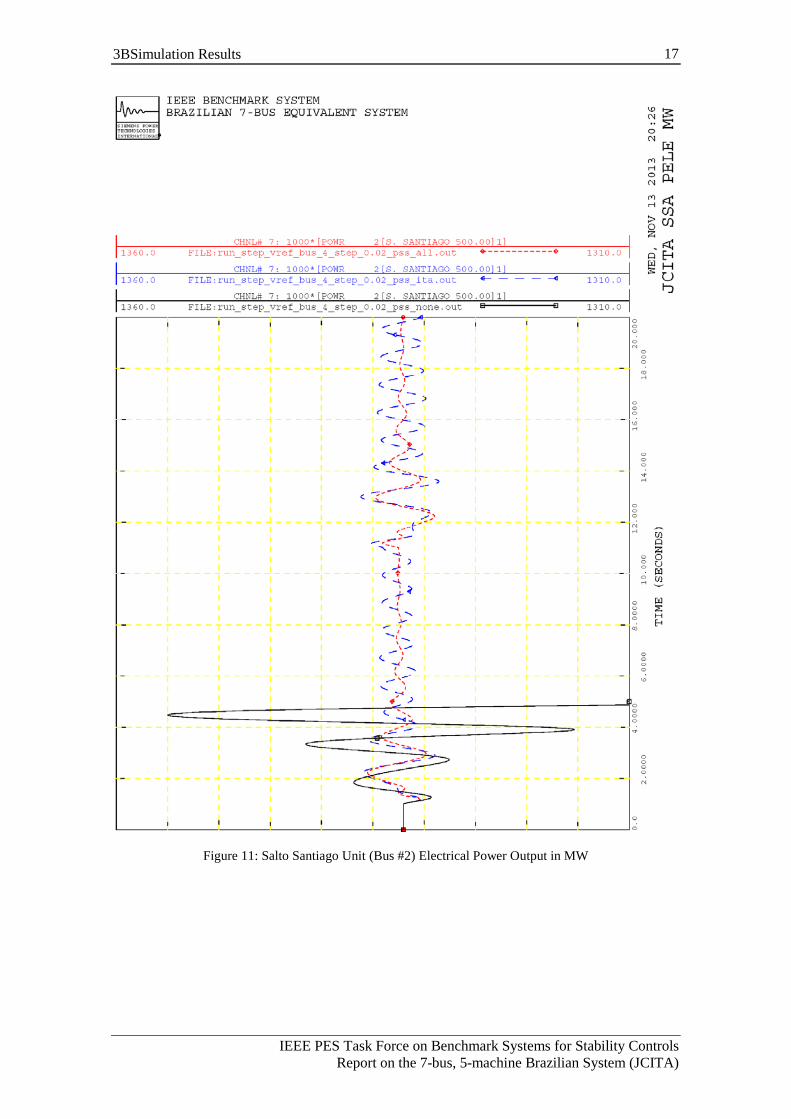
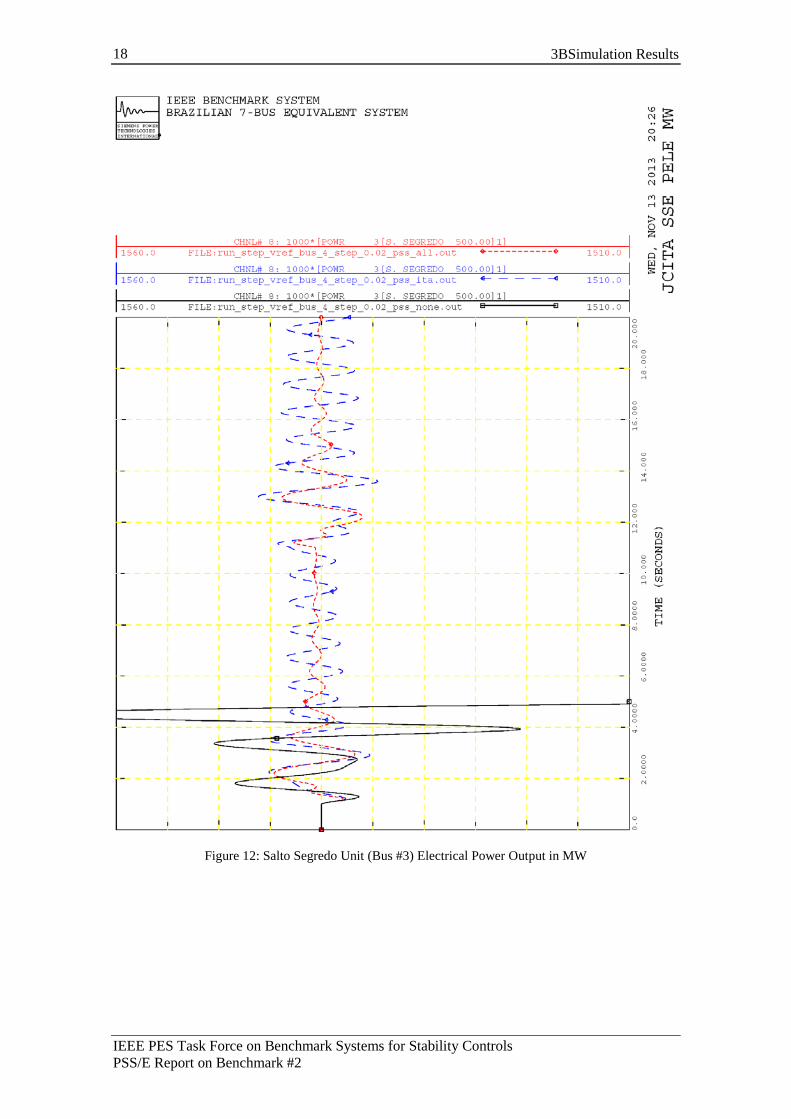
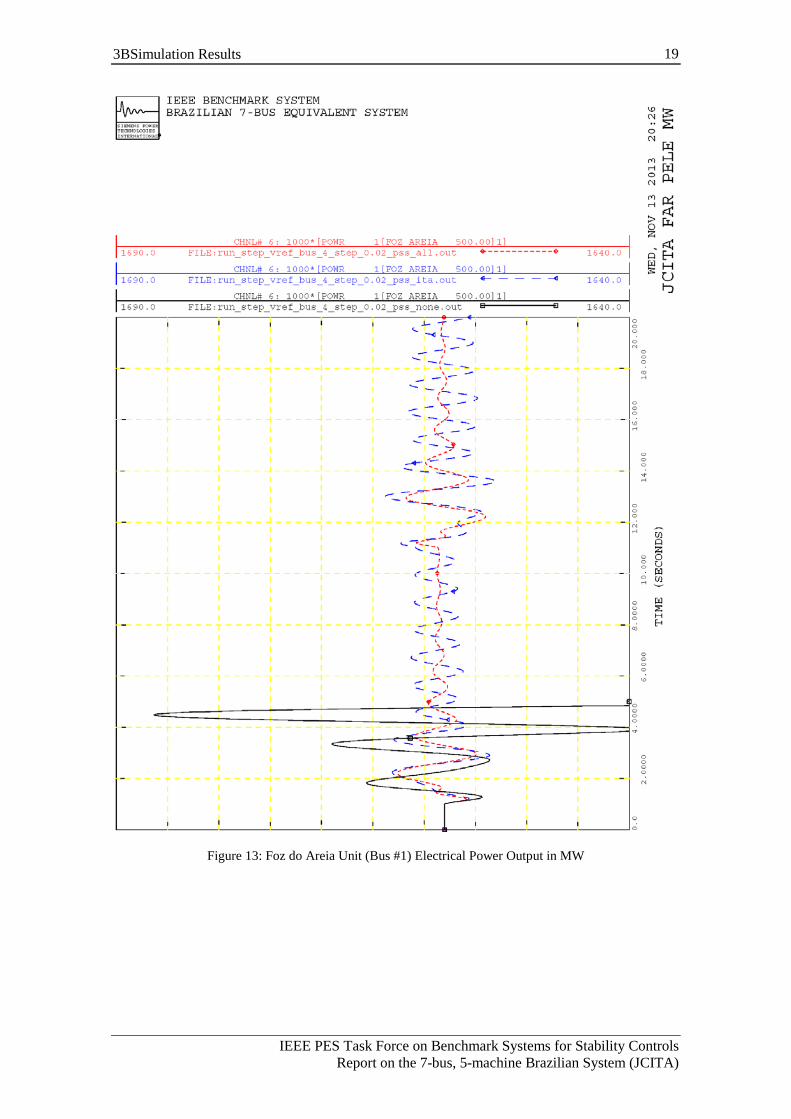
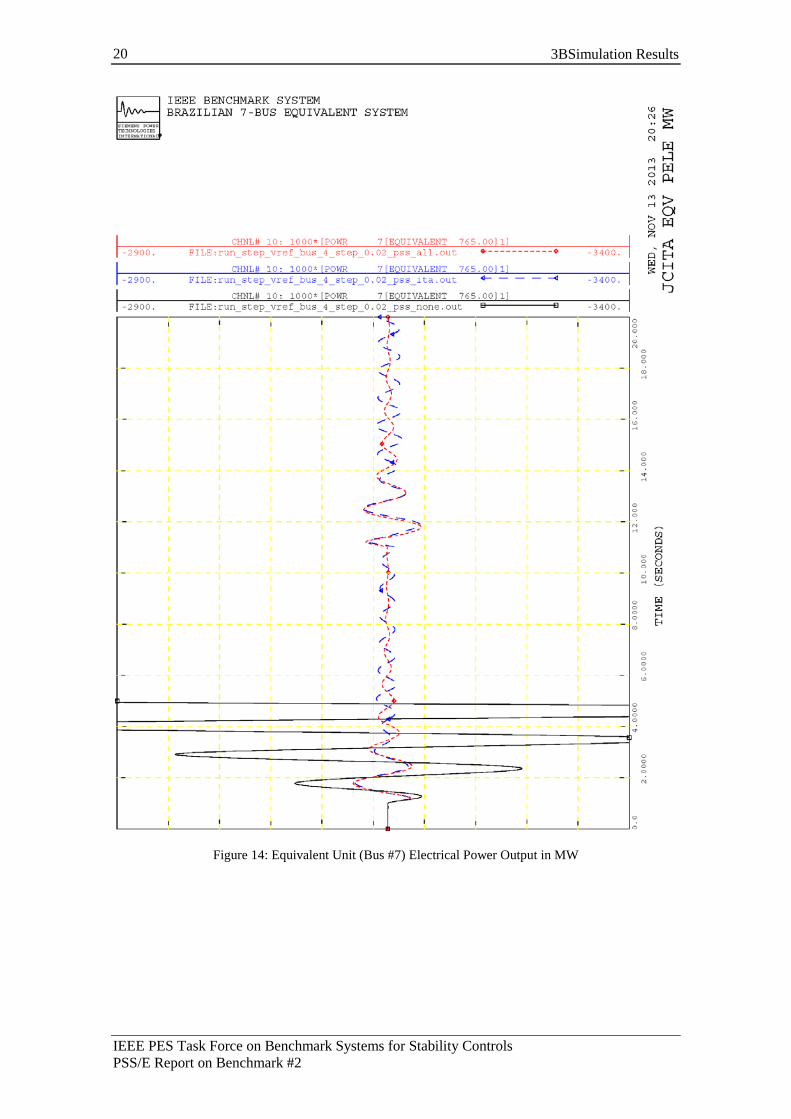
The second set of simulations correspond to a 2% step in voltage reference at the Itaipu machine (bus #4), applied at t=1.0 second. The step is removed (–2% step) at t=11.0 seconds. Figure 10 to Figure 14 present the electrical power output of the generation units, for the cases without PSS (black trace), with only the Itaipu PSS (blue trace) and with PSSs in all machines except the equivalent generator at bus #7 (red trace).
IEEE PES Task Force on Benchmark Systems for Stability Controls Report on the 7-bus, 5-machine Brazilian System (JCITA)
11 3BSimulation Results
4.1 50 Mvar Reactor at Ivaiporã Bus
Figure 5: Itaipú Unit (Bus #4) Electrical Power Output in MW
IEEE PES Task Force on Benchmark Systems for Stability Controls PSS/E Report on Benchmark #2
12 3BSimulation Results
Figure 6: Salto Santiago (Bus #2) Unit Electrical Power Output in MW
IEEE PES Task Force on Benchmark Systems for Stability Controls Report on the 7-bus, 5-machine Brazilian System (JCITA)
13 3BSimulation Results
Figure 7: Salto Segredo Unit (Bus #3) Electrical Power Output in MW
IEEE PES Task Force on Benchmark Systems for Stability Controls PSS/E Report on Benchmark #2
14 3BSimulation Results
Figure 8: Foz do Areia Unit (Bus #1) Electrical Power Output in MW
IEEE PES Task Force on Benchmark Systems for Stability Controls Report on the 7-bus, 5-machine Brazilian System (JCITA)
15 3BSimulation Results
Figure 9: Equivalent Unit (Bus #7) Electrical Power Output in MW
IEEE PES Task Force on Benchmark Systems for Stability Controls PSS/E Report on Benchmark #2
16 3BSimulation Results
4.2 Step at Itaipu Voltage Reference
Figure 10: Itaipú Unit (Bus #4) Electrical Power Output in MW
IEEE PES Task Force on Benchmark Systems for Stability Controls Report on the 7-bus, 5-machine Brazilian System (JCITA)
17 3BSimulation Results
Figure 11: Salto Santiago Unit (Bus #2) Electrical Power Output in MW
IEEE PES Task Force on Benchmark Systems for Stability Controls PSS/E Report on Benchmark #2
18 3BSimulation Results
Figure 12: Salto Segredo Unit (Bus #3) Electrical Power Output in MW
IEEE PES Task Force on Benchmark Systems for Stability Controls Report on the 7-bus, 5-machine Brazilian System (JCITA)
19 3BSimulation Results
Figure 13: Foz do Areia Unit (Bus #1) Electrical Power Output in MW
IEEE PES Task Force on Benchmark Systems for Stability Controls PSS/E Report on Benchmark #2
20 3BSimulation Results
Figure 14: Equivalent Unit (Bus #7) Electrical Power Output in MW
IEEE PES Task Force on Benchmark Systems for Stability Controls Report on the 7-bus, 5-machine Brazilian System (JCITA)
21 3BSimulation Results
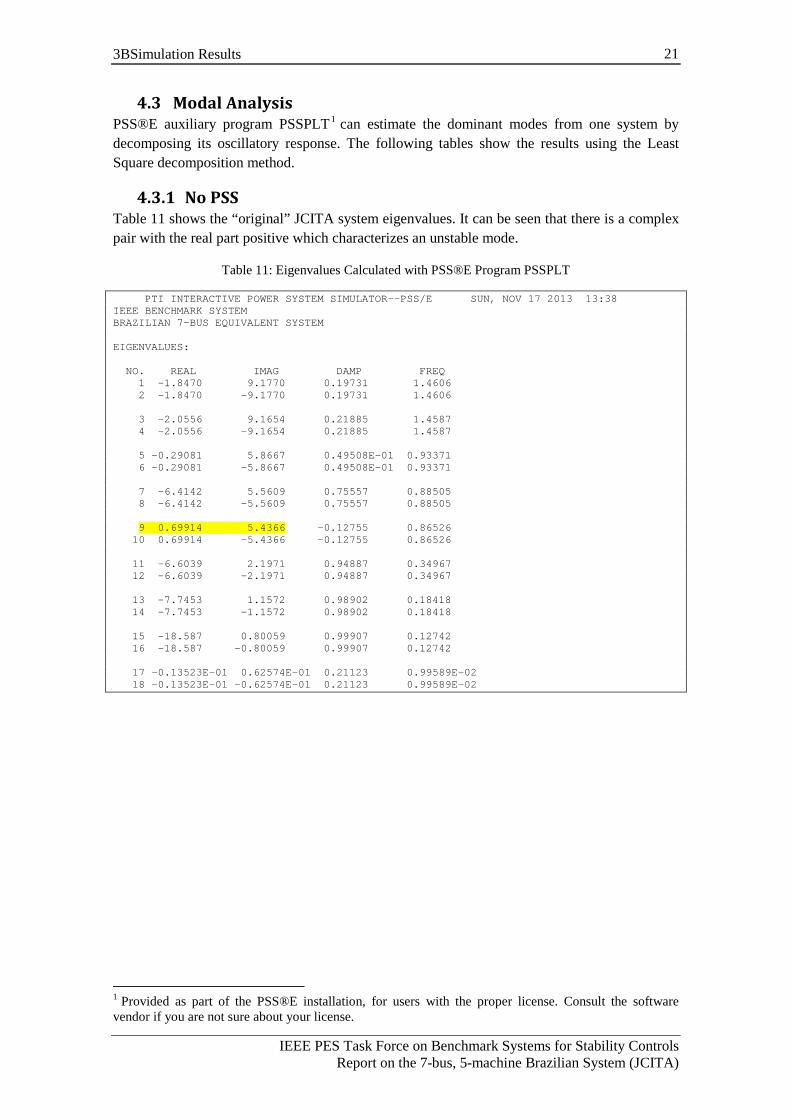
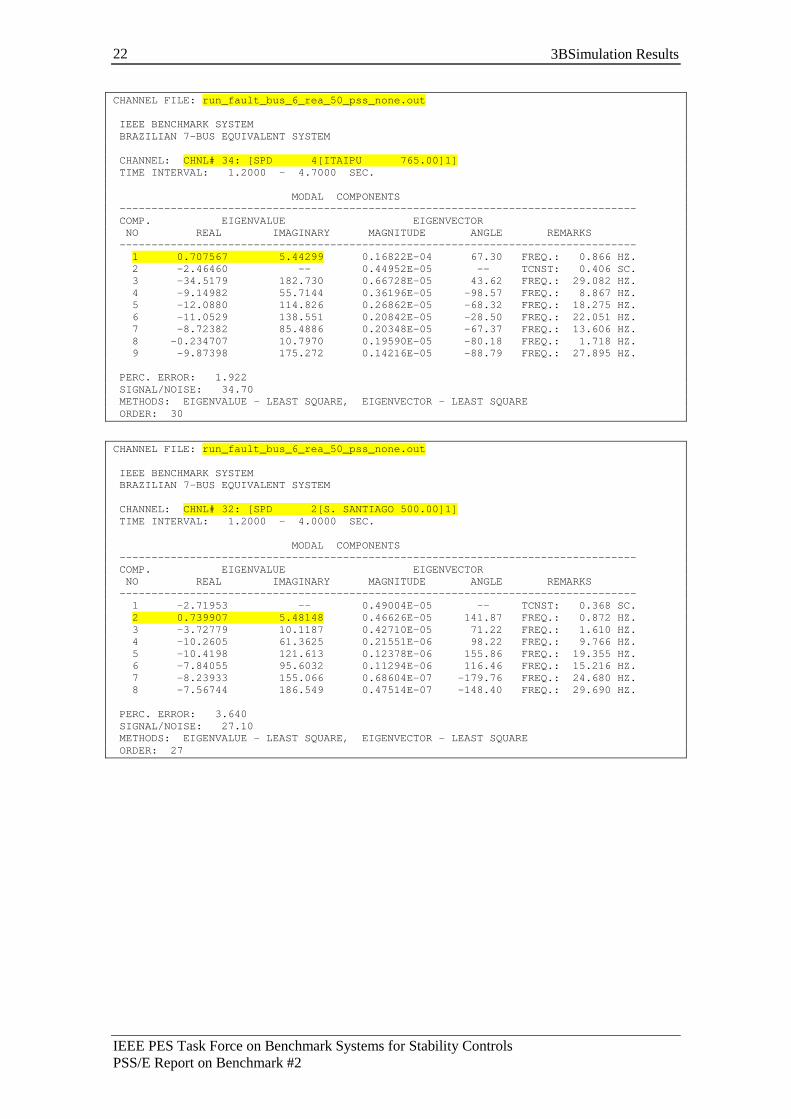
4.3 Modal Analysis PSS®E auxiliary program PSSPLT1
4.3.1 No PSS
can estimate the dominant modes from one system by decomposing its oscillatory response. The following tables show the results using the Least Square decomposition method.
Table 11 shows the “original” JCITA system eigenvalues. It can be seen that there is a complex pair with the real part positive which characterizes an unstable mode.
Table 11: Eigenvalues Calculated with PSS®E Program PSSPLT
PTI INTERACTIVE POWER SYSTEM SIMULATOR--PSS/E SUN, NOV 17 2013 13:38 IEEE BENCHMARK SYSTEM BRAZILIAN 7-BUS EQUIVALENT SYSTEM EIGENVALUES: NO. REAL IMAG DAMP FREQ 1 -1.8470 9.1770 0.19731 1.4606 2 -1.8470 -9.1770 0.19731 1.4606 3 -2.0556 9.1654 0.21885 1.4587 4 -2.0556 -9.1654 0.21885 1.4587 5 -0.29081 5.8667 0.49508E-01 0.93371 6 -0.29081 -5.8667 0.49508E-01 0.93371 7 -6.4142 5.5609 0.75557 0.88505 8 -6.4142 -5.5609 0.75557 0.88505 9 0.69914 5.4366 -0.12755 0.86526 10 0.69914 -5.4366 -0.12755 0.86526 11 -6.6039 2.1971 0.94887 0.34967 12 -6.6039 -2.1971 0.94887 0.34967 13 -7.7453 1.1572 0.98902 0.18418 14 -7.7453 -1.1572 0.98902 0.18418 15 -18.587 0.80059 0.99907 0.12742 16 -18.587 -0.80059 0.99907 0.12742 17 -0.13523E-01 0.62574E-01 0.21123 0.99589E-02 18 -0.13523E-01 -0.62574E-01 0.21123 0.99589E-02
1 Provided as part of the PSS®E installation, for users with the proper license. Consult the software vendor if you are not sure about your license.
IEEE PES Task Force on Benchmark Systems for Stability Controls PSS/E Report on Benchmark #2
22 3BSimulation Results
CHANNEL FILE: run_fault_bus_6_rea_50_pss_none.out IEEE BENCHMARK SYSTEM BRAZILIAN 7-BUS EQUIVALENT SYSTEM CHANNEL: CHNL# 34: [SPD 4[ITAIPU 765.00]1] TIME INTERVAL: 1.2000 - 4.7000 SEC. MODAL COMPONENTS --------------------------------------------------------------------------------- COMP. EIGENVALUE EIGENVECTOR NO REAL IMAGINARY MAGNITUDE ANGLE REMARKS --------------------------------------------------------------------------------- 1 0.707567 5.44299 0.16822E-04 67.30 FREQ.: 0.866 HZ. 2 -2.46460 -- 0.44952E-05 -- TCNST: 0.406 SC. 3 -34.5179 182.730 0.66728E-05 43.62 FREQ.: 29.082 HZ. 4 -9.14982 55.7144 0.36196E-05 -98.57 FREQ.: 8.867 HZ. 5 -12.0880 114.826 0.26862E-05 -68.32 FREQ.: 18.275 HZ. 6 -11.0529 138.551 0.20842E-05 -28.50 FREQ.: 22.051 HZ. 7 -8.72382 85.4886 0.20348E-05 -67.37 FREQ.: 13.606 HZ. 8 -0.234707 10.7970 0.19590E-05 -80.18 FREQ.: 1.718 HZ. 9 -9.87398 175.272 0.14216E-05 -88.79 FREQ.: 27.895 HZ. PERC. ERROR: 1.922 SIGNAL/NOISE: 34.70 METHODS: EIGENVALUE - LEAST SQUARE, EIGENVECTOR - LEAST SQUARE ORDER: 30
CHANNEL FILE: run_fault_bus_6_rea_50_pss_none.out IEEE BENCHMARK SYSTEM BRAZILIAN 7-BUS EQUIVALENT SYSTEM CHANNEL: CHNL# 32: [SPD 2[S. SANTIAGO 500.00]1] TIME INTERVAL: 1.2000 - 4.0000 SEC. MODAL COMPONENTS --------------------------------------------------------------------------------- COMP. EIGENVALUE EIGENVECTOR NO REAL IMAGINARY MAGNITUDE ANGLE REMARKS --------------------------------------------------------------------------------- 1 -2.71953 -- 0.49004E-05 -- TCNST: 0.368 SC. 2 0.739907 5.48148 0.46626E-05 141.87 FREQ.: 0.872 HZ. 3 -3.72779 10.1187 0.42710E-05 71.22 FREQ.: 1.610 HZ. 4 -10.2605 61.3625 0.21551E-06 98.22 FREQ.: 9.766 HZ. 5 -10.4198 121.613 0.12378E-06 155.86 FREQ.: 19.355 HZ. 6 -7.84055 95.6032 0.11294E-06 116.46 FREQ.: 15.216 HZ. 7 -8.23933 155.066 0.68604E-07 -179.76 FREQ.: 24.680 HZ. 8 -7.56744 186.549 0.47514E-07 -148.40 FREQ.: 29.690 HZ. PERC. ERROR: 3.640 SIGNAL/NOISE: 27.10 METHODS: EIGENVALUE - LEAST SQUARE, EIGENVECTOR - LEAST SQUARE ORDER: 27
IEEE PES Task Force on Benchmark Systems for Stability Controls Report on the 7-bus, 5-machine Brazilian System (JCITA)
23 3BSimulation Results
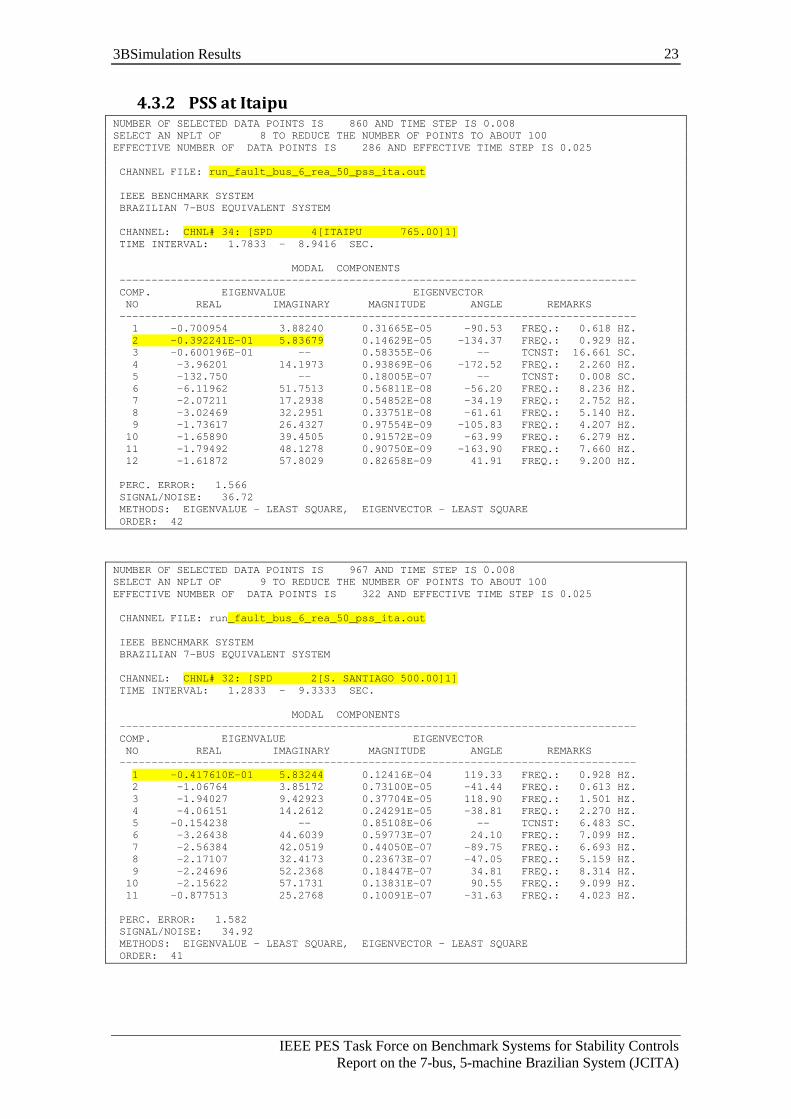
4.3.2 PSS at Itaipu NUMBER OF SELECTED DATA POINTS IS 860 AND TIME STEP IS 0.008 SELECT AN NPLT OF 8 TO REDUCE THE NUMBER OF POINTS TO ABOUT 100 EFFECTIVE NUMBER OF DATA POINTS IS 286 AND EFFECTIVE TIME STEP IS 0.025 CHANNEL FILE: run_fault_bus_6_rea_50_pss_ita.out IEEE BENCHMARK SYSTEM BRAZILIAN 7-BUS EQUIVALENT SYSTEM CHANNEL: CHNL# 34: [SPD 4[ITAIPU 765.00]1] TIME INTERVAL: 1.7833 - 8.9416 SEC. MODAL COMPONENTS --------------------------------------------------------------------------------- COMP. EIGENVALUE EIGENVECTOR NO REAL IMAGINARY MAGNITUDE ANGLE REMARKS --------------------------------------------------------------------------------- 1 -0.700954 3.88240 0.31665E-05 -90.53 FREQ.: 0.618 HZ. 2 -0.392241E-01 5.83679 0.14629E-05 -134.37 FREQ.: 0.929 HZ. 3 -0.600196E-01 -- 0.58355E-06 -- TCNST: 16.661 SC. 4 -3.96201 14.1973 0.93869E-06 -172.52 FREQ.: 2.260 HZ. 5 -132.750 -- 0.18005E-07 -- TCNST: 0.008 SC. 6 -6.11962 51.7513 0.56811E-08 -56.20 FREQ.: 8.236 HZ. 7 -2.07211 17.2938 0.54852E-08 -34.19 FREQ.: 2.752 HZ. 8 -3.02469 32.2951 0.33751E-08 -61.61 FREQ.: 5.140 HZ. 9 -1.73617 26.4327 0.97554E-09 -105.83 FREQ.: 4.207 HZ. 10 -1.65890 39.4505 0.91572E-09 -63.99 FREQ.: 6.279 HZ. 11 -1.79492 48.1278 0.90750E-09 -163.90 FREQ.: 7.660 HZ. 12 -1.61872 57.8029 0.82658E-09 41.91 FREQ.: 9.200 HZ. PERC. ERROR: 1.566 SIGNAL/NOISE: 36.72 METHODS: EIGENVALUE - LEAST SQUARE, EIGENVECTOR - LEAST SQUARE ORDER: 42
NUMBER OF SELECTED DATA POINTS IS 967 AND TIME STEP IS 0.008 SELECT AN NPLT OF 9 TO REDUCE THE NUMBER OF POINTS TO ABOUT 100 EFFECTIVE NUMBER OF DATA POINTS IS 322 AND EFFECTIVE TIME STEP IS 0.025 CHANNEL FILE: run_fault_bus_6_rea_50_pss_ita.out IEEE BENCHMARK SYSTEM BRAZILIAN 7-BUS EQUIVALENT SYSTEM CHANNEL: CHNL# 32: [SPD 2[S. SANTIAGO 500.00]1] TIME INTERVAL: 1.2833 - 9.3333 SEC. MODAL COMPONENTS --------------------------------------------------------------------------------- COMP. EIGENVALUE EIGENVECTOR NO REAL IMAGINARY MAGNITUDE ANGLE REMARKS --------------------------------------------------------------------------------- 1 -0.417610E-01 5.83244 0.12416E-04 119.33 FREQ.: 0.928 HZ. 2 -1.06764 3.85172 0.73100E-05 -41.44 FREQ.: 0.613 HZ. 3 -1.94027 9.42923 0.37704E-05 118.90 FREQ.: 1.501 HZ. 4 -4.06151 14.2612 0.24291E-05 -38.81 FREQ.: 2.270 HZ. 5 -0.154238 -- 0.85108E-06 -- TCNST: 6.483 SC. 6 -3.26438 44.6039 0.59773E-07 24.10 FREQ.: 7.099 HZ. 7 -2.56384 42.0519 0.44050E-07 -89.75 FREQ.: 6.693 HZ. 8 -2.17107 32.4173 0.23673E-07 -47.05 FREQ.: 5.159 HZ. 9 -2.24696 52.2368 0.18447E-07 34.81 FREQ.: 8.314 HZ. 10 -2.15622 57.1731 0.13831E-07 90.55 FREQ.: 9.099 HZ. 11 -0.877513 25.2768 0.10091E-07 -31.63 FREQ.: 4.023 HZ. PERC. ERROR: 1.582 SIGNAL/NOISE: 34.92 METHODS: EIGENVALUE - LEAST SQUARE, EIGENVECTOR - LEAST SQUARE ORDER: 41
IEEE PES Task Force on Benchmark Systems for Stability Controls PSS/E Report on Benchmark #2
24 3BSimulation Results
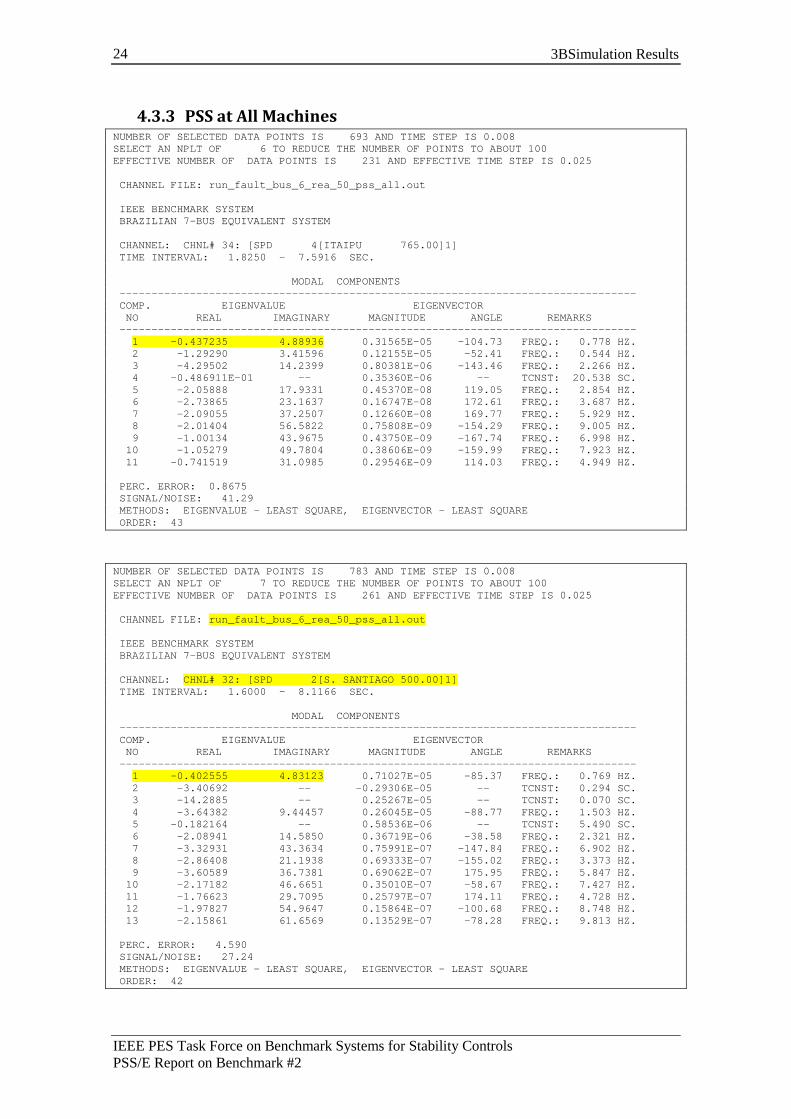
4.3.3 PSS at All Machines NUMBER OF SELECTED DATA POINTS IS 693 AND TIME STEP IS 0.008 SELECT AN NPLT OF 6 TO REDUCE THE NUMBER OF POINTS TO ABOUT 100 EFFECTIVE NUMBER OF DATA POINTS IS 231 AND EFFECTIVE TIME STEP IS 0.025 CHANNEL FILE: run_fault_bus_6_rea_50_pss_all.out IEEE BENCHMARK SYSTEM BRAZILIAN 7-BUS EQUIVALENT SYSTEM CHANNEL: CHNL# 34: [SPD 4[ITAIPU 765.00]1] TIME INTERVAL: 1.8250 - 7.5916 SEC. MODAL COMPONENTS --------------------------------------------------------------------------------- COMP. EIGENVALUE EIGENVECTOR NO REAL IMAGINARY MAGNITUDE ANGLE REMARKS --------------------------------------------------------------------------------- 1 -0.437235 4.88936 0.31565E-05 -104.73 FREQ.: 0.778 HZ. 2 -1.29290 3.41596 0.12155E-05 -52.41 FREQ.: 0.544 HZ. 3 -4.29502 14.2399 0.80381E-06 -143.46 FREQ.: 2.266 HZ. 4 -0.486911E-01 -- 0.35360E-06 -- TCNST: 20.538 SC. 5 -2.05888 17.9331 0.45370E-08 119.05 FREQ.: 2.854 HZ. 6 -2.73865 23.1637 0.16747E-08 172.61 FREQ.: 3.687 HZ. 7 -2.09055 37.2507 0.12660E-08 169.77 FREQ.: 5.929 HZ. 8 -2.01404 56.5822 0.75808E-09 -154.29 FREQ.: 9.005 HZ. 9 -1.00134 43.9675 0.43750E-09 -167.74 FREQ.: 6.998 HZ. 10 -1.05279 49.7804 0.38606E-09 -159.99 FREQ.: 7.923 HZ. 11 -0.741519 31.0985 0.29546E-09 114.03 FREQ.: 4.949 HZ. PERC. ERROR: 0.8675 SIGNAL/NOISE: 41.29 METHODS: EIGENVALUE - LEAST SQUARE, EIGENVECTOR - LEAST SQUARE ORDER: 43
NUMBER OF SELECTED DATA POINTS IS 783 AND TIME STEP IS 0.008 SELECT AN NPLT OF 7 TO REDUCE THE NUMBER OF POINTS TO ABOUT 100 EFFECTIVE NUMBER OF DATA POINTS IS 261 AND EFFECTIVE TIME STEP IS 0.025 CHANNEL FILE: run_fault_bus_6_rea_50_pss_all.out IEEE BENCHMARK SYSTEM BRAZILIAN 7-BUS EQUIVALENT SYSTEM CHANNEL: CHNL# 32: [SPD 2[S. SANTIAGO 500.00]1] TIME INTERVAL: 1.6000 - 8.1166 SEC. MODAL COMPONENTS --------------------------------------------------------------------------------- COMP. EIGENVALUE EIGENVECTOR NO REAL IMAGINARY MAGNITUDE ANGLE REMARKS --------------------------------------------------------------------------------- 1 -0.402555 4.83123 0.71027E-05 -85.37 FREQ.: 0.769 HZ. 2 -3.40692 -- -0.29306E-05 -- TCNST: 0.294 SC. 3 -14.2885 -- 0.25267E-05 -- TCNST: 0.070 SC. 4 -3.64382 9.44457 0.26045E-05 -88.77 FREQ.: 1.503 HZ. 5 -0.182164 -- 0.58536E-06 -- TCNST: 5.490 SC. 6 -2.08941 14.5850 0.36719E-06 -38.58 FREQ.: 2.321 HZ. 7 -3.32931 43.3634 0.75991E-07 -147.84 FREQ.: 6.902 HZ. 8 -2.86408 21.1938 0.69333E-07 -155.02 FREQ.: 3.373 HZ. 9 -3.60589 36.7381 0.69062E-07 175.95 FREQ.: 5.847 HZ. 10 -2.17182 46.6651 0.35010E-07 -58.67 FREQ.: 7.427 HZ. 11 -1.76623 29.7095 0.25797E-07 174.11 FREQ.: 4.728 HZ. 12 -1.97827 54.9647 0.15864E-07 -100.68 FREQ.: 8.748 HZ. 13 -2.15861 61.6569 0.13529E-07 -78.28 FREQ.: 9.813 HZ. PERC. ERROR: 4.590 SIGNAL/NOISE: 27.24 METHODS: EIGENVALUE - LEAST SQUARE, EIGENVECTOR - LEAST SQUARE ORDER: 42
IEEE PES Task Force on Benchmark Systems for Stability Controls Report on the 7-bus, 5-machine Brazilian System (JCITA)
25 4BReferences
5. References
[1] MARTINS, Nelson; LIMA, L. T. G. “Eigenvalue and Frequency Domain Analysis of Small-Signal Electromechanical Stability Problems”, IEEE Symposium on Application of Eigenanalysis and Frequency Domain Method for System Dynamic Performance, 1989, .p. 17-33.
[2] Siemens PTI, “PSS®E 32.0.5 Online Documentation”, October 2010.
[3] MARTINS, Nelson; ???, Fernando. “The 7-bus, 5-machine Brazilian System”, IEEE Taskforce on Benchmark Systems for Stability Analysis, 201?.
[4] IEEE Recommended Practice for Excitation System Models for Power System Stability Studies, IEEE Standard 421.5(2005), April 2006.
![IEEE PES Task Force on Benchmark Systems for …eioc.pnnl.gov/benchmark/ieeess/ThreeMIB/3 generator model PSSE...IEEE PES Task Force on Benchmark Systems for Stability ... [2]. The](https://img.pdfslide.net/doc/110x75/5ad280d87f8b9a72118d3686/ieee-pes-task-force-on-benchmark-systems-for-eiocpnnlgovbenchmarkieeessthreemib3.jpg)