Embed Size (px)
Citation preview
This article has been accepted for inclusion in a future issue of this journal. Content is final as presented, with the exception of pagination.
IEEE SYSTEMS JOURNAL 1
Air Cargo Demand Modeling and PredictionRaghavendra Totamane, Amit Dasgupta, and Shrisha Rao, Member, IEEE
Abstract—The air cargo transportation system is a large andcomplex service system, in which demand forecasting is a keyelement in the master planning process. Demand forecastingis essential for analyzing existing cargo flight schedules andidentifying future facility requirements of air cargo companies.We use the Potluck Problem approach to propose a multipro-ducer/multiconsumer solution for predicting the cargo demandof a specific airline in a given route, and the cargo load factor fora given flight schedule on that route. This solution considers eachairline as a producer and the users of air cargo services as con-sumers, with a producer having no explicit communication withother producers/airlines. The model analyzes the existing cargocapacity plan, highlights drawbacks, and proposes a new capacityplan to demonstrate the effectiveness of using the solution.Examples are provided to illustrate the efficacy of the approach.
Index Terms—Air cargo, cargo capacity, cargo load factor,demand prediction, multiagent system, Potluck Problem,weighted majority algorithm.
I. Introduction
A IR CARGO transportation is primarily done throughlarger aircraft, such as passenger airplanes, cargo air-
planes, and charter airplanes. In the case of passenger air-planes, cargo supply and delivery are closely tied to passengerflight schedules, which are normally designed to facilitatepassenger transport; therefore, the demand cannot be met bypassenger airplanes alone, and cargo airplanes play an impor-tant role in cargo transportation. Forecasts suggest that the aircargo industry will continue to grow [1] and competition inthe air cargo industry will be strong. Many passenger airlinesfind themselves being squeezed and see their yields and profitsdropping constantly. In contrast, integrated carriers such asUPS and FedEx have been able to sustain and make goodrevenues and profits even during economic slowdown [2], [3].This suggests that cargo customers are willing to pay extraprice for very reliable, value added, and tailor-made services.
Cargo management is gaining importance as it generatessubstantial revenues for airlines, more so than the saturatedand stagnating passenger travel markets. A forecast reportpublished by Boeing [4] says that air cargo traffic worldwidewill continue to increase in spite of increases in jet fuelprice at an impressive annual average rate of 6.1% over the
Manuscript received February 11, 2012; revised August 31, 2012; acceptedSeptember 4, 2012.
R. Totamane is an independent IT Consultant, Bangalore, India (e-mail:[email protected]).
A. Dasgupta is with Unisys Global Services India, Bangalore 560 025, India(e-mail: [email protected]).
S. Rao is with the International Institute of Information Technology Ban-galore, Bangalore 560 100, India (e-mail: [email protected]).
Color versions of one or more of the figures in this paper are availableonline at http://ieeexplore.ieee.org.
Digital Object Identifier 10.1109/JSYST.2012.2218511
next two decades. According to the Bureau of TransportationStatistics, cargo is one of the fastest-growing segments of theU.S. economy. The Bureau also notes that air freight has expe-rienced one of the fastest growths in the cargo industry. Mostmajor airlines have various business strategies for air cargodemand planning and optimization, such as efficient usageof air network capacity by using new logistic concepts anddemand forecasting, reinforcement of collaborations with otherair cargo companies, truck/train companies and forwarders,introduction of time-definite services (e.g., guaranteed on-timedelivery), and so on. To handle the variety and complexity ofmanagerial forecasting problems, multiple forecasting tech-niques, such as econometric modeling, judgmental analysis,trend analysis, and potential analysis, have been used [5], [6].
Econometric modeling [7] helps determine the overall im-portance of underlying economic factors, such as gross domes-tic product (GDP), air trade, fuel price, and so on, and providesforecasts that are linked to expectations of those factors [8],[9]. This method is useful for medium and long-range forecastsin regional markets. A simple trend analysis is often used toevaluate changes in economic factors. This approach is usefulin evaluating general changes in the marketplace that can beattributed to the combined effects of a number of factors.Potential analysis is also useful, particularly for forecastingmarkets in their early stages of development. Each techniquehas its special advantages and limitations; therefore, specialcare must be taken to select one or multiple techniques basedon the application [5]. In particular, it is quite important toefficiently forecast and manage cargo bookings [10], [11].
Our air cargo demand forecasting is model driven and basedon inductive reasoning [12], [13], led by observing the totalsupply of air cargo on many instances/days over the yearsand the average market share of airlines operating on specificregions/routes. Multiple airlines (agents) individually strate-gize the quantity of cargo to be handled, without any priorcoordination among themselves, in a self-interested manner.The amount of cargo supply that can be handled varies becauseof the varying demand for cargo every day. Irrespective of thevariation in demand, cargo airlines have fixed flight schedules(e.g., five flights daily from Los Angeles to New York) formost days in a year. Even though cargo airlines use variousalgorithms and strategies for flight scheduling and resourceplanning, most of them operate at variable cargo load factors(LFs) of 50%–70%.1 From this, it is evident that many cargoairlines are using imprecise cargo demand predictions, and
1Cargo LF is the ratio of revenue ton-miles to the maximum possible ton-miles (assuming every flight carries its maximum cargo all the time) or thefraction of the utilized capacity over the maximum capacity [14], [15].
1932-8184/$31.00 c© 2012 IEEE
This article has been accepted for inclusion in a future issue of this journal. Content is final as presented, with the exception of pagination.
2 IEEE SYSTEMS JOURNAL
thus can use better prediction models and improve their cargocapacity planning and flight scheduling.
Our proposed model, based on the Potluck Problem [16]approach, aims at suggesting a flexible flight schedule andcargo capacity plan based on demand prediction, which canmaximize the cargo LF while maintaining existing deliverysuccess rate. A major airline often has 100 million poundsof weekly cargo lift capacity, amounting to several hundredmillions of dollars in revenue. With this volume of cargo,even a slight improvement in the forecasting technique andcargo LF is apt to have a major impact in overall savings,performance, and efficiency. Our model uses the weightedmajority learning algorithm [17] with various predictors forpredicting the future demand. Based on the predicted demand,available cargo capacity, and global/regional economic condi-tions (GDP, inflation, industry growth, etc.), and by applyingvarious strategies, a new cargo capacity plan is suggested,thereby improving the cargo LF as well as the financial bottomline.
For our simulation and analyses, we have primarily col-lected the data from Unisys Logistics Management System(LMS), which is used by many leading cargo airlines to handleabout 35% of the world’s air freight. In our learning algorithm,we used past years’ data (specifically from the years 2005 and2006) of three different cargo airlines operating on differentroutes in the North American region as training data. Then theresults were compared with the airlines’ actual performancesin the year 2007 (i.e., we saw how our suggested scheduleswould have done compared to actual results, given the airlines’2007 cargo data). We did this with multiple routes and airlines,and discovered that our algorithm achieved an improvement inthe cargo LF of over 9% (which translates into tens of millionsof dollars) in all cases.
The remainder of this paper is organized as follows. Sec-tion II describes some of the prior work and discusses theproblem in more detail. Section III describes the air cargodemand prediction model, the importance of cargo capacityplanning, and how the weighted majority learning algorithmis applied to predict the cargo demand. Section IV provides thepseudocode for learning and application model. Section V dis-cusses the results of simulations using our model. Section VIprovides conclusions and suggestions for further work.
II. Problem Formulation
A. Motivation for Air Cargo Demand Prediction
Cargo, in general, is of course an aspect of human societyand trade, and its problems are as old as recorded history.There has been considerable work on cargo problems, e.g., inthe container shipping industry [18]. The air cargo space prob-lem has received attention for decades, starting with seminalworks of Fetter and Steorts [19], Whitehead [20], and Marstenand Muller [21]. More recent work includes simulation andother approaches for fleet routing and planning [1], [22],[23], revenue management [24], [25], and general studies offeasibility and other issues [26], [27].
Most major airlines are interested in new strategies forimproved achievement of business goals in the air cargo
industry. Airlines use multiple strategies to improve their over-all efficiencies of operation. Mongeau and Bes [28] address theimportance of optimization of aircraft container loading andmaximizing the mass of goods loaded onto the aircraft. Theyalso address the problem of loading as much freight as possibleon an aircraft while balancing the load in order to minimizefuel consumption and to satisfy stability/safety requirements.
An increase in the cargo LF directly impacts business per-formance. Many factors affect the cargo LF, such as efficientuse of space and load balancing, center of gravity, and soon. Fok et al. [29] investigated how cargo and mail LFs canbe improved through the use of mathematical optimization,and developed a Web-based application that performs long-term forecasting based on analysis of historical data, andthen helps with operational load planning with mathematicaloptimization.
Along with the continual expansion of the air cargo market,more and more cargo airlines have been established. Facingchallenges from domestic and foreign competitors, airlinesneed to understand customer demands and analyze their valuesproperly in order to compete successfully in the field [30]. Forair cargo and air logistics companies, data mining is greatlyhelpful in analyzing known data and forecasting the futuredeveloping trends of their business, as well as in figuringout the key factors to complete current tasks. These help thecompanies lower costs and increase profits, thus helping toplace them in a more competitive position in the businessworld. The main purpose is to combine air cargo planningwith data mining to promote the data mining technology asappropriate for use with critical functions in the air cargobusiness [6], [31].
In China, economic growth has been the primary drive forair cargo demand, and the aggregate forecast of future air cargoin China is projected based on the relationship between aircargo demand and economic development. Jiang et al. [32]obtained GDP projections by trend analysis and projectionsfrom the Chinese Government and recognized institutions, anddeveloped an econometric method to determine the GDP/air–cargo relationship. Kasarda and Green [33] noted that air cargoplays an important role in overall economic development, aview that is also seen elsewhere [34].
Most airlines overbook their actual capacity (for both pas-sengers and cargo) because part of the booked demand oftendoes not show up at the loading gate by the time of flightdeparture [35]. A key element of overbooking is a modelthat accurately predicts the show-up rate for current bookings.Given the increasing importance of cargo, most major airlinesnow scrutinize estimates of show-up rates for cargo bookings.Popescu et al. [36] showed that improved estimation ofthe show-up rate can improve profits and customer service.Kasilingam [37] considered the problem of overbooking andpresented a model given uncertain available capacity. Patelet al. [38] presented various deterministic models for deter-mining optimal pickup times for air cargo from an airportand delivering it to a local distribution center for a globalmanufacturer. The solutions of these models serve as initialstarting points to solve the stochastic problem with randomarrival times of the flights and random custom clearance times
This article has been accepted for inclusion in a future issue of this journal. Content is final as presented, with the exception of pagination.
TOTAMANE et al.: AIR CARGO DEMAND MODELING AND PREDICTION 3
and travel times. Huang and Hsu [39] presented a study onrevenue management for air cargo with supply uncertainty, andtheir numerical experiments were based on actual operationaldata of a Taiwanese airline. Their results showed that accurateforecast and control of cargo space supply are critical forincreasing revenue.
The air cargo supply chain is composed of shippers, freightforwarders, and airlines. The shippers send their shipmentsto freight forwarders, who are then responsible for contactingthe airlines and procuring space to ship the cargo accordingto the shippers’ needs. Popescu [40] proposed a structuredmethod for improving the airlines’ and freight forwarders’actions when confronted with accepting demand and acquiringcapacity, respectively. Several coordinated models combiningairport selection, fleet routing, and timetable setting are de-veloped on real operating data of Taiwan Airlines [41], andpreliminary results show how these models can be beneficialto airline alliances.
NASA’s scenario-based strategic planning process [42] iden-tified global air cargo as one of several potential high-payoffvehicle classes for the year 2020. Within this vehicle class,range/payload and cost goals were established to provide a 10-fold reduction in the cost per ton-mile for air cargo shipments.The study explains technologies and configurations requiredto determine the opportunities and the potential to meet them.The Boeing Company issues the biennial World Air CargoForecast [43] to provide a comprehensive up-to-date overviewof the air cargo industry. The forecast summarizes the world’smajor air trade markets, identifies major trends, and presentsforecasts for the future performance and development ofmarkets and the world freighter airplane fleet. After stronggrowth of 3.9% and 3.7% in 2006 and 2007 (the most recentyears for which global data is publicly available), respectively,world economic activity, as measured by GDP, is predictedto grow an average of 3.2% per year through 2027. GDPgrowth as a major driver of international trade stimulates airfreight, which will grow at nearly double the GDP growth rate.Although economic activity is the primary influence on worldair cargo development, other factors must also be considered.
III. System Model
A. Problem Description
Generally, in a given calendar year, most major airlineshave fixed numbers of different aircraft (Boeing 747, 767,DC8, DC10, and so on), with cargo capacities ranging from6 to 120 tons. Every airline has a fixed cargo capacity overspecific regions/routes (e.g., 1000 tons/week within the NorthAmerican region, 500 tons/week between North America andthe European Union, and so on). Every region has a certainnumber of segments (e.g., North America has segments likeChicago–Boston, Los Angeles–New York, and so on), anda fixed number of airlines operate in each segment. Eachairline knows about the total cargo supply per month inany segment from the freight statistics report published bythe country/region [44]. Every airline does some demandforecasting and plans its flight schedule for routes/region wellin advance for weeks/months and then publishes the flight
schedule to its frieght forwarders, partners, customers, andothers. An airline is able to maximize the utilization of itscargo capacity and provide better customer satisfaction if itcan predict, to a reasonable accuracy, the exact demand on agiven day, and plan and schedule its flights accordingly. Cargosupply in any specific segment varies based on many factors,such as the day of the week, the month of the year, the festivalseason, holidays, and economic factors. An airline decides howmuch supply it can provide based on the demand predictionand the available cargo capacity.
Specifically, as described in Section I, we have a supply-sideproblem, where the available demand for a resource varies,and supply is to be adjusted accordingly. In a game-theoreticalfashion, the air cargo capacity optimization problem is formu-lated by us as a Potluck Problem [16].
B. Potluck Problem and Demand–Supply Parity
The Potluck Problem [16] is an abstract game-theoreticalparadigm of a repeated noncooperative game in a multiagentsystem. There are numerous producers and consumers whoproduce a resource, and consumption happens at specific“dinner instances” where it is desired to avoid either “starva-tion,” a situation where some demand remains unfulfilled, or“excess,” a situation where there is more supply of the resourceby the producer agents than demanded by the consumers.Agents (both producers and consumers) do not cooperate orcommunicate their intentions ahead of time, but all have accessto historical data regarding production and consumption at pastdinner instances, and every agent acts in its self-interest.
The Potluck Problem may thus be thought of as a gener-alized version of the scenario where each individual providerof resources may have access to the historical demand dataand must determine what resources to provide in a futuretime period based on that historical demand data. Thus, itis an archetype of a problem where both demand and supplyvary. It is a generalization of the well-known Santa Fe BarProblem [45] or El Farol Problem, where the supply is keptfixed but the demand may vary. However, as with the SantaFe Bar Problem, a game of the Potluck Problem does notgenerally converge on its own and has oscillatory behavior inthe classical sense of Cournot [46]. This is because if, in aspecific dinner instance, there is starvation and the produceragents produce more for the next dinner instance, then therecan be excess at the latter instance. On the other hand, if thereis excess at a dinner instance and the producers reduce theirproduction, there can be starvation at a subsequent instance.Such oscillations can continue indefinitely.
In order to take on the Potluck Problem, various “predictors”and nonrational learning are used by the producers in order topredict the demand at a future dinner instance. As a multitudeof predictions generally results when a predictor uses a set ofpredictors, and as a single predictor is unlikely to be alwayscorrect, the weighted majority algorithm (WMA) [17] is usedto determine the overall demand prediction.
The WMA is a meta-learning algorithm for predicting asequence of values using predictions from a finite number ofpredictors. It can also be considered a way to determine anoverall prediction, giving more weight to the predictions of

This article has been accepted for inclusion in a future issue of this journal. Content is final as presented, with the exception of pagination.
4 IEEE SYSTEMS JOURNAL
reliable predictors than to those less reliable. The algorithmassumes that the predictors in the pool have no knowledgeabout the accuracy of their predictions, but one or morepredictors may perform better than others. Our net predictionis thus based on the simple and effective method of weightedvoting. The WMA is quite robust against bad predictors andis also known to perform at least as well when additionalpredictors are added. This is an important quality, consideringthat individual algorithms can have biases and other suchdrawbacks [47]. Other possible replacements for the WMAare not suitable in this context because they make assumptionsabout the data that are not likely to be always true in thisdomain (e.g., the Kalman filter assumes that the probabilitydensity functions of the data sources are Gaussian).
The Potluck Problem theoretical model has also been usedin other domains where parity of supply and demand isrequired, such as in the design of solar-powered electricalmicrogrids [48], and in reducing the power consumption oflarge IT data centers [49]–[51]. In such cases, the resourceproduced and consumed is variously taken as electrical power,computational capacity, etc. The “dinner instances” are con-sidered to occur hourly, daily, etc., as appropriate for eachgiven domain.
C. Application to Air Cargo Modeling
In our formulation, an airline is a producer of the resource(cargo transfer capacity) while consumers demand the sameresource at varying rates. As in the model, producers andconsumers do not collude or make their intentions known inadvance, but act in individual self-interest.
We aim at obtaining a near-equilibrium state where theaggregate supply of goods is nearly equal to the aggregatedemand. In order to reach an equilibrium or near-equilibriumstate between supply and demand at an instance t, eachsupplier agent, using the solution strategy of the PotluckProblem, predicts the demand for resources at the tth dinnerinstance given past data, and based on this prediction, decideson the quantities to supply at that dinner instance. The higherthe accuracy of these demand predictions by the supplieragents, the closer we get to the equilibrium between aggregatedemand and supply of air cargo transport resources.
Say there are n agents (airlines) who are players in thegame. Consider one instance of the game (cargo supply on oneday), t. For a player i ≤ n, the strategy set is 0 ≤ Qi ≤ Maxi,where Qi is the amount of cargo transported by agent i andMaxi corresponds to the maximum amount cargo that agent i
can transport. Let Mi denote the set of probability distributionsover Qi that defines the mixed strategy (combining multiplestrategies as one strategy) for agent i. Agent i has multipletypes of aircraft each having specific cargo capacities Cq.There can also be multiple cargo flights with the same cargocapacity Cq operating on a specific route. It is also possiblethat the same aircraft with cargo capacity Cq may makemultiple trips on a specific route for a given day. Si,t , thesum of cargo capacities of cargo flights operated by agent i
on a specific route, is given by Si,t =∑r
q=1 Cq,t . Now Si,t ∈ Mi
indicates the mixed strategy of the player i on a given day t.Then the total cargo transported by all the airlines on day t is
given by St =∑n
i=1 Si,t . The agent i decides on the mixedstrategy Si,t by predicting its demand for day t, which isdenoted by Di,t . The agents’ demand for the cargo also variesover different days. Ideally, an agent can maximize the cargoLF if Si,t = Di,t . This state of the game, where the supply anddemand exactly match, is the equilibrium state. If Si,t < Di,t ,then there is overbooking of cargo which the airlines fail tohandle, and if Si,t > Dt or Si,t > Di,t , there is underutilizationof available cargo capacity. The cargo capacity managementproblem can thus be seen as a repeated game of such Potluck“dinner instances.”
D. Predictors and Predictions
As noted above, the cargo capacity planning approachwe propose is similar to the Potluck Problem [16], [52], ageneralization of the Santa Fe Bar Problem [45]. We haveextended the algorithm used in the Potluck Problem [16],and this nonrational algorithm does well in maintaining parityof supply and demand in varying-demand situations, yieldingbetter results.
For a given region or a route, cargo capacity planning isa decision-making process on scheduling of flights based onthe recommendations of various putative experts (predictors),of which some are probably better than others. It makes sensethat we would lean toward the recommendations of our betterexperts and ignore those who have performed poorly in thepast. A deterministic way of implementing this is to assign aweight to each of the predictors, which represents the level oftrust we currently place in them. When they predict accurately,we maintain or increase the weight given to them, and whenthey are incorrect, we reduce their weight in some way (e.g.,by dividing by 2). Then, we compute a weighted average ofthe predictions to decide on the expected cargo demand.
A predictor makes use of previous cargo supply data avail-able and makes a prediction for the demand at the currenttime. It is a function that uses St−1, St−2, . . . , St−x (past data)and Dt−1, Dt−2, . . . , Dt−x and predicts the demand for theforthcoming day.
The predictors used here are:
1) basic statistical functions (e.g., average, minimum, max-imum cargo supply over specific days of the week suchas Sundays, Saturdays, other weekdays, and others);
2) cargo market share of the airline in given route comparedto other airlines operating in the same route;
3) economic and quarterly GDP growth in the region(expected growth in demand);
4) monthly industry growth rate in the region;5) average monthly inflation rate in the region;6) monthly exports/imports growth rate in the region;7) average cargo supply during special occasions like
Valentine’s Day, Mother’s Day, and others;8) average cargo supply during the first two quarters of the
year;9) average cargo supply during last two quarters of the
year;10) average demand over the last j days (where j is a tunable
parameter, e.g., 15);
This article has been accepted for inclusion in a future issue of this journal. Content is final as presented, with the exception of pagination.
TOTAMANE et al.: AIR CARGO DEMAND MODELING AND PREDICTION 5
11) the rational predictor (presume that cargo supply on theday will be same as on the previous day);
12) maximum and minimum cargo supplied over last week;13) cargo supply during the first week of every quarter.
Of the various predictors available, each airline choosessome k predictors. To begin with, these k can be all thepredictors that are available, but it is reasonable to surmise thata producer would hand-pick certain specific predictors basedon computation efficiency, availability, or other such factors.Then, each agent has k predictions about the demand on thecoming day, each of which is denoted by Oi,p,t , representingthe prediction made by the pth predictor of airline i for day t.The airline i decides the supply Si,t to be made available on dayt, based on the forecasts of the k predictors, using a weightedmajority approach. Each agent i maintains a weight Wi,p,t foreach predictor p, 1 ≤ p ≤ k, at time t, and updates it aftereach iteration or day, with the weight of the accurate predictorsincreasing and that of the inaccurate ones decreasing. Theinitial weights of all predictors may be equal or may be set tosome predetermined or random nonzero values.
The WMA is robust against prediction errors by individ-ual predictors, and whatever be the initial nonzero weightsassigned to the predictors, their stable values always convergein the same way depending on their performances. Thus, moreand new predictors can always be added to the mix, and doingthis does not hurt the performance even if the new predictorsturn out to be not so good.
The iterative update and learning algorithm used by theplayers (or agents) can be summarized in the following steps.Each airline i, on a day t, does the following:
1) predicts the demands using all the individual predictors,i.e., finds Oi,p,t, ∀p = 1, 2, . . . k;
2) predicts the demand Pi,t using all the predictors, usinga WMA;
3) decides on the supply Si,t that can be handled;4) updates the weights of all predictors based on the actual
demand and supply seen on the day.
The prediction of total cargo demand for a particular day ofthe year is calculated by taking the weighted majority [17] ofthe predictions made by the all predictors of the agent, that is
Pi,t =
k∑
p=1
(Wi,p,t × Oi,p,t)
k∑
p=1
(Wi,p,t)
.
After each day, an agent updates the weights of all its pre-dictors based on how close they were in the previous instancein predicting the actual demand. The update equation of theweight of a predictor p at an instance t is Wi,p,t+1 = Wi,p,t ×F ,where F = βϑ, with β being a fixed parameter chosen suchthat 0 < β < 1. This β measures how drastic predictionschange over iterations. The smaller the β, the more drasticthe changes. If the WMA is applied to a pool of functionswith β = 0 with their initial weights being equal, then it isidentical to the Halving Algorithm [53]. If β > 0, then theWMA gradually decreases the influence of those predictors
TABLE I
Notation
Symbol Descriptionn Number of airlines (agents).t Specific day.k Maximum number of predictors.p Specific predictor 1 ≤ p ≤ k.x Number of days.F Pool of experts or predictors or functions.β Fixed parameter, 0 < β < 1.m Number of errors or mistakes.Cq Cargo capacity of a specific aircraft type q.Si,t Sum of cargo capacities (Cq) of all cargo flights
operated by an agent i on a given day t
for a specific route.Di,t Cargo demand for an agent i on day t.Dt Total cargo demand on a specific route for a
day t,∑n
i=1 Di,t .Pi,t Predicted cargo demand of an agent i on a day t.Oi,p,t Predicted cargo demand of a predictor p
for an agent i on a day t.Wi,p,t Weight of a predictor p for an agent i on a day t.LFi,t Predicted LF for an airline i for a day t.
that make a large number of mistakes and gives the predictorsthat make few mistakes and high relative weights. Supposethat the WMA is applied to a pool F of predictors and thatsequence of trials has m anomalies with respect to F . In thiscase, the value of β is slowly increased over the trials andkept constant when WMA makes no more than a constant (β)times log |F | + m mistakes.
If Oi,p,t/Dt > 1, then ϑ is set to Oi,p,t/Dt , and ifOi,p,t/Dt ≤ 1, then ϑ ← Dt/Oi,p,t .
After updating all the weights, they are normalized to bebetween 0 and 1 using
Wi,p,t+1 =Wi,p,t+1
k∑
p=1
Wi,p,t+1
.
Once we predict the cargo demand Pi,t , the agent has todecide on the supply Si,t . As explained earlier, Si,t is restrictedto discrete values that are combinations of different cargocapacities of aircraft (Cq) and the numbers of trips theseaircraft operated on a given route and day. Even though variousstrategies can be used to decide Si,t , to begin with, the airline’sprevious flight schedule can be used.
We can calculate the predicted cargo LF LFi,t using
LFi,t =Pi,t
Si,t
.
The notations used in the algorithm are summarized inTable I.
IV. Proposed Mechanisms
A. Learning Mechanism
The WMA requires past data for a learning model. Wehave designed the learning model and demonstrate it usingtwo years or 730 days worth of past data. However, like any

This article has been accepted for inclusion in a future issue of this journal. Content is final as presented, with the exception of pagination.
6 IEEE SYSTEMS JOURNAL
Algorithm 1 LearningInput : Previous cargo supply data of an airline i for a
specific route (Si,t, Si,t−1, . . . , Si,t−x) Previouscargo demand data of an airline i for a specificroute (Di,t, Di,t−1, . . . , Di,t−x) Previous totalcargo demand data for a specific route(Dt, Dt−1, . . . , Dt−x)
Output: Weights of the predictors (Wi,1, Wi,2, . . . , Wi,k)Predicted cargo demand data of an airline i fora specific route (Pi,t, Pi,t−1, . . . , Pi,t−x)
// Calculate and assign values to k
predictors for e, g
Oi,p,t ← 120.0;// Initialize weights of the predictors
to a random valueW[p] ← 0.5;// Initialize β to a valueβ ← 0.5 ;
for t ← 1 to x do// Select k predictors for day t
x1 ← 0.0;x2 ← 0.0;for p ← 1 to k do
x1 ← x1 + (Wi,p,t × Oi,p,t) ;x2 ← x2 + Wi,p,t ;
Pi,t = x1x2 ;
if Oi,p,t
Dt> 1 then ϑ ← Oi,p,t
Dt;
else ϑ ← Dt
Oi,p,t;
Wi,p,t+1 ← Wi,p,t × βϑ;// normalize weights between 0 and 1Wi,p,t+1 = Wi,p,t+1
∑kp=1 Wi,p,t+1
;
end
other learning models, the more the past data used, the betterthe accuracy and precision of prediction.
Let us assume there are multiple cargo airlines operatingon a specific cargo route and that we have the data for thetotal amount of cargo transported or actual cargo demand dataper day (Dt) for x days. Now consider one of the operatingairlines i for which we also have past data for cargo supply(Si,t), and cargo demand (Di,t), for x number of past days.
Next, we select k predictors and assign a weight to eachof them. The prediction by a predictor could be based onhistorical data, statistical functions, economic data, or randomvalues. For example, a predictor “average cargo supply onSaturdays” gives the average value of cargo supply of anairline i for all Saturdays over a period of x days. Theremaining steps of the learning model are self-explanatory andare presented in Algorithm 1.
Even though the value of β is constant, choosing a suitablevalue plays an important role in demand prediction. Thelearning model in Algorithm 1 is iterated for different valuesof β starting from β ← 0.1 to β ← 0.99. The number ofprediction errors m with a specific tolerance level is calculated
Algorithm 2 Air cargo demand prediction and applicationInput : Weights of the predictors (Wi,1, Wi,2, . . . , Wi,k)
Cargo demand prediction values predictors(Oi,1, Oi,2, . . . , Oi,k) Future cargo supply dataof an airline i for a specific route(Si,t, Si,t+1, . . . , Si,t+x)
Output: Predicted cargo demand data of an airline i fora specific route (Pi,t, Pi,t+1, . . . , Pi,t+x) PredictedLF of an airline i for a specific route(LFi,t , LFi,t+1, . . . , LFi,t+x)
for t ← 1 to x do// Select k predictors for day t
x1 ← 0.0;x2 ← 0.0;for p ← 1 to k do
x1 ← x1 + (Wi,p,t × Oi,p,t) ;x2 ← x2 + Wi,p,t ;
Pi,t = x1x2 ;
LFi,t = Pi,t
Si,t;
end
for each iteration. The value of β for an iteration, which resultsin the least number of errors is taken as a constant value forthe model. In our paper, we used a tolerance level of ±25%,leading to a β value of 0.87.
B. Cargo Demand Prediction and Application Mechanism
Once we have values for the weights for the predictors fromthe learning model, we can predict the air cargo demand ofan airline i, which is operating in that specific route, for anyspecific future day t by selecting k appropriate predictors fromall possible predictors. The testing and application model arepresented in Algorithm 2. Even though the learning algorithmis generic, the algorithm has to be applied first on the historicalcargo data of any airline i operating in a given route, to predictthe future cargo demand.
By observing the trend of the cargo LF LFi,t and air cargoflight schedule over a period of time, various cargo capacityplanning strategies, e.g., addition or removal of flights, can beapplied to optimize Si,t , which, in turn, affects the LFi,t . Somesuch examples are illustrated further in Section V.
Strategies that increase the LF are generally better. However,maximizing LF to the highest possible value would not be ableto address sudden unanticipated demand as well as some of theinherent issues in the system, such as bad weather, scheduledisruption, technical snag, and crew availability. Successfulair cargo carriers keep cargo LFs at not much more than 70%,indicating that having some margin on the LF enables thecargo airlines to provide reliable and on-time services in theface of uncertainties.
V. Results
We note that econometric forecasts depend on a number ofdifferent factors, assumptions, and judgments, which subject
This article has been accepted for inclusion in a future issue of this journal. Content is final as presented, with the exception of pagination.
TOTAMANE et al.: AIR CARGO DEMAND MODELING AND PREDICTION 7
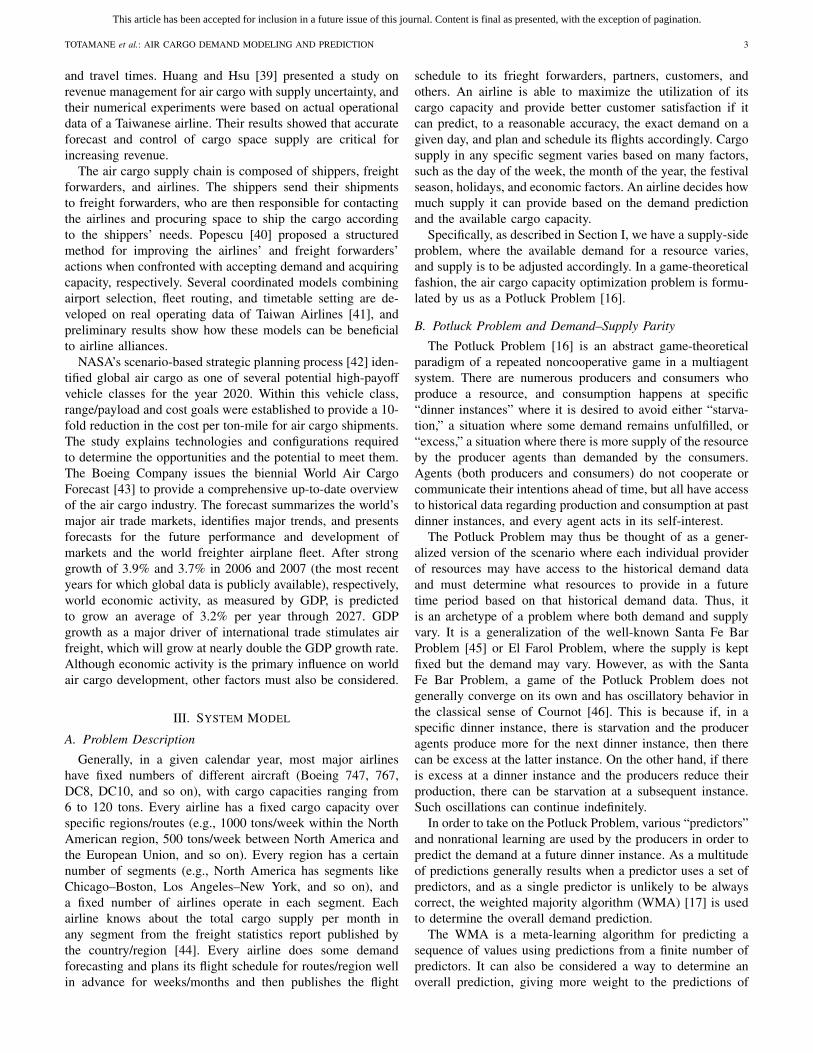
Fig. 1. Air cargo demand prediction for route A–B of airline X.
them to some degree of uncertainty. As described earlier, ouralgorithm uses multiple predictors, and, in fact, any otherforecasting algorithm can also be used as one of the predictors.Hence, the proposed method is no less accurate on a long-termbasis than any other forecasting method.
Even though airlines schedule the flights in a network ofroutes to meet the cargo demand of a region, as well as otherkey success factors such as on-time delivery, it is importantto analyze cargo demand planning at a micro level or at aspecific route level to ensure improved LF and, in turn, betterprofitability. Hence, we chose to predict the air cargo demandof some leading North American airlines for a few NorthAmerican routes that have varying cargo demands. The resultsaim to answer the following questions about our proposedapproach for air cargo demand prediction.
Q1) How correctly and closely can we predict the cargodemand?
Q2) How do economic factors and other factors influence thecargo demand?
Q3) How can our approach help improve the cargo LF?
A. Q1
To address the first question, we chose four different routesand did four simulations. The total cargo demand in each routewas met by two to four airlines. In every simulation, we chosea specific route and a specific airline operating on that route.The actual total cargo supply data of a route and actual cargosupply data of the chosen airline for the years 2005 and 2006were used as training data to obtain weights of predictors inthe WMA. These predictors were then applied to predict thecargo demand of the chosen airline for the year 2007. In allfour simulations, the algorithm’s weighted predictions wereaccurate nearly 75%–81% of the time (275–295 days in ayear) with a tolerance level of ±25% of the airline’s actualcargo demand.
In the first simulation, the algorithm’s weighted predictionswere accurate nearly 81% of the time (295 days in a year),with a tolerance level of ±25% cargo demand. Fig. 1 depictsdemand prediction for the fourth quarter of the year 2007 ofa specific route (A–B) operated by a major airline X.
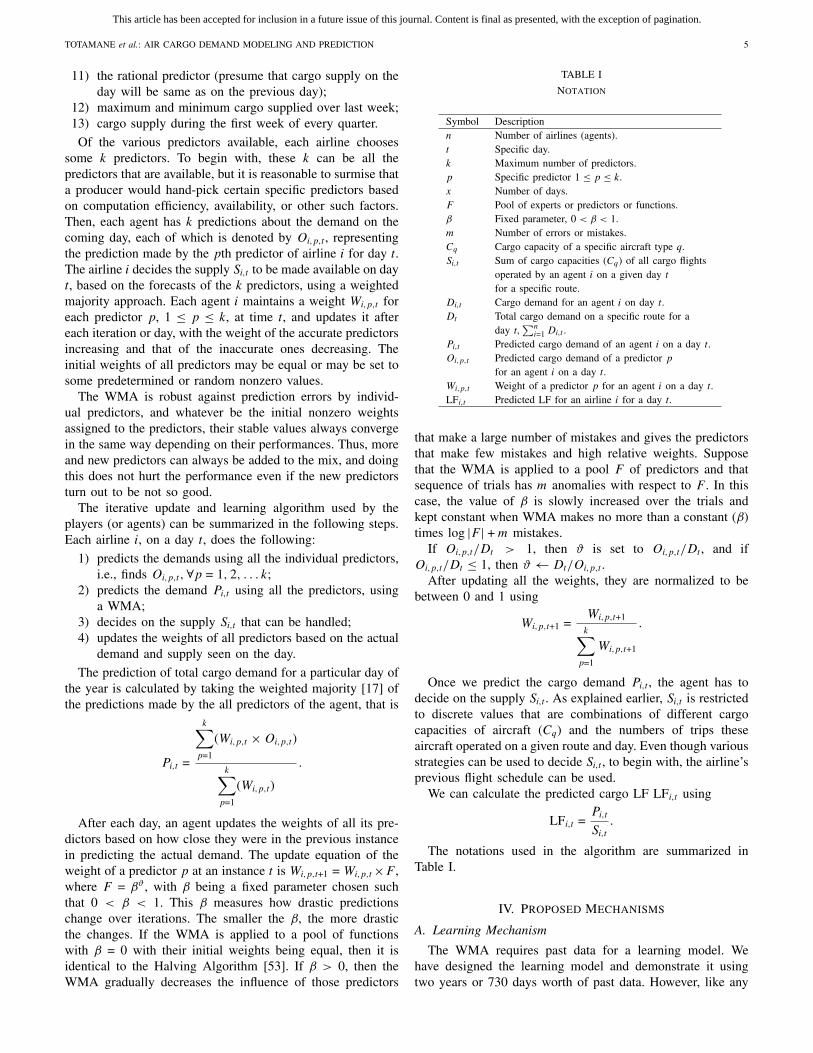
Fig. 2. Performances of the predictors for route A–B of airline X.
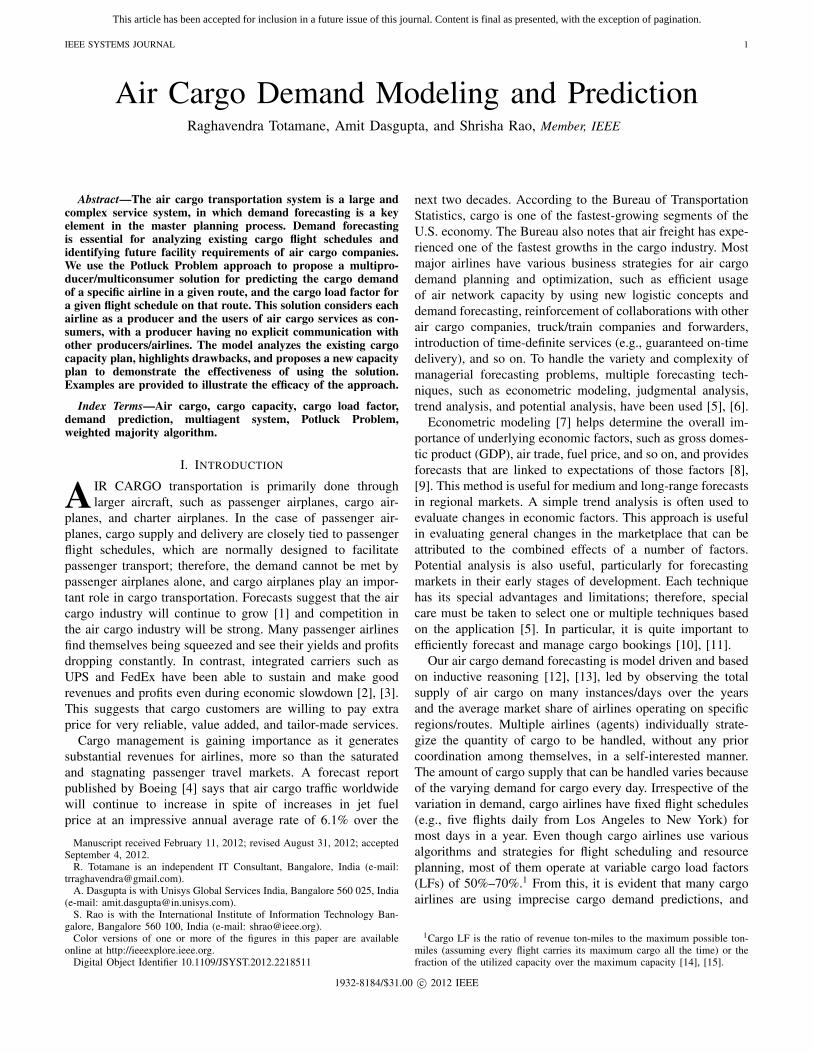
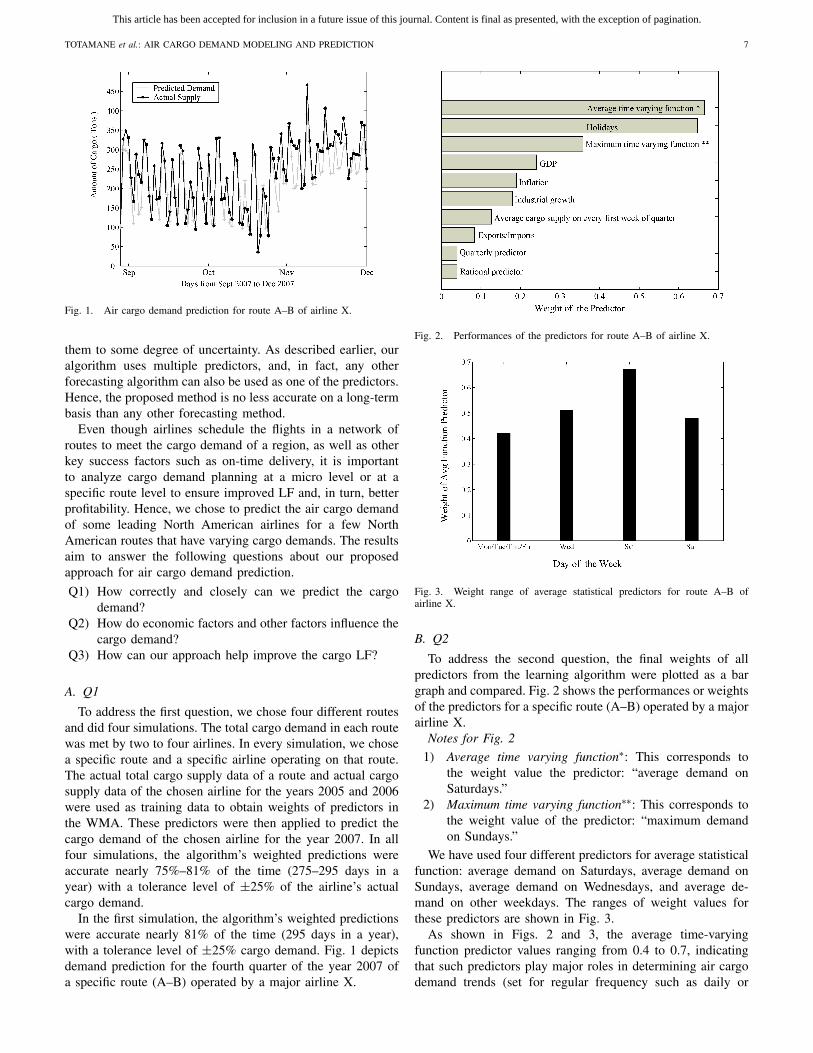
Fig. 3. Weight range of average statistical predictors for route A–B ofairline X.
B. Q2
To address the second question, the final weights of allpredictors from the learning algorithm were plotted as a bargraph and compared. Fig. 2 shows the performances or weightsof the predictors for a specific route (A–B) operated by a majorairline X.
Notes for Fig. 2
1) Average time varying function∗: This corresponds tothe weight value the predictor: “average demand onSaturdays.”
2) Maximum time varying function∗∗: This corresponds tothe weight value of the predictor: “maximum demandon Sundays.”
We have used four different predictors for average statisticalfunction: average demand on Saturdays, average demand onSundays, average demand on Wednesdays, and average de-mand on other weekdays. The ranges of weight values forthese predictors are shown in Fig. 3.
As shown in Figs. 2 and 3, the average time-varyingfunction predictor values ranging from 0.4 to 0.7, indicatingthat such predictors play major roles in determining air cargodemand trends (set for regular frequency such as daily or

This article has been accepted for inclusion in a future issue of this journal. Content is final as presented, with the exception of pagination.
8 IEEE SYSTEMS JOURNAL
TABLE II
Airline X Flight Schedule
Origin Destination Flight Flight Flight CargoAirport Airport. No. Frequency Type Capacity
(Tons)A B X1 WS A300–600R 59.02A B X2 MWRFSS A300–600R 59.02A B X2 MWRFSS A300–600R 59.02A B X3 MTWRFSS A300–600R 59.02A B X4 SS A300–600R 59.02A B X5 MTWRFSS A300–600R 59.02A B X6 SS A300–600R 59.02
weekly). The performance of an average function is influencedby large volumes of past data. Similarly, the holiday predictorvalue ranging from 0.4 to 0.65, playing a significant role inthe airlines deciding on the number of cargo aircraft that theywill need to operate to meet the demand during the holidayseason.
We have also plotted the weight values and analyzed othereconomic predictors, such as the GDP, inflation, industrialgrowth, and import/export commercial activity, as shown inFig. 2. It was observed that although the GDP and inflationhave an influence in determining the future quarter or annualdemand, the corresponding predictors have a relatively lowerimpact on the daily or weekly demand trends—this agrees wellwith our intuition in the matter. The air cargo demand arisingfrom imports and exports of a nation/state is predicted to below, as we have used regional routes for the analysis.
C. Q3
Here we answer the third question in detail.As stated in the problem description, all airlines operate a
certain number of flights (e.g., two flights daily) on specificroutes, throughout the quarter/year. Each airline prepares aflight schedule based on its own prediction model(s) and/oraccording to the prediction provided by the freight forwarders,or predictions from other sources. On a given day, an airlineoperates different flight types with different capacities. Airlinesalso operate extra flights for holidays, such as Christmas, NewYear’s Day, and so on, to handle the episodic extra demand.Once the season ends, the airlines take out the extra flight(s)and continue with an earlier off-peak schedule. Table II showsthe flight schedule for route A–B of airline X.
The above flight schedule is for the period of January 8,2007 to November 23, 2007, except during the first week ofevery quarter. During the first week of every quarter and fromNovember 24, 2007 to January 7, 2008, airline X operated oneadditional flight on all days of the week.
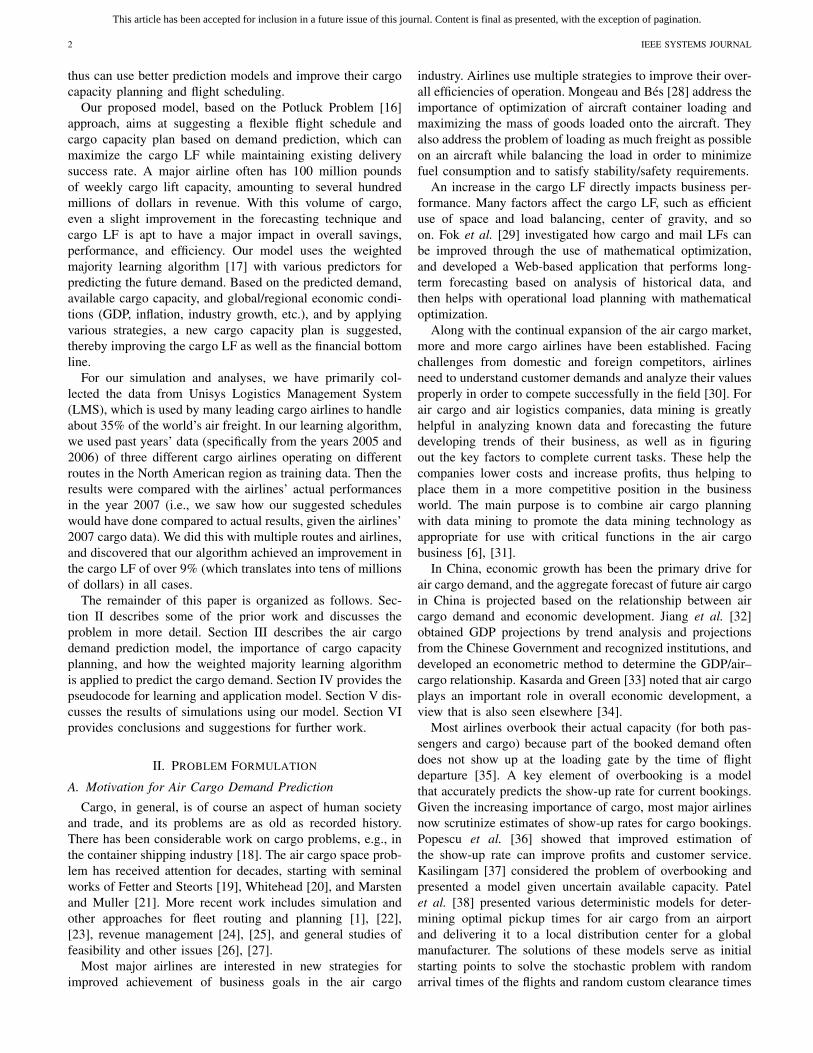
Notes for Fig. 4
1) cp-1: This was the cargo capacity for airline X for routeA–B from January 8, 2007 to November 23, 2007.
2) cp-2: This was the cargo capacity for airline X for routeA–B from November 24, 2007 to January 8, 2008.
Here we try to establish a relationship with the results ofStage 1 and Stage 2, i.e., we try to predict the cargo LF basedon the predicted demand and the actual cargo capacity.
Fig. 4. Cargo capacity of airline X for route A–B for the year 2007.
Fig. 5. Predicted cargo LF.
The predicted cargo LF LFi,t = predicted cargo demand Pi,t
divided by the actual cargo capacity Si,t .Fig. 5 depicts the predicted cargo LF for route A–B of
airline X for the fourth quarter of the year 2007.For the data indicated in Fig. 5, it was observed that
the average predicted cargo LF was 62.5% and it was alsoobserved that actual cargo capacity is underutilized (less than70%, which is considered as the optimum cargo LF) on mostof the Thursdays, Fridays, Saturdays, and Sundays, exceptduring the first week of every quarter and also days fromNovember 24, 2007 to December 31, 2007. An unutilizedcargo capacity of 25%–30% is almost equivalent to a wastedcargo capacity of one flight on most days (78% of the days).Hence, we predict that if airline X operates one flight less onthese days, the average cargo LF would increase to 66.98%,which is a 7.16% improvement over the previously predictedcargo LF, and an effective improvement of 9.82% over theactual cargo LF. Fig. 6 shows the suggested cargo capacityfor route A–B on most days in the year 2007 except duringthe first week of every quarter, and the days from November24, 2007 to December 31, 2007.
As mentioned earlier, airlines can, in theory, use variousstrategies to improve the LF. However, when an airline has adefined flight schedule in place, the “flight deletion” strategy is

This article has been accepted for inclusion in a future issue of this journal. Content is final as presented, with the exception of pagination.
TOTAMANE et al.: AIR CARGO DEMAND MODELING AND PREDICTION 9
Fig. 6. Suggested cargo capacity.
TABLE III
Cargo Capacity Optimization Simulation Results
Airline Route Current Load Effective No. of DaysLoad Factor Improvement DemandFactor After (%) Overshoots
(%) Applying the CargoOur Model Capacity
(%)X A–B 63.39 69.62 9.82 5Y G–H 66.97 73.13 9.19 2Y E–F 64.31 71.11 10.57 6X C–D 66.23 72.52 9.49 7
the more realistic and feasible among them. Any other strategywould involve adding or rerouting a flight at short notice, andwould be difficult to make happen even when suggested intheory, as it would be subject to real-world constraints suchas legal and statutory approvals of flight plans, financial andlogistical investments on the ground at points of origin anddestination, crew availability, and so on.
D. Summary of Results
The sample air cargo demand prediction and cargo capacityplanning given above are relevant to the specific instanceof the airline X for a route A–B. However, the procedurewe demonstrated in a particular case can be applied in astraightforward manner to another commercial carrier and withother operating routes. We have simulated the same procedurefor four instances, covering two different airlines and fourdifferent routes. The results are shown in Table III.
The first simulation was done on airline X for route A–B,where the actual average cargo LF was 63.39% for the year2007. If airline X had used our prediction model and followedsuggested cargo capacity, the average cargo LF would havebeen 69.62%, which is an effective improvement of 9.82%.However, the actual demand overshoots the cargo capacity onfive occasions or five days, which is merely 1.36% of the year.
The second simulation was done on airline Y for routeG–H. The weighted majority approach with the same set ofpredictors used in the previous simulation was able to predictthe cargo demand 76.71% of the time (280 days in a year),with a tolerance level of ±25%. Airline Y operates a variety
Fig. 7. Actual cargo capacity of airline Y for route G–H in year 2007.
Fig. 8. Suggested cargo capacity of airline Y for route G–H in year 2007.
of flights (Boeing 757-200, Boeing 762, and Boeing 763)with capacities ranging from 27 to 76 tons, and daily cargocapacity ranging from 209.5 to 393 tons over the weekdays,with 209.5 tons of cargo capacity being the lowest on Mondaysand Fridays, and 393 tons on Saturdays. The predicted averagecargo LF was 64.71%, and the actual cargo capacity wasunderutilized (with a cargo LF less than 70%) on most days inthe year 2007, except during the last quarter of that year. Byremoving certain flights on certain days of every quarter, theactual cargo LF could have been increased from 66.97% to73.13%, which is an effective improvement of 9.19%. Fig. 7shows the actual cargo capacity of the route and Fig. 8 showsthe suggested cargo capacity for the route. The legends Q1–Q4represent quarters of the year 2007.
The third simulation was done on airline Y for route E–F. The weighted majority approach with the same set ofpredictors used in the previous simulation was able to predictthe cargo demand 75.35% of the time (275 days in a year)with tolerance level of ±25%. Airline Y operates a variety offlights (Boeing 757-200, Airbus 300-600R, and Boeing 767-300ER) with capacities ranging from 44.45 to 66.6 tons, anddaily cargo capacity ranging from 414.02 to 754.51 tons overthe weekdays, with 414.02 tons of cargo capacity being thelowest on Mondays and Fridays, and 754.51 tons on Saturdays.As discussed previously, the predicted average cargo LF was
This article has been accepted for inclusion in a future issue of this journal. Content is final as presented, with the exception of pagination.
10 IEEE SYSTEMS JOURNAL
66.77%, and the actual cargo capacity was underutilized (lessthan 70%) on most of the Saturdays and Sundays in the year2007, except the days from November 24, 2007 to December31, 2007. By removing multiple flights (Boeing 757-200 andBoeing 767-300ER), which have a total cargo capacity of 177tons, on Saturdays and Sundays, the actual cargo LF couldhave been increased from 64.31% to 71.11%, which is aneffective improvement of 10.57%. Similar descriptions can begiven for the fourth simulation.
VI. Conclusion
The simulations carried out on multiple airlines for differentsegments showed that the algorithm used was able to predictcargo demand with reasonably high accuracy. In this paper, wemodeled the problem using some of the generic predictors,such as time-varying functions, holidays, weekends, and soon. Additional predictors, such as industrial output, industrialgrowth, GDP, and so on, were considered but not found tomake a significant overall difference. The predictors usedplayed a significant role in improving the efficiency of ourair cargo demand predictions. The air freighter fleet forecastanalysis may then proceed to consider many other factors—such as airplane capability, performance, and availability, theregional domicile level for each airline, airport slot availability,accounting for variables such as individual fleet type and age,airplane size, cargo volume, retirements, utilization, strategies,and so on.
Accurate predictions of cargo demand in our simulationshelped us to apply the flight deletion strategy and therebyimprove airlines’ average cargo LFs by 9%–12%. However,in real-life scheduling of freight aircrafts, a thorough analysisand understanding of top–down air cargo flows and freightercapabilities can be combined with detailed bottom-up infor-mation on specific regional and operator trends and strategies.The algorithm used here can also be used in air cargo logisticsmanagement solutions, such as Unisys LMS, and the overallbenefits or improvements can be benchmarked with any otherenterprise cargo logistics management solution.
In the future, this work can be used to evaluate varioustypes of predictors, which, in turn, would lead to a betterunderstanding of the factors that influence air cargo demand.Economic models of industry and GDP growth are useful in acertain measure, but do not usually offer a concrete means ofcomparison of such factors with others. Using our approach, itis possible to add such factors, (e.g., predictors) in the WMA,and the stable weights (see Fig. 2) attained by the predictorscan then give us a clear idea about the degree of influence thateach such factor has on the matter at hand.
VII. Acknowledgment
The authors would like to thank H. Gupta, V. Sanjeeva,G. Rajan, and L. N. V. Samy, who facilitated this research byarranging access to much needed data. The authors would alsolike to thank the reviewers for their many insightful comments,which helped to improve this paper, and the participants andreviewers of the Third Annual IEEE International Systems
Conference, held in March 2009 in Vancouver, BC, Canada,for their detailed and insightful comments and suggestions ona preliminary extended abstract [54] as a part of this paper.The authors also acknowledge the help of R. Mulukutla in theearlier paper.
References
[1] K. Zhu, M. W. Ludema, and R. E. C. M. van der Heijden, “Air cargotransport by multi-agent based planning,” in Proc. 33rd Hawaii Int. Conf.Syst. Sci., vol. 2. 2000, p. 10.
[2] UPS. (2004–2012). UPS Investor Relations and Annual Reports[Online]. Available: http://www.investors.ups.com/phoenix.zhtml?c=62900&p=irol-reportsannual
[3] FedEx. (2000–2012). FedEx Financial Information and Annual Re-ports [Online]. Available: http://investors.fedex.com/phoenix.zhtml?c=73289&p=irol-reportsannual
[4] Boeing. (2006–2007). World Air Cargo Forecast, Executive Summaryand Significant Industry Trends [Online]. Available: http://bit.ly/d93P4p
[5] D. F. Pierce, World Air Cargo Forecast. Darby, PA: Diane Publishing,2004.
[6] C. Li, D. Zhou, C. Xie, and Z. Wu, “The strategic research of air cargobased on rule knowledge and decision tree,” in Proc. IEEE Int. Conf.SOLI, Aug. 2007, pp. 1–4.
[7] Z. Griliches and M. Intriligator, Eds., Handbook of Econometrics, vol. 1.Amsterdam, The Netherlands: North-Holland, 1983.
[8] A. Deaton and J. Muellbauer, Economics and Consumer Behavior, vol.Reprint. Cambridge, U.K.: Cambridge Univ. Press, 1999.
[9] W. Greene, Econometric Analysis, 5th ed. Englewood Cliffs, NJ:Prentice-Hall, 2004.
[10] H. C. W. Lau, W. T. Tsui, C. K. M. Lee, G. T. S. Ho, and A. Ning,“Development of a profit-based air cargo loading information sys-tem,” IEEE Trans. Industr. Inform., vol. 2, no. 4, pp. 303–312, Nov.2006.
[11] L. C. Leung, W. Cheung, and Y. Van Hai, “A framework for a logisticse-commerce community network: The Hong Kong air cargo industry,”IEEE Trans. Syst., Man, Cybern. A, Syst., Humans, vol. 30, no. 4, pp.446–455, Jul. 2000.
[12] J. H. Holland, K. J. Holyoak, R. E. Nisbett, and P. R. Thagard, Induction.Cambridge, MA: MIT Press, 1986.
[13] C. Alippi and P. Braione, “Classification methods and inductive learningrules: What we may learn from theory,” IEEE Trans. Syst., Man, Cybern.C, Appl. Rev., vol. 36, no. 5, pp. 649–655, May 2006.
[14] S. Airlines. (2008). Group Financial Performance First Quarter [On-line]. Available: http://bit.ly/byP2fP
[15] IATA. (2009, Jan.). Cargo Plummets 22.6% in December (press release)[Online]. Available: http://www.iata.org/pressroom/pr/2009-01-29-01.htm
[16] P. K. Enumula and S. Rao, “The Potluck problem,” Eco. Lett., vol. 107,no. 1, pp. 10–12, Apr. 2010.
[17] N. Littlestone and M. K. Warmuth, “The weighted majority algorithm,”Inform. Computat., vol. 108, no. 2, pp. 212–261, Feb. 1994.
[18] J. S. K. Ang, C. Cao, M. Parlar, and H.-Q. Ye, “Two-stage stochasticinteger programming model for multiperiod sea cargo mix problem incontainer shipping industry,” IEEE Trans. Syst., Man, Cybern. A, Syst.,Humans, vol. 39, no. 2, pp. 460–465, Mar. 2009.
[19] R. B. Fetter and R. C. Steorts, A Model for the Design and Evalu-ation of Air Cargo Systems. Santa Monica, CA: RAND Corporation,1966.
[20] A. H. Whitehead, “The promise of air cargo–system aspects and vehicledesign,” Acta Astronautica, vol. 4, nos. 1–2, pp. 77–98, 1977.
[21] R. E. Marsten and M. R. Muller, “A mixed-integer programmingapproach to air cargo fleet planning,” Manag. Sci., vol. 26, no. 11, pp.1096–1107, Nov. 1980.
[22] S. Yan, S.-C. Chen, and C.-H. Chen, “Air cargo fleet routing andtimetable setting with multiple on-time demands,” Transportat. Res. PartE: Logist. Transportat. Rev., vol. 42, no. 5, pp. 409–430, 2006.
[23] A. L. Nsakanda, M. Turcotte, and M. Diaby, “Air cargo operationsevaluation and analysis through simulation,” in Proc. 36th Winter Simul.Conf., 2004, pp. 1790–1798.
[24] K. Amaruchkul, W. L. Cooper, and D. Gupta, “Single-leg air-cargorevenue management,” Transportat. Sci., vol. 41, no. 4, pp. 457–469,2007.

This article has been accepted for inclusion in a future issue of this journal. Content is final as presented, with the exception of pagination.
TOTAMANE et al.: AIR CARGO DEMAND MODELING AND PREDICTION 11
[25] P. Bartodziej and U. Derigs, “On an experimental algorithm for revenuemanagement for cargo airlines,” in Experimental and Efficient Algo-rithms (Series Lecture Notes in Computer Science), vol. 3059, C. Ribeiroand S. Martins, Eds. Berlin/Heidelberg, Germany: Springer, 2004, pp.57–71.
[26] T. R. Scherck, “Air cargo: Beyond the valley lies a land of milk, honey,and profits,” Transportat. Distrib., vol. 39, no. 7, pp. 45–48, Jul. 1998.
[27] J. Gardiner, S. Ison, and I. Humphreys, “Factors influencing cargoairlines’ choice of airport: An international survey,” J. Air TransportManag., vol. 11, no. 6, pp. 393–399, 2005.
[28] M. Mongeau and C. Bes, “Optimization of aircraft container loading,”IEEE Trans. Aerosp. Navig. Electron., vol. 39, no. 1, pp. 140–150, Jan.2003.
[29] K. Fok, K. Ming, A. Chun, and H. Wai, “Optimizing air cargo loadplanning and analysis,” in Proc. Int. Conf. Comput., Commun. Contr.Technol., Aug. 2004.
[30] C. M. Group. (2008). International Air Freight and Express IndustryPerformance Analysis [Online]. Available: http://bit.ly/dwwfR6
[31] C. Li and Z. Danqing, “Study on predictive model of air cargo customerdefection based on decision tree,” in Proc. Int. Conf. Wireless Commun.,Netw. Mobile Comput., WiCom, Sep. 2007, pp. 3693–3696.
[32] H. Jiang, L. Ren, and J. Hansman, “Market and infrastructure analysisof future air cargo demand in China,” presented at the AIAA’s 3rdAnnual Aviation Technology, Integration, and Operations (ATIO) Forum,Denver, Colorado, Nov. 2003 [Online]. Available: http://dspace.mit.edu/handle/1721.1/35819
[33] J. D. Kasarda and J. D. Green, “Air cargo as an economic developmentengine: A note on opportunities and constraints,” J. Air TransportManag., vol. 11, no. 6, pp. 459–462, 2005.
[34] K. Button and S. Taylor, “International air transportation and economicdevelopment,” J. Air Transport Manag., vol. 6, no. 4, pp. 209–222, 2000.
[35] Y. Gui, B. Gong, and Y. Cheng, “Research on air cargo overbookingmodel,” in Proc. 4th Int. Conf. Wireless Commun., Netw. Mobile Com-put., WiCOM, Oct. 2008, pp. 1–4.
[36] A. Popescu, P. Keskinocak, E. Johnson, M. LaDue, and R. Kasilingam,“Estimating air-cargo overbooking based on a discrete show up-ratedistribution,” Interfaces, vol. 36, pp. 248–258, May–Jun. 2006.
[37] R. G. Kasilingam, “An economic model for air cargo overbooking understochastic capacity,” Comput. Indust. Eng., vol. 32, no. 1, pp. 221–226,1997.
[38] M. H. Patel, Y. Dessouky, S. Solanki, and E. Carbonel, “Air cargo pickupschedule for single delivery location,” Comput. Ind. Eng., vol. 51, no. 3,pp. 553–565, 2006.
[39] K. Huang and W. Hsu, “Revenue management for air cargo space withsupply uncertainty,” in Proc. Eastern Asia Soc. Transportat. Studies,vol. 5. 2005, pp. 570–580.
[40] A. Popescu, “Air cargo revenue and capacity management,” Ph.D.dissertation, Dept. Ind. Syst. Eng., Georgia Inst. Technol., Atlanta, Nov.2006.
[41] S. Yan and C.-H. Chen, “Optimal flight scheduling models for cargoairlines under alliances,” J. Schedul., vol. 11, no. 3, pp. 175–186, 2008.
[42] M. J. Logan, “2020: Future vision for global air cargo,” presented at theAIAA 98-0437, 36th Aerospace Sciences Meeting and Exhibit, Reno,NV, NASA Langley Tech. Rep. Server, Jan. 1998 [Online]. Available:http://bit.ly/aW9AXW
[43] Boeing. (2008–2009). World Air Cargo Forecast [Online]. Available:http://bit.ly/bDZgo0
[44] U.S. International Air Passenger and Freight Statistics Report, Officeof Aviation and International Affairs, 2009 [Online]. Available: http://bit.ly/9suhzs
[45] W. B. Arthur, “Inductive reasoning and bounded rationality,” Am. Eco.Rev., vol. 84, no. 2, pp. 406–411, 1994.
[46] A. A. Cournot, Recherches sur les Principes Mathematiques de laTheorie des Richesses, Paris, France: Calmann-Levy, 1974. Originallypublished in 1838, re-printed as H. Guitton, Ed., Les Fondateurs.
[47] T. P. Runarsson and X. Yao, “Search biases in constrained evolutionaryoptimization,” IEEE Trans. Syst., Man, Cybern. C, Appl. Rev., vol. 35,no. 2, pp. 233–243, May 2005.
[48] I. Maity and S. Rao, “Simulation and pricing mechanism analysis ofa solar-powered electrical microgrid,” IEEE Syst. J. (Special Issue onIdentification and Control of Sustainable Energy Systems), vol. 4, no. 3,pp. 275–284, Sep. 2010.
[49] N. Singh and S. Rao, “Modeling and reducing power consumption inlarge IT systems,” in Proc. 4th Annu. IEEE Int. SysCon, Apr. 2010, pp.178–183.
[50] N. Singh and S. Rao, “Energy optimization policies for server clusters,”in Proc. 6th Annu. IEEE CASE, Aug. 2010, pp. 293–300.
[51] N. Singh and S. Rao, “Modeling and reducing power consumption inlarge IT systems,” U.S. Patent Applicat. 12/959481, Dec. 2010.
[52] N. Singh and S. Rao, “The Potluck problem with consumers’ choicebehavior,” in Proc. 5th Annu. IEEE CASE, Aug. 2009, pp. 328–333.
[53] N. Littlestone, “Learning quickly when irrelevant attributes abound: Anew linear-threshold algorithm,” Mach. Learn., vol. 2, pp. 285–318, Apr.1988.
[54] R. Totamane, A. Dasgupta, R. Mulukutla, and S. Rao, “Air cargo demandprediction,” in Proc. 3rd Annu. IEEE Int. SysCon, Mar. 2009, pp. 401–406.
Raghavendra Totamane received the B.E. degreefrom Bangalore University, Bangalore, India, in2001.
He has over 11 years of experience in the in-formation technology (IT) industry and was withUnisys Global Services India, Bangalore, and Or-ange Business Services, Bangalore. He is currentlyan independent IT Consultant in Bangalore, In-dia. His current research interests include supplychain management, service-oriented architecture, ITinfrastructure, cloud computing, and transportation
systems.
Amit Dasgupta received the B.Sc. degree in com-puter science from Bangalore University, Bangalore,India, in 2002, and the M.C.A. degree from the BijuPatnaik University of Technology, Orissa, India, in2005.
He has over six years of experience in the infor-mation technology (IT) industry. Since 2006, he hasbeen with Unisys Global Services India, Bangalore.He has worked in different domains, such as dis-aster recovery, logistics management, and enterpriseapplications. His current research interests include
IT infrastructure, cloud computing, and transportation systems.
Shrisha Rao (M’08) received the M.S. degree inlogic and computation from Carnegie Mellon Uni-versity, Pittsburgh, PA, and the Ph.D. degree incomputer science from the University of Iowa, IowaCity.
He is currently an Associate Professor with Inter-national Institute of Information Technology Ban-galore, Bangalore, India. His current research in-terests include distributed computing, specificallyalgorithms and formal methods for concurrent anddistributed systems, solar energy and microgrids,
cloud computing, energy-aware computing (“green IT”), distributed algo-rithms in sensor networks and other domains, algebraic theories of faulttolerance and system safety, safety-critical systems, and demand-side resourcemanagement.
Dr. Rao is a member of the ACM, the American Mathematical Society, andthe Computer Society of India.