Embed Size (px)
Citation preview

This article has been accepted for inclusion in a future issue of this journal. Content is final as presented, with the exception of pagination.
IEEE SYSTEMS JOURNAL 1
Modeling of ERTMS Level 2 as an SoS andEvaluation of its Dependability Parameters
Using StatechartsSiqi Qiu, Mohamed Sallak, Walter Schön, and Zohra Cherfi-Boulanger
Abstract—In this paper, we consider the European Rail TrafficManagement System (ERTMS) as a System-of-Systems (SoS) andpropose modeling it using Unified Modeling Language statecharts.We define the performance evaluation of the SoS in terms ofdependability parameters and average time spent in each state(working state, degraded state, and failed state). The originalityof this work lies in the approach that considers ERTMS Level 2as an SoS and seeks to evaluate its dependability parameters byconsidering the unavailability of the whole SoS as an emergentproperty. In addition, human factors, network failures, Common-Cause Failures (CCFs), and imprecise failure and repair rates aretaken into account in the proposed model.
Index Terms—Common-Cause Failures (CCFs), dependability,emergent property, European Rail Traffic Management System(ERTMS), human factors, network failures, statecharts, System-of-Systems (SoS).
ACRONYMS
ERTMS European Rail Traffic Management System.SoS System-of-Systems.UML Unified Modeling Language.CCF Common-Cause Failure.SysML Systems Modeling Language.ETCS European Train Control System.QoS Quality of Service.MoDeST Modeling and Description Language for Stochas-
tic and Timed Systems.FMECA Failure Mode Effects and Criticality Analysis.RAMS Reliability, Availability, Maintainability, and
Safety.APRECIH Preliminary Analysis of Consequences of Human
Unreliability.
Manuscript received December 11, 2012; revised May 31, 2013 andSeptember 12, 2013; accepted December 10, 2013. This work was carriedout and funded in the framework of the Labex MS2T. It was supported bythe French Government, through the “Investments for the Future” program,managed by the National Agency for Research under reference ANR-11-IDEX-0004-02.
S. Qiu, M. Sallak, and W. Schön are with the Department of ComputerEngineering, Compiegne University of Technology, Heudiasyc Laboratory,UMR 7253, CNRS, Research Center of Royallieu, 60205 Compiegne, France(e-mail: [email protected]; [email protected]; [email protected]).
Z. Cherfi-Boulanger is with the Department of Mechanics, Compiegne Uni-versity of Technology, Roberval Laboratory, UMR 7337, CNRS, Research Cen-ter of Royallieu, 60205 Compiegne, France (e-mail: [email protected]).
Color versions of one or more of the figures in this paper are available onlineat http://ieeexplore.ieee.org.
Digital Object Identifier 10.1109/JSYST.2013.2297751
INCOSE International Council on Systems Engineering.GSM-R Global System for Mobile communications—
Railways.RTM Radio Transmission Module.BTM Balise Transmission Module.TIU Train Interface Unit.DMI Driver Machine Interface.EVC European Vital Computer.RBC Radio Block Center.EEIG European Economic Interest Group.MUT Mean Up Time.MDT Mean Down Time.MTTF Mean Time to Failure.MTBF Mean Time Between Failures.
I. INTRODUCTION
R ECENT years have seen a growing interest in complexsystems whose constituents are also complex. Model-
ing and evaluating the performance, the robustness, and thedependability of these complex systems in which indepen-dent and heterogeneous constituents cooperate to achieve acommon goal are essential tasks in many applications. Theconcept of a System-of-Systems (SoS) has been proposed inthe context of these complex systems. It is a concept offeringa high-level viewpoint encompassing the interactions betweenthe cooperating independent systems [1]. Jamshidi [1] andNanayakkara et al. [2] introduced a number of fundamental SoStopics, including definition, modeling, emergent properties,applications, and evaluation. The SoS concept has now beenapplied in many fields, including smart grids [3], transportation[4], robotics [1], and military [5]. Huynh and Osmundson [5]considered a maritime domain protection system as an SoS andused several Systems Modeling Language (SysML) diagramsto model and simulate the SoS. Eusgeld et al. [6] treatedcritical infrastructures as an SoS and proposed two modelingalternatives for SoSs: an integrated model containing detailedlow-level models of systems, as well as a high-level model, anda coupled model that aggregates the outputs of the low-levelmodels as inputs at the higher level.
However, to our knowledge, the European Rail Traffic Man-agement System (ERTMS) Level 2 railway signaling system,along with its components (material, human, network, etc.),has so far not been considered as an SoS, and considering theunavailability of the whole ERTMS as an emergent property has
1932-8184 © 2014 IEEE. Personal use is permitted, but republication/redistribution requires IEEE permission.See http://www.ieee.org/publications_standards/publications/rights/index.html for more information.

This article has been accepted for inclusion in a future issue of this journal. Content is final as presented, with the exception of pagination.
2 IEEE SYSTEMS JOURNAL
never been discussed before. ERTMS Level 2 can be consideredas an SoS insofar as it is composed of three independent,complex, and heterogeneous systems: the Onboard system, theTrackside system, and the radio transmission system. All thesesystems are autonomous and geographically distributed. Eachsystem has its own particular function that can be carried outindependently. Furthermore, ERTMS Level 2 has a number ofemergent properties. For example, when a hazardous situationoccurs and automatic barriers fail to operate, the driver, partlyas a result of tiredness, may act in an unexpected and incorrectway. These unexpected and incorrect actions may lead to thefailure of the whole ERTMS and thus represent an emergentproperty.
Reliability, Availability, Maintainability, and Safety (RAMS)Allocation deals with the setting of RAMS goals for individualsystems such that a specified RAMS goal is met at the SoSlevel. SoS-level allocations are successively decomposed usingdependability models (reliability block diagrams, fault trees,etc.) until an appropriate set of RAMS measures has beenapportioned to all the systems comprising the SoS. In railwaysystems, a common method for managing complexity in RAMSAllocation is to divide the SoS into systems according to func-tion. Each system, according to its function, is then designedand developed separately to meet a specific RAMS goal. Forexample, different pieces of trackside and onboard equipmentmay be allocated to control the maximum allowed speed, eachhaving a separate set of RAMS requirements describing itsfunctional behaviors. However, decomposing RAMS require-ments is far from straightforward. Quantifiable goals such ascost or performance may be decomposed by allocating a fixedlimit on each system, but the RAMS requirements of the SoScannot be expressed simply as the sum or the product of theRAMS requirements of its constituent systems. Consider arailway availability goal: “The operational availability of theERTMS/ETCS (European Train Control System), due to allthe causes of failure, shall be not less than 0.99973” [7]. Theconcept of “operational availability” at the SoS level does nothave the same meaning for individual systems and is not thesum or the product of operational availabilities of individualsystems. This property is said to be emergent.
The term emergent was first introduced in 1875 by Lewes,who in his book [8] gave the term a particular philosophicalmeaning. He asserted that a resultant system can be expressedas the sum or the product of its components’ outputs, whereasthe outputs of the components of an emergent system arefundamentally different from each other and from the resultingsystem behavior. For others, emergence has suggested some-thing unexpected that suddenly manifests itself [1], e.g., theshape and behavior of a flock of birds. These authors [1], [9]see an emergent property as a higher level property that stemsfrom the interaction of lower level entities and the environment.It cannot be directly deduced from the properties of lower levelentities. Johnson [9] points out that emergent properties can bebeneficial, for example, when the user of a product discoversnovel functions that were unforeseen by the designer at the levelof the components. Emergent properties may be also harmfulif they reduce the safety requirements. Johnson remarks thatthere is disagreement about the nature of emergent properties:
some see unexpected properties exhibited by a complex sys-tem as emergent properties, whereas others refer to emergentproperties when an application exhibits behaviors that cannotbe identified through functional decomposition. Particularly, inRAMS assessment [10], we consider that emergence causes twotypes of problems. The first occurs when failures at the systemslevel produce failures at the SoS level that were previouslyunidentified (i.e., some system RAMS goals are missing). Thesecond problem, examined in this paper, is when failures at thesystems level produce failures at the SoS level that violate adefined SoS RAMS goal (i.e., the SoS was designed and builtto satisfy the RAMS goal but ultimately did not). In our work,the SoS RAMS goal that we focus on is availability.
In this paper, we have chosen to consider ERTMS Level 2as an SoS for several reasons. First, the SoS approach providesa global view of this signaling system in terms of constituentsand the different relations and interactions among these con-stituents. Second, the interdependent components are consoli-dated, so that component interdependencies can be spotted andeffectiveness can be measured at the SoS level. Third, the emer-gent properties of ERTMS Level 2, including its unavailability,can be analyzed only at the SoS level.
Several models of the ERTMS railway platforms have beenproposed in the literature. Hermanns et al. [11] used StoChartsto model the ETCS and evaluate the dependability of the trainradio system. StoCharts are the Quality-of-Service-orientedextension of Unified Modeling Language (UML) statecharts.They lack tool support; thus, they are translated into theModeling and Description Language for Stochastic and TimedSystems, which is a formal language used for describingstochastic timed systems. Vernez and Vuille [12] have proposeda functional Failure Mode, Effects and Criticality Analysisapproach to optimize the dependability of ERTMS Level 2.Lalouette et al. [13] have proposed an approach based onColoured Petri Nets to evaluate the dependability of theERTMS. Beugin and Marais [14] have used RAMS attributesto evaluate the solutions of satellite-based localization ser-vices in the ERTMS. Herranz et al. [15] have modeled theERTMS/ETCS using UML diagrams and then transformedtheir UML models into Uppaal (integrated tool environmentfor modeling, validation, and verification of real-time systems)specifications. The European Railway Agency [16] has fundeda European Railway Formalization and Validation Project thathas proposed the use of rational tools for the formalization andvalidation of the ETCS specifications. None of the works citedhas provided a complete model that takes all the constituentsof the ERTMS into account while at the same time consideringunavailability as an emergent property of the SoS. This has beenour motivation in proposing our own model.
In this paper, we propose modeling the behavior of ERTMSLevel 2 using statecharts, which are one kind of UML behaviordiagram. They can be used to specify the behavior of vari-ous model elements [17], [18]. Furthermore, UML statechartsintroduce new concepts such as the hierarchy of states andorthogonal regions. They also extend actions that depend onstates and Entry/Do/Exit activities. In fact, statecharts havebeen widely used in research into the modeling of railwaysystems. Banci et al. [19] used statecharts to give precise

This article has been accepted for inclusion in a future issue of this journal. Content is final as presented, with the exception of pagination.
QIU et al.: MODELING OF ERTMS LEVEL 2 AS AN SoS AND EVALUATION OF ITS DEPENDABILITY 3
specifications of a computer-controlled railway interlockingsystem. To develop tools and techniques that can automaticallycheck whether railway equipment conforms to operational re-quirements, Herranz et al. [15] used statecharts to model theERTMS/ETCS specifications. Pap et al. [20] presented methodsand tools for checking general safety criteria in UML state-charts relating to safety-critical systems. Magott and Skrobanek[21] introduced fault trees with time dependencies and timedstatecharts for carrying out timing analysis of safety propertiesin safety critical systems. It should be noted that these variousworks do not address the quantitative evaluation of dependabil-ity parameters in railway systems.
Human factors and network failures are seldom modeledquantitatively (which would involve integrating their rates ofoccurrence) in the evaluation of the dependability parametersof railway signaling systems. Since stress significantly affectshuman performance, Hudoklin and Rozman [22] proposed asimple model where the probability of human error is depen-dent on stress levels. Griffith and Mahadevan [23] discussedthe current status and future directions as regards the inclusionof fatigue in human reliability analysis methods. Kim et al.[24] developed a computer-aided system aiming to analyzehuman errors in railway systems. Their system supports ahierarchy of error causes and relationships among these causes.Vanderhaegen [25], [26] developed a method known asAPRECIH (a French acronym for Preliminary Analysis ofConsequences of Human Unreliability) to analyze the con-sequences of human unreliability for railway system safety.Human behavioral degradation is characterized by a be-havioral model of human unreliability that includes threebehavioral factors: acquisition-related factors, problem-solving-related factors, and action-related factors. Baysari et al. [27],[28] proposed human error identification techniques that help todevelop appropriate prevention strategies. Hamilton and Clarke[29] developed a model of driver information processing. Thismodel studies the driver’s interaction with the infrastructuresby lineside reminder appliances. Note that human factors in theaforementioned research studies are all analyzed qualitatively.Concerning network modeling in reliability studies, Ramirez-Marquez and Coit [30] developed a Monte Carlo simulationmethod for obtaining accurate approximations of multistatetwo-terminal reliability. Ramirez-Marquez and Jiang [31] de-veloped a bounding approach to estimate binary capacitatedtwo-terminal reliability in the presence of uncertainty. Cook andRamirez-Marquez [32] proposed reliability analysis methods ofmobile ad hoc wireless networks whose topological structureschange over time. In our paper, human factors that are consid-ered as the most important causes of train accidents/incidentsand network failures are analyzed quantitatively.
The remainder of this paper is organized as follows.Section II covers the basics of SoSs, ERTMS Level 2, and UMLstatecharts. Section III presents the emergent property of theSoS. Section IV introduces human factors, network failures,and the modeling of ERTMS Level 2 in statecharts. Section Vanalyzes Common-Cause Failures (CCFs). Our model, whichtakes precise and imprecise failure and repair rates into account,is simulated and evaluated in Sections VI and VII. Finally, wepresent some conclusions and perspectives in Section VIII.
Fig. 1. Hierarchical structure of an SoS.
II. BACKGROUND
A. SoS
As a new research domain, SoSs do not have a universallyaccepted definition. Jamshidi [1] and Nanayakkara et al. [2]consider that SoSs are large-scale integrated systems that areheterogeneous and independently operable on their own but arenetworked together for a common goal. Luzeaux and Ruault[33] define SoSs as an assemblage of systems that can bepotentially acquired and/or used independently, for which thedesigner, the acquirer, and/or the user tries to maximize theperformance of the global value chain, at a given time and fora set of foreseeable assemblages. The International Council onSystems Engineering (INCOSE) [34] considers that the termSoS should be applied to a system-of-interest whose systemelements are themselves systems; typically, these entail large-scale interdisciplinary problems with multiple, heterogeneous,and distributed systems. Maier [35] proposes five traits to dis-tinguish very large and complex but monolithic systems fromSoSs: Operational Independence of the Elements, ManagerialIndependence of the Elements, Evolutionary Development,Emergent Behavior, and Geographic Distribution. Maier’s cri-teria encompass all the characteristics of our research object.In ERTMS Level 2, the three constituents are independent, i.e.,they can operate independently. They are separately acquiredand integrated but maintain a continuing operational existenceindependent of ERTMS Level 2. The development and exis-tence of ERTMS Level 2 is evolutionary, with functions andpurposes being added, removed, and modified with experience.ERTMS Level 2 has emergent properties, for example, the un-availability of the whole SoS. Obviously, the three constituentsare geographically distributed. The hierarchical structure shownin Fig. 1 graphically describes the composition of an SoS. AnSoS consists of multiple systems, each system consisting ofmultiple subsystems and each subsystem consisting of multiplecomponents.
B. ERTMS Level 2
1) Overview of ERTMS/ETCS: ERTMS is a platform sup-ported by Europe to guarantee the interoperability acrossdifferent countries and manufacturers by creating a singleEurope-wide standard for train control and command sys-tems [36]. It has two components, the first component beingETCS, which is a standard for train control systems, andthe second component being the Global System for Mobile
This article has been accepted for inclusion in a future issue of this journal. Content is final as presented, with the exception of pagination.
4 IEEE SYSTEMS JOURNAL
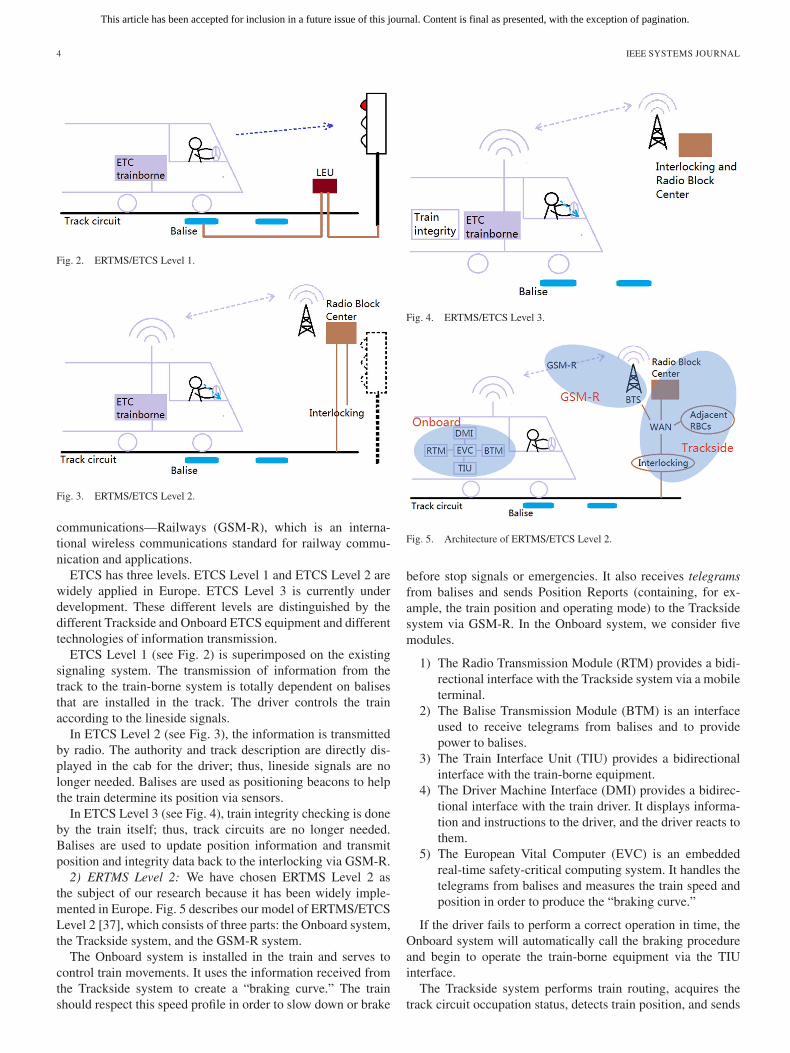
Fig. 2. ERTMS/ETCS Level 1.
Fig. 3. ERTMS/ETCS Level 2.
communications—Railways (GSM-R), which is an interna-tional wireless communications standard for railway commu-nication and applications.
ETCS has three levels. ETCS Level 1 and ETCS Level 2 arewidely applied in Europe. ETCS Level 3 is currently underdevelopment. These different levels are distinguished by thedifferent Trackside and Onboard ETCS equipment and differenttechnologies of information transmission.
ETCS Level 1 (see Fig. 2) is superimposed on the existingsignaling system. The transmission of information from thetrack to the train-borne system is totally dependent on balisesthat are installed in the track. The driver controls the trainaccording to the lineside signals.
In ETCS Level 2 (see Fig. 3), the information is transmittedby radio. The authority and track description are directly dis-played in the cab for the driver; thus, lineside signals are nolonger needed. Balises are used as positioning beacons to helpthe train determine its position via sensors.
In ETCS Level 3 (see Fig. 4), train integrity checking is doneby the train itself; thus, track circuits are no longer needed.Balises are used to update position information and transmitposition and integrity data back to the interlocking via GSM-R.
2) ERTMS Level 2: We have chosen ERTMS Level 2 asthe subject of our research because it has been widely imple-mented in Europe. Fig. 5 describes our model of ERTMS/ETCSLevel 2 [37], which consists of three parts: the Onboard system,the Trackside system, and the GSM-R system.
The Onboard system is installed in the train and serves tocontrol train movements. It uses the information received fromthe Trackside system to create a “braking curve.” The trainshould respect this speed profile in order to slow down or brake
Fig. 4. ERTMS/ETCS Level 3.
Fig. 5. Architecture of ERTMS/ETCS Level 2.
before stop signals or emergencies. It also receives telegramsfrom balises and sends Position Reports (containing, for ex-ample, the train position and operating mode) to the Tracksidesystem via GSM-R. In the Onboard system, we consider fivemodules.
1) The Radio Transmission Module (RTM) provides a bidi-rectional interface with the Trackside system via a mobileterminal.
2) The Balise Transmission Module (BTM) is an interfaceused to receive telegrams from balises and to providepower to balises.
3) The Train Interface Unit (TIU) provides a bidirectionalinterface with the train-borne equipment.
4) The Driver Machine Interface (DMI) provides a bidirec-tional interface with the train driver. It displays informa-tion and instructions to the driver, and the driver reacts tothem.
5) The European Vital Computer (EVC) is an embeddedreal-time safety-critical computing system. It handles thetelegrams from balises and measures the train speed andposition in order to produce the “braking curve.”
If the driver fails to perform a correct operation in time, theOnboard system will automatically call the braking procedureand begin to operate the train-borne equipment via the TIUinterface.
The Trackside system performs train routing, acquires thetrack circuit occupation status, detects train position, and sends

This article has been accepted for inclusion in a future issue of this journal. Content is final as presented, with the exception of pagination.
QIU et al.: MODELING OF ERTMS LEVEL 2 AS AN SoS AND EVALUATION OF ITS DEPENDABILITY 5
Fig. 6. Hierarchical structure of ERTMS Level 2.
correct speed profiles to trains. The Trackside system comprisestwo subsystems.
1) Interlocking is responsible for train routing and acquir-ing the track occupation status.
2) The Separation subsystem comprises Radio Block Cen-ters (RBCs) and Eurobalises. RBCs acquire track statusfrom linked interlocking equipment and provide trainswith Movement Authorities, Static Speed Profiles, andpossible emergency information. A Eurobalise sends po-sition telegrams to a train when the train passes over it.
The direction of communication is decided by the frequencyof GSM-R messages. For the “Train to Track” direction, thefrequency of GSM-R messages is between 876 and 880 MHz,whereas for the “Track to Train” direction, the frequency isbetween 921 and 925 MHz.
Fig. 6 presents the hierarchical structure of the SoS.
C. Statecharts
UML is a well-defined modeling language. UML 2.2 has14 kinds of diagrams, and they are divided into two majorcategories: structure and behavior diagrams. “Structure” definesthe static structural constructs used in various structural dia-grams, including class, component, and deployment diagrams.“Behavior” specifies the dynamic behavioral constructs used invarious behavioral diagrams, including activity, sequence, andstate machine diagrams [17].
UML statecharts are one type of behavior diagram. State-charts use states and state transitions to describe the behaviorof systems. They specify the sequences of states that systemsgo through as a result of the occurrences of events and theircorresponding actions. Here, we present the principal elementsto be found in statecharts [17], [18], [38].
1) A state models a situation that a system might be in. Astate that contains other states is called a composite state.Each state may have Entry, Do, and Exit activities.
2) An Entry activity is optional and performed wheneverthe state is entered.
3) An Exit activity is optional and performed whenever thestate is exited.
4) A Do activity is optional and executed when system is inthe state. It is performed after the completion of the Entryactivity and continues to be performed until the activityhas finished or the state is exited.
Fig. 7. Illustration of a statechart.
5) A region is an orthogonal part of a statechart or a com-posite state. A statechart or a composite state can containone or more regions. If a statechart has several regions,these regions are concurrent.
6) An initial pseudostate is the source of the statechart inone region. It is an intermediate state. Systems cannotremain in the pseudostate for a long time. Each regionhas one and only one initial pseudostate.
7) A final state is the last state of a region. It signifies theend of the region.
8) A transition is the relationship between a source stateand its target state. It represents the response of a state-chart to the occurrence of an event.
9) Triggers specify the events whose occurrences may firethe transitions.
10) A guard is a condition that has to be satisfied when itscorresponding transition is fired.
11) An Effect is optional and performed when the transitionfires.
Fig. 7 is an illustration of a statechart diagram. The systemhas three states. It first enters State1, which has Entry, Do,and Exit actions. The system passes from State1 to State2when trigger1 is actuated and where the guard is satisfied. Thistransition also includes an effect that is an action. The effectis executed when the transition fires. State2 has two regions,and these two regions are executed in parallel. This means thatState2.1 and State2.2 are both active when the system entersState2. When trigger2 is actuated, the system enters State3.When trigger3 is actuated, the system returns to State1.
Statecharts are suitable for modeling the behavior of SoSs.We take Markov chains as an example to demonstrate theadvantages of statecharts. As explained by Drusinsky and Harel[38], two major drawbacks of Markov chains are their inherentsequentiality and their flat nonhierarchical nature. In its clas-sical form, the Markov chain method is not well adapted tospecifying the behavior of SoSs because it does not supportmodularity and a hierarchical structure. Without concurrencyand multilevel descriptions, a state-based method is unsuitablefor describing the behavior of large and complex systems.Furthermore, the number of states exponentially grows (weconsider all possible combinations of states in all the compo-nents of the systems) in Markov chain methods. Statechartsovercome the limitations of Markov chains. They support thehierarchy of states and orthogonal regions. States can be com-bined into a higher level state. The source state and the targetstate of a transition are not restricted to the same level. Theycan come from different levels. These are the advantages thatled us to choose statecharts as our modeling language.

This article has been accepted for inclusion in a future issue of this journal. Content is final as presented, with the exception of pagination.
6 IEEE SYSTEMS JOURNAL
Fig. 8. Statechart model of S1.
Fig. 9. Markov chain representation of S1.
Fig. 10. Statechart model of S2.
Fig. 8 shows the statechart of a system S1 with two inde-pendent subsystems in parallel. We convert the statechart to aMarkov chain, as shown in Fig. 9. Comparing the two figuresclearly shows the advantages of statecharts. In the statechart,there are six states and 12 transitions, whereas in the Markovchain, there are nine states and 36 transitions. The complexityof the Markov chain method increases much faster than thecomplexity of the statecharts method. However, it can be arguedthat two simple Markov chains can be used to simplify theMarkov chain of S1. Moreover, the long-term stationary prob-ability distribution of the entire system’s state would simply bethe joint distribution of the states of two subsystems. However,if the two subsystems are not independent, things will bedifferent.
Fig. 10 shows the statechart of a system S2 with two depen-dent subsystems. Both of the two subsystems have the sametransitions a1 and a5, which represent CCFs. These types offailure are usually present in railway systems and must betaken into account according to the Railway RAMS standardEN 50126/IEC 62278 [39]. Thus, a1 and a5 make the two
Fig. 11. Markov chain representation of S2.
Fig. 12. Event tree of a hazardous event.
subsystems dependent. We convert the statechart to a Markovchain, as shown in Fig. 11. In the statechart, there are sixstates and 12 transitions, whereas in the Markov chain, thereare nine states and 34 transitions. The fact that the two sub-systems are dependent means that the Markov chain of S2cannot be simplified. It is not possible to obtain the long-termstationary probability distribution of the entire system’s state bycomputing the joint probability distribution of the states of twosubsystems.
III. EMERGENT PROPERTY
Emergence is a disputable topic in the SoS domain. Thereis no precise and generally accepted definition of emergence.Jamshidi [1] consider emergence to be something unexpectedin the collective behavior of an entity within its environment,not attributable to any subset of its parts, that is present ina given view and not present in any other view. Johnson [9]regards emergence as unexpected behavior that arises from theinteraction between the components and the environment.
Given the focus of our research, we use our own particu-lar definition of an emergent behavior for ERTMS Level 2.Despite redundancy, taking over from human operators andother automatic procedures, the occurrence of a failure at theSoS level is considered as emergent behavior. Note that thisemergent behavior cannot be directly deduced from malfunc-tions in elements of ERTMS. We therefore propose consideringunavailability of the SoS as an emergent property. Fig. 12 showsthe event tree of a hazardous “Network abnormality” event.Error detection/correction codes and a maintenance repairerare two safety barriers. When the hazardous event occurs and

This article has been accepted for inclusion in a future issue of this journal. Content is final as presented, with the exception of pagination.
QIU et al.: MODELING OF ERTMS LEVEL 2 AS AN SoS AND EVALUATION OF ITS DEPENDABILITY 7
the two barriers simultaneously fail to function, the ERTMSpresents an emergent property. In fact, the ERTMS may havea greater availability than its constituents because it has moresafety barriers, or it may have a lower availability because ofproblems arising out of the interactions of constituents. Theunavailability of the SoS cannot therefore be directly deducedfrom the unavailability of its constituents. The aims of ourresearch in relation to emergence are to quantify the emergenceof the SoS by computing unavailability as an emergent propertyand to study the impact of imprecise transition rates on the totalSoS unavailability imprecision.
IV. MODELING OF ERTMS LEVEL 2
A. Human Factors
According to the statistics of the Federal Railroad Admin-istration Office of Safety Analysis [40], human factors arethe most significant cause of train accidents. In 2011, 36.35%of train accidents in the U.S. were caused by human factors,33.58% by track defects, 11.60% by equipment defects, 1.71%by signal defects, and 16.77% are ascribed to miscellaneouscauses. These figures underline the need for human factors tobe studied, with the aim of preventing or reducing the numberof train accidents.
Human error has been defined as a behavior of the humanoperator that leads to accidents in railroad systems [24]. Thenormal operation of the railroad system depends on the activ-ities of human beings and machines. Advances in science andtechnology have meant that mechanical reliability has been sig-nificantly improved. Human error is an increasingly significantfactor in train accidents. Humans can deal with accidents andunusual situations, but they also make mistakes. We will nowlook at the human factors that influence human performance.According to Kim [24], human factors fall into three categories:mental states of operators, physical states of operators, andknowledge/experiences/abilities of operators.
In our study, the error rate of an operator is assumed to beconstant. The appropriate distribution for the constant transitionrate model is the exponential distribution. The transition ratefrom operator working state to operator failed state is set toλop, where λop is the error rate of the operator. To obtain arealistic value of the error rate, we have analyzed the statisticspublished by the Federal Railroad Administration Office ofSafety Analysis [40] from 2007 to 2011. In the statistics, fivehuman factors are cited as causes of accidents. These fivehuman factors and their corresponding numbers of accidentson 107 railroads in the U.S. are given in Table I. From Table I,the error rate of an operator is calculated as follows:
λop =382 + 11 + 2 + 2 + 2
5 years ∗ 107 = 8.514 ∗ 10−5 h−1. (1)
B. Network Failures
The communication network is also a factor that influencesthe SoS performance. The transition rates of the network areassumed to be constant. If the network fails, a repair may becarried out. The transition rate from the working state to the
TABLE ISTATISTICS ON HUMAN FACTORS IN RAILWAY ACCIDENTS
TABLE IISTATISTICS ON NETWORK FAILURES IN RAILWAY ACCIDENTS
Fig. 13. Statechart of the SoS in Stateflow.
failed state is λn, and the transition rate from the failed stateto the working state is μn, where λn represents the failure rateand μn = 0.6 h−1 represents the repair rate. To obtain a realisticvalue of the failure rate of the network, we have analyzedthe statistics published by the Federal Railroad AdministrationOffice of Safety Analysis [40] from 2007 to 2011. In thestatistics, accidents are caused by three types of network failure.These three types of failure and their corresponding numbersof accidents on 107 railroads in the U.S. are given in Table II.From Table II, the network failure rate is calculated as follows:
λn =31 + 11 + 2
5 years ∗ 107 = 9.3885 ∗ 10−6 h−1. (2)
C. Modeling in Stateflow
Stateflow is a toolbox of Simulink. It provides a designenvironment to model embedded systems via statecharts andflow graphs within a Simulink model.
Fig. 13 represents the statechart of the entire SoS. Figs. 14–16 show the statecharts of the three constituents of ERTMSLevel 2. These statecharts describe the communication betweenthe Onboard system and the Trackside system via GSM-R in thepresence of degradations and failures. As shown in Fig. 13, theSoS consists of the Onboard system, the Trackside system, andthe GSM-R system, which work in parallel.
First of all, the three systems enter the “Waiting” state. Ifthe variable “Start” is true, all the systems enter the “Normal”state. In the “Normal” state, the Onboard system and the

This article has been accepted for inclusion in a future issue of this journal. Content is final as presented, with the exception of pagination.
8 IEEE SYSTEMS JOURNAL
Fig. 14. Statechart of the Onboard system in Stateflow.
Fig. 15. Statechart of the Trackside system in Stateflow.
Trackside system communicate with each other via GSM-R.The Onboard system is in the “Calculation” state, the Track-side system is in the “CollectionInfoCalculation” state, andthe GSM-R system is in the “CollectMessage” state. Whena SignalFromTrack event occurs and, at the same time, thefrequency of GSM-R messages is not less than 900 MHz, theTrackside system sends information to the Onboard system.At this time, the Onboard system enters the “Receive” state,the Trackside system enters the “Send” state, and the GSM-R
system enters the “Track2Train” state. When an EndSend-ToTrain event occurs, the Onboard system goes back to the“Calculation” state, the Trackside system goes back to the“CollectionInfoCalculation” state, and the GSM-R systemgoes back to the “CollectMessage” state. Information trans-mission from the Onboard system to the Trackside systemfunctions in a similar fashion.
The Onboard system has a degraded state. When an Op-eration event occurs, if the operator is available, the system
This article has been accepted for inclusion in a future issue of this journal. Content is final as presented, with the exception of pagination.
QIU et al.: MODELING OF ERTMS LEVEL 2 AS AN SoS AND EVALUATION OF ITS DEPENDABILITY 9
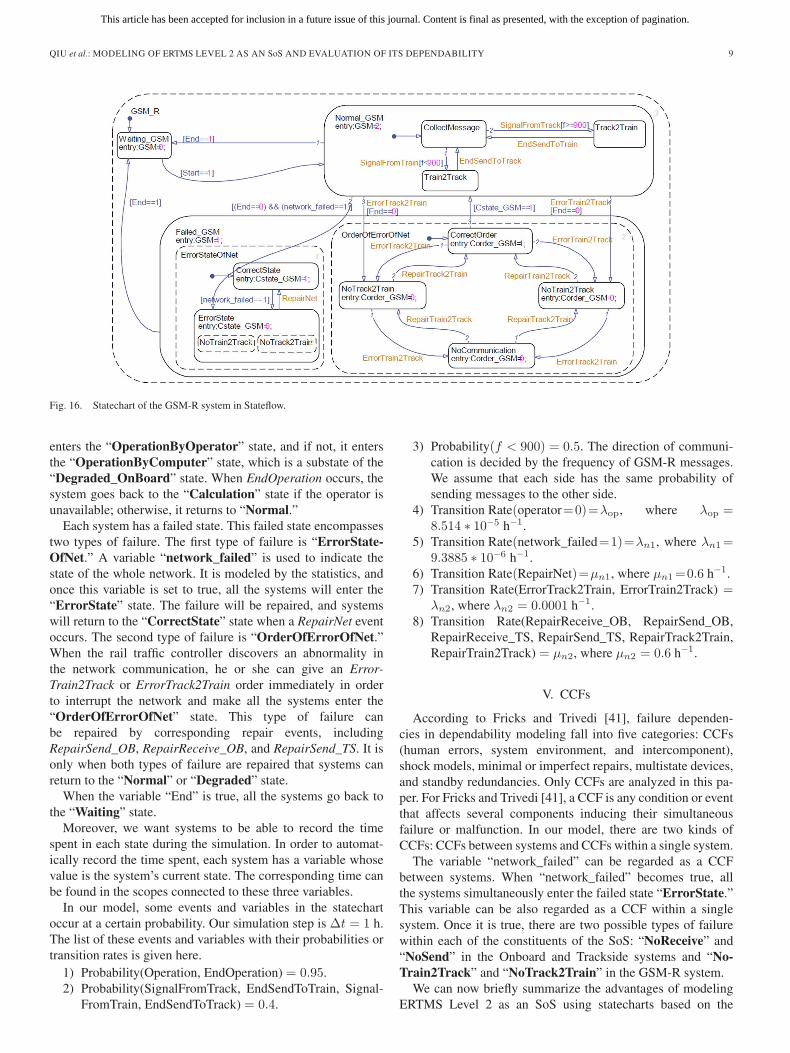
Fig. 16. Statechart of the GSM-R system in Stateflow.
enters the “OperationByOperator” state, and if not, it entersthe “OperationByComputer” state, which is a substate of the“Degraded_OnBoard” state. When EndOperation occurs, thesystem goes back to the “Calculation” state if the operator isunavailable; otherwise, it returns to “Normal.”
Each system has a failed state. This failed state encompassestwo types of failure. The first type of failure is “ErrorState-OfNet.” A variable “network_failed” is used to indicate thestate of the whole network. It is modeled by the statistics, andonce this variable is set to true, all the systems will enter the“ErrorState” state. The failure will be repaired, and systemswill return to the “CorrectState” state when a RepairNet eventoccurs. The second type of failure is “OrderOfErrorOfNet.”When the rail traffic controller discovers an abnormality inthe network communication, he or she can give an Error-Train2Track or ErrorTrack2Train order immediately in orderto interrupt the network and make all the systems enter the“OrderOfErrorOfNet” state. This type of failure canbe repaired by corresponding repair events, includingRepairSend_OB, RepairReceive_OB, and RepairSend_TS. It isonly when both types of failure are repaired that systems canreturn to the “Normal” or “Degraded” state.
When the variable “End” is true, all the systems go back tothe “Waiting” state.
Moreover, we want systems to be able to record the timespent in each state during the simulation. In order to automat-ically record the time spent, each system has a variable whosevalue is the system’s current state. The corresponding time canbe found in the scopes connected to these three variables.
In our model, some events and variables in the statechartoccur at a certain probability. Our simulation step is Δt = 1 h.The list of these events and variables with their probabilities ortransition rates is given here.
1) Probability(Operation, EndOperation) = 0.95.2) Probability(SignalFromTrack, EndSendToTrain, Signal-
FromTrain, EndSendToTrack) = 0.4.
3) Probability(f < 900) = 0.5. The direction of communi-cation is decided by the frequency of GSM-R messages.We assume that each side has the same probability ofsending messages to the other side.
4) Transition Rate(operator=0)=λop, where λop =8.514 ∗ 10−5 h−1.
5) Transition Rate(network_failed=1)=λn1, where λn1=9.3885 ∗ 10−6 h−1.
6) Transition Rate(RepairNet)=μn1, where μn1=0.6 h−1.7) Transition Rate(ErrorTrack2Train, ErrorTrain2Track) =
λn2, where λn2 = 0.0001 h−1.8) Transition Rate(RepairReceive_OB, RepairSend_OB,
RepairReceive_TS, RepairSend_TS, RepairTrack2Train,RepairTrain2Track) = μn2, where μn2 = 0.6 h−1.
V. CCFs
According to Fricks and Trivedi [41], failure dependen-cies in dependability modeling fall into five categories: CCFs(human errors, system environment, and intercomponent),shock models, minimal or imperfect repairs, multistate devices,and standby redundancies. Only CCFs are analyzed in this pa-per. For Fricks and Trivedi [41], a CCF is any condition or eventthat affects several components inducing their simultaneousfailure or malfunction. In our model, there are two kinds ofCCFs: CCFs between systems and CCFs within a single system.
The variable “network_failed” can be regarded as a CCFbetween systems. When “network_failed” becomes true, allthe systems simultaneously enter the failed state “ErrorState.”This variable can be also regarded as a CCF within a singlesystem. Once it is true, there are two possible types of failurewithin each of the constituents of the SoS: “NoReceive” and“NoSend” in the Onboard and Trackside systems and “No-Train2Track” and “NoTrack2Train” in the GSM-R system.
We can now briefly summarize the advantages of modelingERTMS Level 2 as an SoS using statecharts based on the

This article has been accepted for inclusion in a future issue of this journal. Content is final as presented, with the exception of pagination.
10 IEEE SYSTEMS JOURNAL
aforementioned analysis. First, the EEIG-ERTMS Users Group(the initials EEIG denote a European Economic Interest Group)[7] has put forward an ERTMS/ETCS RAMS RequirementsSpecification. This specification states that “when redundanciesare utilized in order to prevent single failures to cause im-mobilizing failures, appropriate measures which guarantee theindependence of the redundant equipment shall be adopted anddocumented. For redundant safety-related functions, a Com-mon Cause Failures Analysis shall be performed.” Becauseof the CCFs, the constituents of ERTMS Level 2 are notindependent. As the statechart model in Section IV shows,transitions that are connected to states from different levelsmake the model even more complex. Hierarchical structuremethods (e.g., the statecharts method) are more adapted thanflat structure methods (e.g., the Markov chain method) fortaking account of failure dependencies in the modeling ofERTMS Level 2. Second, the EEIG-ERTMS Users Group [7]has defined RAMS goals at the SoS level. Since the SoS RAMSrequirements cannot be expressed as a sum or a product ofRAMS requirements of the systems, we should like to usestatecharts to model the entire SoS and evaluate them at the SoSlevel. Third, the EEIG-ERTMS Users Group [7] has summa-rized the ERTMS/ETCS Maintenance System and MaintenanceConditions, which makes it easy to introduce maintainabilityoperations in our statecharts models by representing repair ratesand time period inspections in the model.
VI. SIMULATION AND EVALUATION
A. Simulation in Simulink
Stateflow provides a design environment for modeling em-bedded systems via statecharts and flow graphs within aSimulink model. To execute these statecharts, the correspond-ing Simulink model shown in Fig. 17 is developed. In theSimulink model, several signal generators are employed toproduce events and variables for the statecharts. Three scopesare assigned to three variables, which record the states of threesystems.
As we described in Section IV-C, there are two kindsof failures: “ErrorStateOfNet” and “OrderOfErrorOfNet.”For the former, Transition Rate(Failure) = λn1 and TransitionRate(Repair)=μn1, and for the latter,Transition Rate(Failure)=λn2 and Transition Rate(Repair) = μn2, where λn1 = 9.3885 ∗10−6 h−1, λn2 = 0.0001 h−1, and μn1 = μn2 = 0.6 h−1.
In the Simulink model, the Uniform Random Number blockcan output a uniformly distributed random signal. This block isused to produce events with a constant transition rate. We takeTransitionRate(Repair) = 0.6 h−1 as an example. First, theblock is set to output a series of uniformly distributed randomvalues between 0.6 and 1.6. A comparator Compare to Constantis then used as a threshold to differentiate values greater than 1from values less than 1. Thus, the probability that the blockoutputs a value greater than 1 is 0.6. When the value is greaterthan 1, a corresponding event Repair is created. In this case, thetransition rate for Repair is 0.6 h−1.
The two different kinds of failures mean that our model isnot linear. One hundred simulations (sample time: 1 h; length Fig. 17. Schema of the Simulink model.

This article has been accepted for inclusion in a future issue of this journal. Content is final as presented, with the exception of pagination.
QIU et al.: MODELING OF ERTMS LEVEL 2 AS AN SoS AND EVALUATION OF ITS DEPENDABILITY 11
Fig. 18. Extract of the result of one simulation.
of simulation: 2 years) were performed on a DELL PrecisionM4600 (processor: Intel Core i7-2820QM CPU at 2.30 GHz;RAM: 8 GB; system type: 64-bit operating system), the wholesimulation taking 157.49 s.
Fig. 18 corresponds to the result of one simulation. It showsthe states of the three systems and ERTMS Level 2 between8480 and 8530 h. The states of ERTMS Level 2 are deducedfrom the states of its three constituents. ERTMS Level 2 hasthree states: a working state, a degraded state, and a failedstate. The emergent property of the SoS is quantified by theunavailability of the SoS; thus, the gray zone represents theemergent property of ERTMS Level 2.
B. Evaluation of Dependability Parameters
RAMS parameters are generally used to evaluate systemperformance. Here, five RAMS parameters are evaluated: MeanUp Time (MUT), Mean Down Time (MDT), Mean Time ToFailure (MTTF), Mean Time Between Failures (MTBF), andinstant unavailability.
These five parameters of ERTMS Level 2 can be obtained byanalyzing the results of simulations. Their mean values from100 simulations over two years are shown in Table III. Thesolid line in Fig. 19 shows the evaluation of the unavailability(emergent property) of ERTMS Level 2 over three years.
There are several ways to limit unavailability. Importancemeasures (Birnbaum importance [42], criticality importance[42], etc.) can be used to identify the critical components(activities) in complex systems. The criticality depends not only
TABLE IIIEVALUATION OF DEPENDABILITY PARAMETERS
Fig. 19. Maximum, minimum, and precise values of the unavailability (emer-gent property) of the SoS.
on the reliability parameters of components (failure rate, repairrate, etc.) but also on their position in the system configuration.In our work, importance measures can reflect to what degreethe failure of a component influences the availability of ERTMSLevel 2. For example, in the model of ERTMS Level 2, there aretwo kinds of network failure. We consider the time passed ineach failure as an importance measure. Failures that last longerare more critical. We should also try to reduce the failure rateand increase the repair rate for critical failures first. 1) Introduc-ing redundancy into critical components or monitoring them bypriority can effectively limit unavailability. 2) The use of high-reliability components may also decrease the unavailability.However, the cost of high-reliability components is a realproblem. We have to find a reasonable ratio of reliability/cost.3) Two types of maintenance can be also implemented: pre-ventive maintenance such as the regular inspection of tracks oronboard equipment, and corrective maintenance, for example,when a repair is carried out on a balise that is found to havefailed [43]. However, the cost of maintenance should be alsotaken into account.
VII. TAKING IMPRECISE FAILURE AND REPAIR RATES
INTO ACCOUNT
In the real world, experts sometimes give interval valuesof λ and μ instead of precise values. Here, the influence ofimprecise transition rates on the emergent property of the SoS isanalyzed. Imprecise transition rates mean that λ and μ are fixedbut unknown and belong to [λ, λ] and [μ, μ]. In our numericalexample, the intervals of λ and μ for “ErrorStateOfNet” areset as follows:
λ ∈ [6.3885 ∗ 10−6 h−1, 12.3885 ∗ 10−6 h−1]
μ ∈ [0.4 h−1, 0.8 h−1].
After having calculated the unavailability of ERTMSLevel 2, we find that the unavailability (emergent property)of the SoS reaches its maximum with the largest failure rate

This article has been accepted for inclusion in a future issue of this journal. Content is final as presented, with the exception of pagination.
12 IEEE SYSTEMS JOURNAL
and the smallest repair rate, and its minimum with the smallestfailure rate and the largest repair rate. Fig. 19 plots the maxi-mum, the minimum, and the precise value of the unavailability(emergent property) of ERTMS Level 2 over three years.
VIII. CONCLUSION
In this paper, we have proposed a modeling method and aperformance evaluation for an SoS representing an ERTMSLevel 2 signaling system. Our approach takes into accounthuman factors, network failures, and CCFs. We take unavail-ability as the emergent property of our SoS. This property isquantified using Monte Carlo simulation. Human factors andnetwork failures are quantitatively integrated.
We expect this original research to provide inspiration forfurther research studies into the quantitative analysis of theemergent properties of railway systems. ERTMS Level 2 issuitable to be considered as an SoS because the SoS approachprovides a global view of this signaling system. Furthermore,the emergent properties of the signaling system can be easilyanalyzed at the SoS level. Because of their use of notions ofhierarchy, concurrency, and synchronization, statecharts haveproved to be suitable for modeling the behavior of ERTMS.
In our future work, we intend to enrich our model by intro-ducing epistemic uncertainty, which arises from incomplete-ness or imprecision of experts’ opinions about reliability dataregarding components. Two kinds of epistemic uncertainty areto be introduced: state and parametric.
REFERENCES
[1] M. Jamshidi, Systems of Systems Engineering: Principles andApplications. New York, NY, USA: Taylor & Francis, 2008.
[2] T. Nanayakkara, M. Jamshidi, and F. Sahin, Intelligent Control Systemswith an Introduction to System of Systems Engineering. Hoboken, NJ,USA: CRC Press, 2009.
[3] M. Z. Miller, K. Griendling, and D. N. Mavris, “Exploring human factorseffects in the smart grid system of systems demand response,” in Proc.7th Int. Conf. Syst. Syst. Eng., Genoa, Italy, 2012, pp. 1–6.
[4] C. Caballini, S. Sacone, and S. Siri, “The port as a system of systems: Asystem dynamics simulation approach,” in Proc. 7th Int. Conf. Syst. Syst.Eng., Genoa, Italy, 2012, pp. 191–196.
[5] T. V. Huynh and J. S. Osmundson, “A systems engineering methodologyfor analyzing systems of systems using the Systems Modeling Language(SysML),” in Proc. 2nd Syst. Syst. Eng. Conf., 2006, p. 7.
[6] I. Eusgeld, C. Nan, and S. Dietz, “‘System-of-systems’ approach forinterdependent critical infrastructures,” Rel. Eng. Syst. Safety, vol. 96,no. 6, pp. 679–686, 2011.
[7] EEIG ERTMS Users Group, ERTMS/ETCS RAMS RequirementsSpecification, 1998.
[8] G. H. Lewes, Problems of Life and Mind. Boston, MA, USA: Boston:Houghton, Osgood and Company, 1875.
[9] C. W. Johnson, “What are emergent properties and how do they affect theengineering of complex systems?” Rel. Eng. Syst. Safety, vol. 91, no. 12,pp. 1475–1481, 2006.
[10] J. Black and P. Koopman, System Safety as an Emergent Property inComposite Systems System Safety as an Emergent Property in CompositeSystems, 2009.
[11] H. Hermanns, D. N. Jansen, and Y. S. Usenko, “From StoCharts toMoDeST: A comparative reliability analysis of train radio communica-tions,” in Proc. 5th Int. WOSP, New York, NY, USA, 2005, pp. 13–23.
[12] D. Vernez and F. Vuille, “Method to assess and optimise dependabilityof complex macro-systems: Application to a railway signalling system,”Safety Sci., vol. 47, no. 3, pp. 382–394, Mar. 2009.
[13] J. Lalouette, R. Caron, F. Scherb, N. Brinzei, J. Aubry, and O. Malassé,“Performance assessment of European railway signalling system su-perposed of the French system in the presence of failures,” in Proc.Lamda-Mu, La Rochelle, France, 2010, vol. 2, pp. 2–9.
[14] J. Beugin and J. Marais, “Simulation-based evaluation of dependabil-ity and safety properties of satellite technologies for railway local-ization,” Transp. Res. Part C, Emerging Technol., vol. 22, pp. 42–57,Jun. 2012.
[15] A. Herranz, G. Marpons, C. Benac, and J. Marino, “Mechanising thevalidation of ERTMS requirements and new procedures,” in Proc. 9thWorld Congr. Railway Res., Lille, France, 2011, p. 33.
[16] EuRailCheck. [Online]. Available: https://es.fbk.eu/projects/eurailcheck/index.php
[17] Object Management Group, OMG Unified Modeling Language (OMGUML), Superstructure, 2011.
[18] D. Harel, “Statecharts: A visual formalism for complex systems,” Sci.Comput. Programming, vol. 8, no. 3, pp. 231–274, Jun. 1987.
[19] M. Banci, A. Fantechi, and S. Gnesi, “The role of formal methods indeveloping a distributed railway interlocking system,” in Proc. 5th Symp.FORMS/FORMAT , 2004, pp. 220–230.
[20] Z. Pap, I. Majzik, A. Pataricza, and A. Szegi, “Methods of checkinggeneral safety criteria in UML statechart specifications,” Rel. Eng. Syst.Safety, vol. 87, no. 1, pp. 89–107, Jan. 2005.
[21] J. Magott and P. Skrobanek, “Timing analysis of safety properties usingfault trees with time dependencies and timed state-charts,” Rel. Eng. Syst.Safety, vol. 97, no. 1, pp. 14–26, Jan. 2012.
[22] A. Hudoklin and V. Rozman, “Reliability of railway traffic personnel,”Rel. Eng. Syst. Safety, vol. 52, no. 2, pp. 165–169, May 1996.
[23] C. D. Griffith and S. Mahadevan, “Inclusion of fatigue effects in humanreliability analysis,” Rel. Eng. Syst. Safety, vol. 96, no. 11, pp. 1437–1447,Nov. 2011.
[24] D. S. Kim, D. H. Baek, and W. C. Yoon, “Development and evaluation of acomputer-aided system for analyzing human error in railway operations,”Rel. Eng. Syst. Safety, vol. 95, no. 2, pp. 87–98, Feb. 2010.
[25] F. Vanderhaegen, “APRECIH: A human unreliability analysis method—Application to railway system,” Control Eng. Practice, vol. 7, no. 11,pp. 1395–1403, Nov. 1999.
[26] F. Vanderhaegen, “A non-probabilistic prospective and retrospective hu-man reliability analysis method—Application to railway system,” Rel.Eng. Syst. Safety, vol. 71, no. 1, pp. 1–13, Jan. 2001.
[27] M. T. Baysari, A. S. McIntosh, and J. R. Wilson, “Understandingthe human factors contribution to railway accidents and incidentsin Australia,” Accident Anal. Prev., vol. 40, no. 5, pp. 1750–1757,Sep. 2008.
[28] M. T. Baysari, C. Caponecchia, A. S. McIntosh, and J. R. Wilson, “Clas-sification of errors contributing to rail incidents and accidents: A compar-ison of two human error identification techniques,” Safety Sci., vol. 47,no. 7, pp. 948–957, Aug. 2009.
[29] W. I. Hamilton and T. Clarke, “Driver performance modelling and itspractical application to railway safety,” Appl. Ergonom., vol. 36, no. 6,pp. 661–670, Nov. 2005.
[30] J. E. Ramirez-Marquez and D. W. Coit, “A Monte-Carlo simulation ap-proach for approximating multi-state two-terminal reliability,” Rel. Eng.Syst. Safety, vol. 87, no. 2, pp. 253–264, Feb. 2005.
[31] J. E. Ramirez-Marquez and W. Jiang, “Confidence bounds for the reliabil-ity of binary capacitated two-terminal networks,” Rel. Eng. Syst. Safety,vol. 91, no. 8, pp. 905–914, Aug. 2006.
[32] J. L. Cook and J. E. Ramirez-Marquez, “Two-terminal reliability analysesfor a mobile ad hoc wireless network,” Rel. Eng. Syst. Safety, vol. 92,no. 6, pp. 821–829, Jun. 2007.
[33] D. Luzeaux and J. Ruault, Systems of Systems. Hoboken, NJ, USA:Wiley-ISTE, 2010.
[34] INCOSE, Systems Engineering Handbook, A Guide for System LifeCycle Processes and Activities, 2006.
[35] M. W. Maier, “Architecting principles for systems-of-systems,” Syst. Eng.,vol. 1, no. 4, pp. 267–284, 1998.
[36] UNISIG, Safety Requirements for the Technical Interoperability of ETCSin Levels 1 and 2, 2009.
[37] F. Flammini, Model-Based Dependability Evaluation of Complex CriticalControl Systems. Saarbrücken, Germany: VDM Verlag, 2009.
[38] D. Drusinsky and D. Harel, “Using statecharts for hardware descriptionand synthesis,” IEEE Trans. Comput. -Aided Design Integr. Circuits Syst.,vol. 8, no. 7, pp. 798–807, Jul. 1989.
[39] Railway RAMS, Standard EN 50126/IEC 62278, 2008. [Online]. Avail-able: http://en50126.blogspot.fr/2008/07/velkommen.html
[40] Federal Railroad Administration Office of Safety Analysis, Federal Rail-road Administration Office of Safety Analysis 2013. [Online]. Available:http://safetydata.fra.dot.gov/officeofsafety/default.aspx
[41] R. M. Fricks and K. S. Trivedi, “Modeling failure dependencies in re-liability analysis using stochastic Petri-nets,” in Proc. ESM, Istanbul,Turkey, 1997.

This article has been accepted for inclusion in a future issue of this journal. Content is final as presented, with the exception of pagination.
QIU et al.: MODELING OF ERTMS LEVEL 2 AS AN SoS AND EVALUATION OF ITS DEPENDABILITY 13
[42] J. Andrews, “Birnbaum and criticality measures of component contribu-tion to the failure of phased missions,” Rel. Eng. Syst. Safety, vol. 93,no. 12, pp. 1861–1866, Dec. 2008.
[43] J. Kenne and L. Nkeungoue, “Simultaneous control of production, pre-ventive and corrective maintenance rates of a failure-prone manufacturingsystem,” Appl. Num. Math., vol. 58, no. 2, pp. 180–194, Feb. 2008.
Siqi Qiu received the M.S. and Engineering degreesfrom the University of Paris-Sud, Orsay, France,in 2011.
She is currently working toward the Ph.D. de-gree at Compiegne University of Technology, Com-piegne, France. Her research interests concern themodeling of System-of-Systems and the reliabilityanalysis under uncertainty.
Mohamed Sallak received the Ph.D. degree from theNational Polytechnic Institute of Lorraine, Nancy,France, in 2007.
His current research interests concern reliabilityassessment of complex systems under uncertaintiesusing several uncertainty theories (belief functiontheory, imprecise probability theory, and fuzzy settheory), reliability allocation methods, and compo-nents importance measures.
Walter Schön received the M.S degree from theEcole Normale Supérieure, Paris, France, in 1985and the Ph.D. degree in solid-state physics from theUniversité Pierre et Marie Curie, Paris, in 1989.
He is currently a Professor with the Departmentof Information Processing Engineering, CompiegneUniversity of Technology, Compiegne, France. Hiscurrent research interests concern reliability engi-neering and safety critical computer systems.
Zohra Cherfi-Boulanger received the Ph.D. degreein mathematics from the Université Pierre et MarieCurie, Paris, France, in 1988.
She is currently a Professor with the Departmentof Mechanics, Compiegne University of Technology,Compiegne, France. Her current research interestsconcern reliability engineer and industrial quality,training, and education.


![ERTMS USERS GROUP - ENGINEERING GUIDELINE...[SS026] SUBSET-026 ERTMS/ETCS Class 1 System Requirements Specification 2.3.0 EEIG ERTMS Users Group Guideline Level Transition from LSTM](https://img.pdfslide.net/doc/110x75/6124ffaa7a5def3ac65982dd/ertms-users-group-engineering-guideline-ss026-subset-026-ertmsetcs-class.jpg)