Embed Size (px)
Citation preview

IEEE TRANSACTIONS ON POWER SYSTEMS, VOL. 28, NO. 2, MAY 2013 1113
Synergistic Control of Plug-In VehicleCharging and Wind Power Scheduling
Chiao-Ting Li, Member, IEEE, Changsun Ahn, Huei Peng, and Jing Sun, Fellow, IEEE
Abstract—Significant synergy exists between plug-in electric ve-hicles (PEVs) and wind energy: PEVs can be the demand responseto mitigate the intermittent wind power outputs, and wind energycan provide low-carbon electricity to PEVs. This paper presentsa hierarchical control algorithm to realize this synergy by inte-grating the PEV charging and wind power scheduling. The controlalgorithm consists of three levels: the top-level controller optimizesthe scheduling for the conventional power plants and wind power;the middle-level controller plans PEV charging to achieve load fol-lowing based on the battery state of charge and plug-off time ofeach vehicle; the bottom-level controller uses grid electricity fre-quency as the feedback cue to control PEV charging and serves asthe ancillary service to the grid. Numerical simulations show thatthe integrated controller can improve the grid frequency regula-tion and overall electricity generation cost without sacrificing thePEVs charging completion.
Index Terms—Charging of electric vehicles, electricity grid, gridintegration, plug-in electric vehicles, smart grid, wind energy.
I. INTRODUCTION
P LUG-IN electric vehicles (PEVs) and wind energy areboth green technologies capable of reducing the use of
fossil fuels, and, due to the aggressive goals to reduce green-house gas emissions and carbon footprints around the world,they are expected to grow quickly in the next decades. How-ever, accommodating large number of PEVs and wind energysources poses challenges to the electricity grid because of theincreased load from PEV charging and intermittency from windpower. Fortunately, there is significant synergy between PEVsand wind power [1], [2], but few studies to take advantage ofthis synergy were reported. This paper intends to bridge the gapby proposing a control algorithm to integrate PEV charging andwind power scheduling.Charging a large number of PEVs without mitigation will
negatively impact the electricity grid [3], [4]. However, the de-ployment of advanced metering and charging systems makes itpossible to control the timing and rate of PEV charging. In addi-tion, PEVs often have the dwell time (stay parked) longer than
Manuscript received January 05, 2012; revised January 30, 2012, April 02,2012, June 07, 2012, and July 20, 2012; accepted July 29, 2012. Date of pub-lication September 11, 2012; date of current version April 18, 2013. This workwas supported by the National Science Foundation under Grant No. 0835995.Paper no. TPWRS-00014-2012.C.-T. Li, C. Ahn, and H. Peng are with the Department of Mechanical
Engineering, University of Michigan, Ann Arbor, MI 48109 USA (e-mail:[email protected]; [email protected]; [email protected]).J. Sun is with the Department of Naval Architecture and Marine Engineering,
University of Michigan, Ann Arbor, MI 48109 USA (e-mail: [email protected]).Color versions of one or more of the figures in this paper are available online
at http://ieeexplore.ieee.org.Digital Object Identifier 10.1109/TPWRS.2012.2211900
the time needed to fully charge their batteries, which providescontrol algorithms some degree of freedom to delay or manip-ulate the charging.Controlling PEV charging is more challenging than man-
aging existing grid load in that both the charging timing(service timing) and charging rate (service quantity) are controlvariables, which current demand-side management or serviceprovisioning schemes rarely address simultaneously. For ex-ample, resource allocation methods [5]–[7] only address theservice quantity, whereas scheduling [8] and queuing theory[9]–[11] only address the timing. In addition, these methodsare highly centralized, which limits themselves to be used onlarge PEV fleets. Hierarchical and partially-decentralized algo-rithms are believed to be more appropriate for PEV charging[12]. For schemes specific to PEV charging, the dual tariff(cheaper electricity rate in the valley hours) is currently of-fered by several electricity distribution companies [13], [14].Rule-based charging schemes are used to analyze PEVs’ im-pact on the grid generation mix and carbon emissions [3], [15].Cost optimization has been able to achieve valley filling [16].Co-optimization for costs of electricity and heating service[17] and using idle PEVs as grid reserves [18] have also beenproposed. However, rule-based approaches do not exploit thefull potential of the controllable PEV charging whereas costoptimizations are usually solved off-line without providingimplementable real-time control laws, with [19] being a notableexception.Wind power is cleaner than most traditional power sources,
but its intermittency has been a concern to grid reliability. Al-though aggregating outputs of multiple turbines or wind farmshelp to smooth the fluctuations [20], the grid operator may stillneed to procure more reserves for the wind intermittency [21],which can cost $0.45–$8.84/MWh [22].Researchers are tackling the wind intermittency in various
ways. Some research efforts have focused on reducing predic-tion error of wind power to assist grid operations [23]. An-other research direction focuses on developing strategies forscheduling generation sources. Several studies included windenergy probabilities when conducting optimizations for gener-ation scheduling [24]–[27]. Bidding strategy to maximize theprofit for the wind energy producer (not the whole grid) wasalso proposed [28]. Fuzzy logic has been used as a schedulingscheme as well [29]. Despite of the improvement achieved bythe above methods, curtailment of wind power will still happenbecause the current electricity grid has very little energy storagecapacity.The literature has addressed the PEV charging or wind inter-
mittency on the electricity grid. Their integration is attracting
0885-8950/$31.00 © 2012 IEEE

1114 IEEE TRANSACTIONS ON POWER SYSTEMS, VOL. 28, NO. 2, MAY 2013
Fig. 1. Distributions of the plug-in time, plug-off time, and trip length [31].The distribution of trip length is used to derive .
increasing attention because of the significant synergy betweenthem. The PEV charging power can be throttled back and forthto cancel the intermittency in wind energy, and wind energy canprovide clean electricity to PEVs. This paper proposes a three-level hierarchical control algorithm to achieve such integration.The top-level controller optimizes the scheduling for the conven-tional power plants and wind power to minimize the electricitygeneration cost; the middle-level controller plans PEV chargingto achieve load following based on the battery state of charge andplug-off time of each vehicle; the bottom-level controller usesgrid electricity frequency as the feedback cue to control PEVcharging and serves as the ancillary service to the grid. This con-trol algorithm is an extension of the algorithms in [19] and [30],which can fully exploit the synergy between PEV and wind en-ergy to achieve multiple objectives on the electricity grid.The remainder of this paper is organized as follows: Section II
describes models of the PEV fleet, wind power, and the elec-tricity grid; Section III presents the three-level hierarchical con-trol algorithm; Section IV shows simulation results of the con-troller on a state-wide electricity grid; and Section V providesconcluding remarks.
II. MODELING
Several models are developed to describe system-level dy-namics of the PEV fleet, wind power, and electricity grid usingstatistics in the State of Michigan. In addition, PEVs and windenergy are assumed to have acquired sizable market shares, sothey have significant influence on the demand, supply, and reli-ability of the electricity grid.
A. Plug-In Electric Vehicle Fleet
The total number of PEVs is assumed to be two million,which corresponds to 25% of the vehicle fleet in Michigan. AllPEVs are assumed to use smart chargers and thus controllable.The PEV fleet is characterized by the plug-in time, the plug-offtime, and the state of charge (SOC) of the battery at plug-in.The SOC quantifies the energy requirement to fully charge allPEVs so that the grid operator can schedule appropriate powergeneration to accommodate the PEV charging need, and theplug-in/plug-off time prioritizes the PEV fleet and determineswhich vehicle receives immediate or delayed charging service.The data in [31], shown in Fig. 1, is used to derive the threepieces of information.Assuming that charging only happens at home, the arrival
time is treated as the plug-in time, and the departure time asthe plug-off time. The trip length is used to derive the SOC
Fig. 2. A 48-h snapshot of the NREL eastern wind dataset. The raw data con-sists of two data strings: wind forecast, , and actual wind generation, .
Fig. 3. Conditional probability distributions, . The peak value ofeach distribution is close to the forecast value, , implying that the forecastis generally good.
at plug-in by (1), which then is used to find the total energyrequirement to charge the PEV fleet using (2):
ifotherwise
(1)
(2)
where is the trip length and AER is the all-electric range of thePEV. The initial SOC will lie in the window of 30–80%, whichis the range the battery operates [32]. is the battery capacityand is assumed to be 16 kWh, which is typical for 40-mile-AERPEVs [32]. The maximum charging power is 1440W, limited bythe Level-I electric vehicle charger [33], and only night chargingat home is allowed. The response of the charging level is as-sumed to be instantaneously fast, and dynamics and losses inbatteries are ignored.
B. Wind Power
An 800-MW wind farm is assumed to be connected to theelectricity grid, which can support about 10% of the peak loadin Michigan when running at the rated power. The EasternWind Dataset from the National Renewable Energy Laboratory(NREL) [34] is used to extract the conditional probabilitydistribution, denoted as , to represent the (stochastic)actual wind generation under a given forecast . Fig. 2shows a snapshot of the NREL dataset, and Fig. 3 shows theextracted conditional probability distribution. willbe used to derive the reserve requirement and to estimate theexpected shortfall of wind power.The grid operator procures reserve to handle the wind inter-
mittency and other uncertainties. Assuming that over-produc-tion in wind power can always be curtailed, only the up-regu-
LI et al.: SYNERGISTIC CONTROL OF PLUG-IN VEHICLE CHARGING AND WIND POWER SCHEDULING 1115
Fig. 4. Nominal and modeled load profiles.
lation reserve is needed for under-production. The curtailmentallows wind power producers to reduce risks in the electricitymarket, in that they do not need to pay for over-production.Furthermore, the wind power producers can schedule their gen-eration conservatively (lower than forecasts) when the energyprice in the market is low or when the reserve price is high.The wind scheduling can be aggressive when they are not fullyresponsible for their intermittency (which is the case in manymarkets today). A further assumption is that the reserve has tocover 95% of the under-production, and then the reserve re-quirement, , can be computed using (3). The expectedshortfall, , shown in (4), must be made up by dispatchingthe reserve or throttling back the PEV charging:
(3)
(4)
where the two aforementioned quantities are both functions ofthe wind scheduling decision, , which is a control variable inthe scheduling optimization in Section III-A. is the cumula-tive probability distribution function of , and isthe inverse of , which tells the least wind power output of agiven probability. The plus sign indicates the truncation ofnegative values, and the expectation (the operation imposed by) in (4) is taken with respect to .
C. Electricity Grid
The grid model consists of several elements: the load, gener-ation costs, and frequency dynamics.1) Grid Load: The hourly load data in the Detroit Edison
serviced area is used as the nominal load, which ranges be-tween 5500–8000 MW. Sub-hour fluctuations are generated bya random process to match the typical range of fluctuations onstate-wide power systems [35]. The nominal load and modeledload with fluctuations are shown in Fig. 4.On top of the existing grid load, 7.38 GWh of energy is re-
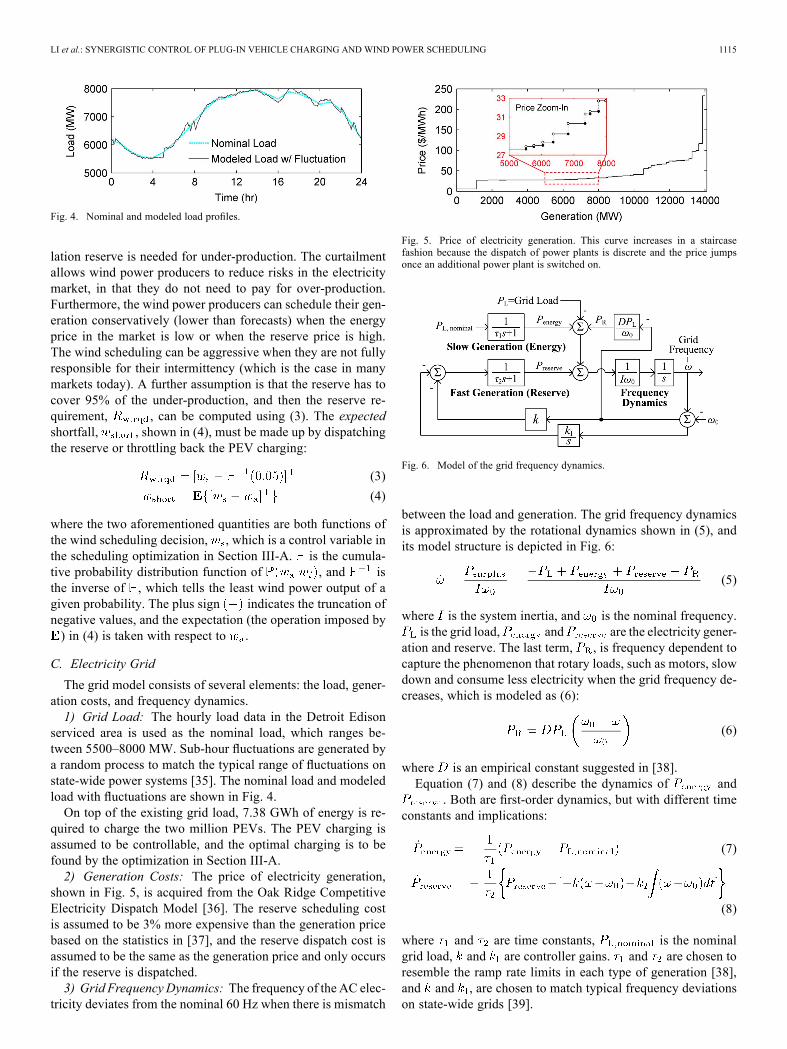
quired to charge the two million PEVs. The PEV charging isassumed to be controllable, and the optimal charging is to befound by the optimization in Section III-A.2) Generation Costs: The price of electricity generation,
shown in Fig. 5, is acquired from the Oak Ridge CompetitiveElectricity Dispatch Model [36]. The reserve scheduling costis assumed to be 3% more expensive than the generation pricebased on the statistics in [37], and the reserve dispatch cost isassumed to be the same as the generation price and only occursif the reserve is dispatched.3) Grid Frequency Dynamics: The frequency of the AC elec-
tricity deviates from the nominal 60 Hz when there is mismatch
Fig. 5. Price of electricity generation. This curve increases in a staircasefashion because the dispatch of power plants is discrete and the price jumpsonce an additional power plant is switched on.
Fig. 6. Model of the grid frequency dynamics.
between the load and generation. The grid frequency dynamicsis approximated by the rotational dynamics shown in (5), andits model structure is depicted in Fig. 6:
(5)
where is the system inertia, and is the nominal frequency.is the grid load, and are the electricity gener-
ation and reserve. The last term, , is frequency dependent tocapture the phenomenon that rotary loads, such as motors, slowdown and consume less electricity when the grid frequency de-creases, which is modeled as (6):
(6)
where is an empirical constant suggested in [38].Equation (7) and (8) describe the dynamics of and
. Both are first-order dynamics, but with different timeconstants and implications:
(7)
(8)
where and are time constants, is the nominalgrid load, and are controller gains. and are chosen toresemble the ramp rate limits in each type of generation [38],and and , are chosen to match typical frequency deviationson state-wide grids [39].

1116 IEEE TRANSACTIONS ON POWER SYSTEMS, VOL. 28, NO. 2, MAY 2013
Fig. 7. New model of the grid frequency dynamics with controllers for windpower scheduling and PEV charging included.
Fig. 8. Objectives and time scales of the hierarchical controller.
III. HIERARCHICAL CONTROLLER
A hierarchical controller is designed to incorporate the PEVcharging andwind power into the electricity grid. The grid struc-ture is changed from Figs. 6 and 7. The controller consists ofthree levels, and wind power stochastic is included into the top-level controller (marked as the green light bulb), and the PEVcharging is handled by the middle-level ( and ) and bottom-level controllers ( and ). The objectives and time stepresolutions of each controller are summarized in Fig. 8.
A. Top-Level Controller: Scheduling Optimization
An optimization problem is formulated to find the optimalscheduling of the electricity generation and wind power to sat-isfy the grid load and PEV charging demand at minimum cost.The optimization problem is stated in (9)–(19). Equation (9) isthe objective function, including costs of electricity generation
, reserve scheduling , and expected reservedispatch . The rewards to PEVs for supporting re-serves, if considered, can also be included into the objectivefunction; however, such remuneration is not considered in thiswork. The two controlling variables, and , are the elec-tricity generation and the scheduling of wind power
. The state, , is the remaining PEV energy demand. Its dy-namics and constraints are detailed as follows:
(9)
subject to
(10)
(11)
(12)
(13)
(14)
(15)
(16)
(17)
(18)
(19)
where
aggregated PEV charging load (MW);
charging limit (MW);
total PEV energy demand (MWh);
reserve requirement for grid load (MW);
reserve requirement for wind power (MW);
scheduling of conventional reserve (MW);
expected shortfall of wind power (MW);
expected dispatch of conventional reserve (MW).
Equations (10)–(14) are constraints related to the electricitygeneration: (10) states the balance of supply and demand (i.e.,scheduled generation and loads); (11) ensures that the total PEVcharging demand is satisfied; (12) states the lower and upperbound on PEV charging power due to the Level-I charger limit;(13) describes the state dynamics; and (14) is the constraint forthe initial state.Equations (15)–(19) are related to the reserve scheduling and
dispatch: (15) states the reserve requirement for the grid load,which is 5% of the nominal load magnitude according to [21];(16) states the reserve requirement for wind power accordingto (3); (17) states that the total reserve requirement must bemet by either the controllable PEV load or the scheduling ofconventional reserve; (18) states the expected shortfall of windpower; and (19) states the expected dispatch of conventionalreserve if wind shortfall exceeds the magnitude of the control-lable PEV load . Notice that (17) counts the PEV load as reservebecause it can be throttled back and forth by the bottom-levelcontrollers (to be explained in Section III-C). Finally, (19) im-plies that throttling back PEV load is preferred to dispatchingthe conventional reserve because the former is free.In addition, several implicit influences of in the optimiza-
tion problem are worth mentioning. Increasing can reducethe energy generation [ in (10)], but it also increases the re-serve required for wind power [ in (16)] and the expectedshortfall [ in (18)]. Consequently, the scheduling and ex-pected dispatch of conventional reserve may rise [ in (17) and
in (19)] if they exceed the range that the controllable PEVload can cover. These coupling constraints are the main reasonswhy this optimization problem is non-intuitive.

LI et al.: SYNERGISTIC CONTROL OF PLUG-IN VEHICLE CHARGING AND WIND POWER SCHEDULING 1117
Fig. 9. Optimal scheduling results for the nominal case.
The scheduling optimization is solved assuming that knowl-edge about generation prices (Fig. 5), the nominal grid load (thedash line in Fig. 4), and wind forecasts (the grey line in Fig. 2)are known. However, the actual grid load and actual wind outputare not known. The time horizon of the optimization is 11 PMto 8 AM, which are denoted as Hours 23–32 in several fol-lowing figures. This time horizon is chosen because we focuson night charging. A longer horizon is unnecessary because thesolution seeks valley-filling due to the lower prices in eveninghours. This evening-hour focus does not imply that we “pro-hibit” day-time charging, a function that may be desirable toPEVs with long trips. Daytime charging will be treated as con-ventional (uncontrollable) grid load.The dynamic programming technique is used to solve this
optimization problem, and Fig. 9 shows the optimal controls forthe nominal case. The four arrows marked at Hour 26 illustratethat the constraint for the balance of supply and demand, (10),has been satisfied. The difference between the total generation
and the nominal load is used for PEV charging.Several properties in the optimal solution are observed:1) A noticeable amount of PEV charging is saved for the lasthour, so that there are enough PEVs available as reserve,which helps to reduce the cost associated with conven-tional reserve scheduling and dispatch.
2) The scheduling of the electricity generation, , generallytakes advantages of the staircase kinks in the energy priceby using as much low-price generation as possible. Thisphenomenon can be seen in Fig. 9 where the generationsbelow $28.0/MWh were fully used all the time. This istrue except for the last hour, due to the wind power reservefactor stated above.
3) Due to the fact there is no penalty on early or late PEVcharging as long as it happens during the designatedhorizon, this optimization problem may have multiplesolutions. For, example, exchanging orwith will not alter the cost optimality.
The optimal control, , will replace the tracking reference,, in (7), and this new tracking reference is denoted as, in Fig. 7. Furthermore, both and will affect the
feed forward component in the middle-level controller for PEVcharging.
B. Middle-Level Controller: Load Following
The middle-level controller plans the charging of the wholePEV fleet so that the sum of the PEV load and grid load
Fig. 10. Charging power allocation rule. This decreasing function is imple-mented on each smart charger locally, which maps low SOC to a high chargingpower and vice versa.
matches the generation scheduled by the top-level controller.The middle-level controller consists of two elements: the cen-tralized broadcast (denoted as in Fig. 7) and the chargingpower allocation rule ( in Fig. 7). The former is done by thegrid operator, and the latter is implemented by individual smartchargers. This decentralized arrangement allows this scheme tobe applied to an indefinite number of PEVs.1) Centralized Broadcast: This element is the feed forward
component for PEV charging, in which an SOC threshold,, is derived [see (20)–(21)], and the grid operator
broadcasts it to smart chargers to coordinate the charging overthe whole PEV fleet:
(20)
(21)
Equation (20) is an updated version of (10) and states the ref-erence of the PEV charging, , which is essentially the sched-uled PEV load. Equation (21) converts to by invertingthe downstream of the system, i.e., the charging power alloca-tion rule, (detailed in the next section). More specifically, oneway to compute numerically is to search through all possiblevalues of to find out the accumulated PEV load at eachtime step, and the particular that produces the accumu-lated PEV exactly the same as will be the control input chosento be fed to .Equations (20) and (21) are computed offline since all needed
information can be acquired a priori. It should be pointed outthat the grid operator does not need information from every PEVto compute (20)–(21). Only the total number of PEVs, batterycapacity, and the three distributions shown in Fig. 1 are required.Furthermore, these parameter/distributions need not be very ac-curate because the feedback actions can accommodate for theuncertainties.2) Charging Power Allocation Rule: The idea of the alloca-
tion is based on observations from the optimal PEV chargingin [40]: allot higher power to vehicles with low SOC and earlyplug-off time. The low/high SOC level is relative tobroadcasted by the grid operator, and the earliness of plug-offtime is relative to the end of time horizon in the scheduling op-timization, i.e., Hour 32.The charging power is determined by the hyperbolic tangent
curve shown in Fig. 10, which maps low SOC to high chargingpower and vice versa. In addition, this curve is symmetric to
and will shift to the right if rises.serves as the tuning knob to the grid operator for commandingthe charging of all PEVs. In addition, despite of the fact all PEVs

1118 IEEE TRANSACTIONS ON POWER SYSTEMS, VOL. 28, NO. 2, MAY 2013
are assumed to have the same battery capacity in this paper,the hyperbolic tangent curve can handle the scenario of PEVshaving different battery capacities. The curve has sharp slopearound , and if a PEV with a large battery is inade-quately charged, its charging power will quickly ramp up. Fur-thermore, the scaling factor, SF, defined in (22) allows PEVsthat unplug early to charge at a higher power. For example,a vehicle with the plug-off time at Hour 30.5 (6:30 AM) willhave SF equals 1.2, i.e., its charging power will be scaled upby 20%. Since it is assumed that the grid operator is capableof deriving the SOC distribution, the amount of additional PEVload due to early plug-off can also be computed and incorpo-rated into the computation for the Centralized Broadcast (i.e.,derive ):
Plug-Off Time(22)
To further elaborate the power alslocation rule, the curve inFig. 10 does not possess optimality under any criterion. In fact,any decreasing curve may do the job, although a smooth curveis preferable for designing the feedback gains in Section III-C.Similarly, the scaling factor can have other forms, for example,a squared term can further favor vehicles with early plug-offtimes; nevertheless, the current choice in (22) was foundsufficient.
C. Bottom-Level Controller: Grid Frequency Regulation
The bottom-level controller, denoted as and inFig. 7, is a feedback control, which is designed to mimic thefeedback PI-controller in the original grid in Fig. 6. This con-troller uses the grid frequency deviation as the feedback cue toalter the centralized broadcast signal, , so that the PEVcharging will temporally speed up or slow down. Furthermore,this controller will be implemented on individual PEVs locally,meaning that the feedback control will continue to regulate thegrid frequency even if the (centralized) reference signal is de-layed or interrupted.The challenge of designing the feedback gains, and, lies in the fact that the chosen curve in Fig. 10 makes
the input/output relation of nonlinear; so, andmust be designed for robust performance under varying plantsensitivity. Indeed, and are designed based on thesensitivity analysis.1) Feedback Gains for PEV Charging: The PI-controller
gains, and , in Fig. 6 provide the inspiration to deriveand for PEV charging.The PI-controller gains, and , in Fig. 6 can be found by
existing approaches, such as pole placement or root locus tech-nique; furthermore, the proportional gain, , has the physicalmeaning as the inverse of frequency sensitivity to the regula-tion power, shown in (23):
(23)
In the proposed concept of controlling PEV charging toregulate the grid frequency, the proportional gain needsto embody the physical meaning as the inverse of frequency
Fig. 11. All possible values of in the time window of generationscheduling.
Fig. 12. Sensitivity of to , , at Hour 28.
sensitivity to the SOC threshold broadcast, which can be donethrough dividing by the sensitivity of to , , asshown in (24) and (25), where can be numerically computed(illustrated in the next section). The integral gain, , can befound in the same way, as shown in (26):
(24)
(25)
(26)
In fact, is the linearization of , and (25) and (26) ensurethat both systems in Figs. 6 and 7 have the same closed-looppoles. Furthermore, due to the much faster response in PEVcharging than conventional reserves, it is possible to achievebetter performance in frequency regulation by choosing fasterclosed-loop poles when designing and .2) Sensitivity of PEV Load: Figs. 11 and 12 explain how to
compute numerically. Fig. 11 is obtained by offline computa-tion, which uses the distributions of the plug-in time, plug-offtime, and derived in Section II-A to find all possible
values by searching through every level in Hours23–32. Fig. 12 is then extracted from Fig. 11 at a specific time(Hour 28), and the slope of the extracted curve is to be usedin (25) and (26).Due to the fact that changes over time, the feedback gainsand are not constant. A simplified constant gain con-
troller is further derived by using the largest value of in (25)and (26), which is easier to implement. It has been confirmed inthe previous study [19] that, on the Nyquist plot, the simplifiedconstant-gain design still possesses a large stability radius forthe system in Fig. 7.

LI et al.: SYNERGISTIC CONTROL OF PLUG-IN VEHICLE CHARGING AND WIND POWER SCHEDULING 1119
TABLE ISIMULATION CASES
Fig. 13. Generation dispatch from conventional sources. The oscillations inCases A and B are due to fluctuations in the grid load and wind power. Case Cthrottles the PEV charging so that the generation can closely follow the optimalscheduling in Fig. 9.
IV. SIMULATIONS
Three cases, with different penetration levels of PEV andwind power and different degrees of control integration, are sim-ulated to demonstrate the effectiveness of the three-level con-troller. These three cases are summarized in Table I. Case Aserves as the reference with unmitigated PEV charging. Cases Band C both have 25% PEVs in the transportation sector and 10%wind power in the electricity generation mix; however, Case Bhas only the top and middle-level controller implemented butnot the bottom level, and the conventional reserve is still neededfor frequency regulation, whereas Case C has all three levels ofcontrollers and no conventional reserve.1
All three cases have the same percentage of PEVs fullycharged, 99.5%, but their performances in generation dispatch,frequency regulation, and costs are different.Fig. 13 shows the actual dispatch, including both the elec-
tricity generation and reserve from conventional sources. CaseA has substantial generation increase before Hours 23 becausePEVs start charging in early evenings, while Cases B and C havethe PEV load properly confined within Hours 23–32. However,Case B does not achieve the maximum benefit because fluctua-tions in the grid load and wind power demand dispatching con-ventional reserves. Case C has feedbacks to throttle the PEVcharging and the generation closely follows the optimal sched-uling , except the beginning of Hours 23, 30 and 32 whenhas large changes and the slow time constant limits the
ramping of the electricity generation.Fig. 14 highlights the frequency regulation results. Cases
A and B both use the conventional reserve and have similar
1In Case C, the conventional reserve is switched off except the latter half hourin Hour 32, when most PEVs are fully charged and unavailable for providinggrid frequency regulation. The simulation detects the frequency deviation beinglarger than 1 Hz (see Fig. 14), and it then switches the conventional reserve backon.
Fig. 14. Grid frequency regulation. Case C outperforms Cases A and Bmost ofthe time because controlling PEV charging has faster response than dispatchingconventional reserves.
Fig. 15. Total electricity generation costs of various degrees of controlintegration.
frequency deviations, whereas the grid frequency in Case C isregulated by controlling the PEV charging and hasmuch smallerdeviation most of the time. However, the performance in CaseC deteriorates at both ends of the valley hour; Hour 23 is dueto the singularity of at that particular time (the input/outputrelation is close to zero), and Hour 32 is because most PEVs arefully charged.Fig. 15 shows total generation costs of the three simulation
cases. Each case two cost components, one for the energy andthe other for the reserve. Case A has energy cost for serving thegrid load and the uncontrolled PEV charging and reserve cost forcovering fluctuations in the grid load. Case B, due to the utiliza-tion of wind power, has smaller energy cost but larger reservecost. In fact, the cost reduction in energy is almost cancelled bythe increase in reserve. Case C has energy cost similar to CaseB because of using wind power and has a very low reserve costbecause the controlled PEV charging eliminates the use of con-ventional reserves for most of the time. Notice that the cost inCase C is based on the assumption that it is free to control PEVcharging to support reserves and no rewards are given to PEVowners. Hence, Case C can be interpreted as a lower bound forthe system operation costs with PEVs. If compensation is paidto PEV owners for providing reserves, the compensation shouldnot be more than the cost difference between Case B and CaseC, else it will be more economical to use conventional genera-tors as reserves.To further illustrate the value of the synergy between PEV
and wind power, Fig. 16 shows the cost difference between CaseC and B at various penetration levels of PEV and wind powerwith the proposed hierarchical controller implemented. Severalmarkers of PEV and renewable energy targets [15], [41], [42]are also shown in the figure. The cost difference is normalized

1120 IEEE TRANSACTIONS ON POWER SYSTEMS, VOL. 28, NO. 2, MAY 2013
Fig. 16. Cost difference between Case C and B (normalized). Significant costreduction is achieved when the PEV fleet and wind power grow together.
to the cost of Case B. This figure shows that the cost reductionmerely exists when only one of the two green technologies ispresent on the grid, but the cost can reach a remarkable 20%reduction when both technologies are at high penetrations andthe synergy fully utilized.
V. CONCLUSION
This paper proposes a three-level controller to realize thesynergy between the controllable PEV charging and the inter-mittent renewable wind energy: the top-level controller mini-mizes the generation cost and finds scheduling of (non-renew-able) generation and wind power; the middle-level controllerallots charging power to individual PEVs based on their bat-tery SOC and plug-off time to achieve load following; and, thebottom-level controller uses feedbacks to control PEV chargingin real time to regulate the grid frequency. The effectiveness ofthis controller is validated by simulations on a state-wide gridmode based on realistic data inMichigan.Major results are sum-marized as follows:1) The proposed control algorithm is implementable.The algorithm comprehensively considers major griddynamics at various time scales, including the hourlyscheduling, sub-hour PEV charging scheduling, andreal-time grid frequency regulation, and it is designed tohave enough instruments to handle the real world uncer-tainties. Furthermore, the algorithm consists of an explicitPEV charging rule (the hyperbolic tangent curve) that issimple enough to be programmed on smart chargers.
2) Most PEVs are fully charged.99.5% of PEVs are fully charged even though the PEV fleetis used to regulate grid frequency, meaning that the idlegeneration capacity in evenings can accommodate quitemany PEVs if the charging is well controlled.
3) Grid frequency regulation is improved.The response of controlling PEV charging is much fasterthan dispatching conventional reserves, which enables themuch improved frequency regulation.
4) The synergy achieves substantial cost reduction.To the authors’ best knowledge, the proposed control al-gorithm is one of the earliest in the literature that realizes
the synergy of PEV and wind power. Furthermore, the sig-nificant cost reduction in Figs. 15 and 16 indicates that thePEV fleet and renewable power should grow together torealize their full benefits.
This paper demonstrated the value of fully explore the syn-ergy between PEV and wind power. The control concept is notlimited to wind power and can be extended to other intermit-tent renewable sources. Some open questions remain to be an-swered. A key requirement is to make the controller adaptive tohandle the non-zero mean forecast error in wind power, whichmay hurt the PEV charging completion in the situation of windunder-production.
REFERENCES[1] W. Kempton and J. Tomic, “Vehicle-to-Grid power fundamentals: Cal-
culating capacity and net revenue,” J. Power Sources, vol. 144, pp.268–279, 2005.
[2] W. Kempton and J. Tomic, “Vehicle-to-Grid power implementation:From stabilizing the grid to supporting large-scale renewable energy,”J. Power Sources, vol. 144, pp. 280–294, 2005.
[3] S. Hadley and A. Tsvetkova, “Potential impacts of plug-in hybrid elec-tric vehicles on regional power generation,” Electr. J., vol. 22, pp.56–68, 2009.
[4] M. Kintner-Meyer, K. Schneider, and R. Pratt, Impacts Assessment ofPlug-In Hybrid Vehicles on Electric Utilities and Regional U.S. PowerGrids Part 1: Technical Analysis, Pacific Northwest National Labora-tory, 2007.
[5] T. Ibaraki and N. Katoh, Resource Allocation Problems: AlgorithmicApproaches. Cambridge, MA: MIT Press, 1988.
[6] W. Burke and D. Auslander, “Residential electricity auction with uni-form pricing and cost constraints,” in Proc. North American PowerSymp., Starkville, MS, 2009, pp. 1–6.
[7] R. Maheswaran and T. Basar, “Decentralized network resource alloca-tion as a repeated noncooperative market game,” in Proc. 40th IEEEConf. Decision and Control, Orlando, FL, 2001, pp. 4565–4570.
[8] M. Pinedo, Scheduling: Theory, Algorithms, and Systems, 3rd ed.New York: Springer, 2008.
[9] I. Vermeulen, S. Bohte, S. Elkhuizen, H. Lameris, P. Bakker, and J.Poutré, “Adaptive resource allocation for efficient patient scheduling,”Artif. Intell. Med., vol. 46, pp. 67–80, 2009.
[10] M. Carter and S. Lapierre, “Scheduling emergency room physicians,”Health Care Manage. Sci., vol. 4, pp. 347–360, 2001.
[11] M. Rossetti, G. Trzcinski, and S. Syverud, “Emergency departmentsimulation and determination of optimal attending physician staffingschedules,” in Proc. 31st Winter Simulation Conf., Phoenix, AZ, 1999,pp. 1532–1540.
[12] D. Callaway and I. Hiskens, “Achieving controllability of electricloads,” Proc. IEEE, vol. 99, pp. 184–199, 2011.
[13] The Detroit Edison Company, Rate Book for Electric Service, Report,2011.
[14] Southern California Edison. Rate Information—Residential RatesElectric Vehicles, 2011. [Online]. Available: http://www.sce.com/Cus-tomerService/rates/residential/electric-vehicles.htm.
[15] Environmental Assessment of Plug-In Hybrid Electric Vehicles,Volume 1: Nationwide Greenhouse Gas Emissions, Electric PowerResearch Institute (EPRI), 2007, #1015325.
[16] D. Lemoine, D. Kammen, and A. Farrell, “An innovation and policyagenda for commercially competitive plug-in hybrid electric vehicles,”Environ. Res. Lett., vol. 3, pp. 14003–14013, 2008.
[17] M. Galus and G. Andersson, “Demand management of grid connectedplug-in hybrid electric vehicles (PHEV),” in Proc. IEEE Energy 2030Conf., Atlanta, GA, 2008, pp. 1–8.
[18] S. Han, S. Han, and K. Sezaki, “Development of an optimal vehicle-to-Grid aggregator for frequency regulation,” IEEE Trans. Smart Grid,vol. 1, pp. 65–72, 2010.
[19] C.-T Li, C. Ahn, H. Peng, and J. Sun, “Decentralized charging ofplug-in electric vehicles,” in Proc. Dynamic System and Control Conf.,Arlington, VA, 2011.
[20] W. Katzenstein and J. Apt, The Cost of Wind Power Variability,Carnegie Mellon Electricity Industry Center, 2010, #CEIC-10-05.
[21] R. Doherty and M. O’Malley, “A new approach to quantify reserve de-mand in systems with significant installed wind capacity,” IEEE Trans.Power Syst., vol. 20, pp. 587–595, 2005.

LI et al.: SYNERGISTIC CONTROL OF PLUG-IN VEHICLE CHARGING AND WIND POWER SCHEDULING 1121
[22] R. Wiser and M. Bolinger, 2009 Wind Technologies Market Report,Department of Energy, 2010, #DOE/GO-102010-3107.
[23] G. Giebel, R. Brownsword, G. Kariniotakis, M. Denhard, and C. Draxl,The State-of-the-Art in Short-Term Prediction of Wind Power-A Liter-ature Overview, Risø National Laboratory, Report, 2011, 2nd edition.
[24] J. Hetzer, D. Yu, and K. Bhattarai, “An economic dispatch model in-corporating wind power,” IEEE Trans. Energy Convers., vol. 23, pp.603–611, 2008.
[25] F. Bouffard and F. Galiana, “Stochastic security for operations plan-ning with significant wind power generation,” IEEE Trans. PowerSyst., vol. 23, pp. 306–316, 2008.
[26] J. Matevosyan and L. Söder, “Minimization of imbalance cost tradingwind power on the short-term power market,” IEEE Trans. Power Syst.,vol. 21, pp. 1396–1404, 2006.
[27] P. Pinson, C. Chevallier, and G. Kariniotakis, “Trading wind gener-ation from short-term probabilistic forecasts of wind power,” IEEETrans. Power Syst., vol. 22, pp. 1148–1156, 2007.
[28] E. Bitar, A. Giani, R. Rajagopal, D. Varagnolo, P. Khargonekar, K.Poolla, and P. Varaiya, “Optimal contracts for wind power producersin electricity markets,” in Proc. 49th IEEE Conf. Decision and Control,Atlanta, GA, 2010, pp. 1919–1926.
[29] V. Miranda and P. Hang, “Economic dispatch model with fuzzy windconstraints and attitudes of dispatchers,” IEEE Trans. Power Syst., vol.20, pp. 2143–2145, 2005.
[30] C.-T. Li, C. Ahn, H. Peng, and J. Sun, “Integration of plug-in elec-tric vehicle charging and wind energy scheduling on electricity grid,”in Proc. IEEE PES Conf. Innovative Smart Grid Technologies (ISGT2012), Arlington, VA, 2012.
[31] T.-K. Lee, Z. Baraket, T. Gordon, and Z. Filipi, “Stochastic modelingfor studies of real-world PHEV usage: driving schedules and daily tem-poral distributions,” IEEE Trans. Veh. Technol., accepted for publica-tion.
[32] GM-Volt Website, Latest Chevy Volt Battery Pack and GeneratorDetails and Clarifications, 2007. [Online]. Available: http://gm-volt.com/2007/08/29/latest-chevy-volt-battery-pack-and-generator-de-tails-and-clarifications/.
[33] SAE Electric Vehicle Conductive Charge Coupler, SAE StandardJ1772, 2001.
[34] National Renewable Energy Laboratory (NREL), Eastern WindDataset, 2010. [Online]. Available: http://www.nrel.gov/wind/integra-tiondatasets/eastern/methodology.html.
[35] H. Daneshi and A. Daneshi, “Real time load forecast in power system,”in Proc. 3rd Int. Conf. Electric Utility Deregulation and Restructuringand Power Technologies, Nanjing, China, 2008, pp. 689–695.
[36] S. Hadley, The Oak Ridge Competitive Electricity Dispatch (ORCED)Model, Oak Ridge National Laboratory, 2008, #ORNL/TM-2007/230.
[37] Potomac Economics, 2010 State of the Market Report for the MISOElectricity Markets, 2011.
[38] P. Kundur, N. J. Balu, and M. G. Lauby, Power System Stability andControl. New York: McGraw-Hill, 1994.
[39] J. Short, D. Infield, and L. Freris, “Stabilization of grid frequencythrough dynamic demand control,” IEEE Trans. Power Syst., vol. 22,pp. 1284–1293, 2007.
[40] C. Ahn, C.-T Li, and H. Peng, “Optimal decentralized charging controlalgorithm for electrified vehicles connected to smart grid,” J. PowerSources, vol. 196, pp. 10369–10379, 2011.
[41] T. Becker, I. Sidhu, and B. Tenderich, Electric Vehicles in the UnitedStates a New Model with Forecasts to 2030, Center for Entrepreneur-ship & Technology, University of California, Berkeley, 2009.
[42] Database of State Incentives for Renewables & Efficiency, 2010. [On-line]. Available: http://www.dsireusa.org.
Chiao-Ting Li (M’12) is pursuing the Ph.D. degree in the Department of Me-chanical Engineering, University of Michigan, Ann Arbor.
Changsun Ahn is a Postdoctoral Researcher in the Department of MechanicalEngineering, University of Michigan, Ann Arbor.
Huei Peng is a Professor in the Department of Mechanical Engineering, Uni-versity of Michigan, Ann Arbor.
Jing Sun (F’04) is a Professor in the Department of Naval Architecture andMarine Engineering, University of Michigan, Ann Arbor.