Embed Size (px)
Citation preview

IES Practice Guide - Response to Intervention in Mathematics
A Focus on Assessment
IES Practice Guide - Response to Intervention in Mathematics
A Focus on Assessment
Ben Clarke, Ph.D.Research Associate, Pacific Institutes of Research and Instructional Research Group

Assisting Students Struggling with Mathematics: Response to Intervention for Elementary and Middle Schools
The report is available on the IES website:
http://ies.ed.gov/ncee &http://ies.ed.gov/ncee/wwc/publications/
practiceguides/

Panelists
Russell Gersten (Chair)Sybilla BeckmanBen ClarkeAnne FoegenLaurel MarshJon R. StarBradley Witzel

Structure of the Practice GuideRecommendationsLevels of EvidenceHow to carry out the recommendationsPotential Roadblocks & Suggestions

Evidence Rating
Each recommendation receives a rating based on the strength of the research evidence. Strong Moderate Low

Recommendation Level of Scientific Evidence
1. Universal screening (Tier I) Moderate
2. Focus instruction on whole number for grades k-5 and rational number for grades 6-8
Low
3. Systematic instruction Strong
4. Solving word problems Strong
5. Visual representations Moderate
6. Building fluency with basic arithmetic facts
Moderate
7. Progress monitoring Low
8. Use of motivational strategies Low

Recommendation 1
Screen all students to identify those at risk for potential mathematics difficulties and provide interventions to students identified as at risk.
Level of Evidence: Moderate

What is Assessment?
Def: Assessment is the collection of data to make decisions.
(Salvia & Ysseldyke, 1997)
Assessment is useless if we don’t use it to guide our actions.

Assessment for Different Purposes
An effective, comprehensive mathematics assessment program includes assessments for four purposes:
Outcome
Screening
Progress Monitoring
Diagnostic

Outcome Assessment
Purpose: To determine level of proficiency in
relation to norm or criterion.
When: Typically administered at end of year. Can
be administered pre/post to assess overall growth.
Who: All students
Relation to instruction: Provides index of overall
efficacy but limited timely instructional information.

Screening Assessment Purpose: To determine children who are likely to require
additional instructional support (predictive validity).
When: Early in the academic year or when new students enter
school. May be repeated in the Winter and Spring.
Who: All students
Relation to instruction: Most valuable when used to identify
children who may need further assessment or additional
instructional support.

Progress Monitoring Assessment
Purpose: Frequent, timely measures to determine
whether students are learning enough of critical
skills.
When: Weekly or Monthly
Who: At-risk students
Relation to Instruction: Indicates student response
to instruction.

Diagnostic Assessment
Purpose: To provide specific information on skills and strategy needs of individual students.
When: Following screening or at points during the year when students are not making adequate progress.
Who: Selected students as indicated by screening or progress monitoring measures or teacher judgment.
Relation to Instruction: Provided specific information on target skills; highly relevant.

Coherent Assessment Systems
Each type of assessment has a purpose
The design of the tool should match the purpose What are the implications for screening tools
used with all students?
Think purpose not tool
How do each of these purposes fit together?

Does your school collect data to make decisions or to collect data?Common pitfalls
Focus is on procedure
Data collected don’t match purpose for collecting data (e.g. collecting diagnostic data on all students)
Layering of data sources
Different data for different programs (e.g. Title 1)
Activity: Do your current assessments function as a whole?
Talk with a colleague about how the four types of assessments work in one system at your school/district.
Does each assessment tool match the purpose it is used for?
Does the system link together in a logical manner?

Recommendation 1
Screen all students to identify those at risk for potential mathematics difficulties and provide interventions to students identified as at risk.
Level of Evidence: Moderate

Technical Evidence Correlational design studies
Greater evidence in the earlier grades
Reliability typically included inter-tester, internal consistency, test-retest, and alternate formMost fall between r=.8 to .9
Validity primarily focused on criterion related with an emphasis on predictive validityMost fall between r=.5 to .7
Measures are beginning to report on sensitivity and specificity

ContentContent of Measures
Single aspect of number sense (e.g. strategic counting) – most common in earlier grades
Or Broad measures incorporating multiple aspects of numberSome measures are combination scores from multiple
single aspect measures
Measures reflecting the computation and concepts and applications objectives for a specific grade level – most common later gradesOften referred to as CBM or General Outcome

ContentPromising measures include
Word problemsPre-algebra and algebra skillsBased on state standards or
NCTM/NMAP benchmarks

Features Short duration measures (1 minute fluency measures)
Note many measures that are short duration also used in progress monitoring.
Longer duration measures (untimed up to 20 minutes) often examine multiple aspects of number sense Issue of purpose is critical to examine
Most research examines predictive validity from Fall to Spring.

Examples: Single aspect number sense
Example: Magnitude comparison
Example: Strategic counting
12 3 4 1 5 11 9 4
__ 13 14 6 __ 8 3 4 __

VanDerheyden: K-CBM

Example: Multiple aspects number sense
Number Knowledge Test Level 1
If you had 4 chocolates and someone gave you 3 more, how many chocolates would you have?
Which is bigger: 5 or 4?
Level 3What number comes 9 after 999?Which difference is smaller: the difference
between 48 and 36 or the difference between 84 and 73?

2nd grade and above: Examples
Number combinations
Word problems
Grade level computation objectives
Grade level concepts and applications
Measures tied to NMAP Focal Points

26
General Outcome: Computation objectives
For students in grades 1–6. Student is presented with 25
computation problems representing the year-long, grade-level math curriculum.
Student works for set amount of time (time limit varies for each grade).
Teacher grades test after student finishes.


28
General Outcome: Concepts and Applications
For students in grades 2–6. Student is presented with 18–25
Concepts and Applications problems representing the year-long grade-level math curriculum.
Student works for set amount of time (time limit varies by grade).
Teacher grades test after student finishes.


Example: Reflecting critical math content
easy-CBM
Items created according to NCTM Focal Points for grade level
48 items for screening (16 per focal point)
Ongoing research (not reviewed in practice guide)

easy-CBM: Number and Operations

Middle School
Algebra measures Designed by Foegen and colleagues
assess pre-algebra and basic algebra skills. Administered and scored similar to Math-CBM
Math CBM Computation and Concepts and Applications Concepts and Applications showed
greater valdity in 6th, 7th, and 8th grade

Basic Skills (in Algebra)
60 items; 5 minutesProblems include:
Solving basic fact equations; Applying the distributive property; Working with integers; Combining like terms; Simplifying expressions; Applying proportional reasoning
Scoring: # of problems correct

Algebra Probe A-31 Page 1
Solve: 9 + a = 15 a =
Solve: 10 – 6 = g g =
Evaluate: 12 + (– 8) + 3
Simplify: 9 – 4d + 2 + 7d
Simplify: 2x + 4 + 3x + 5
Simplify: 5(b – 3) – b
Solve: 12 – e = 4 e =
Solve: q • 5 = 30 q =
Simplify: 4(3 + s) – 7
Evaluate: 8 – (– 6) – 4
Simplify: b + b + 2b
Simplify: 2 + w(w – 5)
Solve: 18126=b
b =
Solv :e 1 foot =12 inches 5 feet = ____ inches
Simplify: 7 – 3( f – 2)
Simplify: 4 – 7b + 5(b – 1)
Evaluate: – 5 + (– 4) – 1
Simplify: s + 2s – 4s
Solv :e 63 ÷ c= 9 c =
Solv :e x + 4 = 7 x =
Simplify: 2(s – 1) + 4 + 5s
Simplify: – 5( + q 3) + 9
Simplify: 8m – 9(m + 2)
Evaluate: 9 + (– 3) – 8
Basic Pre-algebra skills

Algebra Foundations
42 items (50 points); 5 minutesProblems represent five core concepts/skills
essential to conceptual understanding in algebra Writing and evaluating variables and expressions Computing expression (integers, exponents, and order
of operations) Graphing expressions and linear equations Solving 1-step equations and simplifying expressions Identifying and extending patterns in data tables
Scoring: # of problems correct

Algebra Foundations (B)Algebra Probe B-1 Page 1
What is the slope? What is the y intercept?
Fill in the empty box: s 3s 6 18 7 21 8 9 27
Fill in the empty box: n 4n+7 1 11 2 15 3 4 23
Fill in the empty box: b 5 2 3 0 0 -3 -2 -5
What is the slope? What is the y intercept?
If y > 9, twopossible values f ory ____are _ an d_____
6 • 4 + 1 = ________
Simplify: 7f + (2f + f)
:Solve n + 3 = 8 n = ________
Evaluate4b + 2 when
b = 1 ________ and when
b = 3 ________
Write the expression for t his
:phrase 6 less than anumber
(-2) • (-4) = ________
Graphthe expression m > 6
Write a wor d phrase fort his
:expression n + 9
8 ÷ 2 + 4 • 3 = ________
23 = ________
Write the expression for thisp :hrase
9 times a number
-8 -6 -4 -2 0 2 4 6 8

Suggestions Have a building level team select measures
based on critical criteria such as reliability, validity and efficiency.
Select screening measures based on the content they cover with a emphasis on critical instructional objectives for each grade level.
In grades 4-8, use screening measures in combination with state testing data.
Use the same screening tool across a district to enable analyzing results across schools.

Suggestions
Have a building level team select measures based on critical criteria such as reliability, validity and efficiency.
Team should have measurement expertise (e.g. school psychologist) and mathematics (e.g. math specialist)
Set up a screening to occur twice a year (Fall and Winter)
Be aware of students who fall near the cut scores

Suggestions
Select screening measures based on the content they cover with a emphasis on critical instructional objectives for each grade level.
Lower elementary: Whole Number Upper elementary: Rational Number Across grades: Computational Fluency
(hallmark of MLD)

Suggestions
In grades 4-8, use screening measures in combination with state testing data.
Use state testing data from the previous year as the first cut in a screening system.
Can then use a screening measure with a reduced pool of students or a more diagnostic measure linked to the intervention program for a second cut.

Suggestions
Use the same screening tool across a district to enable analyzing results across schools
Districts may use results to determine the effectiveness of district initiatives.
May also be used to determine systematic areas of weakness and provide support in that area (e.g. fractions)

RoadblocksResistance may be encountered in
allocating time resources to the collection of screening data
Questions may arise about testing students who are “doing fine”.
Screening may identify students as at-risk who do not need services and miss students who do.
Screening may identify large numbers of students who need support beyond the current resources of the school or district.

Roadblocks
Resistance may be encountered in allocating time resources to the collection of screening data.
Suggested Approach: Use data collection teams to streamline the data collection and analysis process.

RoadblocksQuestions may arise about testing
students who are “doing fine”.
Suggested Approach: Screening all students allows the school or district to evaluate the impact of instructional approaches Screening all students creates a
distribution of performance allowing the identification of at-risk students

RoadblocksScreening may identify students as at-
risk who do not need services and miss students who do.
Suggested Approach: Schools should frequently examine the sensitivity and specificity of screening measures to ensure a proper balance and accurate decisions about student risk status.

Sensitivity and SpecificityStudents at-risk
YES NO
Students identified as at-risk
YES True positive (A)
False positive (B)
NO False negative (C)
True negative (D)
Sensitivity: Number of students correctly identified as at-risk or A/(A+C)
Specificity: Number of student correctly identified as not at risk or D/(D+B)

Sensitivity and Specificity
Set your cut score too high and You have good sensitivity (all kids that
need help are identified) but poor specificity (lots of kids who don’t need help are identified)
Set your cut score too low and You have good specificity (most kids who
don’t need help will not be identified as at-risk) but poor sensitivity (you may miss many kids who do need help)

RoadblocksScreening may identify large numbers of
students who need support beyond the current resources of the school or district.
Suggested Approach: Schools and districts should
Allocate resources to the students with the most risk and at critical grade levels
and Implement school wide interventions to all
students in areas of school wide low performance (e.g. Fractions)

Consider Recommendation 2
Instructional materials for students receiving interventions should focus intensely on in-depth treatment of whole numbers in kindergarten through grade 5 and on rational numbers in grades 5 through 8. These materials should be selected by committee.
Level of Evidence: Low

Evidence
Consensus across mathematicians, professional organizations, and research panels Milgram and Wu (2005) covering fewer
topics with greater depth National Council Teachers of
Mathematics (NCTM) and National Mathematics Advisory Panel (NMAP)

SuggestionsFor tier 2 and 3 students in grades k-5,
interventions should focus on the properties of whole number and operations. Some older students would also benefit from this approach.
For tier 2 and 3 students in grades 4-8, interventions should focus on in depth coverage of rational number and advanced topics in whole number (e.g. long division).

Who will screening identify Take 6th grade screening results:
The lowest quarter of students may have very different instructional needs
Some students may have a firm grasp on whole number operations and principles (e.g. understand associative, distributive, and commutative laws) but not yet demonstrate that understanding with rational numbers.
Other students may not understand whole number operations or principles
These groups of students will have very different instructional needs

Activity: What is your current screening process?
What measure(s) do you use?
What works well in your system?
What roadblocks have you encountered?

Recommendation 7
Monitor the progress of students receiving supplemental instruction and other students who are at risk
Level of evidence: Low

Evidence Non-experimental studies demonstrating the
technical adequacy of progress monitoring measures. Reliability and Validity are similar to that
found for screening measures (often the same measure)
Growth has been typically examined by looking at average scores across time
Some evidence of use in instructional decision making and improved student outcomes
Greater evidence in elementary grades

Content and Features
General outcome measures reflecting concepts and computation objectives for the grade level. Some limited evidence for single aspect
measures (i.e. Magnitude comparison)
All are timed and short duration

SuggestionsMonitor the progress of tier 2, tier 3
and borderline tier 1 students at least once a month using grade appropriate general outcome measures.
Use curriculum-embedded assessments in intervention materials Frequency of measures can vary - every
day to once every week.

Suggestions
Monitor the progress of tier 2, tier 3 and borderline tier 1 students at least once a month using grade appropriate general outcome measures.
Same team that worked on screening can also work on progress monitoring
Need to carefully consider capacity to model growth in the context of instructional decision making

SuggestionsUse curriculum-embedded
assessments in intervention materials
Frequency of measures can vary - every day to once every week.
Will provide a more accurate index of whether or not the student is obtaining instructional objectives
Combined with progress monitoring provides a proximal and distal measuue of performance

Roadblocks
Students within classes are at very different levels.
Insufficient time for teachers to implement progress monitoring.

Roadblocks
Students within classes are at very different levels.
Suggested Approach: Group students across classes to create groups with similar needs.

Roadblocks
Insufficient time for teachers to implement progress monitoring.
Suggested Approach: Train paraprofessionals or other school staff to administer progress monitoring measures.

Activity: What is your current progress monitoring process?
What measure(s) do you use?
What works well in your system?
What roadblocks have you encountered?

How to start and Next steps
As you get started consider
Focus on one grade or grade bandsLong term trajectories suggest end of K
critical benchmarkMay have more expertise/comfort with whole
number approach
Screening before progress monitoring
Strategies for collecting data
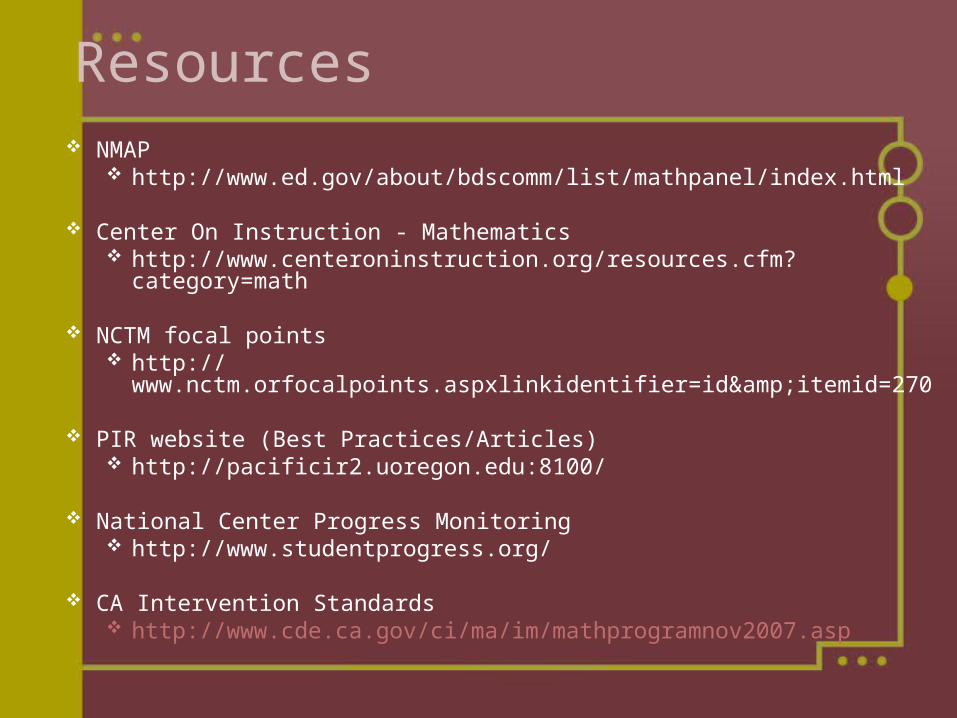
Resources NMAP
http://www.ed.gov/about/bdscomm/list/mathpanel/index.html
Center On Instruction - Mathematics http://www.centeroninstruction.org/resources.cfm?category=math
NCTM focal points http://www.nctm.orfocalpoints.aspxlinkidentifier=id&itemid=270
PIR website (Best Practices/Articles) http://pacificir2.uoregon.edu:8100/
National Center Progress Monitoring http://www.studentprogress.org/
CA Intervention Standards http://www.cde.ca.gov/ci/ma/im/mathprogramnov2007.asp